Pennar Engineered Building Systems Ltd -...
18
Pennar Engineered Building Systems Ltd Building strong structural growth
Transcript of Pennar Engineered Building Systems Ltd -...
Pennar Engineered Building Systems Ltd Building strong structural growth
INSTITUTIONAL EQUITY RESEARCH
Page | 2 | PHILLIPCAPITAL INDIA RESEARCH
Pennar Engineered Building Systems (PEBS IN) Building strong structural growth INDIA | MIDCAP‐ENGINEERING | Initiating Coverage
19 February 2016
Why read this report? • High growth: Over FY15‐18, PEBS revenue/EBITDA/earnings CAGRs will be
20%/33%/36% vs. 32%/28%/40% over FY11‐15. • Leading player: In a short span of five years, it has emerged as the second‐largest
player in the high‐growth pre‐engineered building (PEB) solutions market. • New areas: PEBS is leveraging its strong design capabilities to diversify into different
product segments and for expanding its geographies. • Continuous improvement: Its entry into engineering outsourcing provides high growth
opportunities with attractive margins.
Diversified products and solutions PEBS is a leading player in pre‐engineered products and has diversified into solar structures, structural steel, engineering services, and cold‐form structures. It caters to industrial, commercial, and institutional applications (warehouses, power plants, commercial centres, hi‐rise buildings, aircraft hangers, defence installations, sports stadiums, and low‐cost housing). It is increasing its addressable markets through (1) a pan‐India integrated service delivery model through expansion of sales offices, and (2) planned expansion of its manufacturing facilities to north India (Gujarat, Rajasthan, or Madhya Pradesh).
Strong engineering design capability, strong parent For any PEB player, technology is a critical to differentiate itself – PEBS has established itself on this parameter with (1) timely execution of 1,000+ projects in manufacturing, warehousing, and retail, and (2) its in‐house design and engineering team of ~178, trained to handle complex custom‐designed building structures. PEBS also benefits from its promoter Pennar Industries’ 35 years of experience in manufacturing steel products with 600 customers and five manufacturing plants in Tamil Nadu and Maharashtra.
PEB – a high‐growth market In India, PEB is still in a nascent stage vs. advanced economies (where it is highly favoured due to its lower project costs and lower turnaround time). We estimate the Indian PEB market’s size at ~ Rs 63bn in FY15, with ~14% CAGR over the last few years. The industrial segment (industrial sheds and manufacturing facilities) contributed to 71% of this and commercial (warehouses and retail shops) 19%. We expect demand for warehousing to grow substantially based on India’s growing economy and the development of ecommerce and agri‐warehousing. Investments in metro, aviation, solar, and auto sectors along with new demand from housing and commercial high‐rise buildings are positives for PEBS.
Strong financial performance; capacity addition at marginal capex Over FY11‐15, PEBS’s revenue/EBITDA CAGR was 32%/28% and it upped its capacity to 90,000mtpa from 30,000mtpa. We expect an EBITDA CAGR of 33% over FY15‐18 to touch Rs 1bn in FY18. The company has a high asset turnover (7.3x net assets and 2.5x capital employed), resulting in ~24% ROCE. The business is working‐capital intensive and net working capital is ~45% of total capital employed and 20% of net sales. PEBS has maintained a strong balance sheet with low debt/equity of 0.3x (total debt of Rs 580mn September 2016). It can increase capacity to 125,000 tonnes with marginal capex at current locations and capacity expansion in north India will provide medium to long term growth.
Valuations We value the company at 14x our FY18 EPS considering a high growth potential market with low capital requirements (limited financial leverage impact as debt‐to ‐market capitalisation is 0.1x). At our target multiple, it trades at a PEG of 0.4x on an FY15‐18 earnings CAGR of 36%. We initiate coverage with target price of Rs 225 with a BUY rating.
BUY CMP Rs 142 TARGET Rs 225 (+58%) COMPANY DATA O/S SHARES (MN) : 34MARKET CAP (RSBN) : 5MARKET CAP (USDMN) : 7352 ‐ WK HI/LO (RS) : 178 / 127LIQUIDITY 3M (USDMN) : 0.021PAR VALUE (RS) : 10 SHARE HOLDING PATTERN, % Sep 15PROMOTERS : 62.6FII / NRI : 5.9FI / MF : 17.3NON PRO : 2.8PUBLIC & OTHERS : 11.6 PRICE PERFORMANCE, %
1MTH 3MTH 1YRABS ‐5.2 ‐10.5 NAREL TO BSE ‐1.9 ‐2.1 NA PRICE VS. SENSEX
Source: Phillip Capital India Research KEY FINANCIALS Rs mn FY16E FY17E FY18ENet Sales 4,765 6,083 7,717EBIDTA 605 808 1,063Net Profit 302 401 549EPS, Rs 8.8 11.7 16.0PER, x 16.8 12.7 9.2EV/EBIDTA, x 8.3 6.5 5.1P/BV, x 2.4 2.1 1.8ROE, % 14.5 16.7 19.4Debt/Equity (%) 17.4 19.2 17.9
Source: PhillipCapital India Research Est. Vikram Suryavanshi (+ 9122 6667 9951) [email protected]
050100150200250300350
Apr‐14 Oct‐14 Apr‐15 Oct‐15
PEBS BSE Sensex
Page | 3 | PHILLIPCAPITAL INDIA RESEARCH
PENNAR ENGINEERED BUILDING SYSTEMS LTD INITIATING COVERAGE
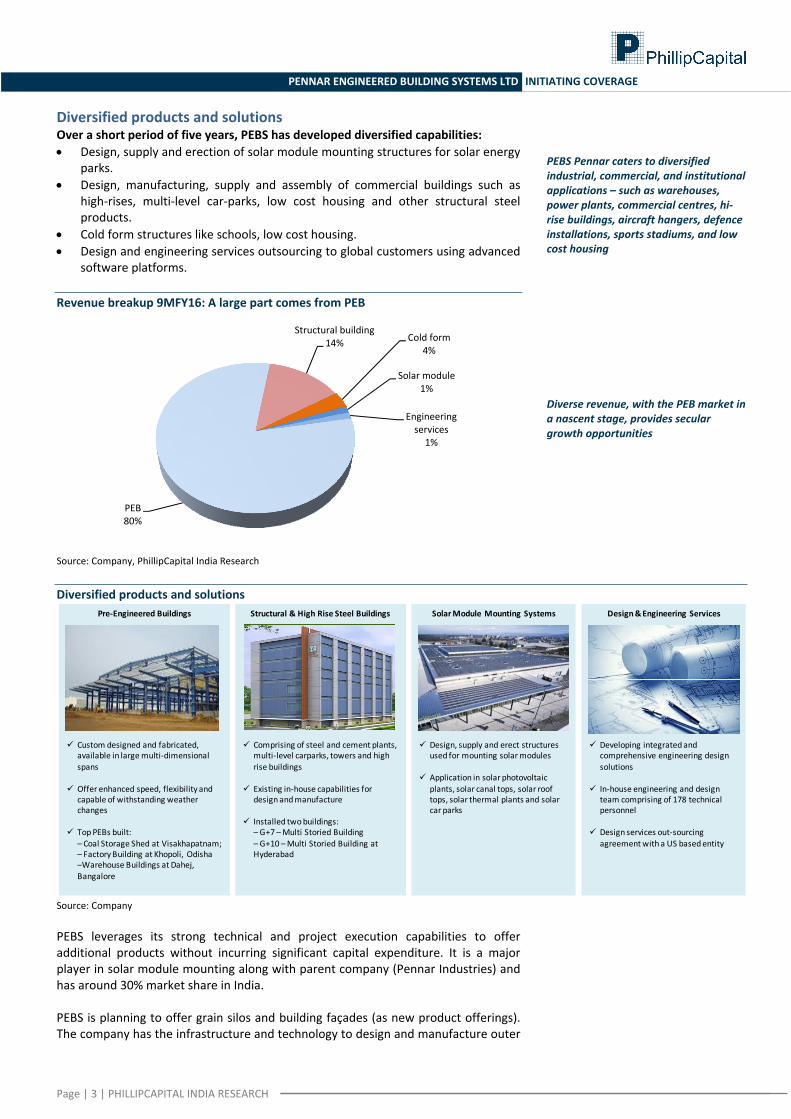
Diversified products and solutions Over a short period of five years, PEBS has developed diversified capabilities: • Design, supply and erection of solar module mounting structures for solar energy
parks. • Design, manufacturing, supply and assembly of commercial buildings such as
high‐rises, multi‐level car‐parks, low cost housing and other structural steel products.
• Cold form structures like schools, low cost housing. • Design and engineering services outsourcing to global customers using advanced
software platforms. Revenue breakup 9MFY16: A large part comes from PEB
Source: Company, PhillipCapital India Research Diversified products and solutions
Source: Company PEBS leverages its strong technical and project execution capabilities to offer additional products without incurring significant capital expenditure. It is a major player in solar module mounting along with parent company (Pennar Industries) and has around 30% market share in India. PEBS is planning to offer grain silos and building façades (as new product offerings). The company has the infrastructure and technology to design and manufacture outer
PEB80%
Structural building14% Cold form
4%
Solar module1%
Engineering services1%
Solar Module Mounting Systems
Design, supply and erect structures used for mounting solar modules
Application in solar photovoltaic plants, solar canal tops, solar roof tops, solar thermal plants and solar car parks
Pre‐Engineered Buildings
Custom designed and fabricated, available in large multi‐dimensional spans
Offer enhanced speed, flexibility and capable of withstanding weather changes
Top PEBs built:– Coal Storage Shed at Visakhapatnam;– Factory Building at Khopoli, Odisha–Warehouse Buildings at Dahej, Bangalore
Structural & High Rise Steel Buildings
Comprising of steel and cement plants, multi‐level carparks, towers and high rise buildings
Existing in‐house capabilities for design and manufacture
Installed two buildings:– G+7 –Multi Storied Building– G+10 –Multi Storied Building at Hyderabad
Design & Engineering Services
Developing integrated and comprehensive engineering design solutions
In‐house engineering and design team comprising of 178 technical personnel
Design services out‐sourcing agreement with a US based entity
PEBS Pennar caters to diversified industrial, commercial, and institutional applications – such as warehouses, power plants, commercial centres, hi‐rise buildings, aircraft hangers, defence installations, sports stadiums, and low cost housing
Diverse revenue, with the PEB market in a nascent stage, provides secular growth opportunities
Page | 4 | PHILLIPCAPITAL INDIA RESEARCH
PENNAR ENGINEERED BUILDING SYSTEMS LTD INITIATING COVERAGE
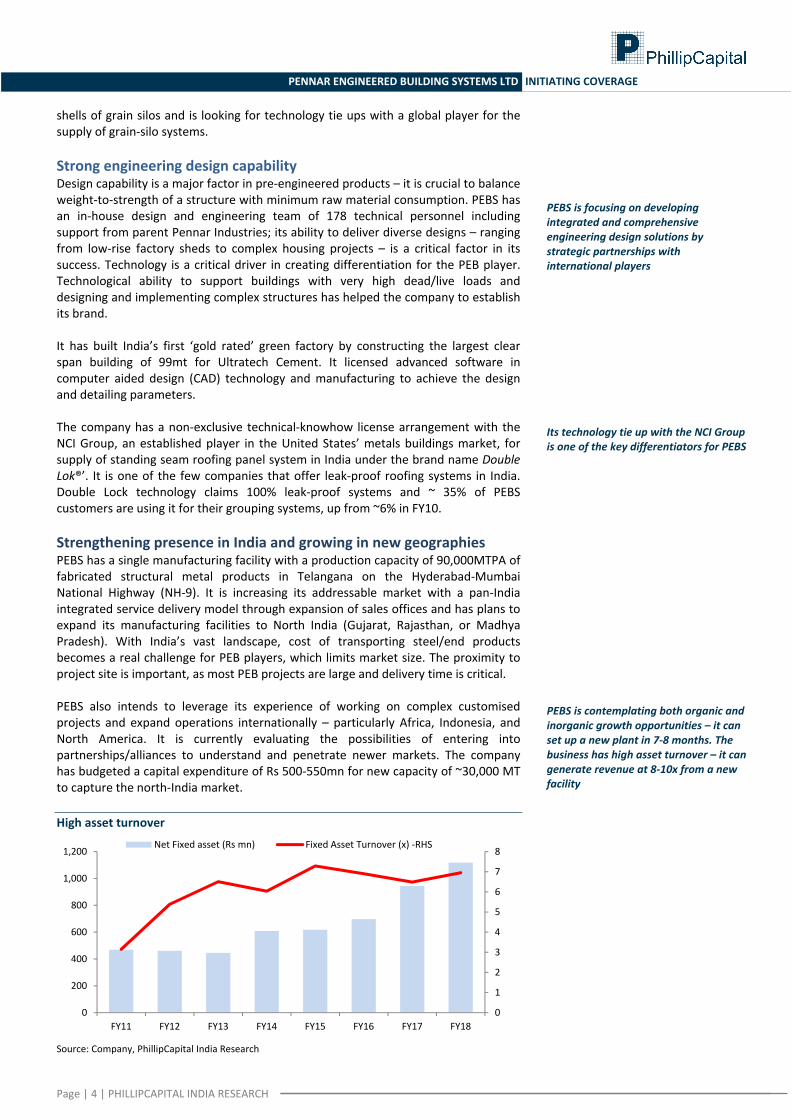
shells of grain silos and is looking for technology tie ups with a global player for the supply of grain‐silo systems. Strong engineering design capability Design capability is a major factor in pre‐engineered products – it is crucial to balance weight‐to‐strength of a structure with minimum raw material consumption. PEBS has an in‐house design and engineering team of 178 technical personnel including support from parent Pennar Industries; its ability to deliver diverse designs – ranging from low‐rise factory sheds to complex housing projects – is a critical factor in its success. Technology is a critical driver in creating differentiation for the PEB player. Technological ability to support buildings with very high dead/live loads and designing and implementing complex structures has helped the company to establish its brand. It has built India’s first ‘gold rated’ green factory by constructing the largest clear span building of 99mt for Ultratech Cement. It licensed advanced software in computer aided design (CAD) technology and manufacturing to achieve the design and detailing parameters. The company has a non‐exclusive technical‐knowhow license arrangement with the NCI Group, an established player in the United States’ metals buildings market, for supply of standing seam roofing panel system in India under the brand name Double Lok®’. It is one of the few companies that offer leak‐proof roofing systems in India. Double Lock technology claims 100% leak‐proof systems and ~ 35% of PEBS customers are using it for their grouping systems, up from ~6% in FY10. Strengthening presence in India and growing in new geographies PEBS has a single manufacturing facility with a production capacity of 90,000MTPA of fabricated structural metal products in Telangana on the Hyderabad‐Mumbai National Highway (NH‐9). It is increasing its addressable market with a pan‐India integrated service delivery model through expansion of sales offices and has plans to expand its manufacturing facilities to North India (Gujarat, Rajasthan, or Madhya Pradesh). With India’s vast landscape, cost of transporting steel/end products becomes a real challenge for PEB players, which limits market size. The proximity to project site is important, as most PEB projects are large and delivery time is critical. PEBS also intends to leverage its experience of working on complex customised projects and expand operations internationally – particularly Africa, Indonesia, and North America. It is currently evaluating the possibilities of entering into partnerships/alliances to understand and penetrate newer markets. The company has budgeted a capital expenditure of Rs 500‐550mn for new capacity of ~30,000 MT to capture the north‐India market. High asset turnover
Source: Company, PhillipCapital India Research
0
1
2
3
4
5
6
7
8
0
200
400
600
800
1,000
1,200
FY11 FY12 FY13 FY14 FY15 FY16 FY17 FY18
Net Fixed asset (Rs mn) Fixed Asset Turnover (x) ‐RHS
PEBS is focusing on developing integrated and comprehensive engineering design solutions by strategic partnerships with international players
Its technology tie up with the NCI Group is one of the key differentiators for PEBS
PEBS is contemplating both organic and inorganic growth opportunities – it can set up a new plant in 7‐8 months. The business has high asset turnover – it can generate revenue at 8‐10x from a new facility
Page | 5 | PHILLIPCAPITAL INDIA RESEARCH
PENNAR ENGINEERED BUILDING SYSTEMS LTD INITIATING COVERAGE
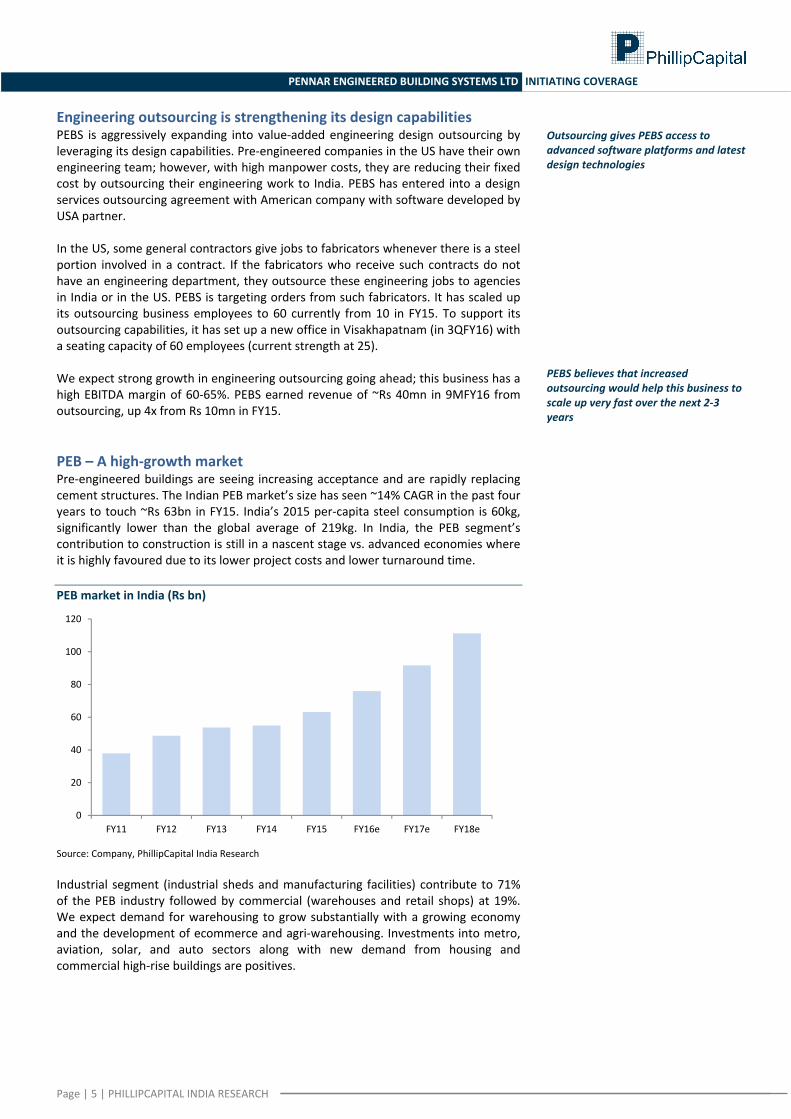
Engineering outsourcing is strengthening its design capabilities PEBS is aggressively expanding into value‐added engineering design outsourcing by leveraging its design capabilities. Pre‐engineered companies in the US have their own engineering team; however, with high manpower costs, they are reducing their fixed cost by outsourcing their engineering work to India. PEBS has entered into a design services outsourcing agreement with American company with software developed by USA partner. In the US, some general contractors give jobs to fabricators whenever there is a steel portion involved in a contract. If the fabricators who receive such contracts do not have an engineering department, they outsource these engineering jobs to agencies in India or in the US. PEBS is targeting orders from such fabricators. It has scaled up its outsourcing business employees to 60 currently from 10 in FY15. To support its outsourcing capabilities, it has set up a new office in Visakhapatnam (in 3QFY16) with a seating capacity of 60 employees (current strength at 25). We expect strong growth in engineering outsourcing going ahead; this business has a high EBITDA margin of 60‐65%. PEBS earned revenue of ~Rs 40mn in 9MFY16 from outsourcing, up 4x from Rs 10mn in FY15. PEB – A high‐growth market Pre‐engineered buildings are seeing increasing acceptance and are rapidly replacing cement structures. The Indian PEB market’s size has seen ~14% CAGR in the past four years to touch ~Rs 63bn in FY15. India’s 2015 per‐capita steel consumption is 60kg, significantly lower than the global average of 219kg. In India, the PEB segment’s contribution to construction is still in a nascent stage vs. advanced economies where it is highly favoured due to its lower project costs and lower turnaround time. PEB market in India (Rs bn)
Source: Company, PhillipCapital India Research Industrial segment (industrial sheds and manufacturing facilities) contribute to 71% of the PEB industry followed by commercial (warehouses and retail shops) at 19%. We expect demand for warehousing to grow substantially with a growing economy and the development of ecommerce and agri‐warehousing. Investments into metro, aviation, solar, and auto sectors along with new demand from housing and commercial high‐rise buildings are positives.
0
20
40
60
80
100
120
FY11 FY12 FY13 FY14 FY15 FY16e FY17e FY18e
Outsourcing gives PEBS access to advanced software platforms and latest design technologies
PEBS believes that increased outsourcing would help this business to scale up very fast over the next 2‐3 years
Page | 6 | PHILLIPCAPITAL INDIA RESEARCH
PENNAR ENGINEERED BUILDING SYSTEMS LTD INITIATING COVERAGE
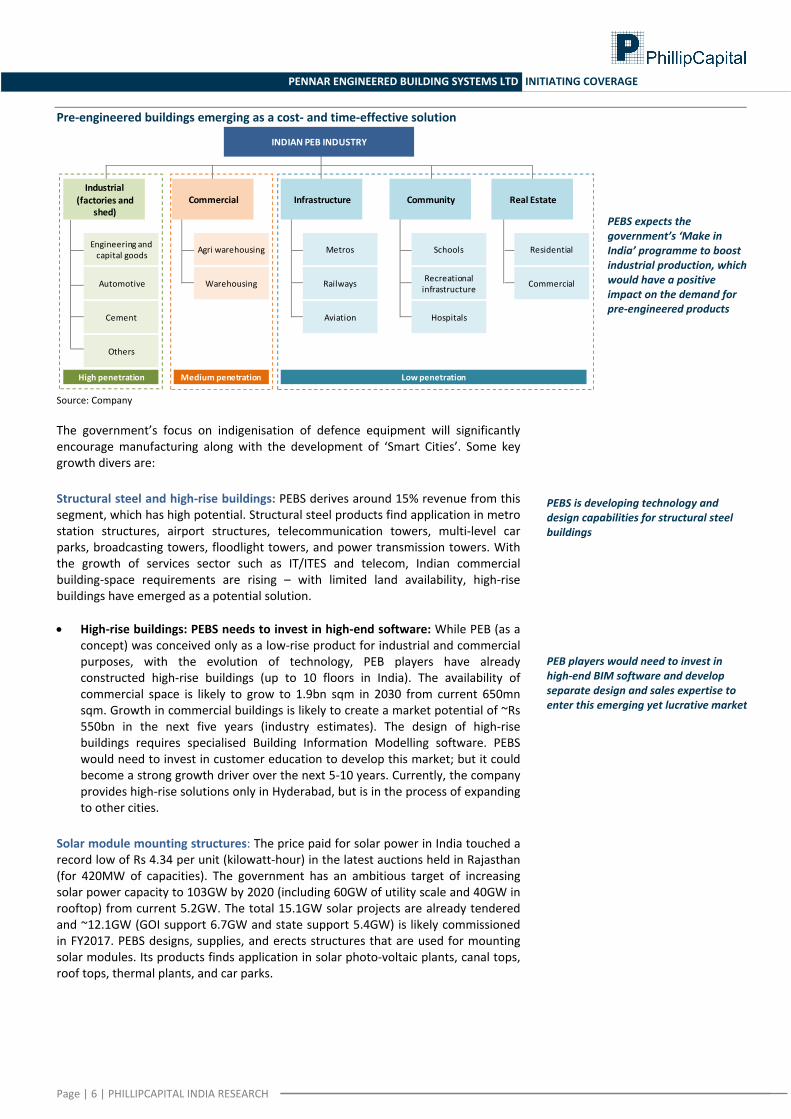
Pre‐engineered buildings emerging as a cost‐ and time‐effective solution
Source: Company The government’s focus on indigenisation of defence equipment will significantly encourage manufacturing along with the development of ‘Smart Cities’. Some key growth divers are: Structural steel and high‐rise buildings: PEBS derives around 15% revenue from this segment, which has high potential. Structural steel products find application in metro station structures, airport structures, telecommunication towers, multi‐level car parks, broadcasting towers, floodlight towers, and power transmission towers. With the growth of services sector such as IT/ITES and telecom, Indian commercial building‐space requirements are rising – with limited land availability, high‐rise buildings have emerged as a potential solution. • High‐rise buildings: PEBS needs to invest in high‐end software: While PEB (as a
concept) was conceived only as a low‐rise product for industrial and commercial purposes, with the evolution of technology, PEB players have already constructed high‐rise buildings (up to 10 floors in India). The availability of commercial space is likely to grow to 1.9bn sqm in 2030 from current 650mn sqm. Growth in commercial buildings is likely to create a market potential of ~Rs 550bn in the next five years (industry estimates). The design of high‐rise buildings requires specialised Building Information Modelling software. PEBS would need to invest in customer education to develop this market; but it could become a strong growth driver over the next 5‐10 years. Currently, the company provides high‐rise solutions only in Hyderabad, but is in the process of expanding to other cities.
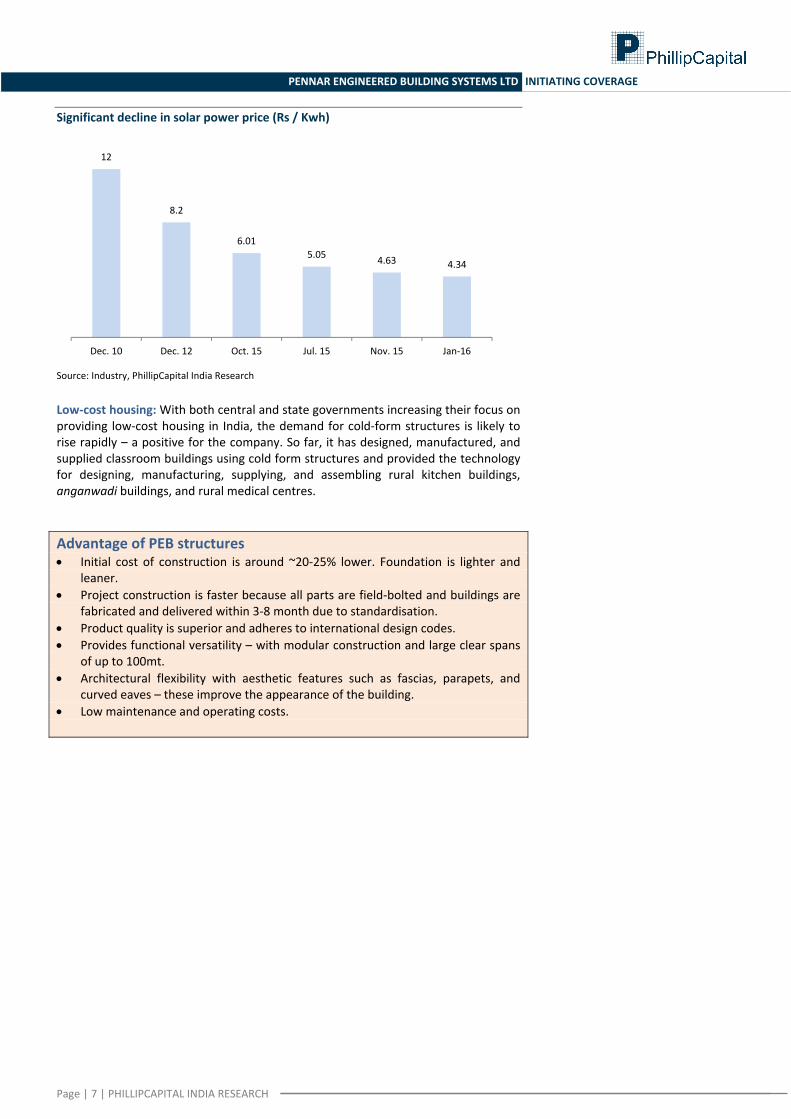
Solar module mounting structures: The price paid for solar power in India touched a record low of Rs 4.34 per unit (kilowatt‐hour) in the latest auctions held in Rajasthan (for 420MW of capacities). The government has an ambitious target of increasing solar power capacity to 103GW by 2020 (including 60GW of utility scale and 40GW in rooftop) from current 5.2GW. The total 15.1GW solar projects are already tendered and ~12.1GW (GOI support 6.7GW and state support 5.4GW) is likely commissioned in FY2017. PEBS designs, supplies, and erects structures that are used for mounting solar modules. Its products finds application in solar photo‐voltaic plants, canal tops, roof tops, thermal plants, and car parks.
Engineering and capital goods
Automotive
Cement
Others
Agri warehousing
Warehousing
Metros
Railways
Aviation
Schools
Recreational infrastructure
Hospitals
Residential
Commercial
Industrial (factories and
shed)Commercial Infrastructure Community Real Estate
High penetration Medium penetration Low penetration
INDIAN PEB INDUSTRY
PEBS expects the government’s ‘Make in India’ programme to boost industrial production, which would have a positive impact on the demand for pre‐engineered products
PEBS is developing technology and design capabilities for structural steel buildings
PEB players would need to invest in high‐end BIM software and develop separate design and sales expertise to enter this emerging yet lucrative market
Page | 7 | PHILLIPCAPITAL INDIA RESEARCH
PENNAR ENGINEERED BUILDING SYSTEMS LTD INITIATING COVERAGE
Significant decline in solar power price (Rs / Kwh)
Source: Industry, PhillipCapital India Research
Low‐cost housing: With both central and state governments increasing their focus on providing low‐cost housing in India, the demand for cold‐form structures is likely to rise rapidly – a positive for the company. So far, it has designed, manufactured, and supplied classroom buildings using cold form structures and provided the technology for designing, manufacturing, supplying, and assembling rural kitchen buildings, anganwadi buildings, and rural medical centres.
Advantage of PEB structures • Initial cost of construction is around ~20‐25% lower. Foundation is lighter and
leaner. • Project construction is faster because all parts are field‐bolted and buildings are
fabricated and delivered within 3‐8 month due to standardisation. • Product quality is superior and adheres to international design codes. • Provides functional versatility – with modular construction and large clear spans
of up to 100mt. • Architectural flexibility with aesthetic features such as fascias, parapets, and
curved eaves – these improve the appearance of the building. • Low maintenance and operating costs.
12
8.2
6.015.05 4.63 4.34
Dec. 10 Dec. 12 Oct. 15 Jul. 15 Nov. 15 Jan‐16
Page | 8 | PHILLIPCAPITAL INDIA RESEARCH
PENNAR ENGINEERED BUILDING SYSTEMS LTD INITIATING COVERAGE
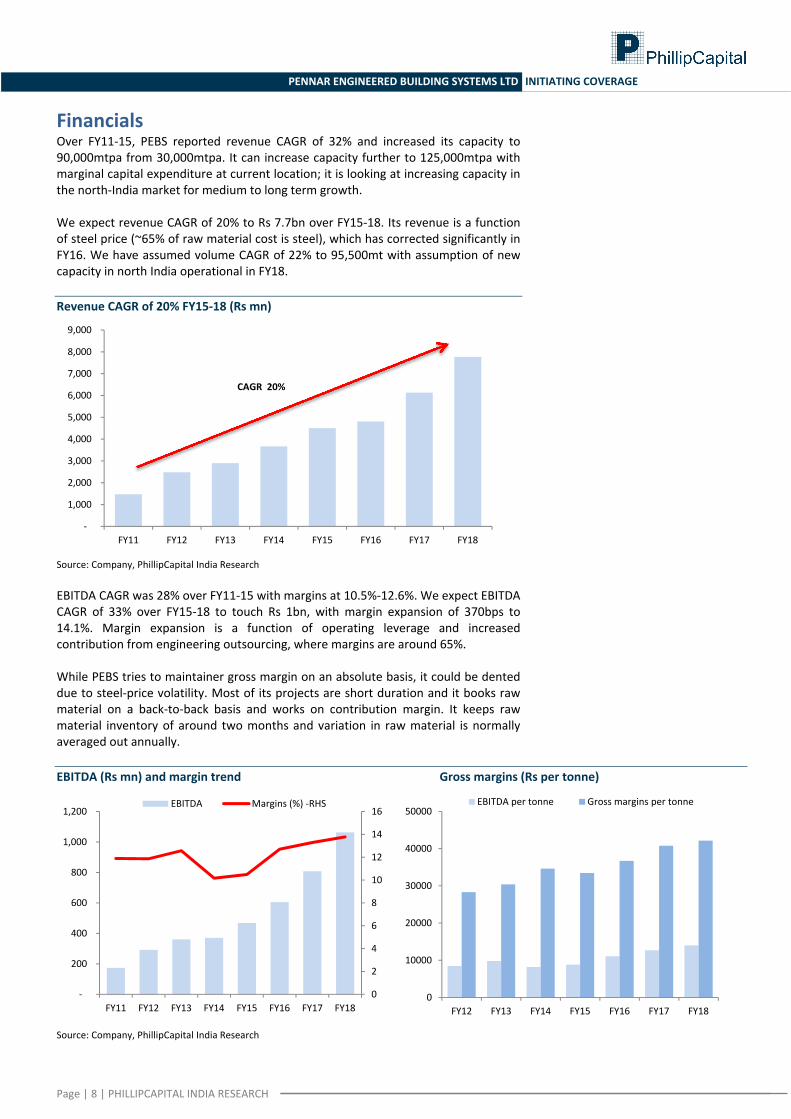
Financials Over FY11‐15, PEBS reported revenue CAGR of 32% and increased its capacity to 90,000mtpa from 30,000mtpa. It can increase capacity further to 125,000mtpa with marginal capital expenditure at current location; it is looking at increasing capacity in the north‐India market for medium to long term growth. We expect revenue CAGR of 20% to Rs 7.7bn over FY15‐18. Its revenue is a function of steel price (~65% of raw material cost is steel), which has corrected significantly in FY16. We have assumed volume CAGR of 22% to 95,500mt with assumption of new capacity in north India operational in FY18. Revenue CAGR of 20% FY15‐18 (Rs mn)
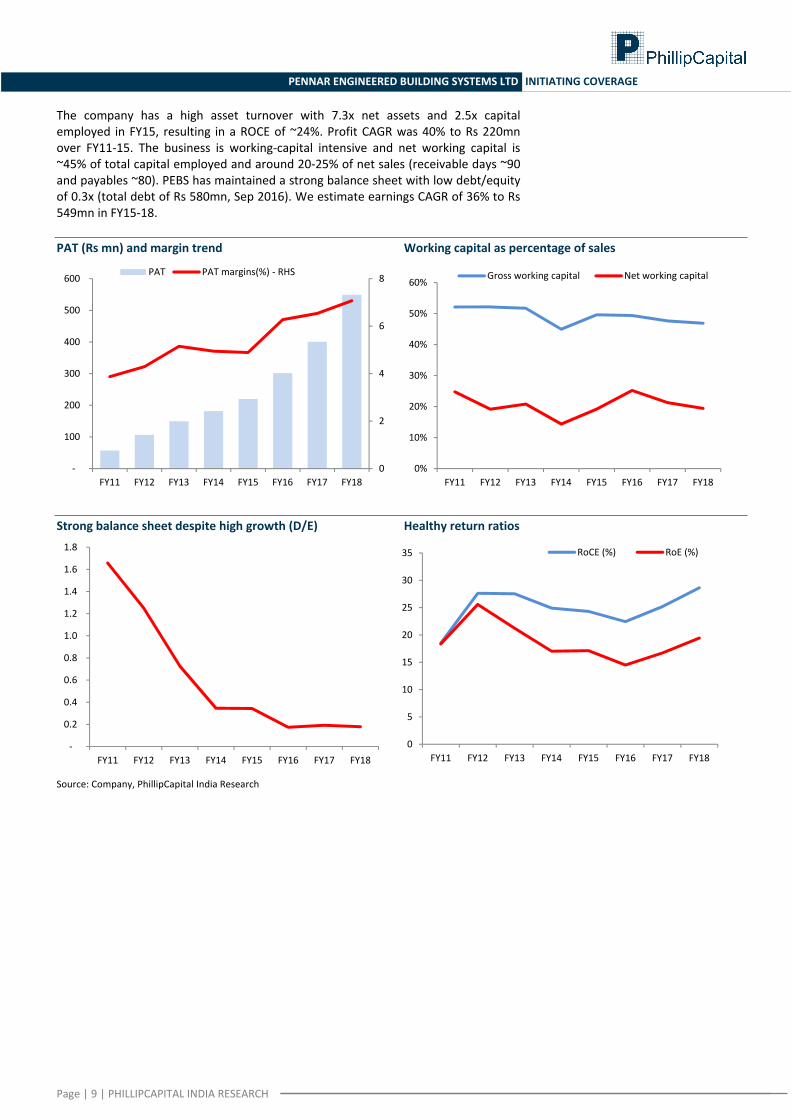
Source: Company, PhillipCapital India Research EBITDA CAGR was 28% over FY11‐15 with margins at 10.5%‐12.6%. We expect EBITDA CAGR of 33% over FY15‐18 to touch Rs 1bn, with margin expansion of 370bps to 14.1%. Margin expansion is a function of operating leverage and increased contribution from engineering outsourcing, where margins are around 65%. While PEBS tries to maintainer gross margin on an absolute basis, it could be dented due to steel‐price volatility. Most of its projects are short duration and it books raw material on a back‐to‐back basis and works on contribution margin. It keeps raw material inventory of around two months and variation in raw material is normally averaged out annually. EBITDA (Rs mn) and margin trend Gross margins (Rs per tonne)
Source: Company, PhillipCapital India Research
‐
1,000
2,000
3,000
4,000
5,000
6,000
7,000
8,000
9,000
FY11 FY12 FY13 FY14 FY15 FY16 FY17 FY18
CAGR 20%
0
2
4
6
8
10
12
14
16
‐
200
400
600
800
1,000
1,200
FY11 FY12 FY13 FY14 FY15 FY16 FY17 FY18
EBITDA Margins (%) ‐RHS
0
10000
20000
30000
40000
50000
FY12 FY13 FY14 FY15 FY16 FY17 FY18
EBITDA per tonne Gross margins per tonne
Page | 9 | PHILLIPCAPITAL INDIA RESEARCH
PENNAR ENGINEERED BUILDING SYSTEMS LTD INITIATING COVERAGE
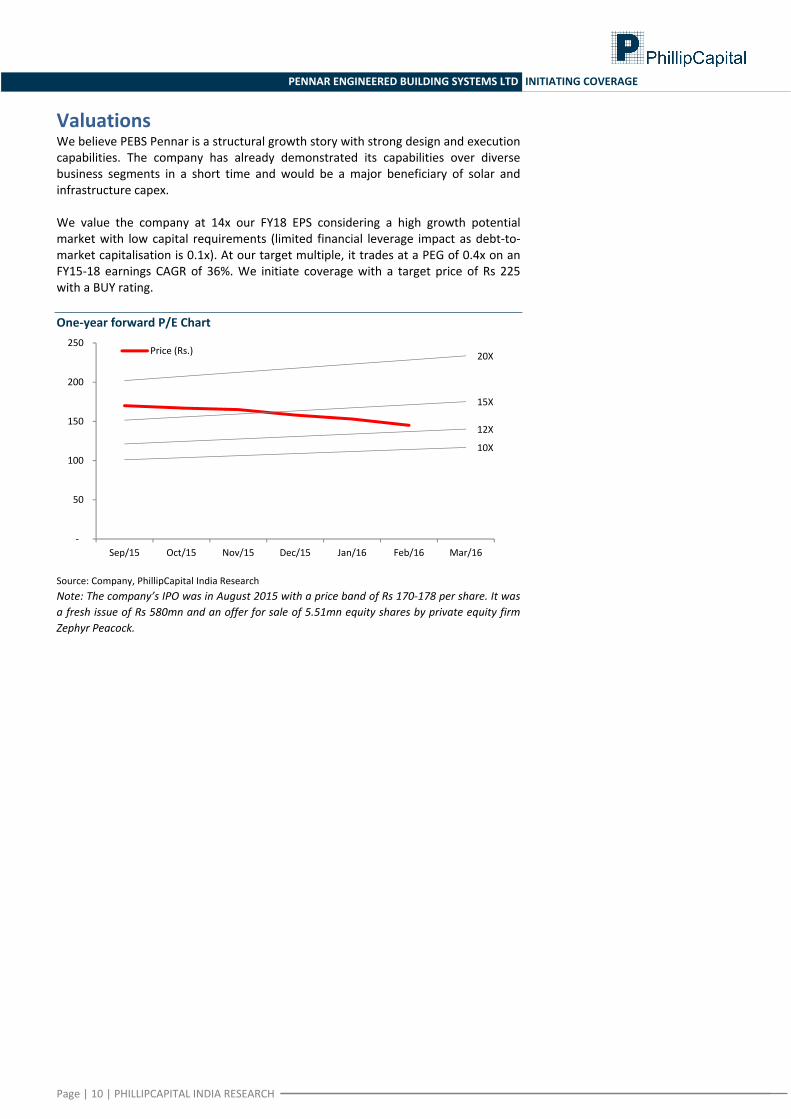
The company has a high asset turnover with 7.3x net assets and 2.5x capital employed in FY15, resulting in a ROCE of ~24%. Profit CAGR was 40% to Rs 220mn over FY11‐15. The business is working‐capital intensive and net working capital is ~45% of total capital employed and around 20‐25% of net sales (receivable days ~90 and payables ~80). PEBS has maintained a strong balance sheet with low debt/equity of 0.3x (total debt of Rs 580mn, Sep 2016). We estimate earnings CAGR of 36% to Rs 549mn in FY15‐18. PAT (Rs mn) and margin trend Working capital as percentage of sales
Strong balance sheet despite high growth (D/E) Healthy return ratios
Source: Company, PhillipCapital India Research
0
2
4
6
8
‐
100
200
300
400
500
600
FY11 FY12 FY13 FY14 FY15 FY16 FY17 FY18
PAT PAT margins(%) ‐ RHS
0%
10%
20%
30%
40%
50%
60%
FY11 FY12 FY13 FY14 FY15 FY16 FY17 FY18
Gross working capital Net working capital
‐
0.2
0.4
0.6
0.8
1.0
1.2
1.4
1.6
1.8
FY11 FY12 FY13 FY14 FY15 FY16 FY17 FY180
5
10
15
20
25
30
35
FY11 FY12 FY13 FY14 FY15 FY16 FY17 FY18
RoCE (%) RoE (%)
Page | 10 | PHILLIPCAPITAL INDIA RESEARCH
PENNAR ENGINEERED BUILDING SYSTEMS LTD INITIATING COVERAGE
Valuations We believe PEBS Pennar is a structural growth story with strong design and execution capabilities. The company has already demonstrated its capabilities over diverse business segments in a short time and would be a major beneficiary of solar and infrastructure capex. We value the company at 14x our FY18 EPS considering a high growth potential market with low capital requirements (limited financial leverage impact as debt‐to‐market capitalisation is 0.1x). At our target multiple, it trades at a PEG of 0.4x on an FY15‐18 earnings CAGR of 36%. We initiate coverage with a target price of Rs 225 with a BUY rating. One‐year forward P/E Chart
Source: Company, PhillipCapital India Research Note: The company’s IPO was in August 2015 with a price band of Rs 170‐178 per share. It was a fresh issue of Rs 580mn and an offer for sale of 5.51mn equity shares by private equity firm Zephyr Peacock.
10X
12X
15X
20X
‐
50
100
150
200
250
Sep/15 Oct/15 Nov/15 Dec/15 Jan/16 Feb/16 Mar/16
Price (Rs.)
Page | 11 | PHILLIPCAPITAL INDIA RESEARCH
PENNAR ENGINEERED BUILDING SYSTEMS LTD INITIATING COVERAGE
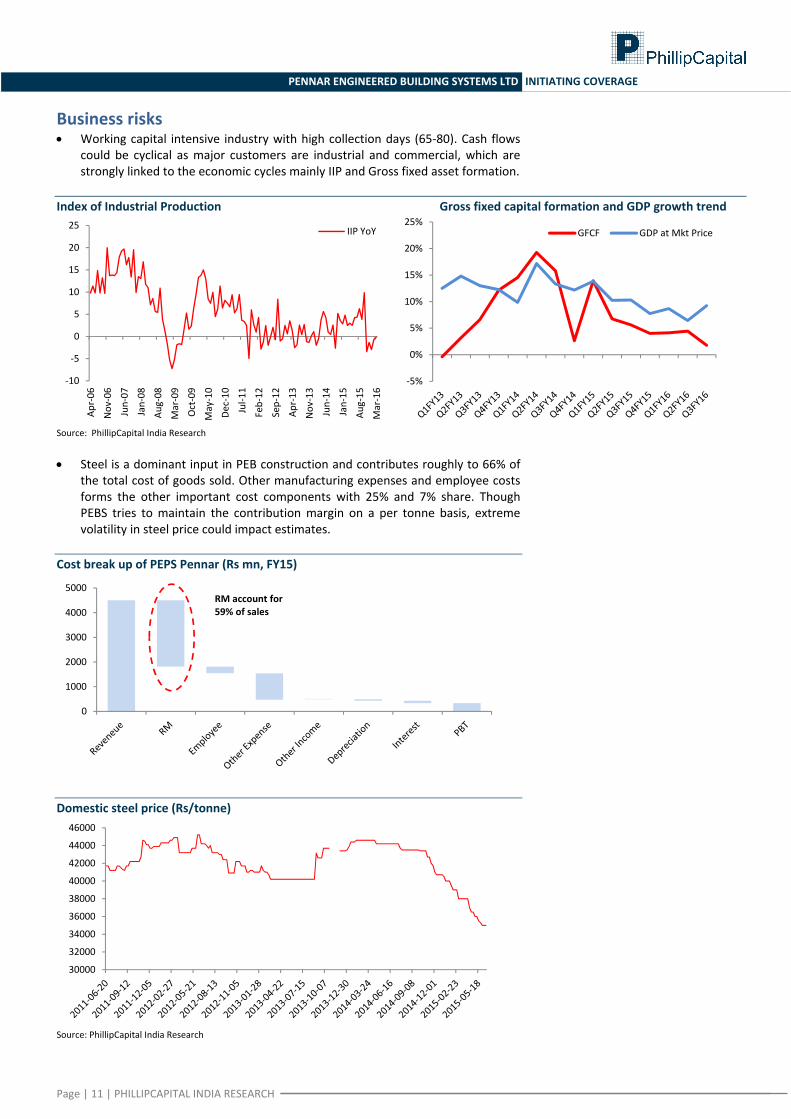
Business risks • Working capital intensive industry with high collection days (65‐80). Cash flows
could be cyclical as major customers are industrial and commercial, which are strongly linked to the economic cycles mainly IIP and Gross fixed asset formation.
Index of Industrial Production Gross fixed capital formation and GDP growth trend
Source: PhillipCapital India Research • Steel is a dominant input in PEB construction and contributes roughly to 66% of
the total cost of goods sold. Other manufacturing expenses and employee costs forms the other important cost components with 25% and 7% share. Though PEBS tries to maintain the contribution margin on a per tonne basis, extreme volatility in steel price could impact estimates.
Cost break up of PEPS Pennar (Rs mn, FY15)
Domestic steel price (Rs/tonne)
Source: PhillipCapital India Research
‐10
‐5
0
5
10
15
20
25
Apr‐06
Nov
‐06
Jun‐07
Jan‐08
Aug‐08
Mar‐09
Oct‐09
May‐10
Dec‐10
Jul‐1
1
Feb‐12
Sep‐12
Apr‐13
Nov
‐13
Jun‐14
Jan‐15
Aug‐15
Mar‐16
IIP YoY
‐5%
0%
5%
10%
15%
20%
25%GFCF GDP at Mkt Price
0
1000
2000
3000
4000
5000RM account for 59% of sales
30000
32000
34000
36000
38000
40000
42000
44000
46000
Page | 12 | PHILLIPCAPITAL INDIA RESEARCH
PENNAR ENGINEERED BUILDING SYSTEMS LTD INITIATING COVERAGE
About the company • Leading‐custom designed building‐systems solutions providers in India. • Products and services:
o Pre‐engineered buildings o Design and engineering services o Solar module mounting structures o Cold‐form buildings o Structural steel products, widely used for various manufacturing,
warehousing, industrial, infrastructure, and custom‐designed commercial buildings.
• It started business in January 2010. Has more than 1000 projects in various sectors including: o Warehousing, Retail and manufacturing o Design, supply and erection of solar module mounting structures for
generation of solar power o Design, manufacturing, supply and erection of structural steel buildings and
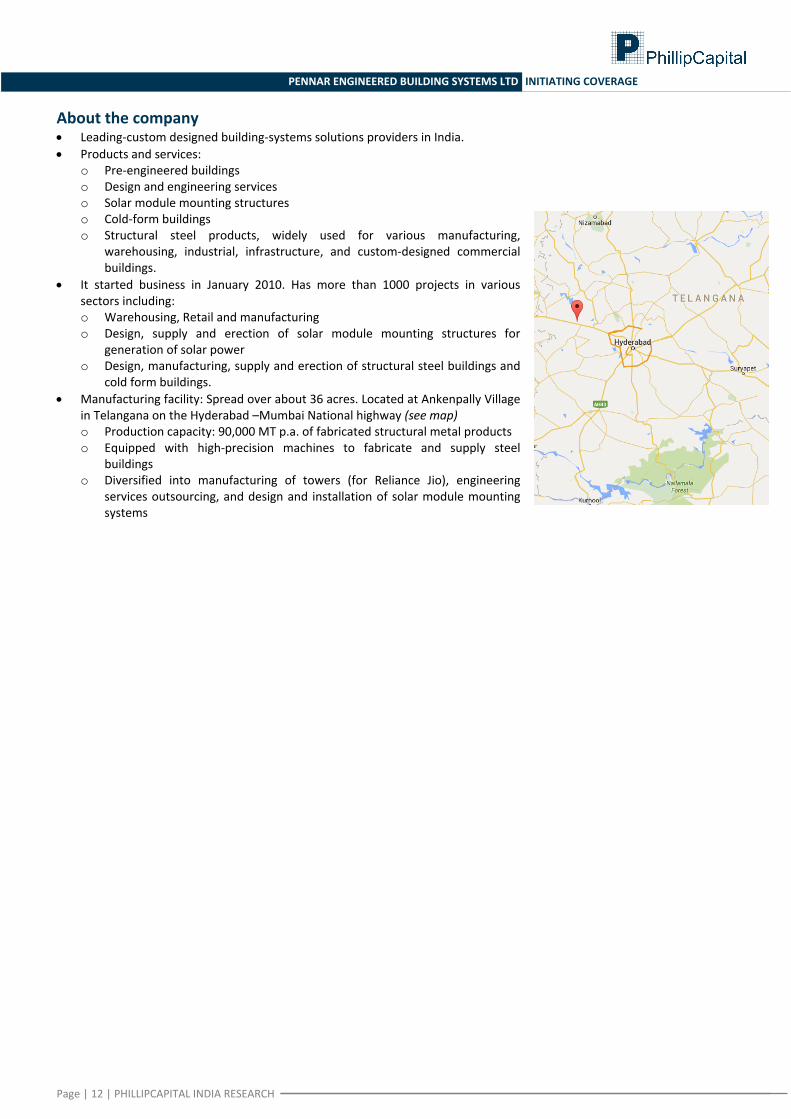
cold form buildings. • Manufacturing facility: Spread over about 36 acres. Located at Ankenpally Village
in Telangana on the Hyderabad –Mumbai National highway (see map) o Production capacity: 90,000 MT p.a. of fabricated structural metal products o Equipped with high‐precision machines to fabricate and supply steel
buildings o Diversified into manufacturing of towers (for Reliance Jio), engineering
services outsourcing, and design and installation of solar module mounting systems
Page | 13 | PHILLIPCAPITAL INDIA RESEARCH
PENNAR ENGINEERED BUILDING SYSTEMS LTD INITIATING COVERAGE
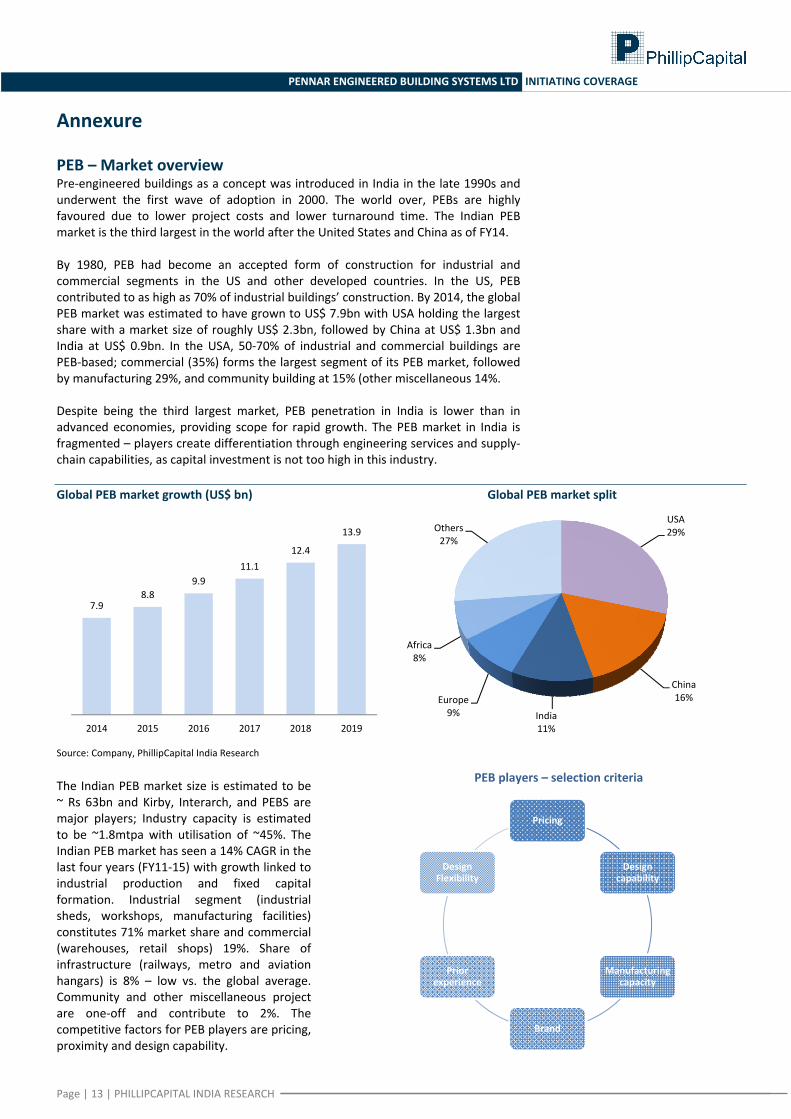
Annexure PEB – Market overview Pre‐engineered buildings as a concept was introduced in India in the late 1990s and underwent the first wave of adoption in 2000. The world over, PEBs are highly favoured due to lower project costs and lower turnaround time. The Indian PEB market is the third largest in the world after the United States and China as of FY14. By 1980, PEB had become an accepted form of construction for industrial and commercial segments in the US and other developed countries. In the US, PEB contributed to as high as 70% of industrial buildings’ construction. By 2014, the global PEB market was estimated to have grown to US$ 7.9bn with USA holding the largest share with a market size of roughly US$ 2.3bn, followed by China at US$ 1.3bn and India at US$ 0.9bn. In the USA, 50‐70% of industrial and commercial buildings are PEB‐based; commercial (35%) forms the largest segment of its PEB market, followed by manufacturing 29%, and community building at 15% (other miscellaneous 14%. Despite being the third largest market, PEB penetration in India is lower than in advanced economies, providing scope for rapid growth. The PEB market in India is fragmented – players create differentiation through engineering services and supply‐chain capabilities, as capital investment is not too high in this industry. Global PEB market growth (US$ bn) Global PEB market split
Source: Company, PhillipCapital India Research
The Indian PEB market size is estimated to be ~ Rs 63bn and Kirby, Interarch, and PEBS are major players; Industry capacity is estimated to be ~1.8mtpa with utilisation of ~45%. The Indian PEB market has seen a 14% CAGR in the last four years (FY11‐15) with growth linked to industrial production and fixed capital formation. Industrial segment (industrial sheds, workshops, manufacturing facilities) constitutes 71% market share and commercial (warehouses, retail shops) 19%. Share of infrastructure (railways, metro and aviation hangars) is 8% – low vs. the global average. Community and other miscellaneous project are one‐off and contribute to 2%. The competitive factors for PEB players are pricing, proximity and design capability.
7.98.8
9.911.1
12.4
13.9
2014 2015 2016 2017 2018 2019
USA29%
China16%
India11%
Europe9%
Africa8%
Others27%
Pricing
Design capability
Manufacturing capacity
Brand
Prior experience
Design Flexibility
PEB players – selection criteria
Page | 14 | PHILLIPCAPITAL INDIA RESEARCH
PENNAR ENGINEERED BUILDING SYSTEMS LTD INITIATING COVERAGE
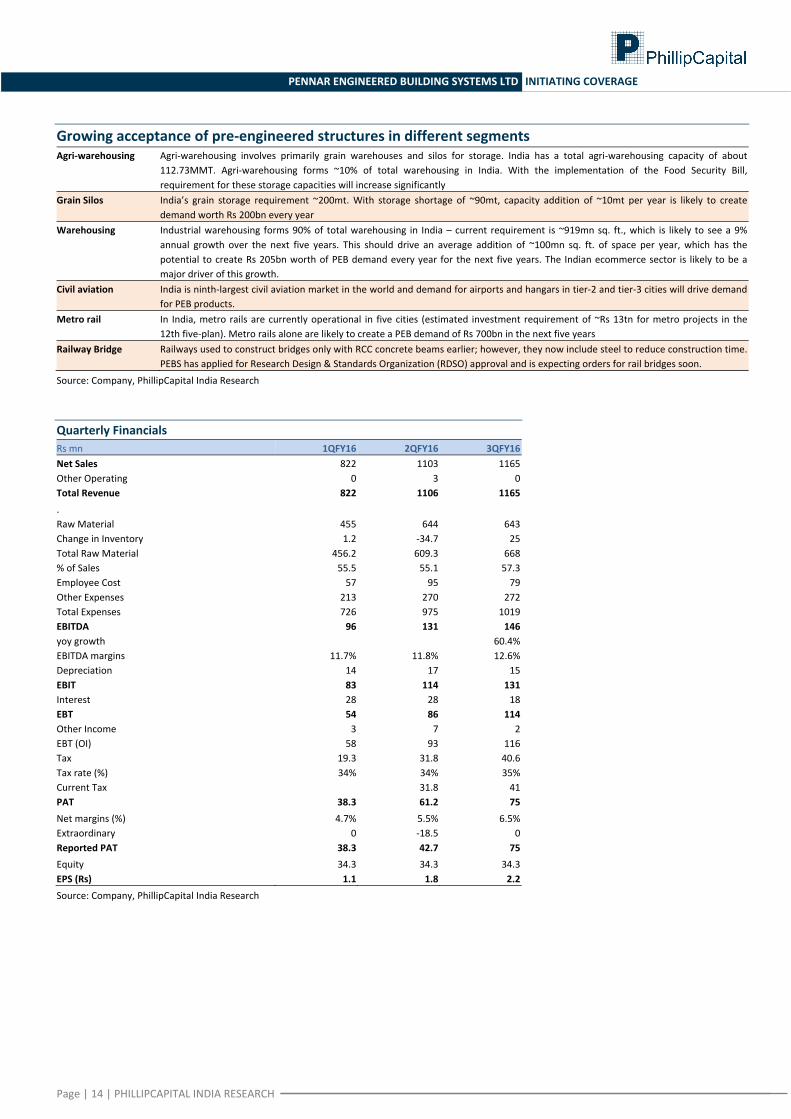
Growing acceptance of pre‐engineered structures in different segments Agri‐warehousing Agri‐warehousing involves primarily grain warehouses and silos for storage. India has a total agri‐warehousing capacity of about
112.73MMT. Agri‐warehousing forms ~10% of total warehousing in India. With the implementation of the Food Security Bill, requirement for these storage capacities will increase significantly
Grain Silos India’s grain storage requirement ~200mt. With storage shortage of ~90mt, capacity addition of ~10mt per year is likely to create demand worth Rs 200bn every year
Warehousing Industrial warehousing forms 90% of total warehousing in India – current requirement is ~919mn sq. ft., which is likely to see a 9% annual growth over the next five years. This should drive an average addition of ~100mn sq. ft. of space per year, which has the potential to create Rs 205bn worth of PEB demand every year for the next five years. The Indian ecommerce sector is likely to be a major driver of this growth.
Civil aviation India is ninth‐largest civil aviation market in the world and demand for airports and hangars in tier‐2 and tier‐3 cities will drive demand for PEB products.
Metro rail In India, metro rails are currently operational in five cities (estimated investment requirement of ~Rs 13tn for metro projects in the 12th five‐plan). Metro rails alone are likely to create a PEB demand of Rs 700bn in the next five years
Railway Bridge Railways used to construct bridges only with RCC concrete beams earlier; however, they now include steel to reduce construction time. PEBS has applied for Research Design & Standards Organization (RDSO) approval and is expecting orders for rail bridges soon.
Source: Company, PhillipCapital India Research Quarterly Financials Rs mn 1QFY16 2QFY16 3QFY16Net Sales 822 1103 1165Other Operating 0 3 0Total Revenue 822 1106 1165. Raw Material 455 644 643Change in Inventory 1.2 ‐34.7 25Total Raw Material 456.2 609.3 668% of Sales 55.5 55.1 57.3Employee Cost 57 95 79Other Expenses 213 270 272Total Expenses 726 975 1019EBITDA 96 131 146yoy growth 60.4%EBITDA margins 11.7% 11.8% 12.6%Depreciation 14 17 15EBIT 83 114 131Interest 28 28 18EBT 54 86 114Other Income 3 7 2EBT (OI) 58 93 116Tax 19.3 31.8 40.6Tax rate (%) 34% 34% 35%Current Tax 31.8 41PAT 38.3 61.2 75Net margins (%) 4.7% 5.5% 6.5%Extraordinary 0 ‐18.5 0Reported PAT 38.3 42.7 75Equity 34.3 34.3 34.3EPS (Rs) 1.1 1.8 2.2
Source: Company, PhillipCapital India Research
Page | 15 | PHILLIPCAPITAL INDIA RESEARCH
PENNAR ENGINEERED BUILDING SYSTEMS LTD INITIATING COVERAGE
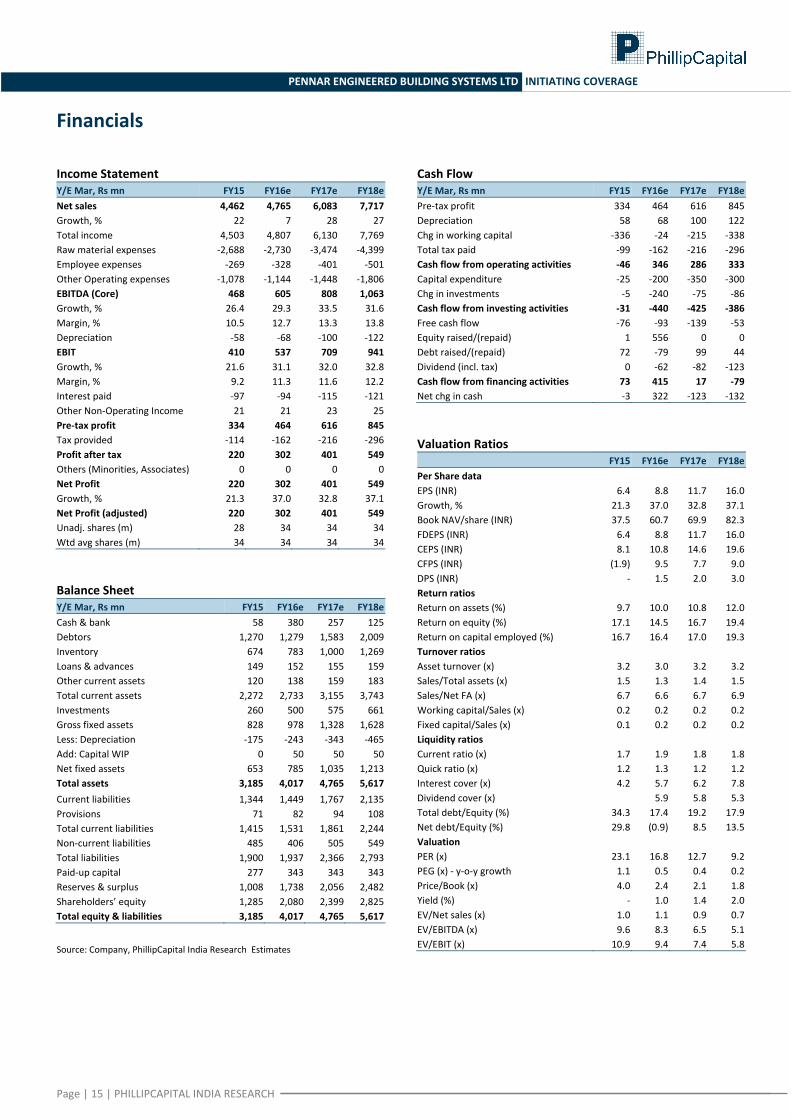
Financials
Income Statement Y/E Mar, Rs mn FY15 FY16e FY17e FY18eNet sales 4,462 4,765 6,083 7,717Growth, % 22 7 28 27Total income 4,503 4,807 6,130 7,769Raw material expenses ‐2,688 ‐2,730 ‐3,474 ‐4,399Employee expenses ‐269 ‐328 ‐401 ‐501Other Operating expenses ‐1,078 ‐1,144 ‐1,448 ‐1,806EBITDA (Core) 468 605 808 1,063Growth, % 26.4 29.3 33.5 31.6Margin, % 10.5 12.7 13.3 13.8Depreciation ‐58 ‐68 ‐100 ‐122EBIT 410 537 709 941Growth, % 21.6 31.1 32.0 32.8Margin, % 9.2 11.3 11.6 12.2Interest paid ‐97 ‐94 ‐115 ‐121Other Non‐Operating Income 21 21 23 25Pre‐tax profit 334 464 616 845Tax provided ‐114 ‐162 ‐216 ‐296Profit after tax 220 302 401 549Others (Minorities, Associates) 0 0 0 0Net Profit 220 302 401 549Growth, % 21.3 37.0 32.8 37.1Net Profit (adjusted) 220 302 401 549Unadj. shares (m) 28 34 34 34Wtd avg shares (m) 34 34 34 34 Balance Sheet Y/E Mar, Rs mn FY15 FY16e FY17e FY18eCash & bank 58 380 257 125Debtors 1,270 1,279 1,583 2,009Inventory 674 783 1,000 1,269Loans & advances 149 152 155 159Other current assets 120 138 159 183Total current assets 2,272 2,733 3,155 3,743Investments 260 500 575 661Gross fixed assets 828 978 1,328 1,628Less: Depreciation ‐175 ‐243 ‐343 ‐465Add: Capital WIP 0 50 50 50Net fixed assets 653 785 1,035 1,213Total assets 3,185 4,017 4,765 5,617Current liabilities 1,344 1,449 1,767 2,135Provisions 71 82 94 108Total current liabilities 1,415 1,531 1,861 2,244Non‐current liabilities 485 406 505 549Total liabilities 1,900 1,937 2,366 2,793Paid‐up capital 277 343 343 343Reserves & surplus 1,008 1,738 2,056 2,482Shareholders’ equity 1,285 2,080 2,399 2,825Total equity & liabilities 3,185 4,017 4,765 5,617 Source: Company, PhillipCapital India Research Estimates
Cash Flow Y/E Mar, Rs mn FY15 FY16e FY17e FY18ePre‐tax profit 334 464 616 845Depreciation 58 68 100 122Chg in working capital ‐336 ‐24 ‐215 ‐338Total tax paid ‐99 ‐162 ‐216 ‐296Cash flow from operating activities ‐46 346 286 333Capital expenditure ‐25 ‐200 ‐350 ‐300Chg in investments ‐5 ‐240 ‐75 ‐86Cash flow from investing activities ‐31 ‐440 ‐425 ‐386Free cash flow ‐76 ‐93 ‐139 ‐53Equity raised/(repaid) 1 556 0 0Debt raised/(repaid) 72 ‐79 99 44Dividend (incl. tax) 0 ‐62 ‐82 ‐123Cash flow from financing activities 73 415 17 ‐79Net chg in cash ‐3 322 ‐123 ‐132 Valuation Ratios
FY15 FY16e FY17e FY18ePer Share data EPS (INR) 6.4 8.8 11.7 16.0Growth, % 21.3 37.0 32.8 37.1Book NAV/share (INR) 37.5 60.7 69.9 82.3FDEPS (INR) 6.4 8.8 11.7 16.0CEPS (INR) 8.1 10.8 14.6 19.6CFPS (INR) (1.9) 9.5 7.7 9.0DPS (INR) ‐ 1.5 2.0 3.0Return ratios Return on assets (%) 9.7 10.0 10.8 12.0Return on equity (%) 17.1 14.5 16.7 19.4Return on capital employed (%) 16.7 16.4 17.0 19.3Turnover ratios Asset turnover (x) 3.2 3.0 3.2 3.2Sales/Total assets (x) 1.5 1.3 1.4 1.5Sales/Net FA (x) 6.7 6.6 6.7 6.9Working capital/Sales (x) 0.2 0.2 0.2 0.2Fixed capital/Sales (x) 0.1 0.2 0.2 0.2Liquidity ratios Current ratio (x) 1.7 1.9 1.8 1.8Quick ratio (x) 1.2 1.3 1.2 1.2Interest cover (x) 4.2 5.7 6.2 7.8Dividend cover (x) 5.9 5.8 5.3Total debt/Equity (%) 34.3 17.4 19.2 17.9Net debt/Equity (%) 29.8 (0.9) 8.5 13.5Valuation PER (x) 23.1 16.8 12.7 9.2PEG (x) ‐ y‐o‐y growth 1.1 0.5 0.4 0.2Price/Book (x) 4.0 2.4 2.1 1.8Yield (%) ‐ 1.0 1.4 2.0EV/Net sales (x) 1.0 1.1 0.9 0.7EV/EBITDA (x) 9.6 8.3 6.5 5.1EV/EBIT (x) 10.9 9.4 7.4 5.8
Page | 16 | PHILLIPCAPITAL INDIA RESEARCH
PENNAR ENGINEERED BUILDING SYSTEMS LTD INITIATING COVERAGE
Rating Methodology We rate stock on absolute return basis. Our target price for the stocks has an investment horizon of one year. Rating Criteria Definition
BUY >= +15% Target price is equal to or more than 15% of current market price
NEUTRAL ‐15% > to < +15% Target price is less than +15% but more than ‐15%
SELL <= ‐15% Target price is less than or equal to ‐15%.
Contact Information (Regional Member Companies)
SINGAPORE: Phillip Securities Pte Ltd 250 North Bridge Road, #06‐00 Raffles City Tower,
Singapore 179101 Tel : (65) 6533 6001 Fax: (65) 6535 3834
www.phillip.com.sg
MALAYSIA: Phillip Capital Management Sdn Bhd B‐3‐6 Block B Level 3, Megan Avenue II,
No. 12, Jalan Yap Kwan Seng, 50450 Kuala Lumpur Tel (60) 3 2162 8841 Fax (60) 3 2166 5099
www.poems.com.my
HONG KONG: Phillip Securities (HK) Ltd 11/F United Centre 95 Queensway Hong Kong Tel (852) 2277 6600 Fax: (852) 2868 5307
www.phillip.com.hk
JAPAN: Phillip Securities Japan, Ltd 4‐2 Nihonbashi Kabutocho, Chuo‐ku
Tokyo 103‐0026 Tel: (81) 3 3666 2101 Fax: (81) 3 3664 0141
www.phillip.co.jp
INDONESIA: PT Phillip Securities Indonesia ANZ Tower Level 23B, Jl Jend Sudirman Kav 33A,
Jakarta 10220, Indonesia Tel (62) 21 5790 0800 Fax: (62) 21 5790 0809
www.phillip.co.id
CHINA: Phillip Financial Advisory (Shanghai) Co. Ltd. No 550 Yan An East Road, Ocean Tower Unit 2318
Shanghai 200 001 Tel (86) 21 5169 9200 Fax: (86) 21 6351 2940
www.phillip.com.cn
THAILAND: Phillip Securities (Thailand) Public Co. Ltd. 15th Floor, Vorawat Building, 849 Silom Road,
Silom, Bangrak, Bangkok 10500 Thailand Tel (66) 2 2268 0999 Fax: (66) 2 2268 0921
www.phillip.co.th
FRANCE: King & Shaxson Capital Ltd. 3rd Floor, 35 Rue de la Bienfaisance
75008 Paris France Tel (33) 1 4563 3100 Fax : (33) 1 4563 6017
www.kingandshaxson.com
UNITED KINGDOM: King & Shaxson Ltd. 6th Floor, Candlewick House, 120 Cannon Street
London, EC4N 6AS Tel (44) 20 7929 5300 Fax: (44) 20 7283 6835
www.kingandshaxson.com
UNITED STATES: Phillip Futures Inc. 141 W Jackson Blvd Ste 3050
The Chicago Board of Trade Building Chicago, IL 60604 USA
Tel (1) 312 356 9000 Fax: (1) 312 356 9005
AUSTRALIA: PhillipCapital Australia Level 37, 530 Collins Street
Melbourne, Victoria 3000, Australia Tel: (61) 3 9629 8380 Fax: (61) 3 9614 8309
www.phillipcapital.com.au
SRI LANKA: Asha Phillip Securities Limited Level 4, Millennium House, 46/58 Navam Mawatha,
Colombo 2, Sri Lanka Tel: (94) 11 2429 100 Fax: (94) 11 2429 199
www.ashaphillip.net/home.htm
INDIA: PhillipCapital (India) Private Limited No. 1, 18th Floor, Urmi Estate, 95 Ganpatrao Kadam Marg, Lower Parel West, Mumbai 400013
Tel: (9122) 2300 2999 Fax: (9122) 6667 9955 www.phillipcapital.in
Management(91 22) 2483 1919
Kinshuk Bharti Tiwari (Head – Institutional Equity) (91 22) 6667 9946(91 22) 6667 9735
Research Infrastructure & IT Services Strategy
Dhawal Doshi (9122) 6667 9769 Vibhor Singhal (9122) 6667 9949 Naveen Kulkarni, CFA, FRM (9122) 6667 9947Nitesh Sharma, CFA (9122) 6667 9965 Logistics, Transportation & Midcap Anindya Bhowmik (9122) 6667 9764Agri Inputs Vikram Suryavanshi (9122) 6667 9951 TelecomGauri Anand (9122) 6667 9943 Media Naveen Kulkarni, CFA, FRM (9122) 6667 9947Banking, NBFCs Manoj Behera (9122) 6667 9973 Manoj Behera (9122) 6667 9973Manish Agarwalla (9122) 6667 9962 Metals TechnicalsPradeep Agrawal (9122) 6667 9953 Dhawal Doshi (9122) 6667 9769 Subodh Gupta, CMT (9122) 6667 9762Paresh Jain (9122) 6667 9948 Yash Doshi (9122) 6667 9987 Production ManagerConsumer Midcap Ganesh Deorukhkar (9122) 6667 9966Naveen Kulkarni, CFA, FRM (9122) 6667 9947 Amol Rao (9122) 6667 9952 EditorJubil Jain (9122) 6667 9766 Oil & Gas Roshan Sony 98199 72726Cement Sabri Hazarika (9122) 6667 9756 Sr. Manager – Equities SupportVaibhav Agarwal (9122) 6667 9967 Pharma & Speciality Chem Rosie Ferns (9122) 6667 9971Economics Surya Patra (9122) 6667 9768Anjali Verma (9122) 6667 9969 Mehul Sheth (9122) 6667 9996Engineering, Capital Goods Mid‐Caps & Database ManagerJonas Bhutta (9122) 6667 9759 Deepak Agarwal (9122) 6667 9944Hrishikesh Bhagat (9122) 6667 9986Sales & Distribution Ashvin Patil (9122) 6667 9991 Sales Trader Zarine Damania (9122) 6667 9976Shubhangi Agrawal (9122) 6667 9964 Dilesh Doshi (9122) 6667 9747 Kishor Binwal (9122) 6667 9989 Suniil Pandit (9122) 6667 9745Bhavin Shah (9122) 6667 9974 ExecutionAshka Mehta Gulati (9122) 6667 9934 Mayur Shah (9122) 6667 9945
Corporate Communications
Vineet Bhatnagar (Managing Director)
Jignesh Shah (Head – Equity Derivatives)
Automobiles
Page | 17 | PHILLIPCAPITAL INDIA RESEARCH
PENNAR ENGINEERED BUILDING SYSTEMS LTD INITIATING COVERAGE
Disclosures and Disclaimers PhillipCapital (India) Pvt. Ltd. has three independent equity research groups: Institutional Equities, Institutional Equity Derivatives, and Private Client Group. This report has been prepared by Institutional Equities Group. The views and opinions expressed in this document may, may not match, or may be contrary at times with the views, estimates, rating, and target price of the other equity research groups of PhillipCapital (India) Pvt. Ltd.
This report is issued by PhillipCapital (India) Pvt. Ltd., which is regulated by the SEBI. PhillipCapital (India) Pvt. Ltd. is a subsidiary of Phillip (Mauritius) Pvt. Ltd. References to "PCIPL" in this report shall mean PhillipCapital (India) Pvt. Ltd unless otherwise stated. This report is prepared and distributed by PCIPL for information purposes only, and neither the information contained herein, nor any opinion expressed should be construed or deemed to be construed as solicitation or as offering advice for the purposes of the purchase or sale of any security, investment, or derivatives. The information and opinions contained in the report were considered by PCIPL to be valid when published. The report also contains information provided to PCIPL by third parties. The source of such information will usually be disclosed in the report. Whilst PCIPL has taken all reasonable steps to ensure that this information is correct, PCIPL does not offer any warranty as to the accuracy or completeness of such information. Any person placing reliance on the report to undertake trading does so entirely at his or her own risk and PCIPL does not accept any liability as a result. Securities and Derivatives markets may be subject to rapid and unexpected price movements and past performance is not necessarily an indication of future performance.
This report does not regard the specific investment objectives, financial situation, and the particular needs of any specific person who may receive this report. Investors must undertake independent analysis with their own legal, tax, and financial advisors and reach their own conclusions regarding the appropriateness of investing in any securities or investment strategies discussed or recommended in this report and should understand that statements regarding future prospects may not be realised. Under no circumstances can it be used or considered as an offer to sell or as a solicitation of any offer to buy or sell the securities mentioned within it. The information contained in the research reports may have been taken from trade and statistical services and other sources, which PCIL believe is reliable. PhillipCapital (India) Pvt. Ltd. or any of its group/associate/affiliate companies do not guarantee that such information is accurate or complete and it should not be relied upon as such. Any opinions expressed reflect judgments at this date and are subject to change without notice.
Important: These disclosures and disclaimers must be read in conjunction with the research report of which it forms part. Receipt and use of the research report is subject to all aspects of these disclosures and disclaimers. Additional information about the issuers and securities discussed in this research report is available on request.
Certifications: The research analyst(s) who prepared this research report hereby certifies that the views expressed in this research report accurately reflect the research analyst’s personal views about all of the subject issuers and/or securities, that the analyst(s) have no known conflict of interest and no part of the research analyst’s compensation was, is, or will be, directly or indirectly, related to the specific views or recommendations contained in this research report.
Additional Disclosures of Interest: Unless specifically mentioned in Point No. 9 below: 1. The Research Analyst(s), PCIL, or its associates or relatives of the Research Analyst does not have any financial interest in the company(ies) covered in
this report. 2. The Research Analyst, PCIL or its associates or relatives of the Research Analyst affiliates collectively do not hold more than 1% of the securities of the
company (ies)covered in this report as of the end of the month immediately preceding the distribution of the research report. 3. The Research Analyst, his/her associate, his/her relative, and PCIL, do not have any other material conflict of interest at the time of publication of this
research report. 4. The Research Analyst, PCIL, and its associates have not received compensation for investment banking or merchant banking or brokerage services or for
any other products or services from the company(ies) covered in this report, in the past twelve months. 5. The Research Analyst, PCIL or its associates have not managed or co‐managed in the previous twelve months, a private or public offering of securities for
the company (ies) covered in this report. 6. PCIL or its associates have not received compensation or other benefits from the company(ies) covered in this report or from any third party, in
connection with the research report. 7. The Research Analyst has not served as an Officer, Director, or employee of the company (ies) covered in the Research report. 8. The Research Analyst and PCIL has not been engaged in market making activity for the company(ies) covered in the Research report. 9. Details of PCIL, Research Analyst and its associates pertaining to the companies covered in the Research report: Sr. no. Particulars Yes/No
1 Whether compensation has been received from the company(ies) covered in the Research report in the past 12 months for investment banking transaction by PCIL
No
2 Whether Research Analyst, PCIL or its associates or relatives of the Research Analyst affiliates collectively hold more than 1% of thecompany(ies) covered in the Research report
No
3 Whether compensation has been received by PCIL or its associates from the company(ies) covered in the Research report No4 PCIL or its affiliates have managed or co‐managed in the previous twelve months a private or public offering of securities for the
company(ies) covered in the Research report No
5 Research Analyst, his associate, PCIL or its associates have received compensation for investment banking or merchant banking or brokerage services or for any other products or services from the company(ies) covered in the Research report, in the last twelve months
No
Independence: PhillipCapital (India) Pvt. Ltd. has not had an investment banking relationship with, and has not received any compensation for investment banking services from, the subject issuers in the past twelve (12) months, and PhillipCapital (India) Pvt. Ltd does not anticipate receiving or intend to seek compensation for investment banking services from the subject issuers in the next three (3) months. PhillipCapital (India) Pvt. Ltd is not a market maker in the securities mentioned in this research report, although it, or its affiliates/employees, may have positions in, purchase or sell, or be materially interested in any of the securities covered in the report.
Suitability and Risks: This research report is for informational purposes only and is not tailored to the specific investment objectives, financial situation or particular requirements of any individual recipient hereof. Certain securities may give rise to substantial risks and may not be suitable for certain investors. Each investor must make its own determination as to the appropriateness of any securities referred to in this research report based upon the legal, tax and accounting considerations applicable to such investor and its own investment objectives or strategy, its financial situation and its investing experience. The value of any security may be positively or adversely affected by changes in foreign exchange or interest rates, as well as by other financial, economic, or political factors. Past performance is not necessarily indicative of future performance or results.
Page | 18 | PHILLIPCAPITAL INDIA RESEARCH
PENNAR ENGINEERED BUILDING SYSTEMS LTD INITIATING COVERAGE
Sources, Completeness and Accuracy: The material herein is based upon information obtained from sources that PCIPL and the research analyst believe to be reliable, but neither PCIPL nor the research analyst represents or guarantees that the information contained herein is accurate or complete and it should not be relied upon as such. Opinions expressed herein are current opinions as of the date appearing on this material, and are subject to change without notice. Furthermore, PCIPL is under no obligation to update or keep the information current. Without limiting any of the foregoing, in no event shall PCIL, any of its affiliates/employees or any third party involved in, or related to computing or compiling the information have any liability for any damages of any kind including but not limited to any direct or consequential loss or damage, however arising, from the use of this document.
Copyright: The copyright in this research report belongs exclusively to PCIPL. All rights are reserved. Any unauthorised use or disclosure is prohibited. No reprinting or reproduction, in whole or in part, is permitted without the PCIPL’s prior consent, except that a recipient may reprint it for internal circulation only and only if it is reprinted in its entirety.
Caution: Risk of loss in trading/investment can be substantial and even more than the amount / margin given by you. The recipient should carefully consider whether trading/investment is appropriate for the recipient in light of the recipient’s experience, objectives, financial resources and other relevant circumstances. PCIPL and any of its employees, directors, associates, group entities, or affiliates shall not be liable for losses, if any, incurred by the recipient. The recipient is further cautioned that trading/investments in financial markets are subject to market risks and are advised to seek trading/investment advice before investing. There is no guarantee/assurance as to returns or profits or capital protection or appreciation. PCIPL and any of its employees, directors, associates, group entities, affiliates are not inducing the recipient for trading/investing in the financial market(s). Trading/Investment decision is the sole responsibility of the recipient.
For U.S. persons only: This research report is a product of PhillipCapital (India) Pvt Ltd., which is the employer of the research analyst(s) who has prepared the research report. The research analyst(s) preparing the research report is/are resident outside the United States (U.S.) and are not associated persons of any U.S.‐regulated broker‐dealer and therefore the analyst(s) is/are not subject to supervision by a U.S. broker‐dealer, and is/are not required to satisfy the regulatory licensing requirements of FINRA or required to otherwise comply with U.S. rules or regulations regarding, among other things, communications with a subject company, public appearances, and trading securities held by a research analyst account.
This report is intended for distribution by PhillipCapital (India) Pvt Ltd. only to "Major Institutional Investors" as defined by Rule 15a‐6(b)(4) of the U.S. Securities and Exchange Act, 1934 (the Exchange Act) and interpretations thereof by the U.S. Securities and Exchange Commission (SEC) in reliance on Rule 15a 6(a)(2). If the recipient of this report is not a Major Institutional Investor as specified above, then it should not act upon this report and return the same to the sender. Further, this report may not be copied, duplicated, and/or transmitted onward to any U.S. person, which is not a Major Institutional Investor.
In reliance on the exemption from registration provided by Rule 15a‐6 of the Exchange Act and interpretations thereof by the SEC in order to conduct certain business with Major Institutional Investors, PhillipCapital (India) Pvt Ltd. has entered into an agreement with a U.S. registered broker‐dealer, Decker & Co, LLC. Transactions in securities discussed in this research report should be effected through Decker & Co, LLC or another U.S. registered broker dealer PhillipCapital (India) Pvt. Ltd. Registered office: No. 1, 18th Floor, Urmi Estate, 95 Ganpatrao Kadam Marg, Lower Parel West, Mumbai 400013