
Pending Appointment and Electronic Wait List …. EWL Greater than 120 Days 20. PC Avg Wait Time 21....
36
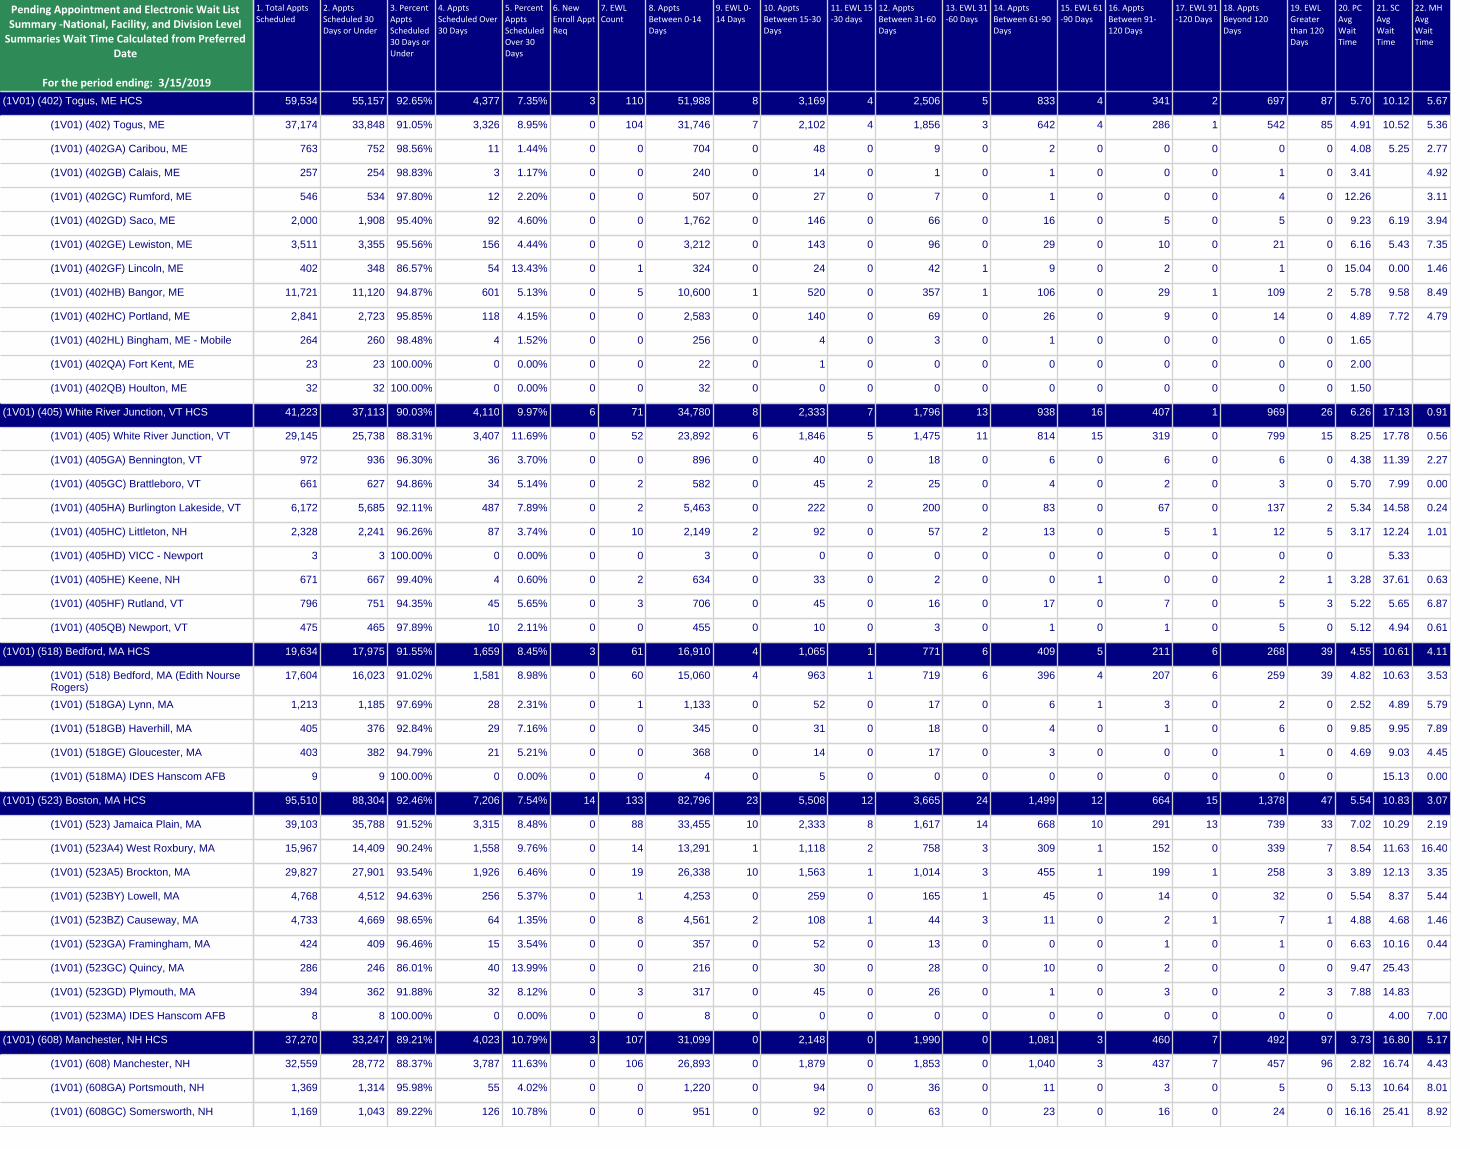
Pending Appointment and Electronic Wait List Summary -National, Facility, and Division Level Summaries Wait Time Calculated from Preferred Date For the period ending: 3/15/2019 1. Total Appts Scheduled 2. Appts Scheduled 30 Days or Under 3. Percent Appts Scheduled 30 Days or Under 4. Appts Scheduled Over 30 Days 5. Percent Appts Scheduled Over 30 Days 6. New Enroll Appt Req 7. EWL Count 8. Appts Between 0-14 Days 9. EWL 0- 14 Days 10. Appts Between 15-30 Days 11. EWL 15 -30 days 12. Appts Between 31-60 Days 13. EWL 31 -60 Days 14. Appts Between 61-90 Days 15. EWL 61 -90 Days 16. Appts Between 91- 120 Days 17. EWL 91 -120 Days 18. Appts Beyond 120 Days 19. EWL Greater than 120 Days 20. PC Avg Wait Time 21. SC Avg Wait Time 22. MH Avg Wait Time (1V01) (402) Togus, ME HCS 59,534 55,157 92.65% 4,377 7.35% 3 110 51,988 8 3,169 4 2,506 5 833 4 341 2 697 87 5.70 10.12 5.67 (1V01) (402) Togus, ME 37,174 33,848 91.05% 3,326 8.95% 0 104 31,746 7 2,102 4 1,856 3 642 4 286 1 542 85 4.91 10.52 5.36 (1V01) (402GA) Caribou, ME 763 752 98.56% 11 1.44% 0 0 704 0 48 0 9 0 2 0 0 0 0 0 4.08 5.25 2.77 (1V01) (402GB) Calais, ME 257 254 98.83% 3 1.17% 0 0 240 0 14 0 1 0 1 0 0 0 1 0 3.41 4.92 (1V01) (402GC) Rumford, ME 546 534 97.80% 12 2.20% 0 0 507 0 27 0 7 0 1 0 0 0 4 0 12.26 3.11 (1V01) (402GD) Saco, ME 2,000 1,908 95.40% 92 4.60% 0 0 1,762 0 146 0 66 0 16 0 5 0 5 0 9.23 6.19 3.94 (1V01) (402GE) Lewiston, ME 3,511 3,355 95.56% 156 4.44% 0 0 3,212 0 143 0 96 0 29 0 10 0 21 0 6.16 5.43 7.35 (1V01) (402GF) Lincoln, ME 402 348 86.57% 54 13.43% 0 1 324 0 24 0 42 1 9 0 2 0 1 0 15.04 0.00 1.46 (1V01) (402HB) Bangor, ME 11,721 11,120 94.87% 601 5.13% 0 5 10,600 1 520 0 357 1 106 0 29 1 109 2 5.78 9.58 8.49 (1V01) (402HC) Portland, ME 2,841 2,723 95.85% 118 4.15% 0 0 2,583 0 140 0 69 0 26 0 9 0 14 0 4.89 7.72 4.79 (1V01) (402HL) Bingham, ME - Mobile 264 260 98.48% 4 1.52% 0 0 256 0 4 0 3 0 1 0 0 0 0 0 1.65 (1V01) (402QA) Fort Kent, ME 23 23 100.00% 0 0.00% 0 0 22 0 1 0 0 0 0 0 0 0 0 0 2.00 (1V01) (402QB) Houlton, ME 32 32 100.00% 0 0.00% 0 0 32 0 0 0 0 0 0 0 0 0 0 0 1.50 (1V01) (405) White River Junction, VT HCS 41,223 37,113 90.03% 4,110 9.97% 6 71 34,780 8 2,333 7 1,796 13 938 16 407 1 969 26 6.26 17.13 0.91 (1V01) (405) White River Junction, VT 29,145 25,738 88.31% 3,407 11.69% 0 52 23,892 6 1,846 5 1,475 11 814 15 319 0 799 15 8.25 17.78 0.56 (1V01) (405GA) Bennington, VT 972 936 96.30% 36 3.70% 0 0 896 0 40 0 18 0 6 0 6 0 6 0 4.38 11.39 2.27 (1V01) (405GC) Brattleboro, VT 661 627 94.86% 34 5.14% 0 2 582 0 45 2 25 0 4 0 2 0 3 0 5.70 7.99 0.00 (1V01) (405HA) Burlington Lakeside, VT 6,172 5,685 92.11% 487 7.89% 0 2 5,463 0 222 0 200 0 83 0 67 0 137 2 5.34 14.58 0.24 (1V01) (405HC) Littleton, NH 2,328 2,241 96.26% 87 3.74% 0 10 2,149 2 92 0 57 2 13 0 5 1 12 5 3.17 12.24 1.01 (1V01) (405HD) VICC - Newport 3 3 100.00% 0 0.00% 0 0 3 0 0 0 0 0 0 0 0 0 0 0 5.33 (1V01) (405HE) Keene, NH 671 667 99.40% 4 0.60% 0 2 634 0 33 0 2 0 0 1 0 0 2 1 3.28 37.61 0.63 (1V01) (405HF) Rutland, VT 796 751 94.35% 45 5.65% 0 3 706 0 45 0 16 0 17 0 7 0 5 3 5.22 5.65 6.87 (1V01) (405QB) Newport, VT 475 465 97.89% 10 2.11% 0 0 455 0 10 0 3 0 1 0 1 0 5 0 5.12 4.94 0.61 (1V01) (518) Bedford, MA HCS 19,634 17,975 91.55% 1,659 8.45% 3 61 16,910 4 1,065 1 771 6 409 5 211 6 268 39 4.55 10.61 4.11 (1V01) (518) Bedford, MA (Edith Nourse Rogers) 17,604 16,023 91.02% 1,581 8.98% 0 60 15,060 4 963 1 719 6 396 4 207 6 259 39 4.82 10.63 3.53 (1V01) (518GA) Lynn, MA 1,213 1,185 97.69% 28 2.31% 0 1 1,133 0 52 0 17 0 6 1 3 0 2 0 2.52 4.89 5.79 (1V01) (518GB) Haverhill, MA 405 376 92.84% 29 7.16% 0 0 345 0 31 0 18 0 4 0 1 0 6 0 9.85 9.95 7.89 (1V01) (518GE) Gloucester, MA 403 382 94.79% 21 5.21% 0 0 368 0 14 0 17 0 3 0 0 0 1 0 4.69 9.03 4.45 (1V01) (518MA) IDES Hanscom AFB 9 9 100.00% 0 0.00% 0 0 4 0 5 0 0 0 0 0 0 0 0 0 15.13 0.00 (1V01) (523) Boston, MA HCS 95,510 88,304 92.46% 7,206 7.54% 14 133 82,796 23 5,508 12 3,665 24 1,499 12 664 15 1,378 47 5.54 10.83 3.07 (1V01) (523) Jamaica Plain, MA 39,103 35,788 91.52% 3,315 8.48% 0 88 33,455 10 2,333 8 1,617 14 668 10 291 13 739 33 7.02 10.29 2.19 (1V01) (523A4) West Roxbury, MA 15,967 14,409 90.24% 1,558 9.76% 0 14 13,291 1 1,118 2 758 3 309 1 152 0 339 7 8.54 11.63 16.40 (1V01) (523A5) Brockton, MA 29,827 27,901 93.54% 1,926 6.46% 0 19 26,338 10 1,563 1 1,014 3 455 1 199 1 258 3 3.89 12.13 3.35 (1V01) (523BY) Lowell, MA 4,768 4,512 94.63% 256 5.37% 0 1 4,253 0 259 0 165 1 45 0 14 0 32 0 5.54 8.37 5.44 (1V01) (523BZ) Causeway, MA 4,733 4,669 98.65% 64 1.35% 0 8 4,561 2 108 1 44 3 11 0 2 1 7 1 4.88 4.68 1.46 (1V01) (523GA) Framingham, MA 424 409 96.46% 15 3.54% 0 0 357 0 52 0 13 0 0 0 1 0 1 0 6.63 10.16 0.44 (1V01) (523GC) Quincy, MA 286 246 86.01% 40 13.99% 0 0 216 0 30 0 28 0 10 0 2 0 0 0 9.47 25.43 (1V01) (523GD) Plymouth, MA 394 362 91.88% 32 8.12% 0 3 317 0 45 0 26 0 1 0 3 0 2 3 7.88 14.83 (1V01) (523MA) IDES Hanscom AFB 8 8 100.00% 0 0.00% 0 0 8 0 0 0 0 0 0 0 0 0 0 0 4.00 7.00 (1V01) (608) Manchester, NH HCS 37,270 33,247 89.21% 4,023 10.79% 3 107 31,099 0 2,148 0 1,990 0 1,081 3 460 7 492 97 3.73 16.80 5.17 (1V01) (608) Manchester, NH 32,559 28,772 88.37% 3,787 11.63% 0 106 26,893 0 1,879 0 1,853 0 1,040 3 437 7 457 96 2.82 16.74 4.43 (1V01) (608GA) Portsmouth, NH 1,369 1,314 95.98% 55 4.02% 0 0 1,220 0 94 0 36 0 11 0 3 0 5 0 5.13 10.64 8.01 (1V01) (608GC) Somersworth, NH 1,169 1,043 89.22% 126 10.78% 0 0 951 0 92 0 63 0 23 0 16 0 24 0 16.16 25.41 8.92
Transcript of Pending Appointment and Electronic Wait List …. EWL Greater than 120 Days 20. PC Avg Wait Time 21....
Pending Appointment and Electronic Wait List Summary -National, Facility, and Division Level Summaries Wait Time Calculated from Preferred
Date
For the period ending: 3/15/2019
1. Total Appts Scheduled
2. Appts Scheduled 30 Days or Under
3. Percent Appts Scheduled 30 Days or Under
4. Appts Scheduled Over 30 Days
5. Percent Appts Scheduled Over 30 Days
6. New Enroll Appt Req
7. EWL Count
8. Appts Between 0-14 Days
9. EWL 0-14 Days
10. Appts Between 15-30 Days
11. EWL 15 -30 days
12. Appts Between 31-60 Days
13. EWL 31 -60 Days
14. Appts Between 61-90 Days
15. EWL 61 -90 Days
16. Appts Between 91-120 Days
17. EWL 91 -120 Days
18. Appts Beyond 120 Days
19. EWL Greater than 120 Days
20. PC Avg Wait Time
21. SC Avg Wait Time
22. MH Avg Wait Time
(1V01) (402) Togus, ME HCS 59,534 55,157 92.65% 4,377 7.35% 3 110 51,988 8 3,169 4 2,506 5 833 4 341 2 697 87 5.70 10.12 5.67
(1V01) (402) Togus, ME 37,174 33,848 91.05% 3,326 8.95% 0 104 31,746 7 2,102 4 1,856 3 642 4 286 1 542 85 4.91 10.52 5.36
(1V01) (402GA) Caribou, ME 763 752 98.56% 11 1.44% 0 0 704 0 48 0 9 0 2 0 0 0 0 0 4.08 5.25 2.77
(1V01) (402GB) Calais, ME 257 254 98.83% 3 1.17% 0 0 240 0 14 0 1 0 1 0 0 0 1 0 3.41 4.92
(1V01) (402GC) Rumford, ME 546 534 97.80% 12 2.20% 0 0 507 0 27 0 7 0 1 0 0 0 4 0 12.26 3.11
(1V01) (402GD) Saco, ME 2,000 1,908 95.40% 92 4.60% 0 0 1,762 0 146 0 66 0 16 0 5 0 5 0 9.23 6.19 3.94
(1V01) (402GE) Lewiston, ME 3,511 3,355 95.56% 156 4.44% 0 0 3,212 0 143 0 96 0 29 0 10 0 21 0 6.16 5.43 7.35
(1V01) (402GF) Lincoln, ME 402 348 86.57% 54 13.43% 0 1 324 0 24 0 42 1 9 0 2 0 1 0 15.04 0.00 1.46
(1V01) (402HB) Bangor, ME 11,721 11,120 94.87% 601 5.13% 0 5 10,600 1 520 0 357 1 106 0 29 1 109 2 5.78 9.58 8.49
(1V01) (402HC) Portland, ME 2,841 2,723 95.85% 118 4.15% 0 0 2,583 0 140 0 69 0 26 0 9 0 14 0 4.89 7.72 4.79
(1V01) (402HL) Bingham, ME - Mobile 264 260 98.48% 4 1.52% 0 0 256 0 4 0 3 0 1 0 0 0 0 0 1.65
(1V01) (402QA) Fort Kent, ME 23 23 100.00% 0 0.00% 0 0 22 0 1 0 0 0 0 0 0 0 0 0 2.00
(1V01) (402QB) Houlton, ME 32 32 100.00% 0 0.00% 0 0 32 0 0 0 0 0 0 0 0 0 0 0 1.50
(1V01) (405) White River Junction, VT HCS 41,223 37,113 90.03% 4,110 9.97% 6 71 34,780 8 2,333 7 1,796 13 938 16 407 1 969 26 6.26 17.13 0.91
(1V01) (405) White River Junction, VT 29,145 25,738 88.31% 3,407 11.69% 0 52 23,892 6 1,846 5 1,475 11 814 15 319 0 799 15 8.25 17.78 0.56
(1V01) (405GA) Bennington, VT 972 936 96.30% 36 3.70% 0 0 896 0 40 0 18 0 6 0 6 0 6 0 4.38 11.39 2.27
(1V01) (405GC) Brattleboro, VT 661 627 94.86% 34 5.14% 0 2 582 0 45 2 25 0 4 0 2 0 3 0 5.70 7.99 0.00
(1V01) (405HA) Burlington Lakeside, VT 6,172 5,685 92.11% 487 7.89% 0 2 5,463 0 222 0 200 0 83 0 67 0 137 2 5.34 14.58 0.24
(1V01) (405HC) Littleton, NH 2,328 2,241 96.26% 87 3.74% 0 10 2,149 2 92 0 57 2 13 0 5 1 12 5 3.17 12.24 1.01
(1V01) (405HD) VICC - Newport 3 3 100.00% 0 0.00% 0 0 3 0 0 0 0 0 0 0 0 0 0 0 5.33
(1V01) (405HE) Keene, NH 671 667 99.40% 4 0.60% 0 2 634 0 33 0 2 0 0 1 0 0 2 1 3.28 37.61 0.63
(1V01) (405HF) Rutland, VT 796 751 94.35% 45 5.65% 0 3 706 0 45 0 16 0 17 0 7 0 5 3 5.22 5.65 6.87
(1V01) (405QB) Newport, VT 475 465 97.89% 10 2.11% 0 0 455 0 10 0 3 0 1 0 1 0 5 0 5.12 4.94 0.61
(1V01) (518) Bedford, MA HCS 19,634 17,975 91.55% 1,659 8.45% 3 61 16,910 4 1,065 1 771 6 409 5 211 6 268 39 4.55 10.61 4.11
(1V01) (518) Bedford, MA (Edith Nourse Rogers)
17,604 16,023 91.02% 1,581 8.98% 0 60 15,060 4 963 1 719 6 396 4 207 6 259 39 4.82 10.63 3.53
(1V01) (518GA) Lynn, MA 1,213 1,185 97.69% 28 2.31% 0 1 1,133 0 52 0 17 0 6 1 3 0 2 0 2.52 4.89 5.79
(1V01) (518GB) Haverhill, MA 405 376 92.84% 29 7.16% 0 0 345 0 31 0 18 0 4 0 1 0 6 0 9.85 9.95 7.89
(1V01) (518GE) Gloucester, MA 403 382 94.79% 21 5.21% 0 0 368 0 14 0 17 0 3 0 0 0 1 0 4.69 9.03 4.45
(1V01) (518MA) IDES Hanscom AFB 9 9 100.00% 0 0.00% 0 0 4 0 5 0 0 0 0 0 0 0 0 0 15.13 0.00
(1V01) (523) Boston, MA HCS 95,510 88,304 92.46% 7,206 7.54% 14 133 82,796 23 5,508 12 3,665 24 1,499 12 664 15 1,378 47 5.54 10.83 3.07
(1V01) (523) Jamaica Plain, MA 39,103 35,788 91.52% 3,315 8.48% 0 88 33,455 10 2,333 8 1,617 14 668 10 291 13 739 33 7.02 10.29 2.19
(1V01) (523A4) West Roxbury, MA 15,967 14,409 90.24% 1,558 9.76% 0 14 13,291 1 1,118 2 758 3 309 1 152 0 339 7 8.54 11.63 16.40
(1V01) (523A5) Brockton, MA 29,827 27,901 93.54% 1,926 6.46% 0 19 26,338 10 1,563 1 1,014 3 455 1 199 1 258 3 3.89 12.13 3.35
(1V01) (523BY) Lowell, MA 4,768 4,512 94.63% 256 5.37% 0 1 4,253 0 259 0 165 1 45 0 14 0 32 0 5.54 8.37 5.44
(1V01) (523BZ) Causeway, MA 4,733 4,669 98.65% 64 1.35% 0 8 4,561 2 108 1 44 3 11 0 2 1 7 1 4.88 4.68 1.46
(1V01) (523GA) Framingham, MA 424 409 96.46% 15 3.54% 0 0 357 0 52 0 13 0 0 0 1 0 1 0 6.63 10.16 0.44
(1V01) (523GC) Quincy, MA 286 246 86.01% 40 13.99% 0 0 216 0 30 0 28 0 10 0 2 0 0 0 9.47 25.43
(1V01) (523GD) Plymouth, MA 394 362 91.88% 32 8.12% 0 3 317 0 45 0 26 0 1 0 3 0 2 3 7.88 14.83
(1V01) (523MA) IDES Hanscom AFB 8 8 100.00% 0 0.00% 0 0 8 0 0 0 0 0 0 0 0 0 0 0 4.00 7.00
(1V01) (608) Manchester, NH HCS 37,270 33,247 89.21% 4,023 10.79% 3 107 31,099 0 2,148 0 1,990 0 1,081 3 460 7 492 97 3.73 16.80 5.17
(1V01) (608) Manchester, NH 32,559 28,772 88.37% 3,787 11.63% 0 106 26,893 0 1,879 0 1,853 0 1,040 3 437 7 457 96 2.82 16.74 4.43
(1V01) (608GA) Portsmouth, NH 1,369 1,314 95.98% 55 4.02% 0 0 1,220 0 94 0 36 0 11 0 3 0 5 0 5.13 10.64 8.01
(1V01) (608GC) Somersworth, NH 1,169 1,043 89.22% 126 10.78% 0 0 951 0 92 0 63 0 23 0 16 0 24 0 16.16 25.41 8.92
Pending Appointment and Electronic Wait List Summary -National, Facility, and Division Level Summaries Wait Time Calculated from Preferred
Date
For the period ending: 3/15/2019
1. Total Appts Scheduled
2. Appts Scheduled 30 Days or Under
3. Percent Appts Scheduled 30 Days or Under
4. Appts Scheduled Over 30 Days
5. Percent Appts Scheduled Over 30 Days
6. New Enroll Appt Req
7. EWL Count
8. Appts Between 0-14 Days
9. EWL 0-14 Days
10. Appts Between 15-30 Days
11. EWL 15 -30 days
12. Appts Between 31-60 Days
13. EWL 31 -60 Days
14. Appts Between 61-90 Days
15. EWL 61 -90 Days
16. Appts Between 91-120 Days
17. EWL 91 -120 Days
18. Appts Beyond 120 Days
19. EWL Greater than 120 Days
20. PC Avg Wait Time
21. SC Avg Wait Time
22. MH Avg Wait Time
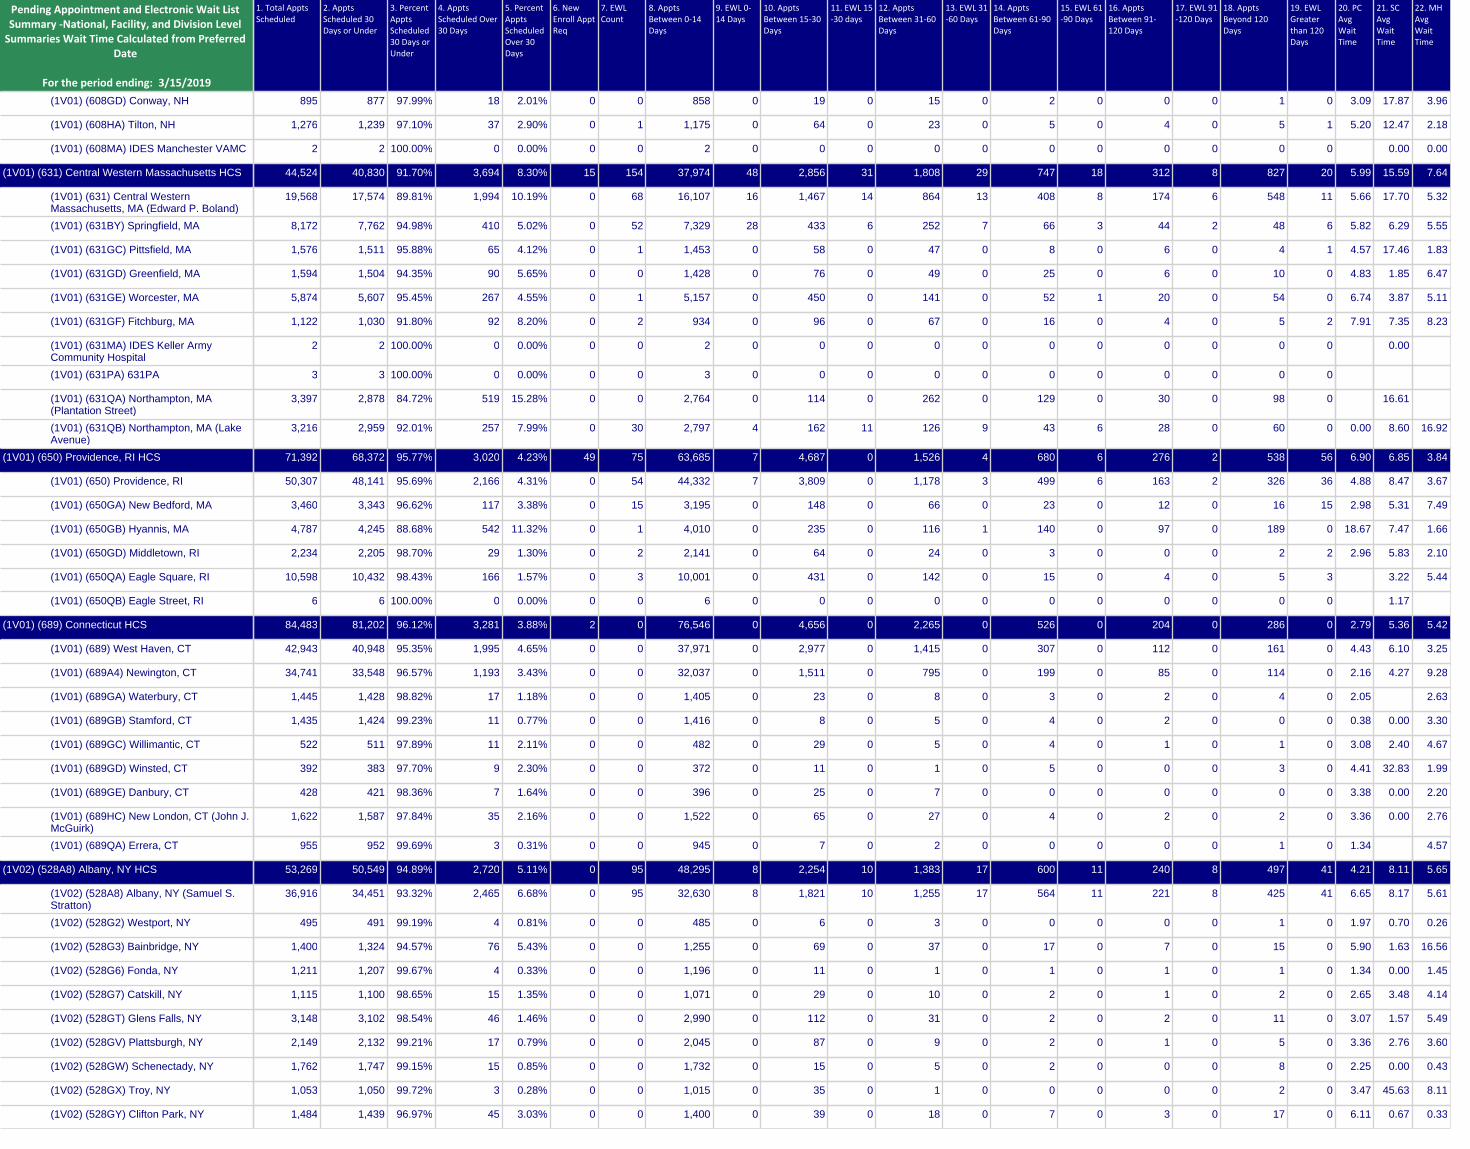
(1V01) (608GD) Conway, NH 895 877 97.99% 18 2.01% 0 0 858 0 19 0 15 0 2 0 0 0 1 0 3.09 17.87 3.96
(1V01) (608HA) Tilton, NH 1,276 1,239 97.10% 37 2.90% 0 1 1,175 0 64 0 23 0 5 0 4 0 5 1 5.20 12.47 2.18
(1V01) (608MA) IDES Manchester VAMC 2 2 100.00% 0 0.00% 0 0 2 0 0 0 0 0 0 0 0 0 0 0 0.00 0.00
(1V01) (631) Central Western Massachusetts HCS 44,524 40,830 91.70% 3,694 8.30% 15 154 37,974 48 2,856 31 1,808 29 747 18 312 8 827 20 5.99 15.59 7.64
(1V01) (631) Central Western Massachusetts, MA (Edward P. Boland)
19,568 17,574 89.81% 1,994 10.19% 0 68 16,107 16 1,467 14 864 13 408 8 174 6 548 11 5.66 17.70 5.32
(1V01) (631BY) Springfield, MA 8,172 7,762 94.98% 410 5.02% 0 52 7,329 28 433 6 252 7 66 3 44 2 48 6 5.82 6.29 5.55
(1V01) (631GC) Pittsfield, MA 1,576 1,511 95.88% 65 4.12% 0 1 1,453 0 58 0 47 0 8 0 6 0 4 1 4.57 17.46 1.83
(1V01) (631GD) Greenfield, MA 1,594 1,504 94.35% 90 5.65% 0 0 1,428 0 76 0 49 0 25 0 6 0 10 0 4.83 1.85 6.47
(1V01) (631GE) Worcester, MA 5,874 5,607 95.45% 267 4.55% 0 1 5,157 0 450 0 141 0 52 1 20 0 54 0 6.74 3.87 5.11
(1V01) (631GF) Fitchburg, MA 1,122 1,030 91.80% 92 8.20% 0 2 934 0 96 0 67 0 16 0 4 0 5 2 7.91 7.35 8.23
(1V01) (631MA) IDES Keller Army Community Hospital
2 2 100.00% 0 0.00% 0 0 2 0 0 0 0 0 0 0 0 0 0 0 0.00
(1V01) (631PA) 631PA 3 3 100.00% 0 0.00% 0 0 3 0 0 0 0 0 0 0 0 0 0 0
(1V01) (631QA) Northampton, MA (Plantation Street)
3,397 2,878 84.72% 519 15.28% 0 0 2,764 0 114 0 262 0 129 0 30 0 98 0 16.61
(1V01) (631QB) Northampton, MA (Lake Avenue)
3,216 2,959 92.01% 257 7.99% 0 30 2,797 4 162 11 126 9 43 6 28 0 60 0 0.00 8.60 16.92
(1V01) (650) Providence, RI HCS 71,392 68,372 95.77% 3,020 4.23% 49 75 63,685 7 4,687 0 1,526 4 680 6 276 2 538 56 6.90 6.85 3.84
(1V01) (650) Providence, RI 50,307 48,141 95.69% 2,166 4.31% 0 54 44,332 7 3,809 0 1,178 3 499 6 163 2 326 36 4.88 8.47 3.67
(1V01) (650GA) New Bedford, MA 3,460 3,343 96.62% 117 3.38% 0 15 3,195 0 148 0 66 0 23 0 12 0 16 15 2.98 5.31 7.49
(1V01) (650GB) Hyannis, MA 4,787 4,245 88.68% 542 11.32% 0 1 4,010 0 235 0 116 1 140 0 97 0 189 0 18.67 7.47 1.66
(1V01) (650GD) Middletown, RI 2,234 2,205 98.70% 29 1.30% 0 2 2,141 0 64 0 24 0 3 0 0 0 2 2 2.96 5.83 2.10
(1V01) (650QA) Eagle Square, RI 10,598 10,432 98.43% 166 1.57% 0 3 10,001 0 431 0 142 0 15 0 4 0 5 3 3.22 5.44
(1V01) (650QB) Eagle Street, RI 6 6 100.00% 0 0.00% 0 0 6 0 0 0 0 0 0 0 0 0 0 0 1.17
(1V01) (689) Connecticut HCS 84,483 81,202 96.12% 3,281 3.88% 2 0 76,546 0 4,656 0 2,265 0 526 0 204 0 286 0 2.79 5.36 5.42
(1V01) (689) West Haven, CT 42,943 40,948 95.35% 1,995 4.65% 0 0 37,971 0 2,977 0 1,415 0 307 0 112 0 161 0 4.43 6.10 3.25
(1V01) (689A4) Newington, CT 34,741 33,548 96.57% 1,193 3.43% 0 0 32,037 0 1,511 0 795 0 199 0 85 0 114 0 2.16 4.27 9.28
(1V01) (689GA) Waterbury, CT 1,445 1,428 98.82% 17 1.18% 0 0 1,405 0 23 0 8 0 3 0 2 0 4 0 2.05 2.63
(1V01) (689GB) Stamford, CT 1,435 1,424 99.23% 11 0.77% 0 0 1,416 0 8 0 5 0 4 0 2 0 0 0 0.38 0.00 3.30
(1V01) (689GC) Willimantic, CT 522 511 97.89% 11 2.11% 0 0 482 0 29 0 5 0 4 0 1 0 1 0 3.08 2.40 4.67
(1V01) (689GD) Winsted, CT 392 383 97.70% 9 2.30% 0 0 372 0 11 0 1 0 5 0 0 0 3 0 4.41 32.83 1.99
(1V01) (689GE) Danbury, CT 428 421 98.36% 7 1.64% 0 0 396 0 25 0 7 0 0 0 0 0 0 0 3.38 0.00 2.20
(1V01) (689HC) New London, CT (John J. McGuirk)
1,622 1,587 97.84% 35 2.16% 0 0 1,522 0 65 0 27 0 4 0 2 0 2 0 3.36 0.00 2.76
(1V01) (689QA) Errera, CT 955 952 99.69% 3 0.31% 0 0 945 0 7 0 2 0 0 0 0 0 1 0 1.34 4.57
(1V02) (528A8) Albany, NY HCS 53,269 50,549 94.89% 2,720 5.11% 0 95 48,295 8 2,254 10 1,383 17 600 11 240 8 497 41 4.21 8.11 5.65
(1V02) (528A8) Albany, NY (Samuel S. Stratton)
36,916 34,451 93.32% 2,465 6.68% 0 95 32,630 8 1,821 10 1,255 17 564 11 221 8 425 41 6.65 8.17 5.61
(1V02) (528G2) Westport, NY 495 491 99.19% 4 0.81% 0 0 485 0 6 0 3 0 0 0 0 0 1 0 1.97 0.70 0.26
(1V02) (528G3) Bainbridge, NY 1,400 1,324 94.57% 76 5.43% 0 0 1,255 0 69 0 37 0 17 0 7 0 15 0 5.90 1.63 16.56
(1V02) (528G6) Fonda, NY 1,211 1,207 99.67% 4 0.33% 0 0 1,196 0 11 0 1 0 1 0 1 0 1 0 1.34 0.00 1.45
(1V02) (528G7) Catskill, NY 1,115 1,100 98.65% 15 1.35% 0 0 1,071 0 29 0 10 0 2 0 1 0 2 0 2.65 3.48 4.14
(1V02) (528GT) Glens Falls, NY 3,148 3,102 98.54% 46 1.46% 0 0 2,990 0 112 0 31 0 2 0 2 0 11 0 3.07 1.57 5.49
(1V02) (528GV) Plattsburgh, NY 2,149 2,132 99.21% 17 0.79% 0 0 2,045 0 87 0 9 0 2 0 1 0 5 0 3.36 2.76 3.60
(1V02) (528GW) Schenectady, NY 1,762 1,747 99.15% 15 0.85% 0 0 1,732 0 15 0 5 0 2 0 0 0 8 0 2.25 0.00 0.43
(1V02) (528GX) Troy, NY 1,053 1,050 99.72% 3 0.28% 0 0 1,015 0 35 0 1 0 0 0 0 0 2 0 3.47 45.63 8.11
(1V02) (528GY) Clifton Park, NY 1,484 1,439 96.97% 45 3.03% 0 0 1,400 0 39 0 18 0 7 0 3 0 17 0 6.11 0.67 0.33
Pending Appointment and Electronic Wait List Summary -National, Facility, and Division Level Summaries Wait Time Calculated from Preferred
Date
For the period ending: 3/15/2019
1. Total Appts Scheduled
2. Appts Scheduled 30 Days or Under
3. Percent Appts Scheduled 30 Days or Under
4. Appts Scheduled Over 30 Days
5. Percent Appts Scheduled Over 30 Days
6. New Enroll Appt Req
7. EWL Count
8. Appts Between 0-14 Days
9. EWL 0-14 Days
10. Appts Between 15-30 Days
11. EWL 15 -30 days
12. Appts Between 31-60 Days
13. EWL 31 -60 Days
14. Appts Between 61-90 Days
15. EWL 61 -90 Days
16. Appts Between 91-120 Days
17. EWL 91 -120 Days
18. Appts Beyond 120 Days
19. EWL Greater than 120 Days
20. PC Avg Wait Time
21. SC Avg Wait Time
22. MH Avg Wait Time
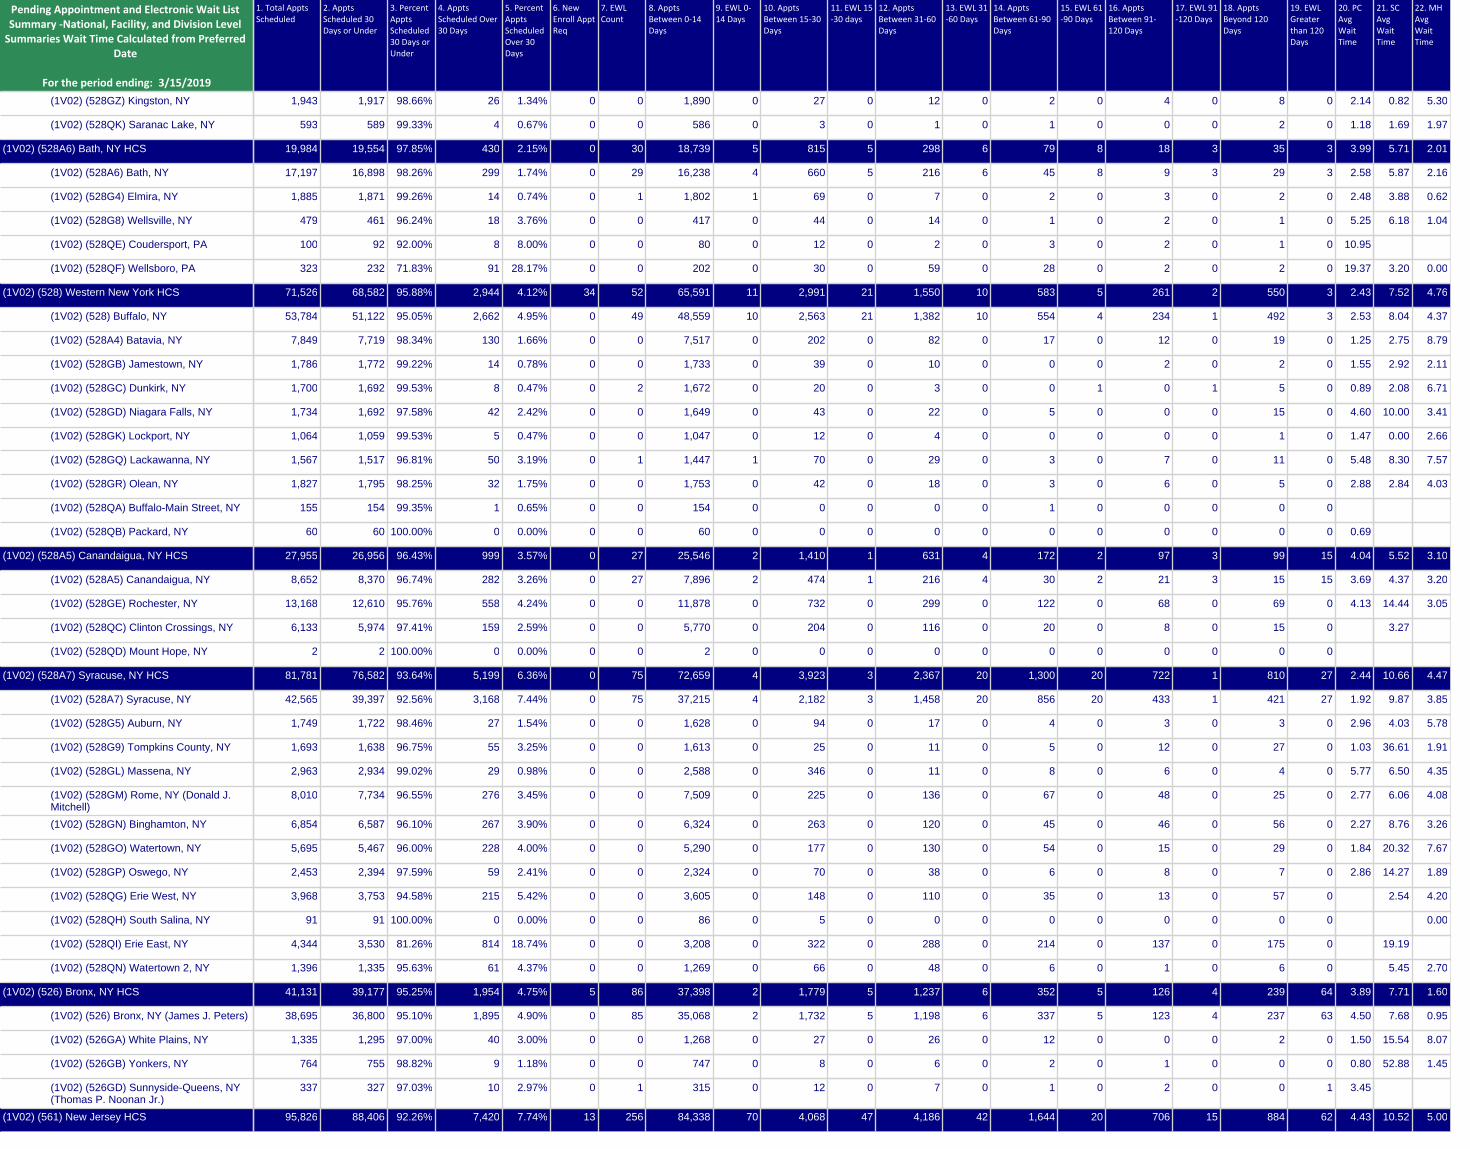
(1V02) (528GZ) Kingston, NY 1,943 1,917 98.66% 26 1.34% 0 0 1,890 0 27 0 12 0 2 0 4 0 8 0 2.14 0.82 5.30
(1V02) (528QK) Saranac Lake, NY 593 589 99.33% 4 0.67% 0 0 586 0 3 0 1 0 1 0 0 0 2 0 1.18 1.69 1.97
(1V02) (528A6) Bath, NY HCS 19,984 19,554 97.85% 430 2.15% 0 30 18,739 5 815 5 298 6 79 8 18 3 35 3 3.99 5.71 2.01
(1V02) (528A6) Bath, NY 17,197 16,898 98.26% 299 1.74% 0 29 16,238 4 660 5 216 6 45 8 9 3 29 3 2.58 5.87 2.16
(1V02) (528G4) Elmira, NY 1,885 1,871 99.26% 14 0.74% 0 1 1,802 1 69 0 7 0 2 0 3 0 2 0 2.48 3.88 0.62
(1V02) (528G8) Wellsville, NY 479 461 96.24% 18 3.76% 0 0 417 0 44 0 14 0 1 0 2 0 1 0 5.25 6.18 1.04
(1V02) (528QE) Coudersport, PA 100 92 92.00% 8 8.00% 0 0 80 0 12 0 2 0 3 0 2 0 1 0 10.95
(1V02) (528QF) Wellsboro, PA 323 232 71.83% 91 28.17% 0 0 202 0 30 0 59 0 28 0 2 0 2 0 19.37 3.20 0.00
(1V02) (528) Western New York HCS 71,526 68,582 95.88% 2,944 4.12% 34 52 65,591 11 2,991 21 1,550 10 583 5 261 2 550 3 2.43 7.52 4.76
(1V02) (528) Buffalo, NY 53,784 51,122 95.05% 2,662 4.95% 0 49 48,559 10 2,563 21 1,382 10 554 4 234 1 492 3 2.53 8.04 4.37
(1V02) (528A4) Batavia, NY 7,849 7,719 98.34% 130 1.66% 0 0 7,517 0 202 0 82 0 17 0 12 0 19 0 1.25 2.75 8.79
(1V02) (528GB) Jamestown, NY 1,786 1,772 99.22% 14 0.78% 0 0 1,733 0 39 0 10 0 0 0 2 0 2 0 1.55 2.92 2.11
(1V02) (528GC) Dunkirk, NY 1,700 1,692 99.53% 8 0.47% 0 2 1,672 0 20 0 3 0 0 1 0 1 5 0 0.89 2.08 6.71
(1V02) (528GD) Niagara Falls, NY 1,734 1,692 97.58% 42 2.42% 0 0 1,649 0 43 0 22 0 5 0 0 0 15 0 4.60 10.00 3.41
(1V02) (528GK) Lockport, NY 1,064 1,059 99.53% 5 0.47% 0 0 1,047 0 12 0 4 0 0 0 0 0 1 0 1.47 0.00 2.66
(1V02) (528GQ) Lackawanna, NY 1,567 1,517 96.81% 50 3.19% 0 1 1,447 1 70 0 29 0 3 0 7 0 11 0 5.48 8.30 7.57
(1V02) (528GR) Olean, NY 1,827 1,795 98.25% 32 1.75% 0 0 1,753 0 42 0 18 0 3 0 6 0 5 0 2.88 2.84 4.03
(1V02) (528QA) Buffalo-Main Street, NY 155 154 99.35% 1 0.65% 0 0 154 0 0 0 0 0 1 0 0 0 0 0
(1V02) (528QB) Packard, NY 60 60 100.00% 0 0.00% 0 0 60 0 0 0 0 0 0 0 0 0 0 0 0.69
(1V02) (528A5) Canandaigua, NY HCS 27,955 26,956 96.43% 999 3.57% 0 27 25,546 2 1,410 1 631 4 172 2 97 3 99 15 4.04 5.52 3.10
(1V02) (528A5) Canandaigua, NY 8,652 8,370 96.74% 282 3.26% 0 27 7,896 2 474 1 216 4 30 2 21 3 15 15 3.69 4.37 3.20
(1V02) (528GE) Rochester, NY 13,168 12,610 95.76% 558 4.24% 0 0 11,878 0 732 0 299 0 122 0 68 0 69 0 4.13 14.44 3.05
(1V02) (528QC) Clinton Crossings, NY 6,133 5,974 97.41% 159 2.59% 0 0 5,770 0 204 0 116 0 20 0 8 0 15 0 3.27
(1V02) (528QD) Mount Hope, NY 2 2 100.00% 0 0.00% 0 0 2 0 0 0 0 0 0 0 0 0 0 0
(1V02) (528A7) Syracuse, NY HCS 81,781 76,582 93.64% 5,199 6.36% 0 75 72,659 4 3,923 3 2,367 20 1,300 20 722 1 810 27 2.44 10.66 4.47
(1V02) (528A7) Syracuse, NY 42,565 39,397 92.56% 3,168 7.44% 0 75 37,215 4 2,182 3 1,458 20 856 20 433 1 421 27 1.92 9.87 3.85
(1V02) (528G5) Auburn, NY 1,749 1,722 98.46% 27 1.54% 0 0 1,628 0 94 0 17 0 4 0 3 0 3 0 2.96 4.03 5.78
(1V02) (528G9) Tompkins County, NY 1,693 1,638 96.75% 55 3.25% 0 0 1,613 0 25 0 11 0 5 0 12 0 27 0 1.03 36.61 1.91
(1V02) (528GL) Massena, NY 2,963 2,934 99.02% 29 0.98% 0 0 2,588 0 346 0 11 0 8 0 6 0 4 0 5.77 6.50 4.35
(1V02) (528GM) Rome, NY (Donald J. Mitchell)
8,010 7,734 96.55% 276 3.45% 0 0 7,509 0 225 0 136 0 67 0 48 0 25 0 2.77 6.06 4.08
(1V02) (528GN) Binghamton, NY 6,854 6,587 96.10% 267 3.90% 0 0 6,324 0 263 0 120 0 45 0 46 0 56 0 2.27 8.76 3.26
(1V02) (528GO) Watertown, NY 5,695 5,467 96.00% 228 4.00% 0 0 5,290 0 177 0 130 0 54 0 15 0 29 0 1.84 20.32 7.67
(1V02) (528GP) Oswego, NY 2,453 2,394 97.59% 59 2.41% 0 0 2,324 0 70 0 38 0 6 0 8 0 7 0 2.86 14.27 1.89
(1V02) (528QG) Erie West, NY 3,968 3,753 94.58% 215 5.42% 0 0 3,605 0 148 0 110 0 35 0 13 0 57 0 2.54 4.20
(1V02) (528QH) South Salina, NY 91 91 100.00% 0 0.00% 0 0 86 0 5 0 0 0 0 0 0 0 0 0 0.00
(1V02) (528QI) Erie East, NY 4,344 3,530 81.26% 814 18.74% 0 0 3,208 0 322 0 288 0 214 0 137 0 175 0 19.19
(1V02) (528QN) Watertown 2, NY 1,396 1,335 95.63% 61 4.37% 0 0 1,269 0 66 0 48 0 6 0 1 0 6 0 5.45 2.70
(1V02) (526) Bronx, NY HCS 41,131 39,177 95.25% 1,954 4.75% 5 86 37,398 2 1,779 5 1,237 6 352 5 126 4 239 64 3.89 7.71 1.60
(1V02) (526) Bronx, NY (James J. Peters) 38,695 36,800 95.10% 1,895 4.90% 0 85 35,068 2 1,732 5 1,198 6 337 5 123 4 237 63 4.50 7.68 0.95
(1V02) (526GA) White Plains, NY 1,335 1,295 97.00% 40 3.00% 0 0 1,268 0 27 0 26 0 12 0 0 0 2 0 1.50 15.54 8.07
(1V02) (526GB) Yonkers, NY 764 755 98.82% 9 1.18% 0 0 747 0 8 0 6 0 2 0 1 0 0 0 0.80 52.88 1.45
(1V02) (526GD) Sunnyside-Queens, NY (Thomas P. Noonan Jr.)
337 327 97.03% 10 2.97% 0 1 315 0 12 0 7 0 1 0 2 0 0 1 3.45
(1V02) (561) New Jersey HCS 95,826 88,406 92.26% 7,420 7.74% 13 256 84,338 70 4,068 47 4,186 42 1,644 20 706 15 884 62 4.43 10.52 5.00
Pending Appointment and Electronic Wait List Summary -National, Facility, and Division Level Summaries Wait Time Calculated from Preferred
Date
For the period ending: 3/15/2019
1. Total Appts Scheduled
2. Appts Scheduled 30 Days or Under
3. Percent Appts Scheduled 30 Days or Under
4. Appts Scheduled Over 30 Days
5. Percent Appts Scheduled Over 30 Days
6. New Enroll Appt Req
7. EWL Count
8. Appts Between 0-14 Days
9. EWL 0-14 Days
10. Appts Between 15-30 Days
11. EWL 15 -30 days
12. Appts Between 31-60 Days
13. EWL 31 -60 Days
14. Appts Between 61-90 Days
15. EWL 61 -90 Days
16. Appts Between 91-120 Days
17. EWL 91 -120 Days
18. Appts Beyond 120 Days
19. EWL Greater than 120 Days
20. PC Avg Wait Time
21. SC Avg Wait Time
22. MH Avg Wait Time
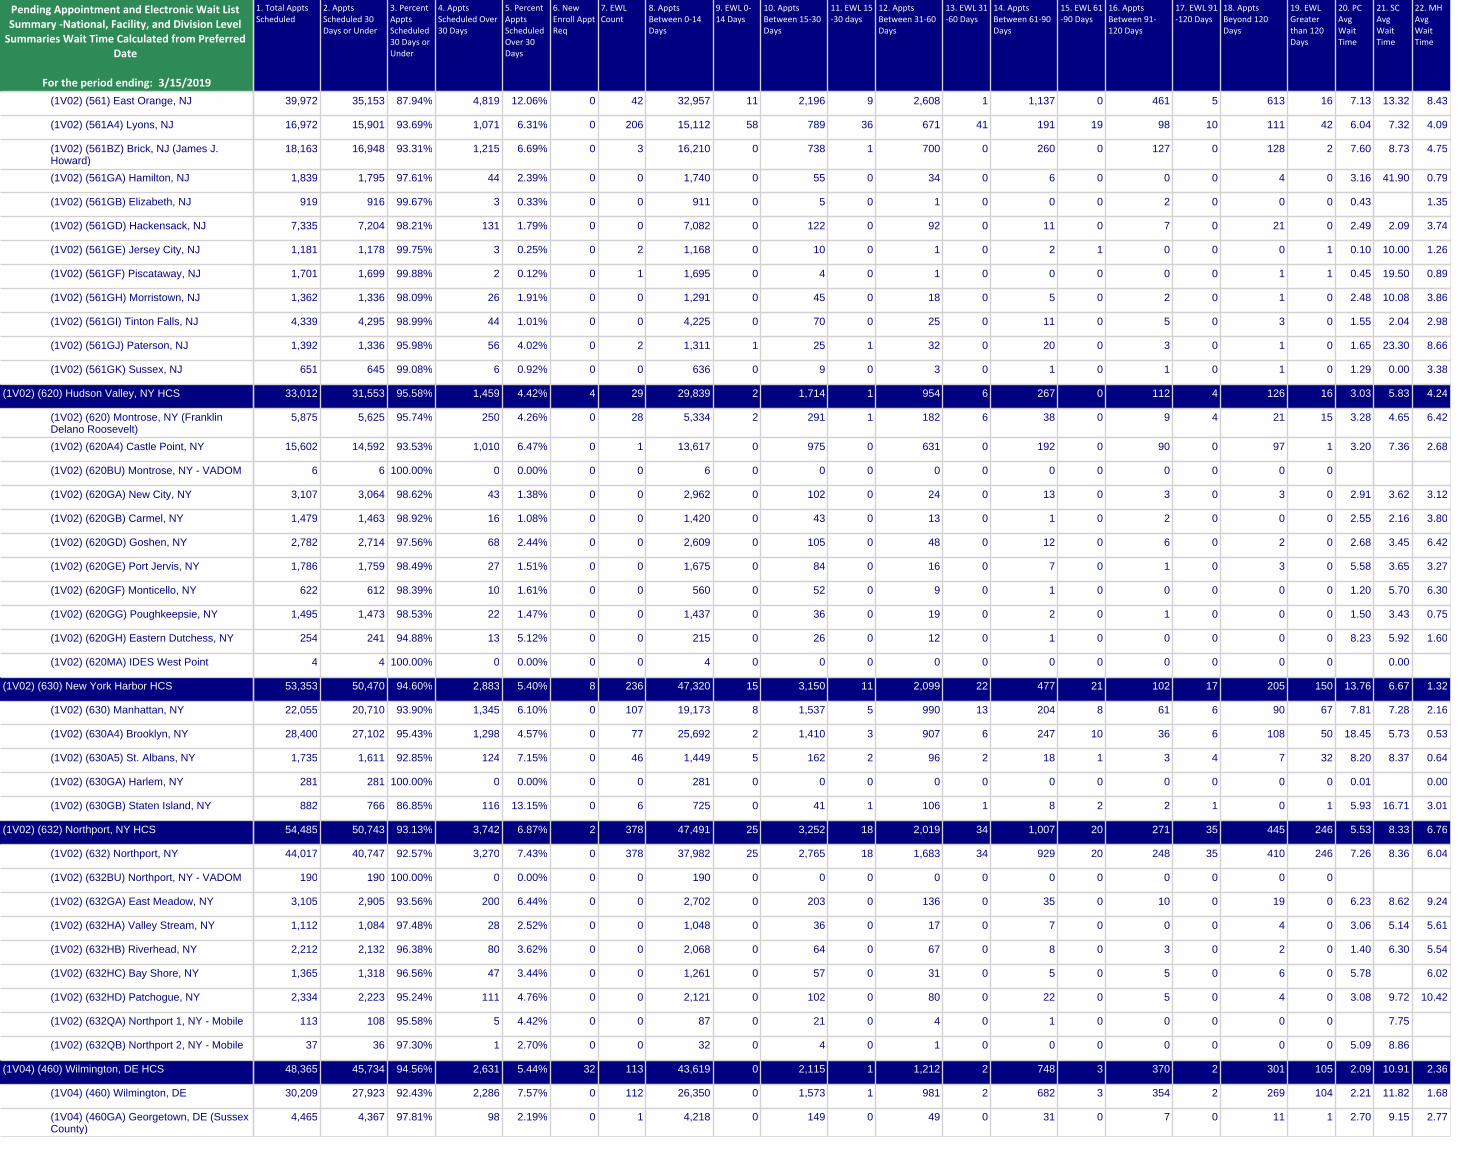
(1V02) (561) East Orange, NJ 39,972 35,153 87.94% 4,819 12.06% 0 42 32,957 11 2,196 9 2,608 1 1,137 0 461 5 613 16 7.13 13.32 8.43
(1V02) (561A4) Lyons, NJ 16,972 15,901 93.69% 1,071 6.31% 0 206 15,112 58 789 36 671 41 191 19 98 10 111 42 6.04 7.32 4.09
(1V02) (561BZ) Brick, NJ (James J. Howard)
18,163 16,948 93.31% 1,215 6.69% 0 3 16,210 0 738 1 700 0 260 0 127 0 128 2 7.60 8.73 4.75
(1V02) (561GA) Hamilton, NJ 1,839 1,795 97.61% 44 2.39% 0 0 1,740 0 55 0 34 0 6 0 0 0 4 0 3.16 41.90 0.79
(1V02) (561GB) Elizabeth, NJ 919 916 99.67% 3 0.33% 0 0 911 0 5 0 1 0 0 0 2 0 0 0 0.43 1.35
(1V02) (561GD) Hackensack, NJ 7,335 7,204 98.21% 131 1.79% 0 0 7,082 0 122 0 92 0 11 0 7 0 21 0 2.49 2.09 3.74
(1V02) (561GE) Jersey City, NJ 1,181 1,178 99.75% 3 0.25% 0 2 1,168 0 10 0 1 0 2 1 0 0 0 1 0.10 10.00 1.26
(1V02) (561GF) Piscataway, NJ 1,701 1,699 99.88% 2 0.12% 0 1 1,695 0 4 0 1 0 0 0 0 0 1 1 0.45 19.50 0.89
(1V02) (561GH) Morristown, NJ 1,362 1,336 98.09% 26 1.91% 0 0 1,291 0 45 0 18 0 5 0 2 0 1 0 2.48 10.08 3.86
(1V02) (561GI) Tinton Falls, NJ 4,339 4,295 98.99% 44 1.01% 0 0 4,225 0 70 0 25 0 11 0 5 0 3 0 1.55 2.04 2.98
(1V02) (561GJ) Paterson, NJ 1,392 1,336 95.98% 56 4.02% 0 2 1,311 1 25 1 32 0 20 0 3 0 1 0 1.65 23.30 8.66
(1V02) (561GK) Sussex, NJ 651 645 99.08% 6 0.92% 0 0 636 0 9 0 3 0 1 0 1 0 1 0 1.29 0.00 3.38
(1V02) (620) Hudson Valley, NY HCS 33,012 31,553 95.58% 1,459 4.42% 4 29 29,839 2 1,714 1 954 6 267 0 112 4 126 16 3.03 5.83 4.24
(1V02) (620) Montrose, NY (Franklin Delano Roosevelt)
5,875 5,625 95.74% 250 4.26% 0 28 5,334 2 291 1 182 6 38 0 9 4 21 15 3.28 4.65 6.42
(1V02) (620A4) Castle Point, NY 15,602 14,592 93.53% 1,010 6.47% 0 1 13,617 0 975 0 631 0 192 0 90 0 97 1 3.20 7.36 2.68
(1V02) (620BU) Montrose, NY - VADOM 6 6 100.00% 0 0.00% 0 0 6 0 0 0 0 0 0 0 0 0 0 0
(1V02) (620GA) New City, NY 3,107 3,064 98.62% 43 1.38% 0 0 2,962 0 102 0 24 0 13 0 3 0 3 0 2.91 3.62 3.12
(1V02) (620GB) Carmel, NY 1,479 1,463 98.92% 16 1.08% 0 0 1,420 0 43 0 13 0 1 0 2 0 0 0 2.55 2.16 3.80
(1V02) (620GD) Goshen, NY 2,782 2,714 97.56% 68 2.44% 0 0 2,609 0 105 0 48 0 12 0 6 0 2 0 2.68 3.45 6.42
(1V02) (620GE) Port Jervis, NY 1,786 1,759 98.49% 27 1.51% 0 0 1,675 0 84 0 16 0 7 0 1 0 3 0 5.58 3.65 3.27
(1V02) (620GF) Monticello, NY 622 612 98.39% 10 1.61% 0 0 560 0 52 0 9 0 1 0 0 0 0 0 1.20 5.70 6.30
(1V02) (620GG) Poughkeepsie, NY 1,495 1,473 98.53% 22 1.47% 0 0 1,437 0 36 0 19 0 2 0 1 0 0 0 1.50 3.43 0.75
(1V02) (620GH) Eastern Dutchess, NY 254 241 94.88% 13 5.12% 0 0 215 0 26 0 12 0 1 0 0 0 0 0 8.23 5.92 1.60
(1V02) (620MA) IDES West Point 4 4 100.00% 0 0.00% 0 0 4 0 0 0 0 0 0 0 0 0 0 0 0.00
(1V02) (630) New York Harbor HCS 53,353 50,470 94.60% 2,883 5.40% 8 236 47,320 15 3,150 11 2,099 22 477 21 102 17 205 150 13.76 6.67 1.32
(1V02) (630) Manhattan, NY 22,055 20,710 93.90% 1,345 6.10% 0 107 19,173 8 1,537 5 990 13 204 8 61 6 90 67 7.81 7.28 2.16
(1V02) (630A4) Brooklyn, NY 28,400 27,102 95.43% 1,298 4.57% 0 77 25,692 2 1,410 3 907 6 247 10 36 6 108 50 18.45 5.73 0.53
(1V02) (630A5) St. Albans, NY 1,735 1,611 92.85% 124 7.15% 0 46 1,449 5 162 2 96 2 18 1 3 4 7 32 8.20 8.37 0.64
(1V02) (630GA) Harlem, NY 281 281 100.00% 0 0.00% 0 0 281 0 0 0 0 0 0 0 0 0 0 0 0.01 0.00
(1V02) (630GB) Staten Island, NY 882 766 86.85% 116 13.15% 0 6 725 0 41 1 106 1 8 2 2 1 0 1 5.93 16.71 3.01
(1V02) (632) Northport, NY HCS 54,485 50,743 93.13% 3,742 6.87% 2 378 47,491 25 3,252 18 2,019 34 1,007 20 271 35 445 246 5.53 8.33 6.76
(1V02) (632) Northport, NY 44,017 40,747 92.57% 3,270 7.43% 0 378 37,982 25 2,765 18 1,683 34 929 20 248 35 410 246 7.26 8.36 6.04
(1V02) (632BU) Northport, NY - VADOM 190 190 100.00% 0 0.00% 0 0 190 0 0 0 0 0 0 0 0 0 0 0
(1V02) (632GA) East Meadow, NY 3,105 2,905 93.56% 200 6.44% 0 0 2,702 0 203 0 136 0 35 0 10 0 19 0 6.23 8.62 9.24
(1V02) (632HA) Valley Stream, NY 1,112 1,084 97.48% 28 2.52% 0 0 1,048 0 36 0 17 0 7 0 0 0 4 0 3.06 5.14 5.61
(1V02) (632HB) Riverhead, NY 2,212 2,132 96.38% 80 3.62% 0 0 2,068 0 64 0 67 0 8 0 3 0 2 0 1.40 6.30 5.54
(1V02) (632HC) Bay Shore, NY 1,365 1,318 96.56% 47 3.44% 0 0 1,261 0 57 0 31 0 5 0 5 0 6 0 5.78 6.02
(1V02) (632HD) Patchogue, NY 2,334 2,223 95.24% 111 4.76% 0 0 2,121 0 102 0 80 0 22 0 5 0 4 0 3.08 9.72 10.42
(1V02) (632QA) Northport 1, NY - Mobile 113 108 95.58% 5 4.42% 0 0 87 0 21 0 4 0 1 0 0 0 0 0 7.75
(1V02) (632QB) Northport 2, NY - Mobile 37 36 97.30% 1 2.70% 0 0 32 0 4 0 1 0 0 0 0 0 0 0 5.09 8.86
(1V04) (460) Wilmington, DE HCS 48,365 45,734 94.56% 2,631 5.44% 32 113 43,619 0 2,115 1 1,212 2 748 3 370 2 301 105 2.09 10.91 2.36
(1V04) (460) Wilmington, DE 30,209 27,923 92.43% 2,286 7.57% 0 112 26,350 0 1,573 1 981 2 682 3 354 2 269 104 2.21 11.82 1.68
(1V04) (460GA) Georgetown, DE (Sussex County)
4,465 4,367 97.81% 98 2.19% 0 1 4,218 0 149 0 49 0 31 0 7 0 11 1 2.70 9.15 2.77
Pending Appointment and Electronic Wait List Summary -National, Facility, and Division Level Summaries Wait Time Calculated from Preferred
Date
For the period ending: 3/15/2019
1. Total Appts Scheduled
2. Appts Scheduled 30 Days or Under
3. Percent Appts Scheduled 30 Days or Under
4. Appts Scheduled Over 30 Days
5. Percent Appts Scheduled Over 30 Days
6. New Enroll Appt Req
7. EWL Count
8. Appts Between 0-14 Days
9. EWL 0-14 Days
10. Appts Between 15-30 Days
11. EWL 15 -30 days
12. Appts Between 31-60 Days
13. EWL 31 -60 Days
14. Appts Between 61-90 Days
15. EWL 61 -90 Days
16. Appts Between 91-120 Days
17. EWL 91 -120 Days
18. Appts Beyond 120 Days
19. EWL Greater than 120 Days
20. PC Avg Wait Time
21. SC Avg Wait Time
22. MH Avg Wait Time
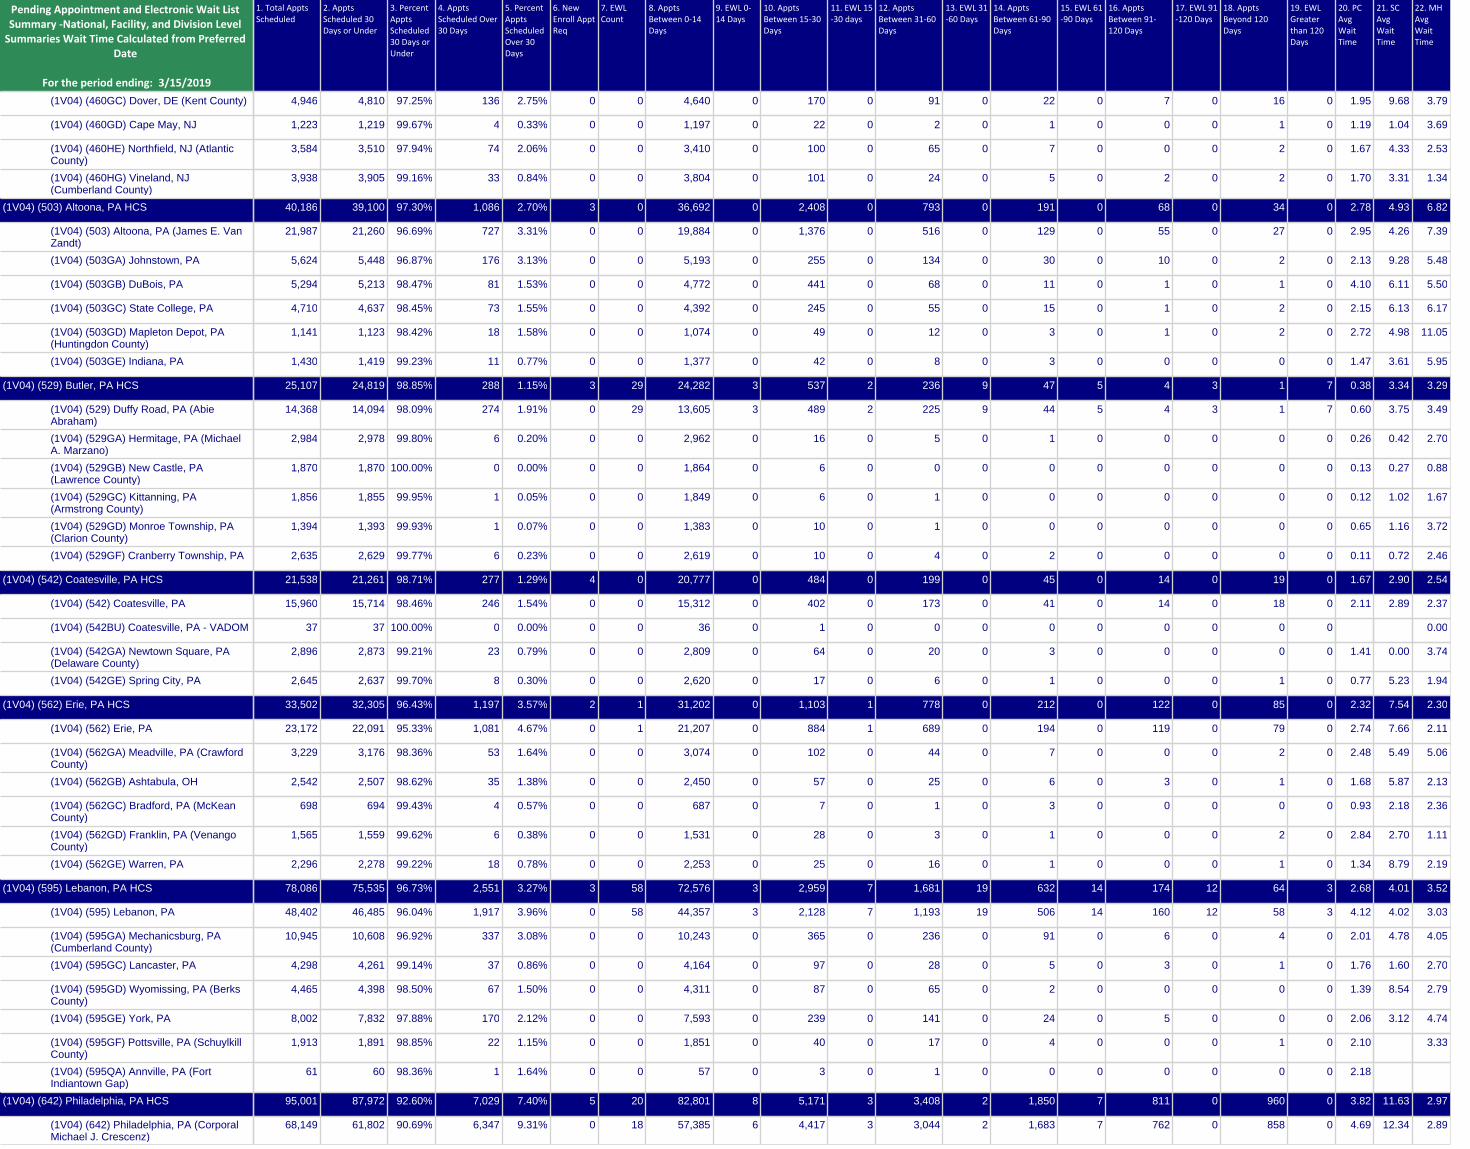
(1V04) (460GC) Dover, DE (Kent County) 4,946 4,810 97.25% 136 2.75% 0 0 4,640 0 170 0 91 0 22 0 7 0 16 0 1.95 9.68 3.79
(1V04) (460GD) Cape May, NJ 1,223 1,219 99.67% 4 0.33% 0 0 1,197 0 22 0 2 0 1 0 0 0 1 0 1.19 1.04 3.69
(1V04) (460HE) Northfield, NJ (Atlantic County)
3,584 3,510 97.94% 74 2.06% 0 0 3,410 0 100 0 65 0 7 0 0 0 2 0 1.67 4.33 2.53
(1V04) (460HG) Vineland, NJ (Cumberland County)
3,938 3,905 99.16% 33 0.84% 0 0 3,804 0 101 0 24 0 5 0 2 0 2 0 1.70 3.31 1.34
(1V04) (503) Altoona, PA HCS 40,186 39,100 97.30% 1,086 2.70% 3 0 36,692 0 2,408 0 793 0 191 0 68 0 34 0 2.78 4.93 6.82
(1V04) (503) Altoona, PA (James E. Van Zandt)
21,987 21,260 96.69% 727 3.31% 0 0 19,884 0 1,376 0 516 0 129 0 55 0 27 0 2.95 4.26 7.39
(1V04) (503GA) Johnstown, PA 5,624 5,448 96.87% 176 3.13% 0 0 5,193 0 255 0 134 0 30 0 10 0 2 0 2.13 9.28 5.48
(1V04) (503GB) DuBois, PA 5,294 5,213 98.47% 81 1.53% 0 0 4,772 0 441 0 68 0 11 0 1 0 1 0 4.10 6.11 5.50
(1V04) (503GC) State College, PA 4,710 4,637 98.45% 73 1.55% 0 0 4,392 0 245 0 55 0 15 0 1 0 2 0 2.15 6.13 6.17
(1V04) (503GD) Mapleton Depot, PA (Huntingdon County)
1,141 1,123 98.42% 18 1.58% 0 0 1,074 0 49 0 12 0 3 0 1 0 2 0 2.72 4.98 11.05
(1V04) (503GE) Indiana, PA 1,430 1,419 99.23% 11 0.77% 0 0 1,377 0 42 0 8 0 3 0 0 0 0 0 1.47 3.61 5.95
(1V04) (529) Butler, PA HCS 25,107 24,819 98.85% 288 1.15% 3 29 24,282 3 537 2 236 9 47 5 4 3 1 7 0.38 3.34 3.29
(1V04) (529) Duffy Road, PA (Abie Abraham)
14,368 14,094 98.09% 274 1.91% 0 29 13,605 3 489 2 225 9 44 5 4 3 1 7 0.60 3.75 3.49
(1V04) (529GA) Hermitage, PA (Michael A. Marzano)
2,984 2,978 99.80% 6 0.20% 0 0 2,962 0 16 0 5 0 1 0 0 0 0 0 0.26 0.42 2.70
(1V04) (529GB) New Castle, PA (Lawrence County)
1,870 1,870 100.00% 0 0.00% 0 0 1,864 0 6 0 0 0 0 0 0 0 0 0 0.13 0.27 0.88
(1V04) (529GC) Kittanning, PA (Armstrong County)
1,856 1,855 99.95% 1 0.05% 0 0 1,849 0 6 0 1 0 0 0 0 0 0 0 0.12 1.02 1.67
(1V04) (529GD) Monroe Township, PA (Clarion County)
1,394 1,393 99.93% 1 0.07% 0 0 1,383 0 10 0 1 0 0 0 0 0 0 0 0.65 1.16 3.72
(1V04) (529GF) Cranberry Township, PA 2,635 2,629 99.77% 6 0.23% 0 0 2,619 0 10 0 4 0 2 0 0 0 0 0 0.11 0.72 2.46
(1V04) (542) Coatesville, PA HCS 21,538 21,261 98.71% 277 1.29% 4 0 20,777 0 484 0 199 0 45 0 14 0 19 0 1.67 2.90 2.54
(1V04) (542) Coatesville, PA 15,960 15,714 98.46% 246 1.54% 0 0 15,312 0 402 0 173 0 41 0 14 0 18 0 2.11 2.89 2.37
(1V04) (542BU) Coatesville, PA - VADOM 37 37 100.00% 0 0.00% 0 0 36 0 1 0 0 0 0 0 0 0 0 0 0.00
(1V04) (542GA) Newtown Square, PA (Delaware County)
2,896 2,873 99.21% 23 0.79% 0 0 2,809 0 64 0 20 0 3 0 0 0 0 0 1.41 0.00 3.74
(1V04) (542GE) Spring City, PA 2,645 2,637 99.70% 8 0.30% 0 0 2,620 0 17 0 6 0 1 0 0 0 1 0 0.77 5.23 1.94
(1V04) (562) Erie, PA HCS 33,502 32,305 96.43% 1,197 3.57% 2 1 31,202 0 1,103 1 778 0 212 0 122 0 85 0 2.32 7.54 2.30
(1V04) (562) Erie, PA 23,172 22,091 95.33% 1,081 4.67% 0 1 21,207 0 884 1 689 0 194 0 119 0 79 0 2.74 7.66 2.11
(1V04) (562GA) Meadville, PA (Crawford County)
3,229 3,176 98.36% 53 1.64% 0 0 3,074 0 102 0 44 0 7 0 0 0 2 0 2.48 5.49 5.06
(1V04) (562GB) Ashtabula, OH 2,542 2,507 98.62% 35 1.38% 0 0 2,450 0 57 0 25 0 6 0 3 0 1 0 1.68 5.87 2.13
(1V04) (562GC) Bradford, PA (McKean County)
698 694 99.43% 4 0.57% 0 0 687 0 7 0 1 0 3 0 0 0 0 0 0.93 2.18 2.36
(1V04) (562GD) Franklin, PA (Venango County)
1,565 1,559 99.62% 6 0.38% 0 0 1,531 0 28 0 3 0 1 0 0 0 2 0 2.84 2.70 1.11
(1V04) (562GE) Warren, PA 2,296 2,278 99.22% 18 0.78% 0 0 2,253 0 25 0 16 0 1 0 0 0 1 0 1.34 8.79 2.19
(1V04) (595) Lebanon, PA HCS 78,086 75,535 96.73% 2,551 3.27% 3 58 72,576 3 2,959 7 1,681 19 632 14 174 12 64 3 2.68 4.01 3.52
(1V04) (595) Lebanon, PA 48,402 46,485 96.04% 1,917 3.96% 0 58 44,357 3 2,128 7 1,193 19 506 14 160 12 58 3 4.12 4.02 3.03
(1V04) (595GA) Mechanicsburg, PA (Cumberland County)
10,945 10,608 96.92% 337 3.08% 0 0 10,243 0 365 0 236 0 91 0 6 0 4 0 2.01 4.78 4.05
(1V04) (595GC) Lancaster, PA 4,298 4,261 99.14% 37 0.86% 0 0 4,164 0 97 0 28 0 5 0 3 0 1 0 1.76 1.60 2.70
(1V04) (595GD) Wyomissing, PA (Berks County)
4,465 4,398 98.50% 67 1.50% 0 0 4,311 0 87 0 65 0 2 0 0 0 0 0 1.39 8.54 2.79
(1V04) (595GE) York, PA 8,002 7,832 97.88% 170 2.12% 0 0 7,593 0 239 0 141 0 24 0 5 0 0 0 2.06 3.12 4.74
(1V04) (595GF) Pottsville, PA (Schuylkill County)
1,913 1,891 98.85% 22 1.15% 0 0 1,851 0 40 0 17 0 4 0 0 0 1 0 2.10 3.33
(1V04) (595QA) Annville, PA (Fort Indiantown Gap)
61 60 98.36% 1 1.64% 0 0 57 0 3 0 1 0 0 0 0 0 0 0 2.18
(1V04) (642) Philadelphia, PA HCS 95,001 87,972 92.60% 7,029 7.40% 5 20 82,801 8 5,171 3 3,408 2 1,850 7 811 0 960 0 3.82 11.63 2.97
(1V04) (642) Philadelphia, PA (Corporal Michael J. Crescenz)
68,149 61,802 90.69% 6,347 9.31% 0 18 57,385 6 4,417 3 3,044 2 1,683 7 762 0 858 0 4.69 12.34 2.89
Pending Appointment and Electronic Wait List Summary -National, Facility, and Division Level Summaries Wait Time Calculated from Preferred
Date
For the period ending: 3/15/2019
1. Total Appts Scheduled
2. Appts Scheduled 30 Days or Under
3. Percent Appts Scheduled 30 Days or Under
4. Appts Scheduled Over 30 Days
5. Percent Appts Scheduled Over 30 Days
6. New Enroll Appt Req
7. EWL Count
8. Appts Between 0-14 Days
9. EWL 0-14 Days
10. Appts Between 15-30 Days
11. EWL 15 -30 days
12. Appts Between 31-60 Days
13. EWL 31 -60 Days
14. Appts Between 61-90 Days
15. EWL 61 -90 Days
16. Appts Between 91-120 Days
17. EWL 91 -120 Days
18. Appts Beyond 120 Days
19. EWL Greater than 120 Days
20. PC Avg Wait Time
21. SC Avg Wait Time
22. MH Avg Wait Time
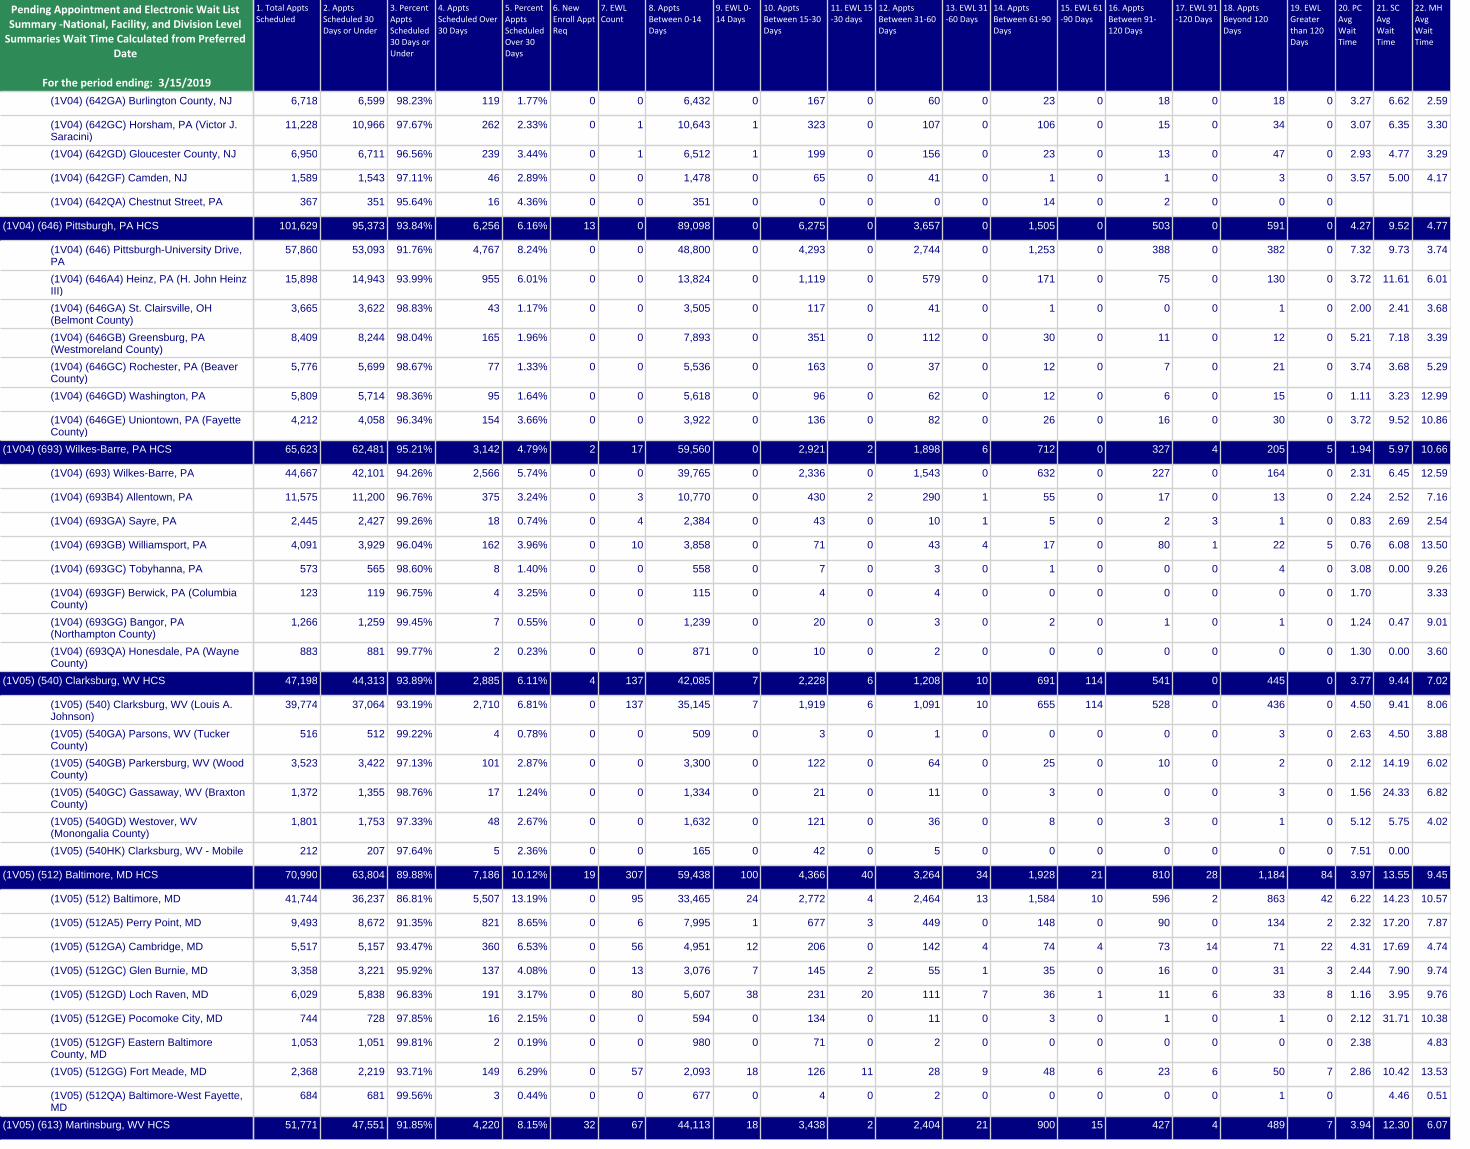
(1V04) (642GA) Burlington County, NJ 6,718 6,599 98.23% 119 1.77% 0 0 6,432 0 167 0 60 0 23 0 18 0 18 0 3.27 6.62 2.59
(1V04) (642GC) Horsham, PA (Victor J. Saracini)
11,228 10,966 97.67% 262 2.33% 0 1 10,643 1 323 0 107 0 106 0 15 0 34 0 3.07 6.35 3.30
(1V04) (642GD) Gloucester County, NJ 6,950 6,711 96.56% 239 3.44% 0 1 6,512 1 199 0 156 0 23 0 13 0 47 0 2.93 4.77 3.29
(1V04) (642GF) Camden, NJ 1,589 1,543 97.11% 46 2.89% 0 0 1,478 0 65 0 41 0 1 0 1 0 3 0 3.57 5.00 4.17
(1V04) (642QA) Chestnut Street, PA 367 351 95.64% 16 4.36% 0 0 351 0 0 0 0 0 14 0 2 0 0 0
(1V04) (646) Pittsburgh, PA HCS 101,629 95,373 93.84% 6,256 6.16% 13 0 89,098 0 6,275 0 3,657 0 1,505 0 503 0 591 0 4.27 9.52 4.77
(1V04) (646) Pittsburgh-University Drive, PA
57,860 53,093 91.76% 4,767 8.24% 0 0 48,800 0 4,293 0 2,744 0 1,253 0 388 0 382 0 7.32 9.73 3.74
(1V04) (646A4) Heinz, PA (H. John Heinz III)
15,898 14,943 93.99% 955 6.01% 0 0 13,824 0 1,119 0 579 0 171 0 75 0 130 0 3.72 11.61 6.01
(1V04) (646GA) St. Clairsville, OH (Belmont County)
3,665 3,622 98.83% 43 1.17% 0 0 3,505 0 117 0 41 0 1 0 0 0 1 0 2.00 2.41 3.68
(1V04) (646GB) Greensburg, PA (Westmoreland County)
8,409 8,244 98.04% 165 1.96% 0 0 7,893 0 351 0 112 0 30 0 11 0 12 0 5.21 7.18 3.39
(1V04) (646GC) Rochester, PA (Beaver County)
5,776 5,699 98.67% 77 1.33% 0 0 5,536 0 163 0 37 0 12 0 7 0 21 0 3.74 3.68 5.29
(1V04) (646GD) Washington, PA 5,809 5,714 98.36% 95 1.64% 0 0 5,618 0 96 0 62 0 12 0 6 0 15 0 1.11 3.23 12.99
(1V04) (646GE) Uniontown, PA (Fayette County)
4,212 4,058 96.34% 154 3.66% 0 0 3,922 0 136 0 82 0 26 0 16 0 30 0 3.72 9.52 10.86
(1V04) (693) Wilkes-Barre, PA HCS 65,623 62,481 95.21% 3,142 4.79% 2 17 59,560 0 2,921 2 1,898 6 712 0 327 4 205 5 1.94 5.97 10.66
(1V04) (693) Wilkes-Barre, PA 44,667 42,101 94.26% 2,566 5.74% 0 0 39,765 0 2,336 0 1,543 0 632 0 227 0 164 0 2.31 6.45 12.59
(1V04) (693B4) Allentown, PA 11,575 11,200 96.76% 375 3.24% 0 3 10,770 0 430 2 290 1 55 0 17 0 13 0 2.24 2.52 7.16
(1V04) (693GA) Sayre, PA 2,445 2,427 99.26% 18 0.74% 0 4 2,384 0 43 0 10 1 5 0 2 3 1 0 0.83 2.69 2.54
(1V04) (693GB) Williamsport, PA 4,091 3,929 96.04% 162 3.96% 0 10 3,858 0 71 0 43 4 17 0 80 1 22 5 0.76 6.08 13.50
(1V04) (693GC) Tobyhanna, PA 573 565 98.60% 8 1.40% 0 0 558 0 7 0 3 0 1 0 0 0 4 0 3.08 0.00 9.26
(1V04) (693GF) Berwick, PA (Columbia County)
123 119 96.75% 4 3.25% 0 0 115 0 4 0 4 0 0 0 0 0 0 0 1.70 3.33
(1V04) (693GG) Bangor, PA (Northampton County)
1,266 1,259 99.45% 7 0.55% 0 0 1,239 0 20 0 3 0 2 0 1 0 1 0 1.24 0.47 9.01
(1V04) (693QA) Honesdale, PA (Wayne County)
883 881 99.77% 2 0.23% 0 0 871 0 10 0 2 0 0 0 0 0 0 0 1.30 0.00 3.60
(1V05) (540) Clarksburg, WV HCS 47,198 44,313 93.89% 2,885 6.11% 4 137 42,085 7 2,228 6 1,208 10 691 114 541 0 445 0 3.77 9.44 7.02
(1V05) (540) Clarksburg, WV (Louis A. Johnson)
39,774 37,064 93.19% 2,710 6.81% 0 137 35,145 7 1,919 6 1,091 10 655 114 528 0 436 0 4.50 9.41 8.06
(1V05) (540GA) Parsons, WV (Tucker County)
516 512 99.22% 4 0.78% 0 0 509 0 3 0 1 0 0 0 0 0 3 0 2.63 4.50 3.88
(1V05) (540GB) Parkersburg, WV (Wood County)
3,523 3,422 97.13% 101 2.87% 0 0 3,300 0 122 0 64 0 25 0 10 0 2 0 2.12 14.19 6.02
(1V05) (540GC) Gassaway, WV (Braxton County)
1,372 1,355 98.76% 17 1.24% 0 0 1,334 0 21 0 11 0 3 0 0 0 3 0 1.56 24.33 6.82
(1V05) (540GD) Westover, WV (Monongalia County)
1,801 1,753 97.33% 48 2.67% 0 0 1,632 0 121 0 36 0 8 0 3 0 1 0 5.12 5.75 4.02
(1V05) (540HK) Clarksburg, WV - Mobile 212 207 97.64% 5 2.36% 0 0 165 0 42 0 5 0 0 0 0 0 0 0 7.51 0.00
(1V05) (512) Baltimore, MD HCS 70,990 63,804 89.88% 7,186 10.12% 19 307 59,438 100 4,366 40 3,264 34 1,928 21 810 28 1,184 84 3.97 13.55 9.45
(1V05) (512) Baltimore, MD 41,744 36,237 86.81% 5,507 13.19% 0 95 33,465 24 2,772 4 2,464 13 1,584 10 596 2 863 42 6.22 14.23 10.57
(1V05) (512A5) Perry Point, MD 9,493 8,672 91.35% 821 8.65% 0 6 7,995 1 677 3 449 0 148 0 90 0 134 2 2.32 17.20 7.87
(1V05) (512GA) Cambridge, MD 5,517 5,157 93.47% 360 6.53% 0 56 4,951 12 206 0 142 4 74 4 73 14 71 22 4.31 17.69 4.74
(1V05) (512GC) Glen Burnie, MD 3,358 3,221 95.92% 137 4.08% 0 13 3,076 7 145 2 55 1 35 0 16 0 31 3 2.44 7.90 9.74
(1V05) (512GD) Loch Raven, MD 6,029 5,838 96.83% 191 3.17% 0 80 5,607 38 231 20 111 7 36 1 11 6 33 8 1.16 3.95 9.76
(1V05) (512GE) Pocomoke City, MD 744 728 97.85% 16 2.15% 0 0 594 0 134 0 11 0 3 0 1 0 1 0 2.12 31.71 10.38
(1V05) (512GF) Eastern Baltimore County, MD
1,053 1,051 99.81% 2 0.19% 0 0 980 0 71 0 2 0 0 0 0 0 0 0 2.38 4.83
(1V05) (512GG) Fort Meade, MD 2,368 2,219 93.71% 149 6.29% 0 57 2,093 18 126 11 28 9 48 6 23 6 50 7 2.86 10.42 13.53
(1V05) (512QA) Baltimore-West Fayette, MD
684 681 99.56% 3 0.44% 0 0 677 0 4 0 2 0 0 0 0 0 1 0 4.46 0.51
(1V05) (613) Martinsburg, WV HCS 51,771 47,551 91.85% 4,220 8.15% 32 67 44,113 18 3,438 2 2,404 21 900 15 427 4 489 7 3.94 12.30 6.07
Pending Appointment and Electronic Wait List Summary -National, Facility, and Division Level Summaries Wait Time Calculated from Preferred
Date
For the period ending: 3/15/2019
1. Total Appts Scheduled
2. Appts Scheduled 30 Days or Under
3. Percent Appts Scheduled 30 Days or Under
4. Appts Scheduled Over 30 Days
5. Percent Appts Scheduled Over 30 Days
6. New Enroll Appt Req
7. EWL Count
8. Appts Between 0-14 Days
9. EWL 0-14 Days
10. Appts Between 15-30 Days
11. EWL 15 -30 days
12. Appts Between 31-60 Days
13. EWL 31 -60 Days
14. Appts Between 61-90 Days
15. EWL 61 -90 Days
16. Appts Between 91-120 Days
17. EWL 91 -120 Days
18. Appts Beyond 120 Days
19. EWL Greater than 120 Days
20. PC Avg Wait Time
21. SC Avg Wait Time
22. MH Avg Wait Time
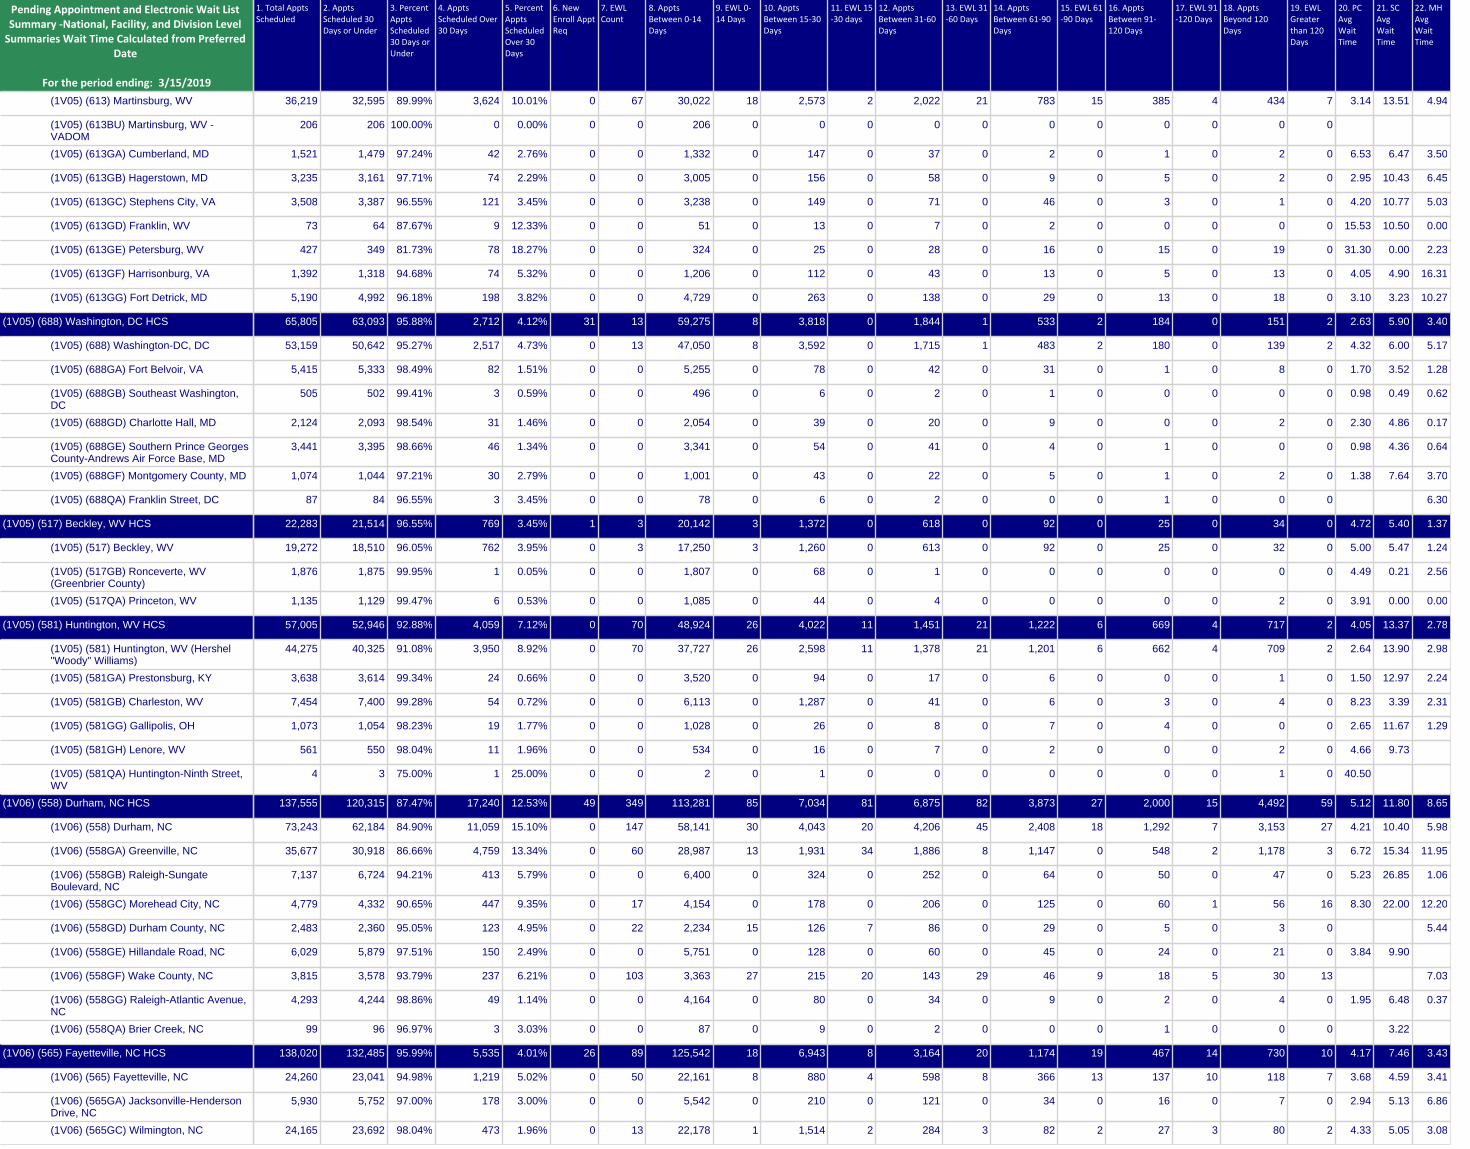
(1V05) (613) Martinsburg, WV 36,219 32,595 89.99% 3,624 10.01% 0 67 30,022 18 2,573 2 2,022 21 783 15 385 4 434 7 3.14 13.51 4.94
(1V05) (613BU) Martinsburg, WV -VADOM
206 206 100.00% 0 0.00% 0 0 206 0 0 0 0 0 0 0 0 0 0 0
(1V05) (613GA) Cumberland, MD 1,521 1,479 97.24% 42 2.76% 0 0 1,332 0 147 0 37 0 2 0 1 0 2 0 6.53 6.47 3.50
(1V05) (613GB) Hagerstown, MD 3,235 3,161 97.71% 74 2.29% 0 0 3,005 0 156 0 58 0 9 0 5 0 2 0 2.95 10.43 6.45
(1V05) (613GC) Stephens City, VA 3,508 3,387 96.55% 121 3.45% 0 0 3,238 0 149 0 71 0 46 0 3 0 1 0 4.20 10.77 5.03
(1V05) (613GD) Franklin, WV 73 64 87.67% 9 12.33% 0 0 51 0 13 0 7 0 2 0 0 0 0 0 15.53 10.50 0.00
(1V05) (613GE) Petersburg, WV 427 349 81.73% 78 18.27% 0 0 324 0 25 0 28 0 16 0 15 0 19 0 31.30 0.00 2.23
(1V05) (613GF) Harrisonburg, VA 1,392 1,318 94.68% 74 5.32% 0 0 1,206 0 112 0 43 0 13 0 5 0 13 0 4.05 4.90 16.31
(1V05) (613GG) Fort Detrick, MD 5,190 4,992 96.18% 198 3.82% 0 0 4,729 0 263 0 138 0 29 0 13 0 18 0 3.10 3.23 10.27
(1V05) (688) Washington, DC HCS 65,805 63,093 95.88% 2,712 4.12% 31 13 59,275 8 3,818 0 1,844 1 533 2 184 0 151 2 2.63 5.90 3.40
(1V05) (688) Washington-DC, DC 53,159 50,642 95.27% 2,517 4.73% 0 13 47,050 8 3,592 0 1,715 1 483 2 180 0 139 2 4.32 6.00 5.17
(1V05) (688GA) Fort Belvoir, VA 5,415 5,333 98.49% 82 1.51% 0 0 5,255 0 78 0 42 0 31 0 1 0 8 0 1.70 3.52 1.28
(1V05) (688GB) Southeast Washington, DC
505 502 99.41% 3 0.59% 0 0 496 0 6 0 2 0 1 0 0 0 0 0 0.98 0.49 0.62
(1V05) (688GD) Charlotte Hall, MD 2,124 2,093 98.54% 31 1.46% 0 0 2,054 0 39 0 20 0 9 0 0 0 2 0 2.30 4.86 0.17
(1V05) (688GE) Southern Prince Georges County-Andrews Air Force Base, MD
3,441 3,395 98.66% 46 1.34% 0 0 3,341 0 54 0 41 0 4 0 1 0 0 0 0.98 4.36 0.64
(1V05) (688GF) Montgomery County, MD 1,074 1,044 97.21% 30 2.79% 0 0 1,001 0 43 0 22 0 5 0 1 0 2 0 1.38 7.64 3.70
(1V05) (688QA) Franklin Street, DC 87 84 96.55% 3 3.45% 0 0 78 0 6 0 2 0 0 0 1 0 0 0 6.30
(1V05) (517) Beckley, WV HCS 22,283 21,514 96.55% 769 3.45% 1 3 20,142 3 1,372 0 618 0 92 0 25 0 34 0 4.72 5.40 1.37
(1V05) (517) Beckley, WV 19,272 18,510 96.05% 762 3.95% 0 3 17,250 3 1,260 0 613 0 92 0 25 0 32 0 5.00 5.47 1.24
(1V05) (517GB) Ronceverte, WV (Greenbrier County)
1,876 1,875 99.95% 1 0.05% 0 0 1,807 0 68 0 1 0 0 0 0 0 0 0 4.49 0.21 2.56
(1V05) (517QA) Princeton, WV 1,135 1,129 99.47% 6 0.53% 0 0 1,085 0 44 0 4 0 0 0 0 0 2 0 3.91 0.00 0.00
(1V05) (581) Huntington, WV HCS 57,005 52,946 92.88% 4,059 7.12% 0 70 48,924 26 4,022 11 1,451 21 1,222 6 669 4 717 2 4.05 13.37 2.78
(1V05) (581) Huntington, WV (Hershel "Woody" Williams)
44,275 40,325 91.08% 3,950 8.92% 0 70 37,727 26 2,598 11 1,378 21 1,201 6 662 4 709 2 2.64 13.90 2.98
(1V05) (581GA) Prestonsburg, KY 3,638 3,614 99.34% 24 0.66% 0 0 3,520 0 94 0 17 0 6 0 0 0 1 0 1.50 12.97 2.24
(1V05) (581GB) Charleston, WV 7,454 7,400 99.28% 54 0.72% 0 0 6,113 0 1,287 0 41 0 6 0 3 0 4 0 8.23 3.39 2.31
(1V05) (581GG) Gallipolis, OH 1,073 1,054 98.23% 19 1.77% 0 0 1,028 0 26 0 8 0 7 0 4 0 0 0 2.65 11.67 1.29
(1V05) (581GH) Lenore, WV 561 550 98.04% 11 1.96% 0 0 534 0 16 0 7 0 2 0 0 0 2 0 4.66 9.73
(1V05) (581QA) Huntington-Ninth Street, WV
4 3 75.00% 1 25.00% 0 0 2 0 1 0 0 0 0 0 0 0 1 0 40.50
(1V06) (558) Durham, NC HCS 137,555 120,315 87.47% 17,240 12.53% 49 349 113,281 85 7,034 81 6,875 82 3,873 27 2,000 15 4,492 59 5.12 11.80 8.65
(1V06) (558) Durham, NC 73,243 62,184 84.90% 11,059 15.10% 0 147 58,141 30 4,043 20 4,206 45 2,408 18 1,292 7 3,153 27 4.21 10.40 5.98
(1V06) (558GA) Greenville, NC 35,677 30,918 86.66% 4,759 13.34% 0 60 28,987 13 1,931 34 1,886 8 1,147 0 548 2 1,178 3 6.72 15.34 11.95
(1V06) (558GB) Raleigh-Sungate Boulevard, NC
7,137 6,724 94.21% 413 5.79% 0 0 6,400 0 324 0 252 0 64 0 50 0 47 0 5.23 26.85 1.06
(1V06) (558GC) Morehead City, NC 4,779 4,332 90.65% 447 9.35% 0 17 4,154 0 178 0 206 0 125 0 60 1 56 16 8.30 22.00 12.20
(1V06) (558GD) Durham County, NC 2,483 2,360 95.05% 123 4.95% 0 22 2,234 15 126 7 86 0 29 0 5 0 3 0 5.44
(1V06) (558GE) Hillandale Road, NC 6,029 5,879 97.51% 150 2.49% 0 0 5,751 0 128 0 60 0 45 0 24 0 21 0 3.84 9.90
(1V06) (558GF) Wake County, NC 3,815 3,578 93.79% 237 6.21% 0 103 3,363 27 215 20 143 29 46 9 18 5 30 13 7.03
(1V06) (558GG) Raleigh-Atlantic Avenue, NC
4,293 4,244 98.86% 49 1.14% 0 0 4,164 0 80 0 34 0 9 0 2 0 4 0 1.95 6.48 0.37
(1V06) (558QA) Brier Creek, NC 99 96 96.97% 3 3.03% 0 0 87 0 9 0 2 0 0 0 1 0 0 0 3.22
(1V06) (565) Fayetteville, NC HCS 138,020 132,485 95.99% 5,535 4.01% 26 89 125,542 18 6,943 8 3,164 20 1,174 19 467 14 730 10 4.17 7.46 3.43
(1V06) (565) Fayetteville, NC 24,260 23,041 94.98% 1,219 5.02% 0 50 22,161 8 880 4 598 8 366 13 137 10 118 7 3.68 4.59 3.41
(1V06) (565GA) Jacksonville-Henderson Drive, NC
5,930 5,752 97.00% 178 3.00% 0 0 5,542 0 210 0 121 0 34 0 16 0 7 0 2.94 5.13 6.86
(1V06) (565GC) Wilmington, NC 24,165 23,692 98.04% 473 1.96% 0 13 22,178 1 1,514 2 284 3 82 2 27 3 80 2 4.33 5.05 3.08

Pending Appointment and Electronic Wait List Summary -National, Facility, and Division Level Summaries Wait Time Calculated from Preferred
Date
For the period ending: 3/15/2019
1. Total Appts Scheduled
2. Appts Scheduled 30 Days or Under
3. Percent Appts Scheduled 30 Days or Under
4. Appts Scheduled Over 30 Days
5. Percent Appts Scheduled Over 30 Days
6. New Enroll Appt Req
7. EWL Count
8. Appts Between 0-14 Days
9. EWL 0-14 Days
10. Appts Between 15-30 Days
11. EWL 15 -30 days
12. Appts Between 31-60 Days
13. EWL 31 -60 Days
14. Appts Between 61-90 Days
15. EWL 61 -90 Days
16. Appts Between 91-120 Days
17. EWL 91 -120 Days
18. Appts Beyond 120 Days
19. EWL Greater than 120 Days
20. PC Avg Wait Time
21. SC Avg Wait Time
22. MH Avg Wait Time
(1V06) (565GD) Hamlet, NC 2,803 2,797 99.79% 6 0.21% 0 0 2,613 0 184 0 4 0 1 0 1 0 0 0 3.64 12.47 0.86
(1V06) (565GE) Robeson County, NC 3,074 3,059 99.51% 15 0.49% 0 0 2,998 0 61 0 13 0 0 0 1 0 1 0 2.43 3.50 2.17
(1V06) (565GF) Goldsboro, NC 3,084 3,061 99.25% 23 0.75% 0 0 3,012 0 49 0 12 0 4 0 3 0 4 0 1.30 11.20 2.93
(1V06) (565GG) Sanford, NC (Lee County)
3,993 3,955 99.05% 38 0.95% 0 0 3,854 0 101 0 26 0 10 0 2 0 0 0 1.59 0.08 2.36
(1V06) (565GH) Brunswick County, NC 2,139 2,098 98.08% 41 1.92% 0 0 2,009 0 89 0 17 0 5 0 12 0 7 0 4.07 0.00 0.00
(1V06) (565GJ) Jacksonville 2, NC 1,711 1,697 99.18% 14 0.82% 0 0 1,637 0 60 0 11 0 0 0 1 0 2 0 2.80
(1V06) (565GL) Cumberland County, NC 62,849 59,466 94.62% 3,383 5.38% 0 26 55,843 9 3,623 2 1,991 9 625 4 257 1 510 1 5.08 9.54 4.59
(1V06) (565GM) Jacksonville 3, NC 2,632 2,591 98.44% 41 1.56% 0 0 2,518 0 73 0 17 0 18 0 6 0 0 0 3.03
(1V06) (565MB) IDES Fort Bragg 10 10 100.00% 0 0.00% 0 0 10 0 0 0 0 0 0 0 0 0 0 0 3.89 4.00
(1V06) (565MD) IDES Camp Lejeune 64 63 98.44% 1 1.56% 0 0 60 0 3 0 1 0 0 0 0 0 0 0 2.39 0.00
(1V06) (565QA) Robeson Street, NC 429 427 99.53% 2 0.47% 0 0 420 0 7 0 0 0 2 0 0 0 0 0 1.76
(1V06) (565QD) Raeford Road, NC 877 776 88.48% 101 11.52% 0 0 687 0 89 0 69 0 27 0 4 0 1 0 11.09
(1V06) (590) Hampton, VA HCS 91,111 79,319 87.06% 11,792 12.94% 544 92 74,677 5 4,642 1 3,773 4 3,264 3 2,302 4 2,453 75 10.06 21.84 7.46
(1V06) (590) Hampton, VA 72,150 61,584 85.36% 10,566 14.64% 0 91 57,710 5 3,874 1 3,320 3 3,000 3 2,088 4 2,158 75 11.76 22.04 7.90
(1V06) (590BU) Hampton, VA - VADOM 4 4 100.00% 0 0.00% 0 0 4 0 0 0 0 0 0 0 0 0 0 0
(1V06) (590GB) Virginia Beach, VA 9,626 8,827 91.70% 799 8.30% 0 1 8,373 0 454 0 269 1 166 0 136 0 228 0 7.70 19.00 8.60
(1V06) (590GC) Albemarle, NC 2,637 2,624 99.51% 13 0.49% 0 0 2,566 0 58 0 9 0 1 0 1 0 2 0 1.18 0.00 1.95
(1V06) (590GD) Chesapeake, VA 6,601 6,187 93.73% 414 6.27% 0 0 5,944 0 243 0 175 0 97 0 77 0 65 0 7.70 11.64 4.78
(1V06) (590MA) IDES Portsmouth 41 41 100.00% 0 0.00% 0 0 32 0 9 0 0 0 0 0 0 0 0 0 12.80 12.36
(1V06) (590MB) IDES Langley 16 16 100.00% 0 0.00% 0 0 14 0 2 0 0 0 0 0 0 0 0 0 10.63
(1V06) (590MC) IDES Fort Eustis 36 36 100.00% 0 0.00% 0 0 34 0 2 0 0 0 0 0 0 0 0 0 9.67 8.50
(1V06) (637) Asheville, NC HCS 80,696 73,037 90.51% 7,659 9.49% 12 821 68,539 85 4,498 64 3,534 115 1,719 63 994 75 1,412 419 3.14 16.44 4.91
(1V06) (637) Asheville, NC (Charles George)
62,466 55,385 88.66% 7,081 11.34% 0 646 51,566 65 3,819 47 3,228 95 1,636 52 898 49 1,319 338 3.60 17.21 5.54
(1V06) (637BU) Asheville, NC - VADOM 1 1 100.00% 0 0.00% 0 0 1 0 0 0 0 0 0 0 0 0 0 0
(1V06) (637GA) Franklin, NC 3,630 3,551 97.82% 79 2.18% 0 8 3,439 0 112 1 60 2 15 0 2 5 2 0 1.59 3.54 3.59
(1V06) (637GB) Rutherford County, NC 3,083 3,018 97.89% 65 2.11% 0 35 2,917 11 101 12 35 9 13 2 10 1 7 0 3.51 24.43 2.20
(1V06) (637GC) Hickory, NC 11,516 11,082 96.23% 434 3.77% 0 132 10,616 9 466 4 211 9 55 9 84 20 84 81 2.38 11.17 5.00
(1V06) (652) Richmond, VA HCS 128,976 120,916 93.75% 8,060 6.25% 51 37 113,584 4 7,332 2 4,301 3 1,567 4 838 4 1,354 20 4.03 10.44 4.38
(1V06) (652) Richmond, VA (Hunter Holmes McGuire)
114,605 106,758 93.15% 7,847 6.85% 0 37 99,887 4 6,871 2 4,137 3 1,532 4 834 4 1,344 20 4.55 10.68 5.23
(1V06) (652GA) Fredericksburg-Mary Washington, VA
4,347 4,259 97.98% 88 2.02% 0 0 4,107 0 152 0 58 0 21 0 1 0 8 0 2.83 8.02 2.77
(1V06) (652GB) Fredericksburg-Southpoint, VA
2,970 2,887 97.21% 83 2.79% 0 0 2,682 0 205 0 73 0 9 0 1 0 0 0 3.15 7.67 3.51
(1V06) (652GE) Charlottesville, VA 5,234 5,207 99.48% 27 0.52% 0 0 5,138 0 69 0 21 0 4 0 1 0 1 0 1.12 1.97 1.62
(1V06) (652GF) Emporia, VA 1,820 1,805 99.18% 15 0.82% 0 0 1,770 0 35 0 12 0 1 0 1 0 1 0 0.95 0.66 3.24
(1V06) (658) Salem, VA HCS 80,806 74,131 91.74% 6,675 8.26% 4 300 67,862 46 6,269 21 2,858 46 1,144 27 759 28 1,914 132 5.81 18.32 4.19
(1V06) (658) Salem, VA 62,766 56,668 90.28% 6,098 9.72% 0 269 51,520 39 5,148 16 2,470 31 1,061 27 739 27 1,828 129 5.73 18.40 3.95
(1V06) (658GA) Tazewell, VA 756 747 98.81% 9 1.19% 0 0 682 0 65 0 9 0 0 0 0 0 0 0 4.79 16.00 2.71
(1V06) (658GB) Danville, VA 6,272 5,854 93.34% 418 6.66% 0 2 5,393 0 461 0 271 0 59 0 14 0 74 2 9.29 7.27 6.05
(1V06) (658GC) Lynchburg, VA 4,977 4,922 98.89% 55 1.11% 0 21 4,479 3 443 4 47 14 6 0 1 0 1 0 4.71 10.25 4.72
(1V06) (658GD) Staunton, VA 2,451 2,418 98.65% 33 1.35% 0 1 2,365 0 53 1 20 0 6 0 2 0 5 0 3.34 2.07 0.69
(1V06) (658GE) Wytheville, VA 3,584 3,522 98.27% 62 1.73% 0 7 3,423 4 99 0 41 1 12 0 3 1 6 1 2.97 7.14 4.78
(1V06) (659) Salisbury, NC HCS 191,611 173,333 90.46% 18,278 9.54% 46 17 162,311 6 11,022 2 9,305 3 4,375 4 2,099 1 2,499 1 4.89 12.19 15.90
(1V06) (659) Salisbury, NC (W.G. (Bill) Hefner Salisbury)
58,072 54,070 93.11% 4,002 6.89% 0 4 50,103 1 3,967 0 2,344 3 1,013 0 353 0 292 0 3.88 8.40 8.27
Pending Appointment and Electronic Wait List Summary -National, Facility, and Division Level Summaries Wait Time Calculated from Preferred
Date
For the period ending: 3/15/2019
1. Total Appts Scheduled
2. Appts Scheduled 30 Days or Under
3. Percent Appts Scheduled 30 Days or Under
4. Appts Scheduled Over 30 Days
5. Percent Appts Scheduled Over 30 Days
6. New Enroll Appt Req
7. EWL Count
8. Appts Between 0-14 Days
9. EWL 0-14 Days
10. Appts Between 15-30 Days
11. EWL 15 -30 days
12. Appts Between 31-60 Days
13. EWL 31 -60 Days
14. Appts Between 61-90 Days
15. EWL 61 -90 Days
16. Appts Between 91-120 Days
17. EWL 91 -120 Days
18. Appts Beyond 120 Days
19. EWL Greater than 120 Days
20. PC Avg Wait Time
21. SC Avg Wait Time
22. MH Avg Wait Time
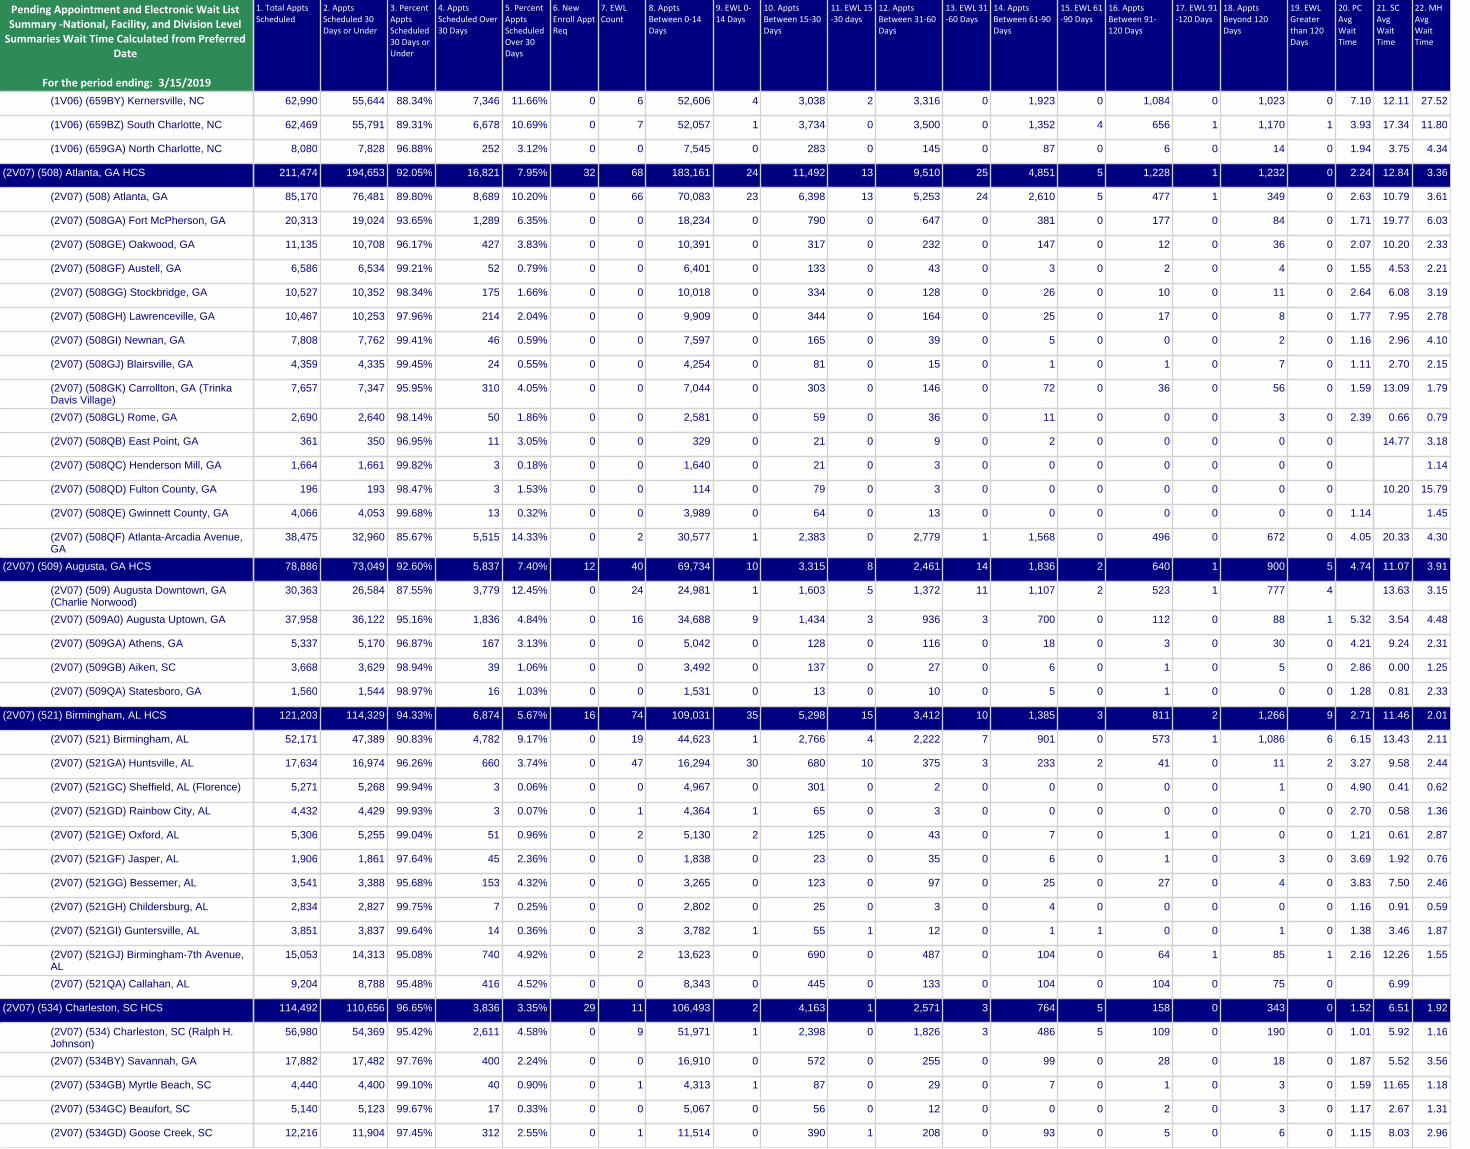
(1V06) (659BY) Kernersville, NC 62,990 55,644 88.34% 7,346 11.66% 0 6 52,606 4 3,038 2 3,316 0 1,923 0 1,084 0 1,023 0 7.10 12.11 27.52
(1V06) (659BZ) South Charlotte, NC 62,469 55,791 89.31% 6,678 10.69% 0 7 52,057 1 3,734 0 3,500 0 1,352 4 656 1 1,170 1 3.93 17.34 11.80
(1V06) (659GA) North Charlotte, NC 8,080 7,828 96.88% 252 3.12% 0 0 7,545 0 283 0 145 0 87 0 6 0 14 0 1.94 3.75 4.34
(2V07) (508) Atlanta, GA HCS 211,474 194,653 92.05% 16,821 7.95% 32 68 183,161 24 11,492 13 9,510 25 4,851 5 1,228 1 1,232 0 2.24 12.84 3.36
(2V07) (508) Atlanta, GA 85,170 76,481 89.80% 8,689 10.20% 0 66 70,083 23 6,398 13 5,253 24 2,610 5 477 1 349 0 2.63 10.79 3.61
(2V07) (508GA) Fort McPherson, GA 20,313 19,024 93.65% 1,289 6.35% 0 0 18,234 0 790 0 647 0 381 0 177 0 84 0 1.71 19.77 6.03
(2V07) (508GE) Oakwood, GA 11,135 10,708 96.17% 427 3.83% 0 0 10,391 0 317 0 232 0 147 0 12 0 36 0 2.07 10.20 2.33
(2V07) (508GF) Austell, GA 6,586 6,534 99.21% 52 0.79% 0 0 6,401 0 133 0 43 0 3 0 2 0 4 0 1.55 4.53 2.21
(2V07) (508GG) Stockbridge, GA 10,527 10,352 98.34% 175 1.66% 0 0 10,018 0 334 0 128 0 26 0 10 0 11 0 2.64 6.08 3.19
(2V07) (508GH) Lawrenceville, GA 10,467 10,253 97.96% 214 2.04% 0 0 9,909 0 344 0 164 0 25 0 17 0 8 0 1.77 7.95 2.78
(2V07) (508GI) Newnan, GA 7,808 7,762 99.41% 46 0.59% 0 0 7,597 0 165 0 39 0 5 0 0 0 2 0 1.16 2.96 4.10
(2V07) (508GJ) Blairsville, GA 4,359 4,335 99.45% 24 0.55% 0 0 4,254 0 81 0 15 0 1 0 1 0 7 0 1.11 2.70 2.15
(2V07) (508GK) Carrollton, GA (Trinka Davis Village)
7,657 7,347 95.95% 310 4.05% 0 0 7,044 0 303 0 146 0 72 0 36 0 56 0 1.59 13.09 1.79
(2V07) (508GL) Rome, GA 2,690 2,640 98.14% 50 1.86% 0 0 2,581 0 59 0 36 0 11 0 0 0 3 0 2.39 0.66 0.79
(2V07) (508QB) East Point, GA 361 350 96.95% 11 3.05% 0 0 329 0 21 0 9 0 2 0 0 0 0 0 14.77 3.18
(2V07) (508QC) Henderson Mill, GA 1,664 1,661 99.82% 3 0.18% 0 0 1,640 0 21 0 3 0 0 0 0 0 0 0 1.14
(2V07) (508QD) Fulton County, GA 196 193 98.47% 3 1.53% 0 0 114 0 79 0 3 0 0 0 0 0 0 0 10.20 15.79
(2V07) (508QE) Gwinnett County, GA 4,066 4,053 99.68% 13 0.32% 0 0 3,989 0 64 0 13 0 0 0 0 0 0 0 1.14 1.45
(2V07) (508QF) Atlanta-Arcadia Avenue, GA
38,475 32,960 85.67% 5,515 14.33% 0 2 30,577 1 2,383 0 2,779 1 1,568 0 496 0 672 0 4.05 20.33 4.30
(2V07) (509) Augusta, GA HCS 78,886 73,049 92.60% 5,837 7.40% 12 40 69,734 10 3,315 8 2,461 14 1,836 2 640 1 900 5 4.74 11.07 3.91
(2V07) (509) Augusta Downtown, GA (Charlie Norwood)
30,363 26,584 87.55% 3,779 12.45% 0 24 24,981 1 1,603 5 1,372 11 1,107 2 523 1 777 4 13.63 3.15
(2V07) (509A0) Augusta Uptown, GA 37,958 36,122 95.16% 1,836 4.84% 0 16 34,688 9 1,434 3 936 3 700 0 112 0 88 1 5.32 3.54 4.48
(2V07) (509GA) Athens, GA 5,337 5,170 96.87% 167 3.13% 0 0 5,042 0 128 0 116 0 18 0 3 0 30 0 4.21 9.24 2.31
(2V07) (509GB) Aiken, SC 3,668 3,629 98.94% 39 1.06% 0 0 3,492 0 137 0 27 0 6 0 1 0 5 0 2.86 0.00 1.25
(2V07) (509QA) Statesboro, GA 1,560 1,544 98.97% 16 1.03% 0 0 1,531 0 13 0 10 0 5 0 1 0 0 0 1.28 0.81 2.33
(2V07) (521) Birmingham, AL HCS 121,203 114,329 94.33% 6,874 5.67% 16 74 109,031 35 5,298 15 3,412 10 1,385 3 811 2 1,266 9 2.71 11.46 2.01
(2V07) (521) Birmingham, AL 52,171 47,389 90.83% 4,782 9.17% 0 19 44,623 1 2,766 4 2,222 7 901 0 573 1 1,086 6 6.15 13.43 2.11
(2V07) (521GA) Huntsville, AL 17,634 16,974 96.26% 660 3.74% 0 47 16,294 30 680 10 375 3 233 2 41 0 11 2 3.27 9.58 2.44
(2V07) (521GC) Sheffield, AL (Florence) 5,271 5,268 99.94% 3 0.06% 0 0 4,967 0 301 0 2 0 0 0 0 0 1 0 4.90 0.41 0.62
(2V07) (521GD) Rainbow City, AL 4,432 4,429 99.93% 3 0.07% 0 1 4,364 1 65 0 3 0 0 0 0 0 0 0 2.70 0.58 1.36
(2V07) (521GE) Oxford, AL 5,306 5,255 99.04% 51 0.96% 0 2 5,130 2 125 0 43 0 7 0 1 0 0 0 1.21 0.61 2.87
(2V07) (521GF) Jasper, AL 1,906 1,861 97.64% 45 2.36% 0 0 1,838 0 23 0 35 0 6 0 1 0 3 0 3.69 1.92 0.76
(2V07) (521GG) Bessemer, AL 3,541 3,388 95.68% 153 4.32% 0 0 3,265 0 123 0 97 0 25 0 27 0 4 0 3.83 7.50 2.46
(2V07) (521GH) Childersburg, AL 2,834 2,827 99.75% 7 0.25% 0 0 2,802 0 25 0 3 0 4 0 0 0 0 0 1.16 0.91 0.59
(2V07) (521GI) Guntersville, AL 3,851 3,837 99.64% 14 0.36% 0 3 3,782 1 55 1 12 0 1 1 0 0 1 0 1.38 3.46 1.87
(2V07) (521GJ) Birmingham-7th Avenue, AL
15,053 14,313 95.08% 740 4.92% 0 2 13,623 0 690 0 487 0 104 0 64 1 85 1 2.16 12.26 1.55
(2V07) (521QA) Callahan, AL 9,204 8,788 95.48% 416 4.52% 0 0 8,343 0 445 0 133 0 104 0 104 0 75 0 6.99
(2V07) (534) Charleston, SC HCS 114,492 110,656 96.65% 3,836 3.35% 29 11 106,493 2 4,163 1 2,571 3 764 5 158 0 343 0 1.52 6.51 1.92
(2V07) (534) Charleston, SC (Ralph H. Johnson)
56,980 54,369 95.42% 2,611 4.58% 0 9 51,971 1 2,398 0 1,826 3 486 5 109 0 190 0 1.01 5.92 1.16
(2V07) (534BY) Savannah, GA 17,882 17,482 97.76% 400 2.24% 0 0 16,910 0 572 0 255 0 99 0 28 0 18 0 1.87 5.52 3.56
(2V07) (534GB) Myrtle Beach, SC 4,440 4,400 99.10% 40 0.90% 0 1 4,313 1 87 0 29 0 7 0 1 0 3 0 1.59 11.65 1.18
(2V07) (534GC) Beaufort, SC 5,140 5,123 99.67% 17 0.33% 0 0 5,067 0 56 0 12 0 0 0 2 0 3 0 1.17 2.67 1.31
(2V07) (534GD) Goose Creek, SC 12,216 11,904 97.45% 312 2.55% 0 1 11,514 0 390 1 208 0 93 0 5 0 6 0 1.15 8.03 2.96

Pending Appointment and Electronic Wait List Summary -National, Facility, and Division Level Summaries Wait Time Calculated from Preferred
Date
For the period ending: 3/15/2019
1. Total Appts Scheduled
2. Appts Scheduled 30 Days or Under
3. Percent Appts Scheduled 30 Days or Under
4. Appts Scheduled Over 30 Days
5. Percent Appts Scheduled Over 30 Days
6. New Enroll Appt Req
7. EWL Count
8. Appts Between 0-14 Days
9. EWL 0-14 Days
10. Appts Between 15-30 Days
11. EWL 15 -30 days
12. Appts Between 31-60 Days
13. EWL 31 -60 Days
14. Appts Between 61-90 Days
15. EWL 61 -90 Days
16. Appts Between 91-120 Days
17. EWL 91 -120 Days
18. Appts Beyond 120 Days
19. EWL Greater than 120 Days
20. PC Avg Wait Time
21. SC Avg Wait Time
22. MH Avg Wait Time
(2V07) (534GE) Hinesville, GA 8,313 8,224 98.93% 89 1.07% 0 0 8,056 0 168 0 73 0 10 0 5 0 1 0 1.89 1.82 1.75
(2V07) (534GF) Trident 1, SC 1,296 1,290 99.54% 6 0.46% 0 0 1,270 0 20 0 6 0 0 0 0 0 0 0 1.00 16.13
(2V07) (534QA) Market Commons, SC 6,948 6,595 94.92% 353 5.08% 0 0 6,153 0 442 0 154 0 69 0 8 0 122 0 4.12 14.37 2.00
(2V07) (534QB) Trident 2, SC 1,227 1,219 99.35% 8 0.65% 0 0 1,189 0 30 0 8 0 0 0 0 0 0 0 2.39
(2V07) (534QC) Charleston-City Hall Lane, SC
50 50 100.00% 0 0.00% 0 0 50 0 0 0 0 0 0 0 0 0 0 0
(2V07) (544) Columbia, SC HCS 143,952 130,869 90.91% 13,083 9.09% 340 3 123,622 1 7,247 0 5,063 0 2,643 0 1,752 0 3,625 2 2.68 21.01 4.57
(2V07) (544) Columbia, SC (Wm. Jennings Bryan Dorn)
88,791 78,290 88.17% 10,501 11.83% 0 3 72,651 1 5,639 0 4,031 0 2,169 0 1,511 0 2,790 2 3.69 20.08 5.33
(2V07) (544BZ) Greenville, SC 16,422 14,673 89.35% 1,749 10.65% 0 0 13,928 0 745 0 666 0 309 0 82 0 692 0 4.04 30.22 4.55
(2V07) (544GB) Florence, SC 7,898 7,826 99.09% 72 0.91% 0 0 7,717 0 109 0 42 0 20 0 3 0 7 0 1.17 7.03 4.96
(2V07) (544GC) Rock Hill, SC 9,697 9,621 99.22% 76 0.78% 0 0 9,479 0 142 0 44 0 13 0 15 0 4 0 2.40 7.39 1.71
(2V07) (544GD) Anderson, SC 7,036 6,560 93.23% 476 6.77% 0 0 6,205 0 355 0 137 0 94 0 127 0 118 0 2.20 18.25 9.70
(2V07) (544GE) Orangeburg, SC 3,630 3,599 99.15% 31 0.85% 0 0 3,527 0 72 0 19 0 9 0 3 0 0 0 1.22 3.47
(2V07) (544GF) Sumter, SC 3,345 3,265 97.61% 80 2.39% 0 0 3,213 0 52 0 56 0 17 0 6 0 1 0 1.47 4.60
(2V07) (544GG) Spartanburg, SC 6,415 6,393 99.66% 22 0.34% 0 0 6,310 0 83 0 15 0 3 0 2 0 2 0 1.20 2.58 1.72
(2V07) (544HK) Columbia, SC - Mobile 718 642 89.42% 76 10.58% 0 0 592 0 50 0 53 0 9 0 3 0 11 0 10.52
(2V07) (557) Dublin, GA HCS 66,522 60,794 91.39% 5,728 8.61% 3 49 57,495 10 3,299 6 2,320 9 1,418 3 766 0 1,224 21 3.92 20.24 3.91
(2V07) (557) Dublin, GA (Carl Vinson) 38,328 33,654 87.81% 4,674 12.19% 0 36 31,405 8 2,249 3 1,690 4 1,196 1 712 0 1,076 20 5.39 22.56 3.86
(2V07) (557GA) Macon, GA 10,303 9,726 94.40% 577 5.60% 0 11 9,325 2 401 2 323 4 126 2 29 0 99 1 2.12 15.81 4.33
(2V07) (557GB) Albany, GA 4,997 4,819 96.44% 178 3.56% 0 0 4,645 0 174 0 136 0 30 0 6 0 6 0 3.39 5.79 2.97
(2V07) (557GC) Milledgeville, GA 1,332 1,326 99.55% 6 0.45% 0 0 1,308 0 18 0 3 0 1 0 0 0 2 0 1.02 2.69
(2V07) (557GE) Brunswick, GA 4,396 4,368 99.36% 28 0.64% 0 2 4,264 0 104 1 12 1 6 0 2 0 8 0 1.49 2.76 0.79
(2V07) (557GF) Tifton, GA 3,545 3,456 97.49% 89 2.51% 0 0 3,302 0 154 0 51 0 9 0 8 0 21 0 5.27 2.32 3.17
(2V07) (557HA) Perry, GA 3,621 3,445 95.14% 176 4.86% 0 0 3,246 0 199 0 105 0 50 0 9 0 12 0 4.93 34.25 8.55
(2V07) (619) Central Alabama HCS 75,165 67,006 89.15% 8,159 10.85% 7 0 63,317 0 3,689 0 3,688 0 1,901 0 1,075 0 1,495 0 11.05 12.07 12.76
(2V07) (619) Montgomery, AL (Central Alabama)
11,174 9,690 86.72% 1,484 13.28% 0 0 8,924 0 766 0 780 0 328 0 240 0 136 0 9.99 20.05
(2V07) (619A4) Tuskegee, AL (Central Alabama)
16,979 14,678 86.45% 2,301 13.55% 0 0 13,710 0 968 0 1,008 0 526 0 261 0 506 0 12.71 18.34 5.62
(2V07) (619GA) Columbus, GA 10,148 9,264 91.29% 884 8.71% 0 0 8,808 0 456 0 444 0 186 0 80 0 174 0 10.43 8.62 10.83
(2V07) (619GB) Dothan 1, AL 2 2 100.00% 0 0.00% 0 0 2 0 0 0 0 0 0 0 0 0 0 0 4.50
(2V07) (619GD) Wiregrass, AL 7,218 6,031 83.56% 1,187 16.44% 0 0 5,743 0 288 0 339 0 284 0 220 0 344 0 34.97 6.13 5.18
(2V07) (619GE) Monroe County, AL 1,205 1,192 98.92% 13 1.08% 0 0 1,166 0 26 0 10 0 2 0 1 0 0 0 1.48 2.80
(2V07) (619GF) Central Alabama Montgomery, AL
15,325 14,228 92.84% 1,097 7.16% 0 0 13,600 0 628 0 489 0 296 0 168 0 144 0 7.09 8.38 2.30
(2V07) (619QA) Dothan 2, AL 3,844 3,189 82.96% 655 17.04% 0 0 2,955 0 234 0 365 0 183 0 51 0 56 0 12.44 18.20
(2V07) (619QB) Fort Benning, GA 9,270 8,732 94.20% 538 5.80% 0 0 8,409 0 323 0 253 0 96 0 54 0 135 0 5.33 11.60 19.03
(2V07) (679) Tuscaloosa, AL HCS 18,495 16,857 91.14% 1,638 8.86% 5 0 15,533 0 1,324 0 954 0 316 0 206 0 162 0 6.43 11.75 5.77
(2V07) (679) Tuscaloosa, AL 18,356 16,725 91.11% 1,631 8.89% 0 0 15,404 0 1,321 0 951 0 315 0 205 0 160 0 6.43 11.75 5.76
(2V07) (679GA) Selma, AL 89 86 96.63% 3 3.37% 0 0 83 0 3 0 2 0 0 0 1 0 0 0 3.65 7.44
(2V07) (679HK) Tuscaloosa, AL - Mobile 50 46 92.00% 4 8.00% 0 0 46 0 0 0 1 0 1 0 0 0 2 0 10.62
(2V08) (516) Bay Pines, FL HCS 201,352 188,401 93.57% 12,951 6.43% 9 0 179,462 0 8,939 0 7,364 0 2,977 0 1,467 0 1,143 0 2.84 9.93 12.29
(2V08) (516) Bay Pines, FL (C.W. Bill Young)
92,711 86,514 93.32% 6,197 6.68% 0 0 81,893 0 4,621 0 3,740 0 1,443 0 566 0 448 0 4.14 8.19 10.24
(2V08) (516BZ) Lee County, FL 49,545 45,172 91.17% 4,373 8.83% 0 0 42,945 0 2,227 0 2,355 0 1,115 0 482 0 421 0 2.07 12.34 16.59
(2V08) (516GA) Sarasota, FL 11,144 10,973 98.47% 171 1.53% 0 0 10,678 0 295 0 135 0 14 0 7 0 15 0 2.66 4.21 4.53
(2V08) (516GB) St. Petersburg, FL 2,737 2,726 99.60% 11 0.40% 0 0 2,686 0 40 0 6 0 2 0 2 0 1 0 1.31 1.97 2.40
Pending Appointment and Electronic Wait List Summary -National, Facility, and Division Level Summaries Wait Time Calculated from Preferred
Date
For the period ending: 3/15/2019
1. Total Appts Scheduled
2. Appts Scheduled 30 Days or Under
3. Percent Appts Scheduled 30 Days or Under
4. Appts Scheduled Over 30 Days
5. Percent Appts Scheduled Over 30 Days
6. New Enroll Appt Req
7. EWL Count
8. Appts Between 0-14 Days
9. EWL 0-14 Days
10. Appts Between 15-30 Days
11. EWL 15 -30 days
12. Appts Between 31-60 Days
13. EWL 31 -60 Days
14. Appts Between 61-90 Days
15. EWL 61 -90 Days
16. Appts Between 91-120 Days
17. EWL 91 -120 Days
18. Appts Beyond 120 Days
19. EWL Greater than 120 Days
20. PC Avg Wait Time
21. SC Avg Wait Time
22. MH Avg Wait Time
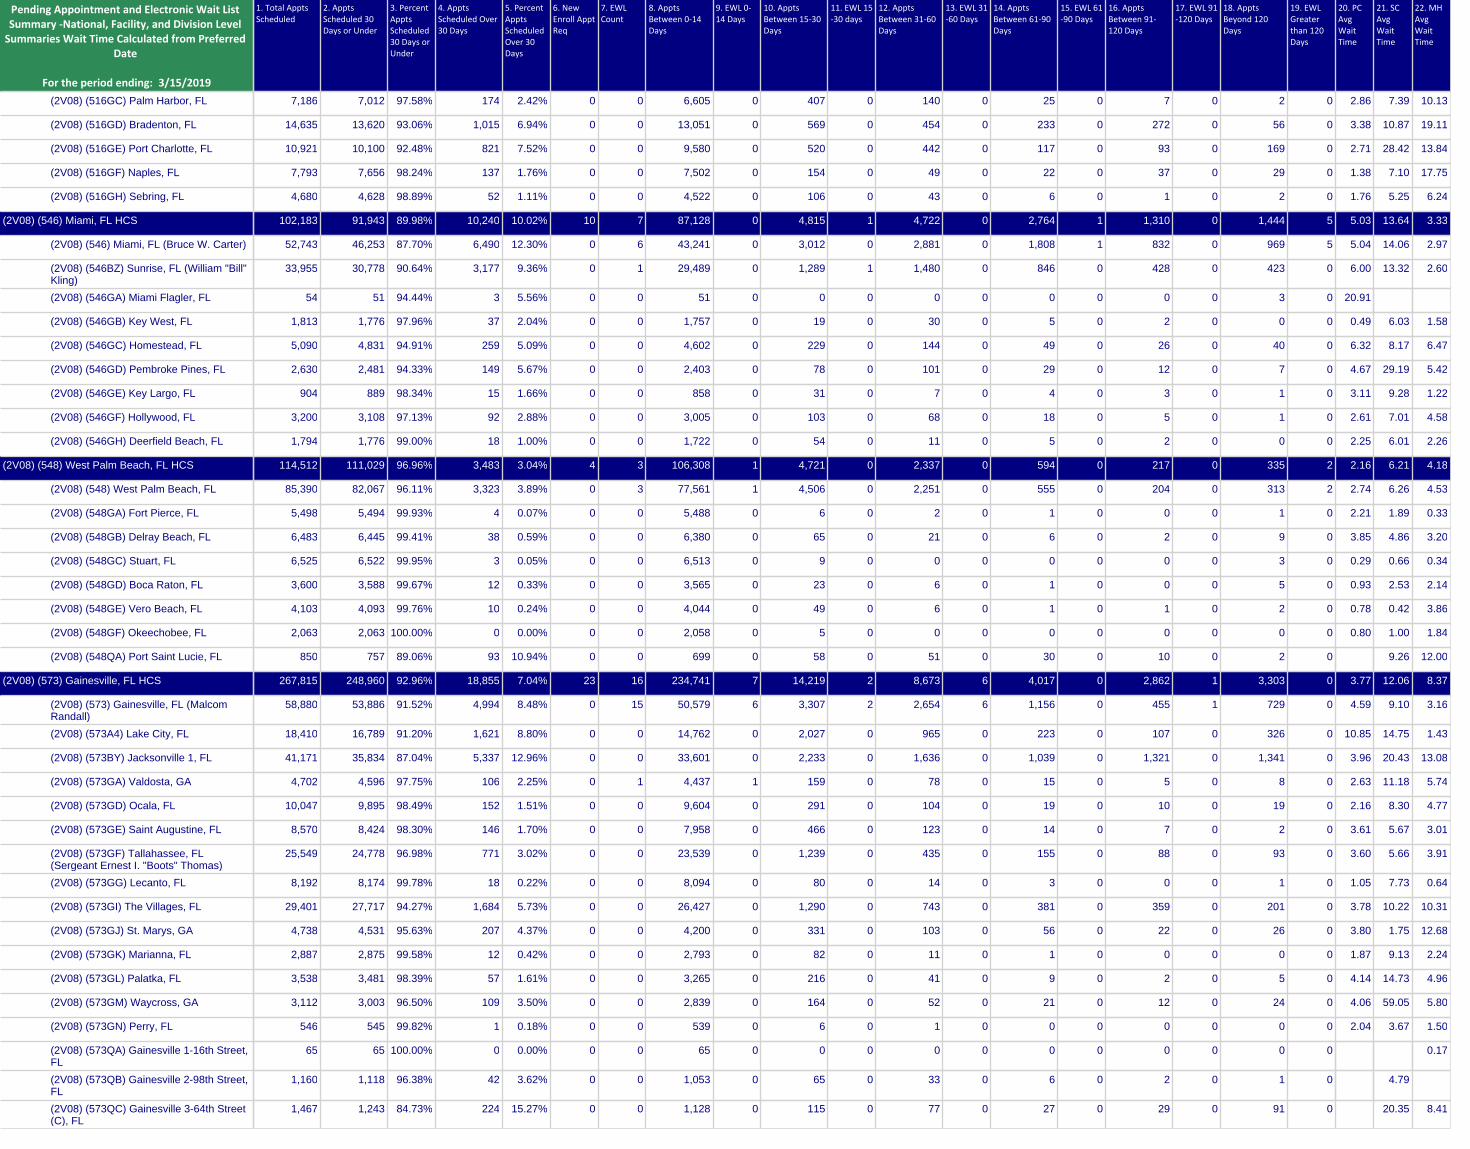
(2V08) (516GC) Palm Harbor, FL 7,186 7,012 97.58% 174 2.42% 0 0 6,605 0 407 0 140 0 25 0 7 0 2 0 2.86 7.39 10.13
(2V08) (516GD) Bradenton, FL 14,635 13,620 93.06% 1,015 6.94% 0 0 13,051 0 569 0 454 0 233 0 272 0 56 0 3.38 10.87 19.11
(2V08) (516GE) Port Charlotte, FL 10,921 10,100 92.48% 821 7.52% 0 0 9,580 0 520 0 442 0 117 0 93 0 169 0 2.71 28.42 13.84
(2V08) (516GF) Naples, FL 7,793 7,656 98.24% 137 1.76% 0 0 7,502 0 154 0 49 0 22 0 37 0 29 0 1.38 7.10 17.75
(2V08) (516GH) Sebring, FL 4,680 4,628 98.89% 52 1.11% 0 0 4,522 0 106 0 43 0 6 0 1 0 2 0 1.76 5.25 6.24
(2V08) (546) Miami, FL HCS 102,183 91,943 89.98% 10,240 10.02% 10 7 87,128 0 4,815 1 4,722 0 2,764 1 1,310 0 1,444 5 5.03 13.64 3.33
(2V08) (546) Miami, FL (Bruce W. Carter) 52,743 46,253 87.70% 6,490 12.30% 0 6 43,241 0 3,012 0 2,881 0 1,808 1 832 0 969 5 5.04 14.06 2.97
(2V08) (546BZ) Sunrise, FL (William "Bill" Kling)
33,955 30,778 90.64% 3,177 9.36% 0 1 29,489 0 1,289 1 1,480 0 846 0 428 0 423 0 6.00 13.32 2.60
(2V08) (546GA) Miami Flagler, FL 54 51 94.44% 3 5.56% 0 0 51 0 0 0 0 0 0 0 0 0 3 0 20.91
(2V08) (546GB) Key West, FL 1,813 1,776 97.96% 37 2.04% 0 0 1,757 0 19 0 30 0 5 0 2 0 0 0 0.49 6.03 1.58
(2V08) (546GC) Homestead, FL 5,090 4,831 94.91% 259 5.09% 0 0 4,602 0 229 0 144 0 49 0 26 0 40 0 6.32 8.17 6.47
(2V08) (546GD) Pembroke Pines, FL 2,630 2,481 94.33% 149 5.67% 0 0 2,403 0 78 0 101 0 29 0 12 0 7 0 4.67 29.19 5.42
(2V08) (546GE) Key Largo, FL 904 889 98.34% 15 1.66% 0 0 858 0 31 0 7 0 4 0 3 0 1 0 3.11 9.28 1.22
(2V08) (546GF) Hollywood, FL 3,200 3,108 97.13% 92 2.88% 0 0 3,005 0 103 0 68 0 18 0 5 0 1 0 2.61 7.01 4.58
(2V08) (546GH) Deerfield Beach, FL 1,794 1,776 99.00% 18 1.00% 0 0 1,722 0 54 0 11 0 5 0 2 0 0 0 2.25 6.01 2.26
(2V08) (548) West Palm Beach, FL HCS 114,512 111,029 96.96% 3,483 3.04% 4 3 106,308 1 4,721 0 2,337 0 594 0 217 0 335 2 2.16 6.21 4.18
(2V08) (548) West Palm Beach, FL 85,390 82,067 96.11% 3,323 3.89% 0 3 77,561 1 4,506 0 2,251 0 555 0 204 0 313 2 2.74 6.26 4.53
(2V08) (548GA) Fort Pierce, FL 5,498 5,494 99.93% 4 0.07% 0 0 5,488 0 6 0 2 0 1 0 0 0 1 0 2.21 1.89 0.33
(2V08) (548GB) Delray Beach, FL 6,483 6,445 99.41% 38 0.59% 0 0 6,380 0 65 0 21 0 6 0 2 0 9 0 3.85 4.86 3.20
(2V08) (548GC) Stuart, FL 6,525 6,522 99.95% 3 0.05% 0 0 6,513 0 9 0 0 0 0 0 0 0 3 0 0.29 0.66 0.34
(2V08) (548GD) Boca Raton, FL 3,600 3,588 99.67% 12 0.33% 0 0 3,565 0 23 0 6 0 1 0 0 0 5 0 0.93 2.53 2.14
(2V08) (548GE) Vero Beach, FL 4,103 4,093 99.76% 10 0.24% 0 0 4,044 0 49 0 6 0 1 0 1 0 2 0 0.78 0.42 3.86
(2V08) (548GF) Okeechobee, FL 2,063 2,063 100.00% 0 0.00% 0 0 2,058 0 5 0 0 0 0 0 0 0 0 0 0.80 1.00 1.84
(2V08) (548QA) Port Saint Lucie, FL 850 757 89.06% 93 10.94% 0 0 699 0 58 0 51 0 30 0 10 0 2 0 9.26 12.00
(2V08) (573) Gainesville, FL HCS 267,815 248,960 92.96% 18,855 7.04% 23 16 234,741 7 14,219 2 8,673 6 4,017 0 2,862 1 3,303 0 3.77 12.06 8.37
(2V08) (573) Gainesville, FL (Malcom Randall)
58,880 53,886 91.52% 4,994 8.48% 0 15 50,579 6 3,307 2 2,654 6 1,156 0 455 1 729 0 4.59 9.10 3.16
(2V08) (573A4) Lake City, FL 18,410 16,789 91.20% 1,621 8.80% 0 0 14,762 0 2,027 0 965 0 223 0 107 0 326 0 10.85 14.75 1.43
(2V08) (573BY) Jacksonville 1, FL 41,171 35,834 87.04% 5,337 12.96% 0 0 33,601 0 2,233 0 1,636 0 1,039 0 1,321 0 1,341 0 3.96 20.43 13.08
(2V08) (573GA) Valdosta, GA 4,702 4,596 97.75% 106 2.25% 0 1 4,437 1 159 0 78 0 15 0 5 0 8 0 2.63 11.18 5.74
(2V08) (573GD) Ocala, FL 10,047 9,895 98.49% 152 1.51% 0 0 9,604 0 291 0 104 0 19 0 10 0 19 0 2.16 8.30 4.77
(2V08) (573GE) Saint Augustine, FL 8,570 8,424 98.30% 146 1.70% 0 0 7,958 0 466 0 123 0 14 0 7 0 2 0 3.61 5.67 3.01
(2V08) (573GF) Tallahassee, FL (Sergeant Ernest I. "Boots" Thomas)
25,549 24,778 96.98% 771 3.02% 0 0 23,539 0 1,239 0 435 0 155 0 88 0 93 0 3.60 5.66 3.91
(2V08) (573GG) Lecanto, FL 8,192 8,174 99.78% 18 0.22% 0 0 8,094 0 80 0 14 0 3 0 0 0 1 0 1.05 7.73 0.64
(2V08) (573GI) The Villages, FL 29,401 27,717 94.27% 1,684 5.73% 0 0 26,427 0 1,290 0 743 0 381 0 359 0 201 0 3.78 10.22 10.31
(2V08) (573GJ) St. Marys, GA 4,738 4,531 95.63% 207 4.37% 0 0 4,200 0 331 0 103 0 56 0 22 0 26 0 3.80 1.75 12.68
(2V08) (573GK) Marianna, FL 2,887 2,875 99.58% 12 0.42% 0 0 2,793 0 82 0 11 0 1 0 0 0 0 0 1.87 9.13 2.24
(2V08) (573GL) Palatka, FL 3,538 3,481 98.39% 57 1.61% 0 0 3,265 0 216 0 41 0 9 0 2 0 5 0 4.14 14.73 4.96
(2V08) (573GM) Waycross, GA 3,112 3,003 96.50% 109 3.50% 0 0 2,839 0 164 0 52 0 21 0 12 0 24 0 4.06 59.05 5.80
(2V08) (573GN) Perry, FL 546 545 99.82% 1 0.18% 0 0 539 0 6 0 1 0 0 0 0 0 0 0 2.04 3.67 1.50
(2V08) (573QA) Gainesville 1-16th Street, FL
65 65 100.00% 0 0.00% 0 0 65 0 0 0 0 0 0 0 0 0 0 0 0.17
(2V08) (573QB) Gainesville 2-98th Street, FL
1,160 1,118 96.38% 42 3.62% 0 0 1,053 0 65 0 33 0 6 0 2 0 1 0 4.79
(2V08) (573QC) Gainesville 3-64th Street (C), FL
1,467 1,243 84.73% 224 15.27% 0 0 1,128 0 115 0 77 0 27 0 29 0 91 0 20.35 8.41

Pending Appointment and Electronic Wait List Summary -National, Facility, and Division Level Summaries Wait Time Calculated from Preferred
Date
For the period ending: 3/15/2019
1. Total Appts Scheduled
2. Appts Scheduled 30 Days or Under
3. Percent Appts Scheduled 30 Days or Under
4. Appts Scheduled Over 30 Days
5. Percent Appts Scheduled Over 30 Days
6. New Enroll Appt Req
7. EWL Count
8. Appts Between 0-14 Days
9. EWL 0-14 Days
10. Appts Between 15-30 Days
11. EWL 15 -30 days
12. Appts Between 31-60 Days
13. EWL 31 -60 Days
14. Appts Between 61-90 Days
15. EWL 61 -90 Days
16. Appts Between 91-120 Days
17. EWL 91 -120 Days
18. Appts Beyond 120 Days
19. EWL Greater than 120 Days
20. PC Avg Wait Time
21. SC Avg Wait Time
22. MH Avg Wait Time
(2V08) (573QD) Gainesville 4-64th Street (O), FL
6,347 6,130 96.58% 217 3.42% 0 0 5,826 0 304 0 176 0 20 0 5 0 16 0 4.71
(2V08) (573QE) Gainesville 5-64th Street (D), FL
4,551 3,950 86.79% 601 13.21% 0 0 3,702 0 248 0 239 0 194 0 81 0 87 0 13.95
(2V08) (573QF) Gainesville 6-23rd Avenue, FL
50 9 18.00% 41 82.00% 0 0 9 0 0 0 1 0 5 0 5 0 30 0 0.00
(2V08) (573QG) Jacksonville Southpoint, FL
14,372 13,346 92.86% 1,026 7.14% 0 0 12,612 0 734 0 432 0 269 0 183 0 142 0 2.22 9.32 21.64
(2V08) (573QH) Ocala West, FL 5,548 4,797 86.46% 751 13.54% 0 0 4,573 0 224 0 467 0 225 0 27 0 32 0 9.98
(2V08) (573QJ) Jacksonville 2 University Boulevard, FL
10,934 10,257 93.81% 677 6.19% 0 0 9,929 0 328 0 239 0 173 0 137 0 128 0 3.56 8.79 16.91
(2V08) (573QK) Lake City, FL 3,578 3,517 98.30% 61 1.70% 0 0 3,207 0 310 0 49 0 6 0 5 0 1 0 5.50 0.00 0.00
(2V08) (672) San Juan, PR HCS 153,877 142,921 92.88% 10,956 7.12% 1 159 131,546 24 11,375 17 5,759 20 2,445 12 1,528 18 1,224 68 5.11 10.74 7.22
(2V08) (672) San Juan, PR 102,399 94,214 92.01% 8,185 7.99% 0 114 86,464 19 7,750 15 4,108 15 1,842 7 1,237 7 998 51 6.20 10.95 7.26
(2V08) (672B0) Ponce, PR (Euripides Rubio)
19,447 18,542 95.35% 905 4.65% 0 42 17,509 2 1,033 2 577 5 255 5 52 11 21 17 3.30 8.03 2.96
(2V08) (672BZ) Mayaguez, PR 19,033 17,572 92.32% 1,461 7.68% 0 3 15,682 3 1,890 0 858 0 271 0 186 0 146 0 5.21 10.94 13.10
(2V08) (672GA) Saint Croix, VI 742 715 96.36% 27 3.64% 0 0 700 0 15 0 7 0 6 0 3 0 11 0 0.45 45.67 3.08
(2V08) (672GB) Saint Thomas, VI 852 807 94.72% 45 5.28% 0 0 772 0 35 0 9 0 10 0 15 0 11 0 2.59 48.97 69.50
(2V08) (672GC) Arecibo, PR 4,797 4,631 96.54% 166 3.46% 0 0 4,305 0 326 0 113 0 27 0 14 0 12 0 4.59 3.48 6.93
(2V08) (672GD) Ceiba, PR 3,521 3,405 96.71% 116 3.29% 0 0 3,206 0 199 0 52 0 23 0 18 0 23 0 4.42 24.57 0.59
(2V08) (672GE) Guayama, PR 2,196 2,157 98.22% 39 1.78% 0 0 2,087 0 70 0 27 0 8 0 3 0 1 0 1.28 10.18 4.00
(2V08) (672QA) Comerio, PR 466 462 99.14% 4 0.86% 0 0 429 0 33 0 1 0 3 0 0 0 0 0 5.98 9.81
(2V08) (672QB) Utuado, PR 264 263 99.62% 1 0.38% 0 0 259 0 4 0 1 0 0 0 0 0 0 0 1.92 0.79
(2V08) (672QC) Vieques, PR 160 153 95.63% 7 4.38% 0 0 133 0 20 0 6 0 0 0 0 0 1 0 7.18 18.38 28.00
(2V08) (673) Tampa, FL HCS 191,688 184,242 96.12% 7,446 3.88% 3 7 174,366 5 9,876 2 4,574 0 1,516 0 598 0 758 0 2.01 7.33 3.15
(2V08) (673) Tampa, FL (James A. Haley) 59,159 56,486 95.48% 2,673 4.52% 0 7 52,869 5 3,617 2 2,006 0 401 0 138 0 128 0 2.33 5.45 4.39
(2V08) (673BV) Tampa, FL - VADOM 3 3 100.00% 0 0.00% 0 0 3 0 0 0 0 0 0 0 0 0 0 0
(2V08) (673BZ) New Port Richey, FL 18,039 17,605 97.59% 434 2.41% 0 0 16,897 0 708 0 371 0 45 0 2 0 16 0 2.12 7.14 5.16
(2V08) (673GB) Lakeland, FL 11,766 11,642 98.95% 124 1.05% 0 0 11,283 0 359 0 110 0 13 0 1 0 0 0 2.07 3.24 0.00
(2V08) (673GC) Brooksville, FL 8,363 8,310 99.37% 53 0.63% 0 0 8,019 0 291 0 49 0 4 0 0 0 0 0 1.43 4.27 1.99
(2V08) (673GF) Zephyrhills, FL 3,350 3,280 97.91% 70 2.09% 0 0 3,200 0 80 0 58 0 7 0 5 0 0 0 2.65 7.25
(2V08) (673QA) Forty Sixth Street North, FL
717 696 97.07% 21 2.93% 0 0 484 0 212 0 20 0 1 0 0 0 0 0 10.47 10.47
(2V08) (673QB) Forty Sixth Street South, FL
31,837 31,186 97.96% 651 2.04% 0 0 29,436 0 1,750 0 332 0 166 0 44 0 109 0 4.76 2.01
(2V08) (673QC) West Lakeland, FL 5,355 4,804 89.71% 551 10.29% 0 0 4,358 0 446 0 429 0 92 0 15 0 15 0 7.42 6.08
(2V08) (673QD) Deer Park, FL 2,221 1,377 62.00% 844 38.00% 0 0 1,143 0 234 0 215 0 166 0 178 0 285 0 44.44
(2V08) (673QE) Highway Nineteen, FL 3,122 2,830 90.65% 292 9.35% 0 0 2,735 0 95 0 95 0 109 0 47 0 41 0 10.62
(2V08) (673QF) Winners Circle, FL 5 5 100.00% 0 0.00% 0 0 5 0 0 0 0 0 0 0 0 0 0 0
(2V08) (673QG) Little Road, FL 1,214 1,183 97.45% 31 2.55% 0 0 1,108 0 75 0 27 0 3 0 0 0 1 0 3.94
(2V08) (673QH) Bruce B. Downs Boulevard, FL
9,224 9,113 98.80% 111 1.20% 0 0 8,754 0 359 0 66 0 35 0 2 0 8 0 3.11
(2V08) (673QI) Medical View Lane, FL 672 671 99.85% 1 0.15% 0 0 656 0 15 0 1 0 0 0 0 0 0 0 0.00 1.82 1.22
(2V08) (673QJ) Hidden River, FL 36,641 35,051 95.66% 1,590 4.34% 0 0 33,416 0 1,635 0 795 0 474 0 166 0 155 0 1.89 18.90 1.22
(2V08) (675) Orlando, FL HCS 236,948 224,056 94.56% 12,892 5.44% 29 3 209,684 2 14,372 0 7,921 0 2,555 0 1,046 1 1,370 0 2.68 9.20 4.24
(2V08) (675) Orlando-Lake Nona, FL 95,588 86,445 90.43% 9,143 9.57% 0 2 78,475 1 7,970 0 5,334 0 1,858 0 768 1 1,183 0 4.68 10.86 7.38
(2V08) (675GA) Viera, FL 49,772 48,479 97.40% 1,293 2.60% 0 0 46,112 0 2,367 0 885 0 267 0 109 0 32 0 1.91 5.68 4.47
(2V08) (675GB) Daytona Beach, FL (William V. Chappell, Jr.)
31,014 30,158 97.24% 856 2.76% 0 1 28,911 1 1,247 0 481 0 256 0 70 0 49 0 2.69 5.39 4.38
(2V08) (675GC) Kissimmee, FL 5,512 5,474 99.31% 38 0.69% 0 0 5,311 0 163 0 30 0 5 0 3 0 0 0 2.35 0.00 2.81
Pending Appointment and Electronic Wait List Summary -National, Facility, and Division Level Summaries Wait Time Calculated from Preferred
Date
For the period ending: 3/15/2019
1. Total Appts Scheduled
2. Appts Scheduled 30 Days or Under
3. Percent Appts Scheduled 30 Days or Under
4. Appts Scheduled Over 30 Days
5. Percent Appts Scheduled Over 30 Days
6. New Enroll Appt Req
7. EWL Count
8. Appts Between 0-14 Days
9. EWL 0-14 Days
10. Appts Between 15-30 Days
11. EWL 15 -30 days
12. Appts Between 31-60 Days
13. EWL 31 -60 Days
14. Appts Between 61-90 Days
15. EWL 61 -90 Days
16. Appts Between 91-120 Days
17. EWL 91 -120 Days
18. Appts Beyond 120 Days
19. EWL Greater than 120 Days
20. PC Avg Wait Time
21. SC Avg Wait Time
22. MH Avg Wait Time
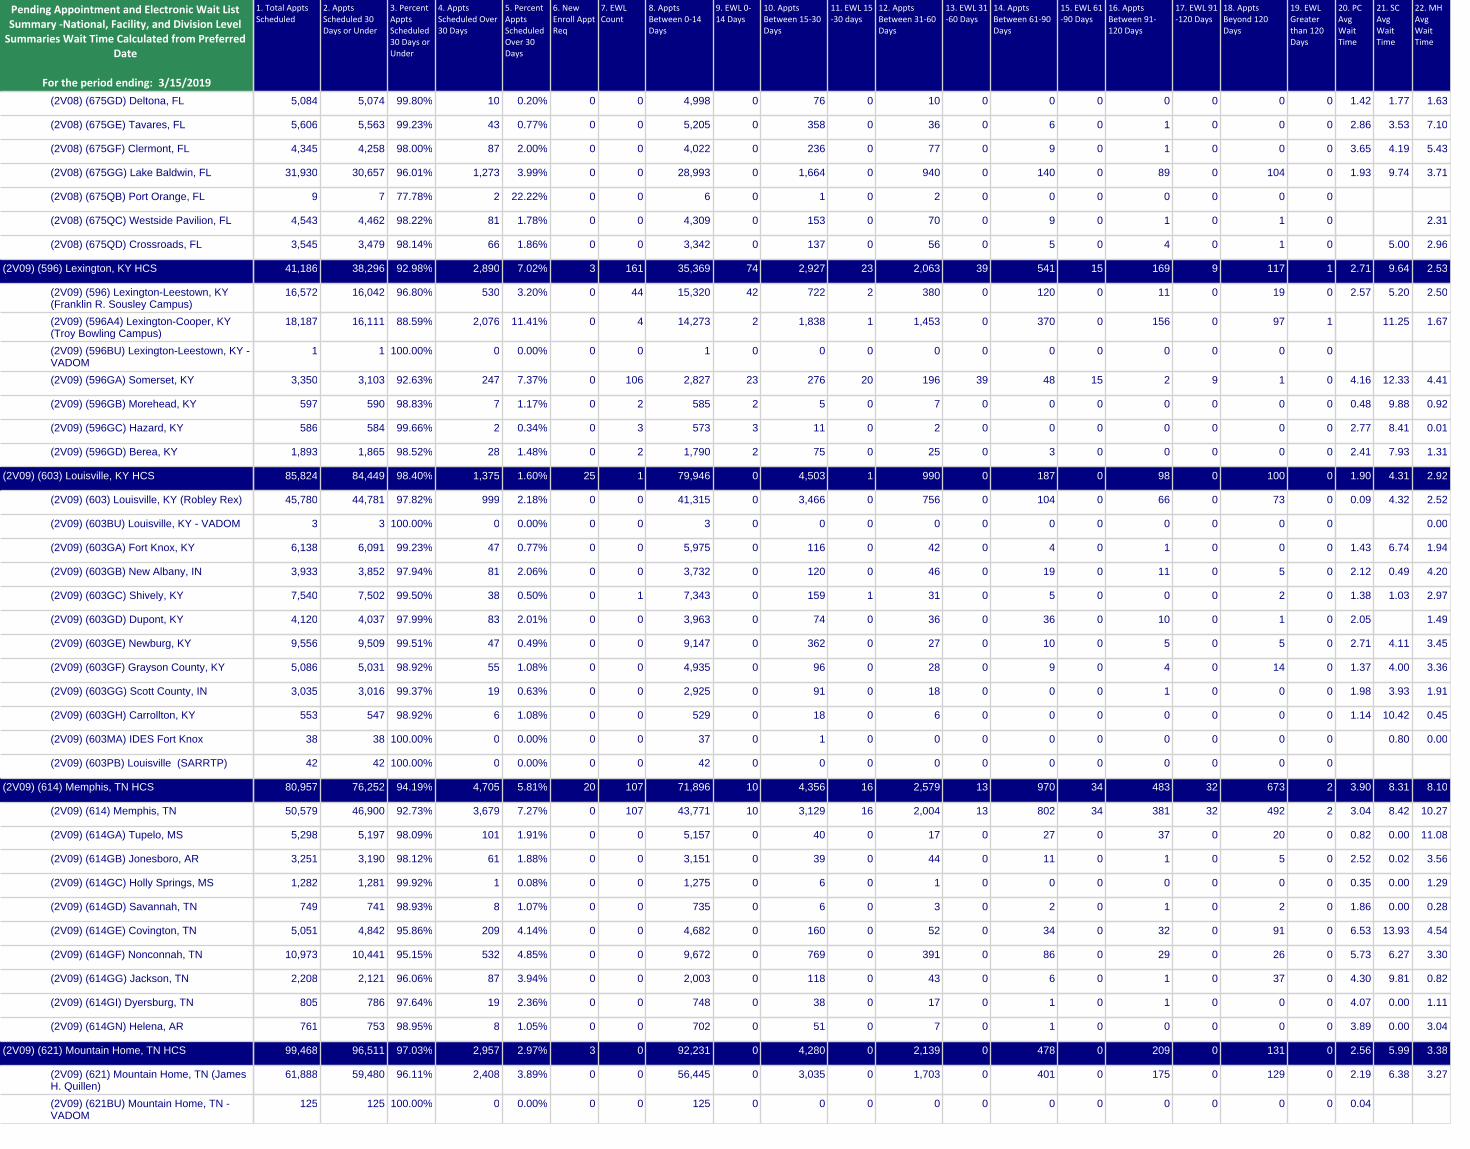
(2V08) (675GD) Deltona, FL 5,084 5,074 99.80% 10 0.20% 0 0 4,998 0 76 0 10 0 0 0 0 0 0 0 1.42 1.77 1.63
(2V08) (675GE) Tavares, FL 5,606 5,563 99.23% 43 0.77% 0 0 5,205 0 358 0 36 0 6 0 1 0 0 0 2.86 3.53 7.10
(2V08) (675GF) Clermont, FL 4,345 4,258 98.00% 87 2.00% 0 0 4,022 0 236 0 77 0 9 0 1 0 0 0 3.65 4.19 5.43
(2V08) (675GG) Lake Baldwin, FL 31,930 30,657 96.01% 1,273 3.99% 0 0 28,993 0 1,664 0 940 0 140 0 89 0 104 0 1.93 9.74 3.71
(2V08) (675QB) Port Orange, FL 9 7 77.78% 2 22.22% 0 0 6 0 1 0 2 0 0 0 0 0 0 0
(2V08) (675QC) Westside Pavilion, FL 4,543 4,462 98.22% 81 1.78% 0 0 4,309 0 153 0 70 0 9 0 1 0 1 0 2.31
(2V08) (675QD) Crossroads, FL 3,545 3,479 98.14% 66 1.86% 0 0 3,342 0 137 0 56 0 5 0 4 0 1 0 5.00 2.96
(2V09) (596) Lexington, KY HCS 41,186 38,296 92.98% 2,890 7.02% 3 161 35,369 74 2,927 23 2,063 39 541 15 169 9 117 1 2.71 9.64 2.53
(2V09) (596) Lexington-Leestown, KY (Franklin R. Sousley Campus)
16,572 16,042 96.80% 530 3.20% 0 44 15,320 42 722 2 380 0 120 0 11 0 19 0 2.57 5.20 2.50
(2V09) (596A4) Lexington-Cooper, KY (Troy Bowling Campus)
18,187 16,111 88.59% 2,076 11.41% 0 4 14,273 2 1,838 1 1,453 0 370 0 156 0 97 1 11.25 1.67
(2V09) (596BU) Lexington-Leestown, KY -VADOM
1 1 100.00% 0 0.00% 0 0 1 0 0 0 0 0 0 0 0 0 0 0
(2V09) (596GA) Somerset, KY 3,350 3,103 92.63% 247 7.37% 0 106 2,827 23 276 20 196 39 48 15 2 9 1 0 4.16 12.33 4.41
(2V09) (596GB) Morehead, KY 597 590 98.83% 7 1.17% 0 2 585 2 5 0 7 0 0 0 0 0 0 0 0.48 9.88 0.92
(2V09) (596GC) Hazard, KY 586 584 99.66% 2 0.34% 0 3 573 3 11 0 2 0 0 0 0 0 0 0 2.77 8.41 0.01
(2V09) (596GD) Berea, KY 1,893 1,865 98.52% 28 1.48% 0 2 1,790 2 75 0 25 0 3 0 0 0 0 0 2.41 7.93 1.31
(2V09) (603) Louisville, KY HCS 85,824 84,449 98.40% 1,375 1.60% 25 1 79,946 0 4,503 1 990 0 187 0 98 0 100 0 1.90 4.31 2.92
(2V09) (603) Louisville, KY (Robley Rex) 45,780 44,781 97.82% 999 2.18% 0 0 41,315 0 3,466 0 756 0 104 0 66 0 73 0 0.09 4.32 2.52
(2V09) (603BU) Louisville, KY - VADOM 3 3 100.00% 0 0.00% 0 0 3 0 0 0 0 0 0 0 0 0 0 0 0.00
(2V09) (603GA) Fort Knox, KY 6,138 6,091 99.23% 47 0.77% 0 0 5,975 0 116 0 42 0 4 0 1 0 0 0 1.43 6.74 1.94
(2V09) (603GB) New Albany, IN 3,933 3,852 97.94% 81 2.06% 0 0 3,732 0 120 0 46 0 19 0 11 0 5 0 2.12 0.49 4.20
(2V09) (603GC) Shively, KY 7,540 7,502 99.50% 38 0.50% 0 1 7,343 0 159 1 31 0 5 0 0 0 2 0 1.38 1.03 2.97
(2V09) (603GD) Dupont, KY 4,120 4,037 97.99% 83 2.01% 0 0 3,963 0 74 0 36 0 36 0 10 0 1 0 2.05 1.49
(2V09) (603GE) Newburg, KY 9,556 9,509 99.51% 47 0.49% 0 0 9,147 0 362 0 27 0 10 0 5 0 5 0 2.71 4.11 3.45
(2V09) (603GF) Grayson County, KY 5,086 5,031 98.92% 55 1.08% 0 0 4,935 0 96 0 28 0 9 0 4 0 14 0 1.37 4.00 3.36
(2V09) (603GG) Scott County, IN 3,035 3,016 99.37% 19 0.63% 0 0 2,925 0 91 0 18 0 0 0 1 0 0 0 1.98 3.93 1.91
(2V09) (603GH) Carrollton, KY 553 547 98.92% 6 1.08% 0 0 529 0 18 0 6 0 0 0 0 0 0 0 1.14 10.42 0.45
(2V09) (603MA) IDES Fort Knox 38 38 100.00% 0 0.00% 0 0 37 0 1 0 0 0 0 0 0 0 0 0 0.80 0.00
(2V09) (603PB) Louisville (SARRTP) 42 42 100.00% 0 0.00% 0 0 42 0 0 0 0 0 0 0 0 0 0 0
(2V09) (614) Memphis, TN HCS 80,957 76,252 94.19% 4,705 5.81% 20 107 71,896 10 4,356 16 2,579 13 970 34 483 32 673 2 3.90 8.31 8.10
(2V09) (614) Memphis, TN 50,579 46,900 92.73% 3,679 7.27% 0 107 43,771 10 3,129 16 2,004 13 802 34 381 32 492 2 3.04 8.42 10.27
(2V09) (614GA) Tupelo, MS 5,298 5,197 98.09% 101 1.91% 0 0 5,157 0 40 0 17 0 27 0 37 0 20 0 0.82 0.00 11.08
(2V09) (614GB) Jonesboro, AR 3,251 3,190 98.12% 61 1.88% 0 0 3,151 0 39 0 44 0 11 0 1 0 5 0 2.52 0.02 3.56
(2V09) (614GC) Holly Springs, MS 1,282 1,281 99.92% 1 0.08% 0 0 1,275 0 6 0 1 0 0 0 0 0 0 0 0.35 0.00 1.29
(2V09) (614GD) Savannah, TN 749 741 98.93% 8 1.07% 0 0 735 0 6 0 3 0 2 0 1 0 2 0 1.86 0.00 0.28
(2V09) (614GE) Covington, TN 5,051 4,842 95.86% 209 4.14% 0 0 4,682 0 160 0 52 0 34 0 32 0 91 0 6.53 13.93 4.54
(2V09) (614GF) Nonconnah, TN 10,973 10,441 95.15% 532 4.85% 0 0 9,672 0 769 0 391 0 86 0 29 0 26 0 5.73 6.27 3.30
(2V09) (614GG) Jackson, TN 2,208 2,121 96.06% 87 3.94% 0 0 2,003 0 118 0 43 0 6 0 1 0 37 0 4.30 9.81 0.82
(2V09) (614GI) Dyersburg, TN 805 786 97.64% 19 2.36% 0 0 748 0 38 0 17 0 1 0 1 0 0 0 4.07 0.00 1.11
(2V09) (614GN) Helena, AR 761 753 98.95% 8 1.05% 0 0 702 0 51 0 7 0 1 0 0 0 0 0 3.89 0.00 3.04
(2V09) (621) Mountain Home, TN HCS 99,468 96,511 97.03% 2,957 2.97% 3 0 92,231 0 4,280 0 2,139 0 478 0 209 0 131 0 2.56 5.99 3.38
(2V09) (621) Mountain Home, TN (James H. Quillen)
61,888 59,480 96.11% 2,408 3.89% 0 0 56,445 0 3,035 0 1,703 0 401 0 175 0 129 0 2.19 6.38 3.27
(2V09) (621BU) Mountain Home, TN -VADOM
125 125 100.00% 0 0.00% 0 0 125 0 0 0 0 0 0 0 0 0 0 0 0.04
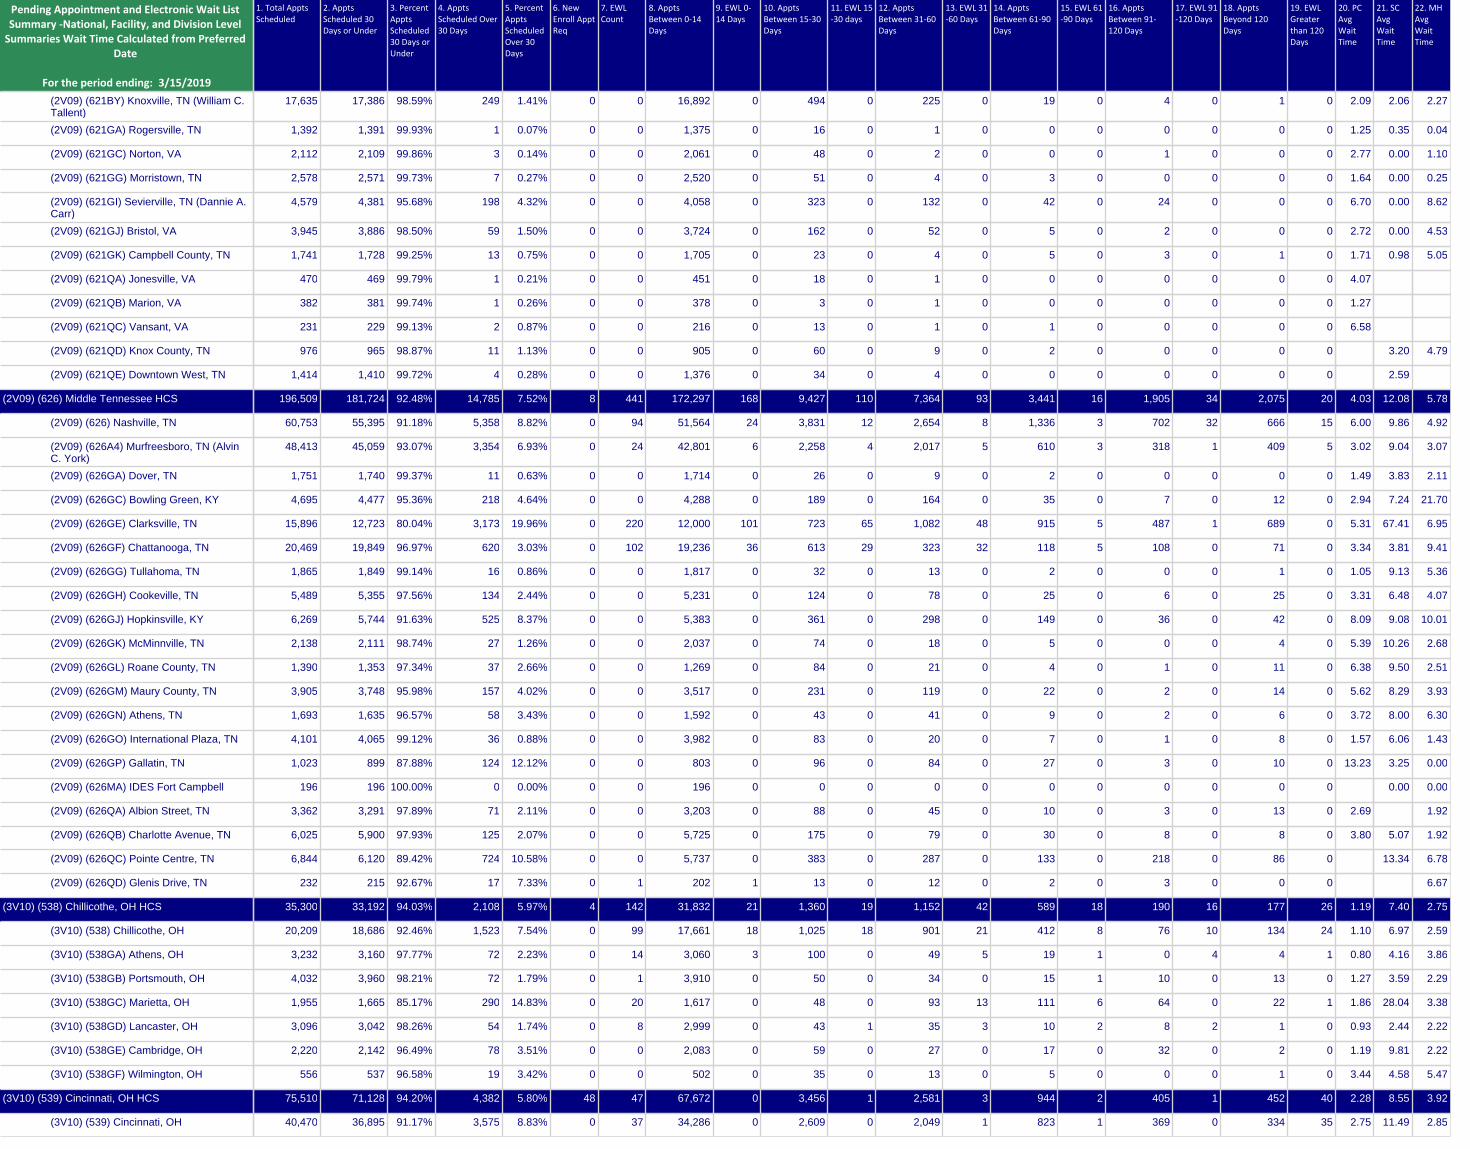
Pending Appointment and Electronic Wait List Summary -National, Facility, and Division Level Summaries Wait Time Calculated from Preferred
Date
For the period ending: 3/15/2019
1. Total Appts Scheduled
2. Appts Scheduled 30 Days or Under
3. Percent Appts Scheduled 30 Days or Under
4. Appts Scheduled Over 30 Days
5. Percent Appts Scheduled Over 30 Days
6. New Enroll Appt Req
7. EWL Count
8. Appts Between 0-14 Days
9. EWL 0-14 Days
10. Appts Between 15-30 Days
11. EWL 15 -30 days
12. Appts Between 31-60 Days
13. EWL 31 -60 Days
14. Appts Between 61-90 Days
15. EWL 61 -90 Days
16. Appts Between 91-120 Days
17. EWL 91 -120 Days
18. Appts Beyond 120 Days
19. EWL Greater than 120 Days
20. PC Avg Wait Time
21. SC Avg Wait Time
22. MH Avg Wait Time
(2V09) (621BY) Knoxville, TN (William C. Tallent)
17,635 17,386 98.59% 249 1.41% 0 0 16,892 0 494 0 225 0 19 0 4 0 1 0 2.09 2.06 2.27
(2V09) (621GA) Rogersville, TN 1,392 1,391 99.93% 1 0.07% 0 0 1,375 0 16 0 1 0 0 0 0 0 0 0 1.25 0.35 0.04
(2V09) (621GC) Norton, VA 2,112 2,109 99.86% 3 0.14% 0 0 2,061 0 48 0 2 0 0 0 1 0 0 0 2.77 0.00 1.10
(2V09) (621GG) Morristown, TN 2,578 2,571 99.73% 7 0.27% 0 0 2,520 0 51 0 4 0 3 0 0 0 0 0 1.64 0.00 0.25
(2V09) (621GI) Sevierville, TN (Dannie A. Carr)
4,579 4,381 95.68% 198 4.32% 0 0 4,058 0 323 0 132 0 42 0 24 0 0 0 6.70 0.00 8.62
(2V09) (621GJ) Bristol, VA 3,945 3,886 98.50% 59 1.50% 0 0 3,724 0 162 0 52 0 5 0 2 0 0 0 2.72 0.00 4.53
(2V09) (621GK) Campbell County, TN 1,741 1,728 99.25% 13 0.75% 0 0 1,705 0 23 0 4 0 5 0 3 0 1 0 1.71 0.98 5.05
(2V09) (621QA) Jonesville, VA 470 469 99.79% 1 0.21% 0 0 451 0 18 0 1 0 0 0 0 0 0 0 4.07
(2V09) (621QB) Marion, VA 382 381 99.74% 1 0.26% 0 0 378 0 3 0 1 0 0 0 0 0 0 0 1.27
(2V09) (621QC) Vansant, VA 231 229 99.13% 2 0.87% 0 0 216 0 13 0 1 0 1 0 0 0 0 0 6.58
(2V09) (621QD) Knox County, TN 976 965 98.87% 11 1.13% 0 0 905 0 60 0 9 0 2 0 0 0 0 0 3.20 4.79
(2V09) (621QE) Downtown West, TN 1,414 1,410 99.72% 4 0.28% 0 0 1,376 0 34 0 4 0 0 0 0 0 0 0 2.59
(2V09) (626) Middle Tennessee HCS 196,509 181,724 92.48% 14,785 7.52% 8 441 172,297 168 9,427 110 7,364 93 3,441 16 1,905 34 2,075 20 4.03 12.08 5.78
(2V09) (626) Nashville, TN 60,753 55,395 91.18% 5,358 8.82% 0 94 51,564 24 3,831 12 2,654 8 1,336 3 702 32 666 15 6.00 9.86 4.92
(2V09) (626A4) Murfreesboro, TN (Alvin C. York)
48,413 45,059 93.07% 3,354 6.93% 0 24 42,801 6 2,258 4 2,017 5 610 3 318 1 409 5 3.02 9.04 3.07
(2V09) (626GA) Dover, TN 1,751 1,740 99.37% 11 0.63% 0 0 1,714 0 26 0 9 0 2 0 0 0 0 0 1.49 3.83 2.11
(2V09) (626GC) Bowling Green, KY 4,695 4,477 95.36% 218 4.64% 0 0 4,288 0 189 0 164 0 35 0 7 0 12 0 2.94 7.24 21.70
(2V09) (626GE) Clarksville, TN 15,896 12,723 80.04% 3,173 19.96% 0 220 12,000 101 723 65 1,082 48 915 5 487 1 689 0 5.31 67.41 6.95
(2V09) (626GF) Chattanooga, TN 20,469 19,849 96.97% 620 3.03% 0 102 19,236 36 613 29 323 32 118 5 108 0 71 0 3.34 3.81 9.41
(2V09) (626GG) Tullahoma, TN 1,865 1,849 99.14% 16 0.86% 0 0 1,817 0 32 0 13 0 2 0 0 0 1 0 1.05 9.13 5.36
(2V09) (626GH) Cookeville, TN 5,489 5,355 97.56% 134 2.44% 0 0 5,231 0 124 0 78 0 25 0 6 0 25 0 3.31 6.48 4.07
(2V09) (626GJ) Hopkinsville, KY 6,269 5,744 91.63% 525 8.37% 0 0 5,383 0 361 0 298 0 149 0 36 0 42 0 8.09 9.08 10.01
(2V09) (626GK) McMinnville, TN 2,138 2,111 98.74% 27 1.26% 0 0 2,037 0 74 0 18 0 5 0 0 0 4 0 5.39 10.26 2.68
(2V09) (626GL) Roane County, TN 1,390 1,353 97.34% 37 2.66% 0 0 1,269 0 84 0 21 0 4 0 1 0 11 0 6.38 9.50 2.51
(2V09) (626GM) Maury County, TN 3,905 3,748 95.98% 157 4.02% 0 0 3,517 0 231 0 119 0 22 0 2 0 14 0 5.62 8.29 3.93
(2V09) (626GN) Athens, TN 1,693 1,635 96.57% 58 3.43% 0 0 1,592 0 43 0 41 0 9 0 2 0 6 0 3.72 8.00 6.30
(2V09) (626GO) International Plaza, TN 4,101 4,065 99.12% 36 0.88% 0 0 3,982 0 83 0 20 0 7 0 1 0 8 0 1.57 6.06 1.43
(2V09) (626GP) Gallatin, TN 1,023 899 87.88% 124 12.12% 0 0 803 0 96 0 84 0 27 0 3 0 10 0 13.23 3.25 0.00
(2V09) (626MA) IDES Fort Campbell 196 196 100.00% 0 0.00% 0 0 196 0 0 0 0 0 0 0 0 0 0 0 0.00 0.00
(2V09) (626QA) Albion Street, TN 3,362 3,291 97.89% 71 2.11% 0 0 3,203 0 88 0 45 0 10 0 3 0 13 0 2.69 1.92
(2V09) (626QB) Charlotte Avenue, TN 6,025 5,900 97.93% 125 2.07% 0 0 5,725 0 175 0 79 0 30 0 8 0 8 0 3.80 5.07 1.92
(2V09) (626QC) Pointe Centre, TN 6,844 6,120 89.42% 724 10.58% 0 0 5,737 0 383 0 287 0 133 0 218 0 86 0 13.34 6.78
(2V09) (626QD) Glenis Drive, TN 232 215 92.67% 17 7.33% 0 1 202 1 13 0 12 0 2 0 3 0 0 0 6.67
(3V10) (538) Chillicothe, OH HCS 35,300 33,192 94.03% 2,108 5.97% 4 142 31,832 21 1,360 19 1,152 42 589 18 190 16 177 26 1.19 7.40 2.75
(3V10) (538) Chillicothe, OH 20,209 18,686 92.46% 1,523 7.54% 0 99 17,661 18 1,025 18 901 21 412 8 76 10 134 24 1.10 6.97 2.59
(3V10) (538GA) Athens, OH 3,232 3,160 97.77% 72 2.23% 0 14 3,060 3 100 0 49 5 19 1 0 4 4 1 0.80 4.16 3.86
(3V10) (538GB) Portsmouth, OH 4,032 3,960 98.21% 72 1.79% 0 1 3,910 0 50 0 34 0 15 1 10 0 13 0 1.27 3.59 2.29
(3V10) (538GC) Marietta, OH 1,955 1,665 85.17% 290 14.83% 0 20 1,617 0 48 0 93 13 111 6 64 0 22 1 1.86 28.04 3.38
(3V10) (538GD) Lancaster, OH 3,096 3,042 98.26% 54 1.74% 0 8 2,999 0 43 1 35 3 10 2 8 2 1 0 0.93 2.44 2.22
(3V10) (538GE) Cambridge, OH 2,220 2,142 96.49% 78 3.51% 0 0 2,083 0 59 0 27 0 17 0 32 0 2 0 1.19 9.81 2.22
(3V10) (538GF) Wilmington, OH 556 537 96.58% 19 3.42% 0 0 502 0 35 0 13 0 5 0 0 0 1 0 3.44 4.58 5.47
(3V10) (539) Cincinnati, OH HCS 75,510 71,128 94.20% 4,382 5.80% 48 47 67,672 0 3,456 1 2,581 3 944 2 405 1 452 40 2.28 8.55 3.92
(3V10) (539) Cincinnati, OH 40,470 36,895 91.17% 3,575 8.83% 0 37 34,286 0 2,609 0 2,049 1 823 1 369 0 334 35 2.75 11.49 2.85
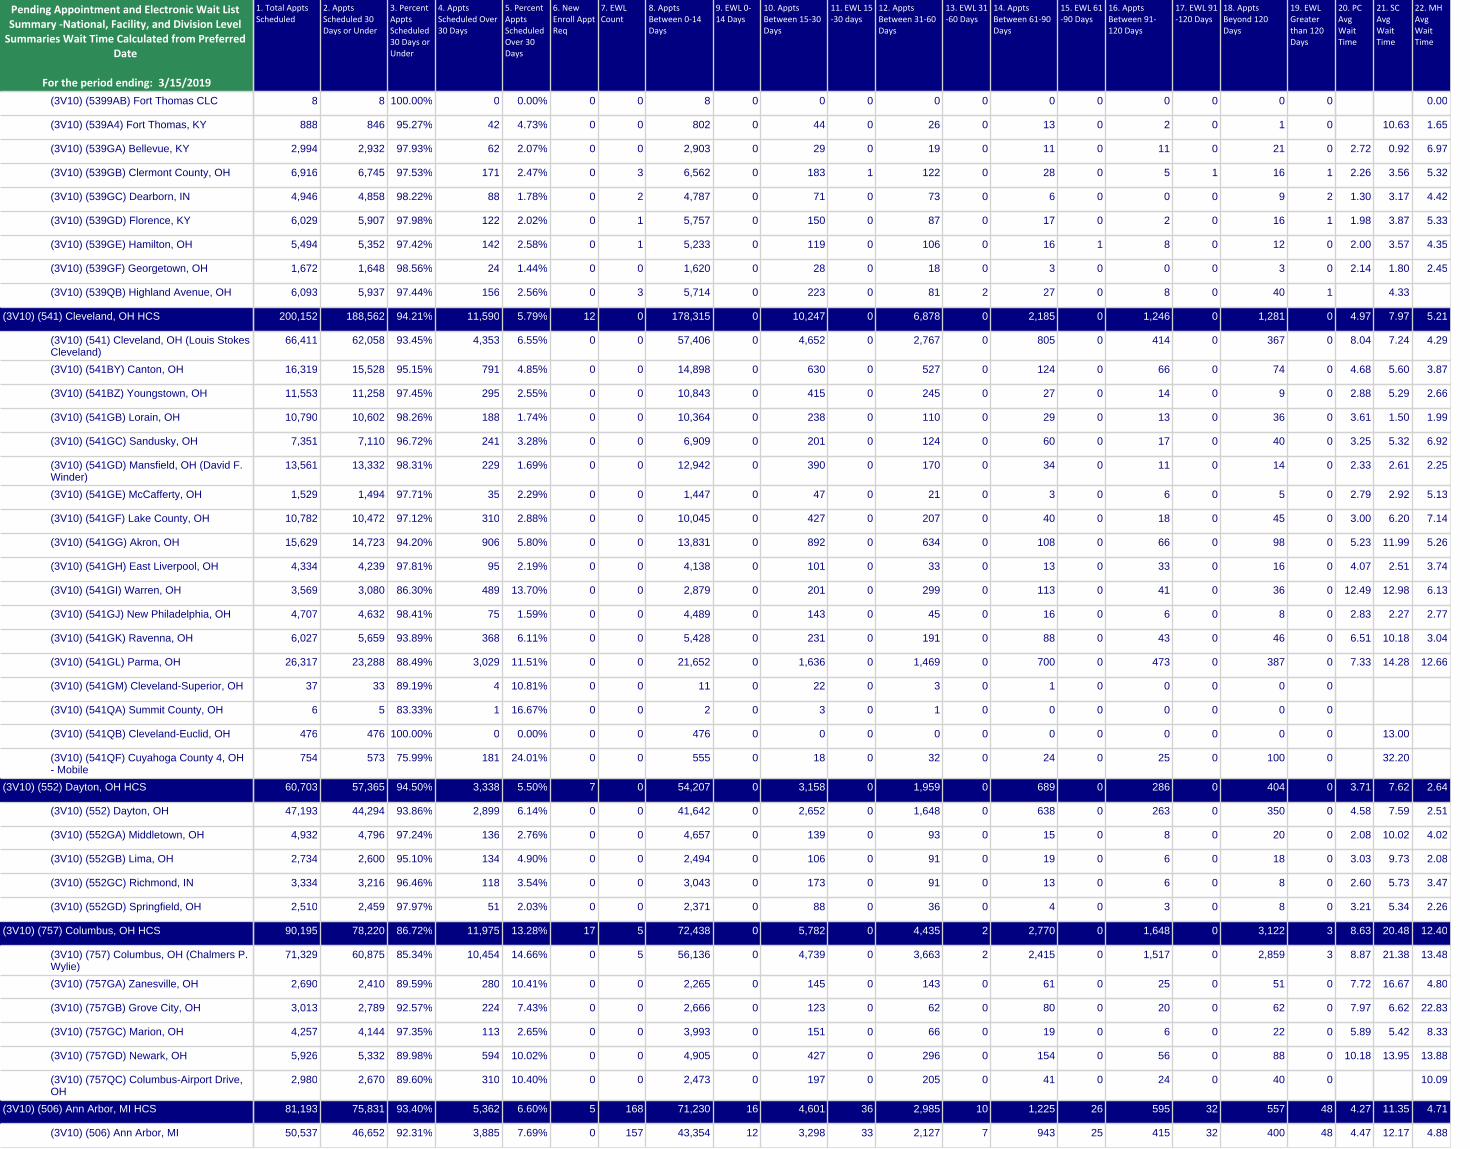
Pending Appointment and Electronic Wait List Summary -National, Facility, and Division Level Summaries Wait Time Calculated from Preferred
Date
For the period ending: 3/15/2019
1. Total Appts Scheduled
2. Appts Scheduled 30 Days or Under
3. Percent Appts Scheduled 30 Days or Under
4. Appts Scheduled Over 30 Days
5. Percent Appts Scheduled Over 30 Days
6. New Enroll Appt Req
7. EWL Count
8. Appts Between 0-14 Days
9. EWL 0-14 Days
10. Appts Between 15-30 Days
11. EWL 15 -30 days
12. Appts Between 31-60 Days
13. EWL 31 -60 Days
14. Appts Between 61-90 Days
15. EWL 61 -90 Days
16. Appts Between 91-120 Days
17. EWL 91 -120 Days
18. Appts Beyond 120 Days
19. EWL Greater than 120 Days
20. PC Avg Wait Time
21. SC Avg Wait Time
22. MH Avg Wait Time
(3V10) (5399AB) Fort Thomas CLC 8 8 100.00% 0 0.00% 0 0 8 0 0 0 0 0 0 0 0 0 0 0 0.00
(3V10) (539A4) Fort Thomas, KY 888 846 95.27% 42 4.73% 0 0 802 0 44 0 26 0 13 0 2 0 1 0 10.63 1.65
(3V10) (539GA) Bellevue, KY 2,994 2,932 97.93% 62 2.07% 0 0 2,903 0 29 0 19 0 11 0 11 0 21 0 2.72 0.92 6.97
(3V10) (539GB) Clermont County, OH 6,916 6,745 97.53% 171 2.47% 0 3 6,562 0 183 1 122 0 28 0 5 1 16 1 2.26 3.56 5.32
(3V10) (539GC) Dearborn, IN 4,946 4,858 98.22% 88 1.78% 0 2 4,787 0 71 0 73 0 6 0 0 0 9 2 1.30 3.17 4.42
(3V10) (539GD) Florence, KY 6,029 5,907 97.98% 122 2.02% 0 1 5,757 0 150 0 87 0 17 0 2 0 16 1 1.98 3.87 5.33
(3V10) (539GE) Hamilton, OH 5,494 5,352 97.42% 142 2.58% 0 1 5,233 0 119 0 106 0 16 1 8 0 12 0 2.00 3.57 4.35
(3V10) (539GF) Georgetown, OH 1,672 1,648 98.56% 24 1.44% 0 0 1,620 0 28 0 18 0 3 0 0 0 3 0 2.14 1.80 2.45
(3V10) (539QB) Highland Avenue, OH 6,093 5,937 97.44% 156 2.56% 0 3 5,714 0 223 0 81 2 27 0 8 0 40 1 4.33
(3V10) (541) Cleveland, OH HCS 200,152 188,562 94.21% 11,590 5.79% 12 0 178,315 0 10,247 0 6,878 0 2,185 0 1,246 0 1,281 0 4.97 7.97 5.21
(3V10) (541) Cleveland, OH (Louis Stokes Cleveland)
66,411 62,058 93.45% 4,353 6.55% 0 0 57,406 0 4,652 0 2,767 0 805 0 414 0 367 0 8.04 7.24 4.29
(3V10) (541BY) Canton, OH 16,319 15,528 95.15% 791 4.85% 0 0 14,898 0 630 0 527 0 124 0 66 0 74 0 4.68 5.60 3.87
(3V10) (541BZ) Youngstown, OH 11,553 11,258 97.45% 295 2.55% 0 0 10,843 0 415 0 245 0 27 0 14 0 9 0 2.88 5.29 2.66
(3V10) (541GB) Lorain, OH 10,790 10,602 98.26% 188 1.74% 0 0 10,364 0 238 0 110 0 29 0 13 0 36 0 3.61 1.50 1.99
(3V10) (541GC) Sandusky, OH 7,351 7,110 96.72% 241 3.28% 0 0 6,909 0 201 0 124 0 60 0 17 0 40 0 3.25 5.32 6.92
(3V10) (541GD) Mansfield, OH (David F. Winder)
13,561 13,332 98.31% 229 1.69% 0 0 12,942 0 390 0 170 0 34 0 11 0 14 0 2.33 2.61 2.25
(3V10) (541GE) McCafferty, OH 1,529 1,494 97.71% 35 2.29% 0 0 1,447 0 47 0 21 0 3 0 6 0 5 0 2.79 2.92 5.13
(3V10) (541GF) Lake County, OH 10,782 10,472 97.12% 310 2.88% 0 0 10,045 0 427 0 207 0 40 0 18 0 45 0 3.00 6.20 7.14
(3V10) (541GG) Akron, OH 15,629 14,723 94.20% 906 5.80% 0 0 13,831 0 892 0 634 0 108 0 66 0 98 0 5.23 11.99 5.26
(3V10) (541GH) East Liverpool, OH 4,334 4,239 97.81% 95 2.19% 0 0 4,138 0 101 0 33 0 13 0 33 0 16 0 4.07 2.51 3.74
(3V10) (541GI) Warren, OH 3,569 3,080 86.30% 489 13.70% 0 0 2,879 0 201 0 299 0 113 0 41 0 36 0 12.49 12.98 6.13
(3V10) (541GJ) New Philadelphia, OH 4,707 4,632 98.41% 75 1.59% 0 0 4,489 0 143 0 45 0 16 0 6 0 8 0 2.83 2.27 2.77
(3V10) (541GK) Ravenna, OH 6,027 5,659 93.89% 368 6.11% 0 0 5,428 0 231 0 191 0 88 0 43 0 46 0 6.51 10.18 3.04
(3V10) (541GL) Parma, OH 26,317 23,288 88.49% 3,029 11.51% 0 0 21,652 0 1,636 0 1,469 0 700 0 473 0 387 0 7.33 14.28 12.66
(3V10) (541GM) Cleveland-Superior, OH 37 33 89.19% 4 10.81% 0 0 11 0 22 0 3 0 1 0 0 0 0 0
(3V10) (541QA) Summit County, OH 6 5 83.33% 1 16.67% 0 0 2 0 3 0 1 0 0 0 0 0 0 0
(3V10) (541QB) Cleveland-Euclid, OH 476 476 100.00% 0 0.00% 0 0 476 0 0 0 0 0 0 0 0 0 0 0 13.00
(3V10) (541QF) Cuyahoga County 4, OH - Mobile
754 573 75.99% 181 24.01% 0 0 555 0 18 0 32 0 24 0 25 0 100 0 32.20
(3V10) (552) Dayton, OH HCS 60,703 57,365 94.50% 3,338 5.50% 7 0 54,207 0 3,158 0 1,959 0 689 0 286 0 404 0 3.71 7.62 2.64
(3V10) (552) Dayton, OH 47,193 44,294 93.86% 2,899 6.14% 0 0 41,642 0 2,652 0 1,648 0 638 0 263 0 350 0 4.58 7.59 2.51
(3V10) (552GA) Middletown, OH 4,932 4,796 97.24% 136 2.76% 0 0 4,657 0 139 0 93 0 15 0 8 0 20 0 2.08 10.02 4.02
(3V10) (552GB) Lima, OH 2,734 2,600 95.10% 134 4.90% 0 0 2,494 0 106 0 91 0 19 0 6 0 18 0 3.03 9.73 2.08
(3V10) (552GC) Richmond, IN 3,334 3,216 96.46% 118 3.54% 0 0 3,043 0 173 0 91 0 13 0 6 0 8 0 2.60 5.73 3.47
(3V10) (552GD) Springfield, OH 2,510 2,459 97.97% 51 2.03% 0 0 2,371 0 88 0 36 0 4 0 3 0 8 0 3.21 5.34 2.26
(3V10) (757) Columbus, OH HCS 90,195 78,220 86.72% 11,975 13.28% 17 5 72,438 0 5,782 0 4,435 2 2,770 0 1,648 0 3,122 3 8.63 20.48 12.40
(3V10) (757) Columbus, OH (Chalmers P. Wylie)
71,329 60,875 85.34% 10,454 14.66% 0 5 56,136 0 4,739 0 3,663 2 2,415 0 1,517 0 2,859 3 8.87 21.38 13.48
(3V10) (757GA) Zanesville, OH 2,690 2,410 89.59% 280 10.41% 0 0 2,265 0 145 0 143 0 61 0 25 0 51 0 7.72 16.67 4.80
(3V10) (757GB) Grove City, OH 3,013 2,789 92.57% 224 7.43% 0 0 2,666 0 123 0 62 0 80 0 20 0 62 0 7.97 6.62 22.83
(3V10) (757GC) Marion, OH 4,257 4,144 97.35% 113 2.65% 0 0 3,993 0 151 0 66 0 19 0 6 0 22 0 5.89 5.42 8.33
(3V10) (757GD) Newark, OH 5,926 5,332 89.98% 594 10.02% 0 0 4,905 0 427 0 296 0 154 0 56 0 88 0 10.18 13.95 13.88
(3V10) (757QC) Columbus-Airport Drive, OH
2,980 2,670 89.60% 310 10.40% 0 0 2,473 0 197 0 205 0 41 0 24 0 40 0 10.09
(3V10) (506) Ann Arbor, MI HCS 81,193 75,831 93.40% 5,362 6.60% 5 168 71,230 16 4,601 36 2,985 10 1,225 26 595 32 557 48 4.27 11.35 4.71
(3V10) (506) Ann Arbor, MI 50,537 46,652 92.31% 3,885 7.69% 0 157 43,354 12 3,298 33 2,127 7 943 25 415 32 400 48 4.47 12.17 4.88
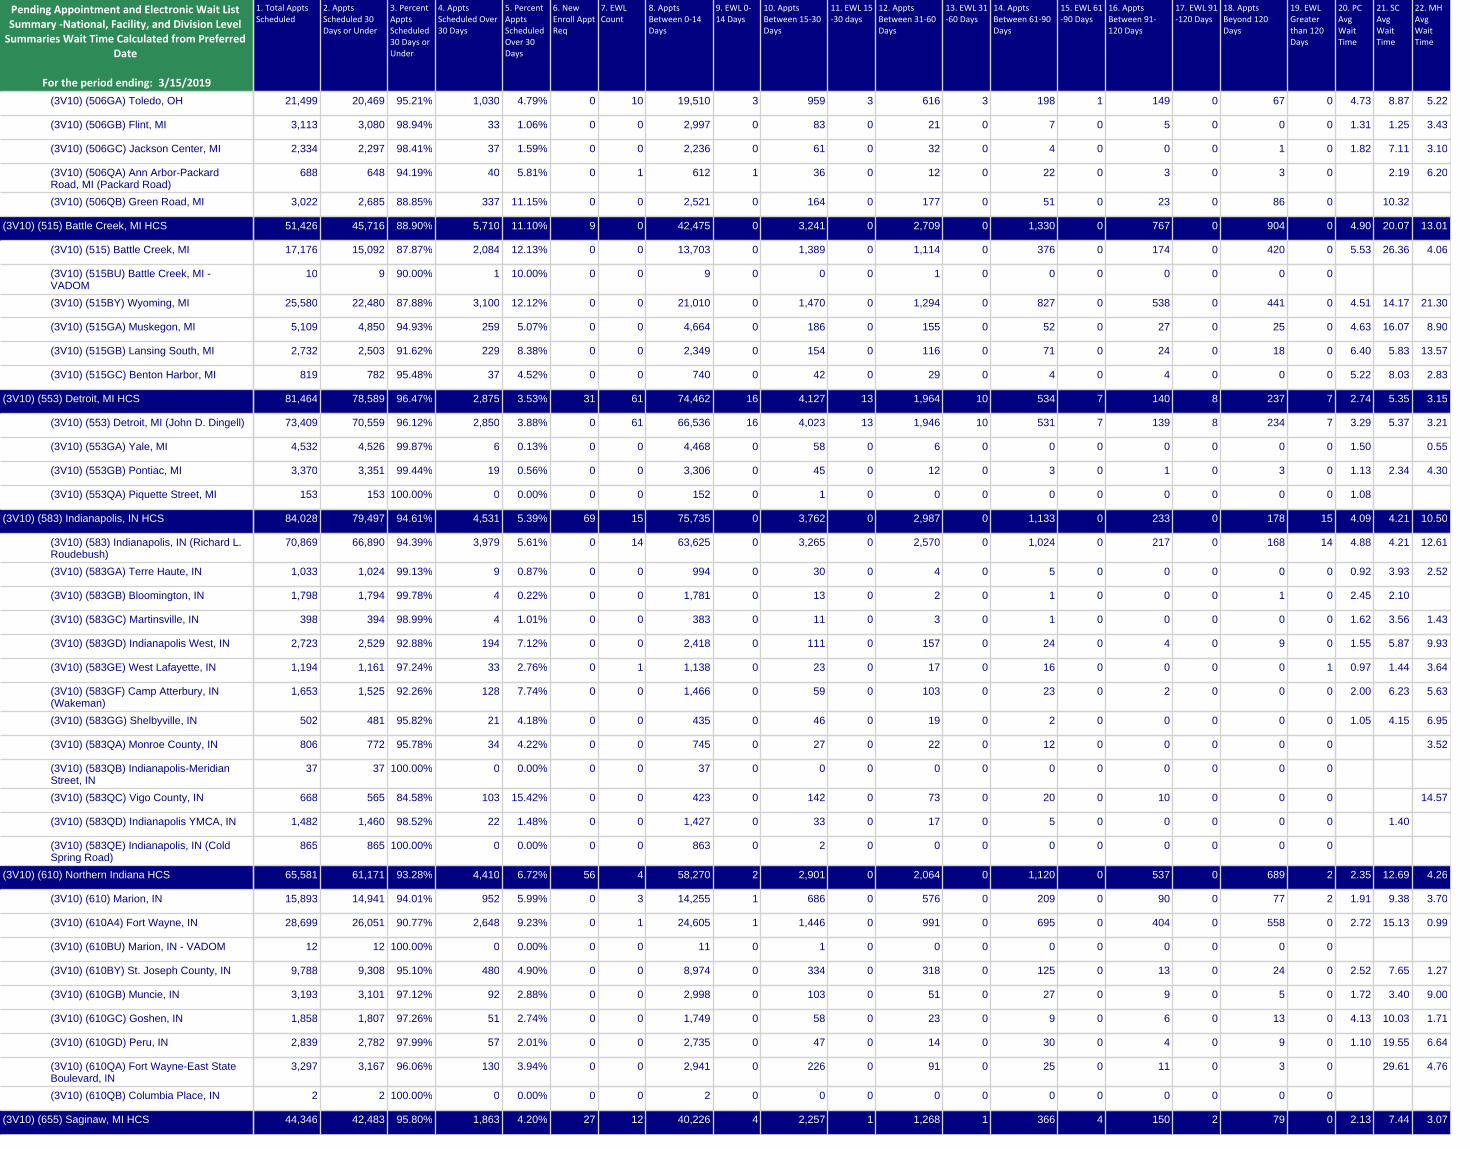
Pending Appointment and Electronic Wait List Summary -National, Facility, and Division Level Summaries Wait Time Calculated from Preferred
Date
For the period ending: 3/15/2019
1. Total Appts Scheduled
2. Appts Scheduled 30 Days or Under
3. Percent Appts Scheduled 30 Days or Under
4. Appts Scheduled Over 30 Days
5. Percent Appts Scheduled Over 30 Days
6. New Enroll Appt Req
7. EWL Count
8. Appts Between 0-14 Days
9. EWL 0-14 Days
10. Appts Between 15-30 Days
11. EWL 15 -30 days
12. Appts Between 31-60 Days
13. EWL 31 -60 Days
14. Appts Between 61-90 Days
15. EWL 61 -90 Days
16. Appts Between 91-120 Days
17. EWL 91 -120 Days
18. Appts Beyond 120 Days
19. EWL Greater than 120 Days
20. PC Avg Wait Time
21. SC Avg Wait Time
22. MH Avg Wait Time
(3V10) (506GA) Toledo, OH 21,499 20,469 95.21% 1,030 4.79% 0 10 19,510 3 959 3 616 3 198 1 149 0 67 0 4.73 8.87 5.22
(3V10) (506GB) Flint, MI 3,113 3,080 98.94% 33 1.06% 0 0 2,997 0 83 0 21 0 7 0 5 0 0 0 1.31 1.25 3.43
(3V10) (506GC) Jackson Center, MI 2,334 2,297 98.41% 37 1.59% 0 0 2,236 0 61 0 32 0 4 0 0 0 1 0 1.82 7.11 3.10
(3V10) (506QA) Ann Arbor-Packard Road, MI (Packard Road)
688 648 94.19% 40 5.81% 0 1 612 1 36 0 12 0 22 0 3 0 3 0 2.19 6.20
(3V10) (506QB) Green Road, MI 3,022 2,685 88.85% 337 11.15% 0 0 2,521 0 164 0 177 0 51 0 23 0 86 0 10.32
(3V10) (515) Battle Creek, MI HCS 51,426 45,716 88.90% 5,710 11.10% 9 0 42,475 0 3,241 0 2,709 0 1,330 0 767 0 904 0 4.90 20.07 13.01
(3V10) (515) Battle Creek, MI 17,176 15,092 87.87% 2,084 12.13% 0 0 13,703 0 1,389 0 1,114 0 376 0 174 0 420 0 5.53 26.36 4.06
(3V10) (515BU) Battle Creek, MI -VADOM
10 9 90.00% 1 10.00% 0 0 9 0 0 0 1 0 0 0 0 0 0 0
(3V10) (515BY) Wyoming, MI 25,580 22,480 87.88% 3,100 12.12% 0 0 21,010 0 1,470 0 1,294 0 827 0 538 0 441 0 4.51 14.17 21.30
(3V10) (515GA) Muskegon, MI 5,109 4,850 94.93% 259 5.07% 0 0 4,664 0 186 0 155 0 52 0 27 0 25 0 4.63 16.07 8.90
(3V10) (515GB) Lansing South, MI 2,732 2,503 91.62% 229 8.38% 0 0 2,349 0 154 0 116 0 71 0 24 0 18 0 6.40 5.83 13.57
(3V10) (515GC) Benton Harbor, MI 819 782 95.48% 37 4.52% 0 0 740 0 42 0 29 0 4 0 4 0 0 0 5.22 8.03 2.83
(3V10) (553) Detroit, MI HCS 81,464 78,589 96.47% 2,875 3.53% 31 61 74,462 16 4,127 13 1,964 10 534 7 140 8 237 7 2.74 5.35 3.15
(3V10) (553) Detroit, MI (John D. Dingell) 73,409 70,559 96.12% 2,850 3.88% 0 61 66,536 16 4,023 13 1,946 10 531 7 139 8 234 7 3.29 5.37 3.21
(3V10) (553GA) Yale, MI 4,532 4,526 99.87% 6 0.13% 0 0 4,468 0 58 0 6 0 0 0 0 0 0 0 1.50 0.55
(3V10) (553GB) Pontiac, MI 3,370 3,351 99.44% 19 0.56% 0 0 3,306 0 45 0 12 0 3 0 1 0 3 0 1.13 2.34 4.30
(3V10) (553QA) Piquette Street, MI 153 153 100.00% 0 0.00% 0 0 152 0 1 0 0 0 0 0 0 0 0 0 1.08
(3V10) (583) Indianapolis, IN HCS 84,028 79,497 94.61% 4,531 5.39% 69 15 75,735 0 3,762 0 2,987 0 1,133 0 233 0 178 15 4.09 4.21 10.50
(3V10) (583) Indianapolis, IN (Richard L. Roudebush)
70,869 66,890 94.39% 3,979 5.61% 0 14 63,625 0 3,265 0 2,570 0 1,024 0 217 0 168 14 4.88 4.21 12.61
(3V10) (583GA) Terre Haute, IN 1,033 1,024 99.13% 9 0.87% 0 0 994 0 30 0 4 0 5 0 0 0 0 0 0.92 3.93 2.52
(3V10) (583GB) Bloomington, IN 1,798 1,794 99.78% 4 0.22% 0 0 1,781 0 13 0 2 0 1 0 0 0 1 0 2.45 2.10
(3V10) (583GC) Martinsville, IN 398 394 98.99% 4 1.01% 0 0 383 0 11 0 3 0 1 0 0 0 0 0 1.62 3.56 1.43
(3V10) (583GD) Indianapolis West, IN 2,723 2,529 92.88% 194 7.12% 0 0 2,418 0 111 0 157 0 24 0 4 0 9 0 1.55 5.87 9.93
(3V10) (583GE) West Lafayette, IN 1,194 1,161 97.24% 33 2.76% 0 1 1,138 0 23 0 17 0 16 0 0 0 0 1 0.97 1.44 3.64
(3V10) (583GF) Camp Atterbury, IN (Wakeman)
1,653 1,525 92.26% 128 7.74% 0 0 1,466 0 59 0 103 0 23 0 2 0 0 0 2.00 6.23 5.63
(3V10) (583GG) Shelbyville, IN 502 481 95.82% 21 4.18% 0 0 435 0 46 0 19 0 2 0 0 0 0 0 1.05 4.15 6.95
(3V10) (583QA) Monroe County, IN 806 772 95.78% 34 4.22% 0 0 745 0 27 0 22 0 12 0 0 0 0 0 3.52
(3V10) (583QB) Indianapolis-Meridian Street, IN
37 37 100.00% 0 0.00% 0 0 37 0 0 0 0 0 0 0 0 0 0 0
(3V10) (583QC) Vigo County, IN 668 565 84.58% 103 15.42% 0 0 423 0 142 0 73 0 20 0 10 0 0 0 14.57
(3V10) (583QD) Indianapolis YMCA, IN 1,482 1,460 98.52% 22 1.48% 0 0 1,427 0 33 0 17 0 5 0 0 0 0 0 1.40
(3V10) (583QE) Indianapolis, IN (Cold Spring Road)
865 865 100.00% 0 0.00% 0 0 863 0 2 0 0 0 0 0 0 0 0 0
(3V10) (610) Northern Indiana HCS 65,581 61,171 93.28% 4,410 6.72% 56 4 58,270 2 2,901 0 2,064 0 1,120 0 537 0 689 2 2.35 12.69 4.26
(3V10) (610) Marion, IN 15,893 14,941 94.01% 952 5.99% 0 3 14,255 1 686 0 576 0 209 0 90 0 77 2 1.91 9.38 3.70
(3V10) (610A4) Fort Wayne, IN 28,699 26,051 90.77% 2,648 9.23% 0 1 24,605 1 1,446 0 991 0 695 0 404 0 558 0 2.72 15.13 0.99
(3V10) (610BU) Marion, IN - VADOM 12 12 100.00% 0 0.00% 0 0 11 0 1 0 0 0 0 0 0 0 0 0
(3V10) (610BY) St. Joseph County, IN 9,788 9,308 95.10% 480 4.90% 0 0 8,974 0 334 0 318 0 125 0 13 0 24 0 2.52 7.65 1.27
(3V10) (610GB) Muncie, IN 3,193 3,101 97.12% 92 2.88% 0 0 2,998 0 103 0 51 0 27 0 9 0 5 0 1.72 3.40 9.00
(3V10) (610GC) Goshen, IN 1,858 1,807 97.26% 51 2.74% 0 0 1,749 0 58 0 23 0 9 0 6 0 13 0 4.13 10.03 1.71
(3V10) (610GD) Peru, IN 2,839 2,782 97.99% 57 2.01% 0 0 2,735 0 47 0 14 0 30 0 4 0 9 0 1.10 19.55 6.64
(3V10) (610QA) Fort Wayne-East State Boulevard, IN
3,297 3,167 96.06% 130 3.94% 0 0 2,941 0 226 0 91 0 25 0 11 0 3 0 29.61 4.76
(3V10) (610QB) Columbia Place, IN 2 2 100.00% 0 0.00% 0 0 2 0 0 0 0 0 0 0 0 0 0 0
(3V10) (655) Saginaw, MI HCS 44,346 42,483 95.80% 1,863 4.20% 27 12 40,226 4 2,257 1 1,268 1 366 4 150 2 79 0 2.13 7.44 3.07

Pending Appointment and Electronic Wait List Summary -National, Facility, and Division Level Summaries Wait Time Calculated from Preferred
Date
For the period ending: 3/15/2019
1. Total Appts Scheduled
2. Appts Scheduled 30 Days or Under
3. Percent Appts Scheduled 30 Days or Under
4. Appts Scheduled Over 30 Days
5. Percent Appts Scheduled Over 30 Days
6. New Enroll Appt Req
7. EWL Count
8. Appts Between 0-14 Days
9. EWL 0-14 Days
10. Appts Between 15-30 Days
11. EWL 15 -30 days
12. Appts Between 31-60 Days
13. EWL 31 -60 Days
14. Appts Between 61-90 Days
15. EWL 61 -90 Days
16. Appts Between 91-120 Days
17. EWL 91 -120 Days
18. Appts Beyond 120 Days
19. EWL Greater than 120 Days
20. PC Avg Wait Time
21. SC Avg Wait Time
22. MH Avg Wait Time
(3V10) (655) Saginaw, MI (Aleda E. Lutz) 23,184 21,675 93.49% 1,509 6.51% 0 12 20,401 4 1,274 1 993 1 321 4 126 2 69 0 2.06 8.08 1.24
(3V10) (655GA) Gaylord, MI 1,630 1,612 98.90% 18 1.10% 0 0 1,541 0 71 0 14 0 2 0 1 0 1 0 1.52 2.94 2.95
(3V10) (655GB) Traverse City, MI (Colonel Demas T. Craw)
1,203 1,156 96.09% 47 3.91% 0 0 1,090 0 66 0 35 0 4 0 5 0 3 0 2.91 7.19 1.36
(3V10) (655GC) Oscoda, MI 2,120 2,092 98.68% 28 1.32% 0 0 1,902 0 190 0 20 0 4 0 3 0 1 0 3.59 3.37 4.75
(3V10) (655GD) Alpena, MI (Lieutenant Colonel Clement C. Van Wagoner)
1,420 1,362 95.92% 58 4.08% 0 0 1,273 0 89 0 34 0 15 0 8 0 1 0 2.11 6.28 5.76
(3V10) (655GE) Clare, MI 2,818 2,768 98.23% 50 1.77% 0 0 2,655 0 113 0 47 0 3 0 0 0 0 0 2.08 1.95 4.47
(3V10) (655GF) Bad Axe, MI 1,687 1,685 99.88% 2 0.12% 0 0 1,639 0 46 0 1 0 1 0 0 0 0 0 1.12 1.34 1.82
(3V10) (655GG) Cadillac, MI 2,080 2,080 100.00% 0 0.00% 0 0 2,009 0 71 0 0 0 0 0 0 0 0 0 2.14 2.37 1.42
(3V10) (655GH) Cheboygan County, MI 1,146 1,132 98.78% 14 1.22% 0 0 1,091 0 41 0 13 0 1 0 0 0 0 0 2.26 2.29 1.52
(3V10) (655GI) Grayling, MI 1,222 1,181 96.64% 41 3.36% 0 0 1,134 0 47 0 30 0 5 0 3 0 3 0 1.50 6.08 6.14
(3V10) (655QA) Saginaw-Barnard Road, MI
3,974 3,901 98.16% 73 1.84% 0 0 3,735 0 166 0 64 0 5 0 3 0 1 0 6.26 3.08
(3V10) (655QB) Grand Traverse, MI 1,862 1,839 98.76% 23 1.24% 0 0 1,756 0 83 0 17 0 5 0 1 0 0 0 4.46 2.28
(3V12) (550) Danville, IL HCS 35,920 34,674 96.53% 1,246 3.47% 8 2 33,398 0 1,276 0 696 1 433 1 89 0 28 0 1.45 6.08 1.43
(3V12) (550) Danville, IL 16,709 16,074 96.20% 635 3.80% 0 2 15,514 0 560 0 361 1 219 1 37 0 18 0 0.99 5.33 0.33
(3V12) (550BY) Peoria, IL (Bob Michel) 11,041 10,479 94.91% 562 5.09% 0 0 9,965 0 514 0 294 0 208 0 50 0 10 0 1.41 10.54 2.61
(3V12) (550GA) Decatur, IL 4,303 4,275 99.35% 28 0.65% 0 0 4,156 0 119 0 23 0 4 0 1 0 0 0 2.61 1.27 1.02
(3V12) (550GD) Springfield, IL 3,111 3,091 99.36% 20 0.64% 0 0 3,025 0 66 0 17 0 2 0 1 0 0 0 1.01 2.53 1.87
(3V12) (550GF) Mattoon, IL 756 755 99.87% 1 0.13% 0 0 738 0 17 0 1 0 0 0 0 0 0 0 1.91 0.75 0.76
(3V12) (537) Chicago, IL HCS 63,491 56,589 89.13% 6,902 10.87% 8 91 51,381 11 5,208 12 3,898 27 1,803 23 724 8 477 10 5.30 12.54 5.34
(3V12) (537) Chicago, IL (Jesse Brown) 48,762 43,261 88.72% 5,501 11.28% 0 90 39,310 11 3,951 12 3,199 27 1,343 23 540 8 419 9 5.20 11.62 4.43
(3V12) (537BY) Crown Point, IN (Adam Benjamin Jr.)
11,341 10,101 89.07% 1,240 10.93% 0 1 9,142 0 959 0 564 0 440 0 183 0 53 1 2.95 19.15 7.40
(3V12) (537GA) Chicago Heights, IL 835 806 96.53% 29 3.47% 0 0 760 0 46 0 19 0 9 0 0 0 1 0 3.86 2.95
(3V12) (537GD) Lakeside, IL 1,535 1,467 95.57% 68 4.43% 0 0 1,344 0 123 0 58 0 5 0 1 0 4 0 7.67 4.22
(3V12) (537HA) Auburn Gresham, IL 1,018 954 93.71% 64 6.29% 0 0 825 0 129 0 58 0 6 0 0 0 0 0 8.92 3.76
(3V12) (556) North Chicago, IL HCS 25,938 25,188 97.11% 750 2.89% 7 30 23,833 4 1,355 1 530 5 147 4 34 2 39 14 2.22 4.41 4.31
(3V12) (556) North Chicago, IL (Captain James A. Lovell)
22,760 22,112 97.15% 648 2.85% 0 30 20,887 4 1,225 1 452 5 127 4 31 2 38 14 2.27 4.41 3.75
(3V12) (556GA) Evanston, IL 443 416 93.91% 27 6.09% 0 0 386 0 30 0 24 0 2 0 0 0 1 0 4.27 2.03 9.35
(3V12) (556GC) McHenry, IL 1,789 1,720 96.14% 69 3.86% 0 0 1,650 0 70 0 50 0 17 0 2 0 0 0 1.68 5.47 6.67
(3V12) (556GD) Kenosha, WI 946 940 99.37% 6 0.63% 0 0 910 0 30 0 4 0 1 0 1 0 0 0 1.87 3.05 1.00
(3V12) (578) Hines, IL HCS 106,601 100,837 94.59% 5,764 5.41% 21 1 95,152 1 5,685 0 3,270 0 1,401 0 593 0 500 0 3.80 7.58 2.51
(3V12) (578) Hines, IL (Edward Hines Junior)
86,432 81,230 93.98% 5,202 6.02% 0 1 76,365 1 4,865 0 2,893 0 1,282 0 549 0 478 0 4.97 7.65 2.57
(3V12) (578GA) Joliet, IL 9,050 8,704 96.18% 346 3.82% 0 0 8,243 0 461 0 236 0 77 0 24 0 9 0 2.30 7.12 2.12
(3V12) (578GC) Kankakee County, IL 1,780 1,740 97.75% 40 2.25% 0 0 1,666 0 74 0 22 0 12 0 4 0 2 0 1.99 8.79 2.19
(3V12) (578GD) Aurora, IL 2,401 2,362 98.38% 39 1.62% 0 0 2,289 0 73 0 24 0 11 0 1 0 3 0 1.10 2.49 2.80
(3V12) (578GE) Hoffman Estates, IL 2,335 2,307 98.80% 28 1.20% 0 0 2,240 0 67 0 23 0 3 0 2 0 0 0 1.82 4.84 2.14
(3V12) (578GF) LaSalle, IL 1,625 1,559 95.94% 66 4.06% 0 0 1,475 0 84 0 41 0 15 0 7 0 3 0 4.50 9.26 3.43
(3V12) (578GG) Oak Lawn, IL 2,978 2,935 98.56% 43 1.44% 0 0 2,874 0 61 0 31 0 1 0 6 0 5 0 1.57 11.94 1.75
(3V12) (585) Iron Mountain, MI HCS 14,266 13,560 95.05% 706 4.95% 4 1 12,670 1 890 0 463 0 155 0 45 0 43 0 4.89 8.09 2.26
(3V12) (585) Iron Mountain, MI (Oscar G. Johnson)
8,948 8,474 94.70% 474 5.30% 0 1 7,866 1 608 0 331 0 85 0 24 0 34 0 4.85 6.77 2.59
(3V12) (585GA) Hancock, MI 641 605 94.38% 36 5.62% 0 0 569 0 36 0 18 0 9 0 7 0 2 0 6.62 23.59 0.82
(3V12) (585GB) Rhinelander, WI 1,013 959 94.67% 54 5.33% 0 0 879 0 80 0 32 0 15 0 4 0 3 0 8.62 9.99 2.49
(3V12) (585GC) Menominee, MI 712 694 97.47% 18 2.53% 0 0 647 0 47 0 12 0 4 0 1 0 1 0 3.80 15.75 0.97

Pending Appointment and Electronic Wait List Summary -National, Facility, and Division Level Summaries Wait Time Calculated from Preferred
Date
For the period ending: 3/15/2019
1. Total Appts Scheduled
2. Appts Scheduled 30 Days or Under
3. Percent Appts Scheduled 30 Days or Under
4. Appts Scheduled Over 30 Days
5. Percent Appts Scheduled Over 30 Days
6. New Enroll Appt Req
7. EWL Count
8. Appts Between 0-14 Days
9. EWL 0-14 Days
10. Appts Between 15-30 Days
11. EWL 15 -30 days
12. Appts Between 31-60 Days
13. EWL 31 -60 Days
14. Appts Between 61-90 Days
15. EWL 61 -90 Days
16. Appts Between 91-120 Days
17. EWL 91 -120 Days
18. Appts Beyond 120 Days
19. EWL Greater than 120 Days
20. PC Avg Wait Time
21. SC Avg Wait Time
22. MH Avg Wait Time
(3V12) (585GD) Ironwood, MI 389 366 94.09% 23 5.91% 0 0 340 0 26 0 12 0 10 0 1 0 0 0 5.86 18.77 2.80
(3V12) (585GF) Manistique, MI 456 439 96.27% 17 3.73% 0 0 424 0 15 0 8 0 7 0 2 0 0 0 3.26 25.64 2.09
(3V12) (585HA) Marquette, MI 1,518 1,458 96.05% 60 3.95% 0 0 1,400 0 58 0 35 0 18 0 4 0 3 0 3.68 16.89 1.95
(3V12) (585HB) Sault Saint Marie, MI 589 565 95.93% 24 4.07% 0 0 545 0 20 0 15 0 7 0 2 0 0 0 1.31 20.09 3.25
(3V12) (607) Madison, WI HCS 41,105 36,703 89.29% 4,402 10.71% 1 182 33,398 41 3,305 43 2,098 69 1,266 26 607 3 431 0 6.48 15.27 4.09
(3V12) (607) Madison, WI (William S. Middleton)
30,121 26,041 86.45% 4,080 13.55% 0 182 23,463 41 2,578 43 1,879 69 1,198 26 583 3 420 0 10.22 16.16 4.65
(3V12) (607GC) Janesville, WI 990 970 97.98% 20 2.02% 0 0 905 0 65 0 16 0 3 0 0 0 1 0 6.41 1.37 0.62
(3V12) (607GD) Baraboo, WI 987 968 98.07% 19 1.93% 0 0 909 0 59 0 14 0 4 0 0 0 1 0 5.33 4.13 0.69
(3V12) (607GE) Beaver Dam, WI 1,000 973 97.30% 27 2.70% 0 0 933 0 40 0 6 0 7 0 11 0 3 0 2.75 8.18 2.04
(3V12) (607GF) Freeport, IL 617 614 99.51% 3 0.49% 0 0 597 0 17 0 3 0 0 0 0 0 0 0 2.44 2.53 0.45
(3V12) (607GG) Madison West, WI 2,658 2,510 94.43% 148 5.57% 0 0 2,281 0 229 0 99 0 37 0 7 0 5 0 8.49 3.18 6.71
(3V12) (607HA) Rockford, IL 4,732 4,627 97.78% 105 2.22% 0 0 4,310 0 317 0 81 0 17 0 6 0 1 0 4.55 6.09 2.94
(3V12) (676) Tomah, WI HCS 27,727 26,550 95.76% 1,177 4.24% 3 0 25,116 0 1,434 0 750 0 273 0 90 0 64 0 4.48 7.02 2.95
(3V12) (676) Tomah, WI 15,888 15,218 95.78% 670 4.22% 0 0 14,467 0 751 0 401 0 165 0 61 0 43 0 4.24 6.90 2.13
(3V12) (676GA) Wausau, WI 3,884 3,749 96.52% 135 3.48% 0 0 3,603 0 146 0 97 0 27 0 6 0 5 0 2.09 21.54 6.24
(3V12) (676GC) River Valley, WI 3,885 3,818 98.28% 67 1.72% 0 0 3,572 0 246 0 55 0 7 0 4 0 1 0 3.86 5.52 0.97
(3V12) (676GD) Wisconsin Rapids, WI 3,614 3,324 91.98% 290 8.02% 0 0 3,051 0 273 0 187 0 71 0 17 0 15 0 10.23 6.77 2.16
(3V12) (676GE) Clark County, WI 456 441 96.71% 15 3.29% 0 0 423 0 18 0 10 0 3 0 2 0 0 0 1.61 1.74 7.11
(3V12) (695) Milwaukee, WI HCS 95,672 89,854 93.92% 5,818 6.08% 14 18 84,674 0 5,180 1 3,561 1 1,352 0 494 2 411 14 5.41 7.01 3.69
(3V12) (695) Milwaukee, WI (Clement J. Zablocki)
67,531 64,246 95.14% 3,285 4.86% 0 18 60,893 0 3,353 1 1,939 1 756 0 295 2 295 14 2.16 6.12 2.29
(3V12) (695BU) Milwaukee, WI - VADOM 29 29 100.00% 0 0.00% 0 0 29 0 0 0 0 0 0 0 0 0 0 0
(3V12) (695BY) Appleton, WI (John H. Bradley)
8,355 7,678 91.90% 677 8.10% 0 0 7,177 0 501 0 382 0 226 0 39 0 30 0 5.37 11.84 4.80
(3V12) (695GA) Union Grove, WI 1,228 1,214 98.86% 14 1.14% 0 0 1,201 0 13 0 11 0 1 0 1 0 1 0 1.48 15.00 1.81
(3V12) (695GC) Cleveland, WI 1,087 1,022 94.02% 65 5.98% 0 0 947 0 75 0 40 0 15 0 6 0 4 0 8.63 32.32 7.27
(3V12) (695GD) Green Bay, WI (Milo C. Huempfner)
17,440 15,663 89.81% 1,777 10.19% 0 0 14,425 0 1,238 0 1,189 0 354 0 153 0 81 0 9.53 9.20 8.83
(3V12) (695QA) Milwaukee-MLK Drive, WI
2 2 100.00% 0 0.00% 0 0 2 0 0 0 0 0 0 0 0 0 0 0
(3V15) (589A4) Columbia, MO HCS 79,231 74,542 94.08% 4,689 5.92% 0 105 70,370 19 4,172 19 2,488 34 1,064 13 568 19 569 1 4.22 7.34 10.06
(3V15) (589A4) Columbia, MO (Harry S. Truman)
57,601 53,640 93.12% 3,961 6.88% 0 104 50,340 19 3,300 19 2,055 34 943 13 479 19 484 0 5.67 7.23 11.05
(3V15) (589BX) Columbia, MO - VADOM 12 12 100.00% 0 0.00% 0 0 12 0 0 0 0 0 0 0 0 0 0 0
(3V15) (589G8) Jefferson City, MO 4,537 4,297 94.71% 240 5.29% 0 0 4,172 0 125 0 93 0 41 0 53 0 53 0 2.89 10.96 5.65
(3V15) (589GE) Kirksville, MO 2,204 2,167 98.32% 37 1.68% 0 1 2,096 0 71 0 21 0 8 0 3 0 5 1 3.39 11.43 7.37
(3V15) (589GF) Fort Leonard Wood, MO 3,755 3,613 96.22% 142 3.78% 0 0 3,445 0 168 0 91 0 31 0 10 0 10 0 2.35 10.23 10.55
(3V15) (589GH) Lake of the Ozarks, MO 2,386 2,291 96.02% 95 3.98% 0 0 2,153 0 138 0 84 0 8 0 1 0 2 0 4.08 0.00 8.67
(3V15) (589GX) Mexico, MO 2,049 2,026 98.88% 23 1.12% 0 0 1,993 0 33 0 7 0 8 0 3 0 5 0 1.64 4.00 9.78
(3V15) (589GY) St. James, MO 2,781 2,701 97.12% 80 2.88% 0 0 2,492 0 209 0 58 0 14 0 5 0 3 0 3.97 6.71 8.00
(3V15) (589JA) Sedalia, MO 1,381 1,359 98.41% 22 1.59% 0 0 1,309 0 50 0 12 0 4 0 3 0 3 0 2.71 5.43 10.08
(3V15) (589JD) Marshfield, MO 2,525 2,436 96.48% 89 3.52% 0 0 2,358 0 78 0 67 0 7 0 11 0 4 0 3.95 3.87 7.15
(3V15) (589) Kansas City, MO HCS 64,434 62,222 96.57% 2,212 3.43% 90 7 59,180 6 3,042 0 1,403 0 506 0 178 1 125 0 3.05 4.66 2.46
(3V15) (589) Kansas City, MO 45,573 43,695 95.88% 1,878 4.12% 0 6 41,255 5 2,440 0 1,194 0 456 0 141 1 87 0 2.91 4.83 1.91
(3V15) (589G1) Warrensburg, MO 3,283 3,237 98.60% 46 1.40% 0 0 3,104 0 133 0 42 0 2 0 1 0 1 0 1.65 3.12 2.67
(3V15) (589GB) Belton, MO 1,633 1,624 99.45% 9 0.55% 0 0 1,617 0 7 0 0 0 0 0 3 0 6 0 0.63 0.00 0.06
(3V15) (589GC) Paola, KS 755 737 97.62% 18 2.38% 0 0 711 0 26 0 10 0 1 0 2 0 5 0 5.82 0.00 17.88

Pending Appointment and Electronic Wait List Summary -National, Facility, and Division Level Summaries Wait Time Calculated from Preferred
Date
For the period ending: 3/15/2019
1. Total Appts Scheduled
2. Appts Scheduled 30 Days or Under
3. Percent Appts Scheduled 30 Days or Under
4. Appts Scheduled Over 30 Days
5. Percent Appts Scheduled Over 30 Days
6. New Enroll Appt Req
7. EWL Count
8. Appts Between 0-14 Days
9. EWL 0-14 Days
10. Appts Between 15-30 Days
11. EWL 15 -30 days
12. Appts Between 31-60 Days
13. EWL 31 -60 Days
14. Appts Between 61-90 Days
15. EWL 61 -90 Days
16. Appts Between 91-120 Days
17. EWL 91 -120 Days
18. Appts Beyond 120 Days
19. EWL Greater than 120 Days
20. PC Avg Wait Time
21. SC Avg Wait Time
22. MH Avg Wait Time
(3V15) (589GD) Nevada, MO 1,429 1,423 99.58% 6 0.42% 0 0 1,398 0 25 0 3 0 2 0 0 0 1 0 1.77 0.00 3.26
(3V15) (589GZ) Cameron, MO 204 204 100.00% 0 0.00% 0 0 202 0 2 0 0 0 0 0 0 0 0 0 0.27 0.00 0.12
(3V15) (589HK) Kansas City, MO - Mobile 403 402 99.75% 1 0.25% 0 0 401 0 1 0 1 0 0 0 0 0 0 0 0.16
(3V15) (589JB) Excelsior Springs, MO 1,084 1,041 96.03% 43 3.97% 0 0 981 0 60 0 34 0 5 0 3 0 1 0 4.64 0.00 4.33
(3V15) (589JC) Johnson County, KS 1,421 1,383 97.33% 38 2.67% 0 0 1,303 0 80 0 27 0 5 0 2 0 4 0 4.30 6.00 0.00
(3V15) (589JF) Honor, MO 7,852 7,683 97.85% 169 2.15% 0 1 7,415 1 268 0 90 0 34 0 26 0 19 0 3.86 9.67 3.33
(3V15) (589MC) IDES Whiteman AFB 2 2 100.00% 0 0.00% 0 0 2 0 0 0 0 0 0 0 0 0 0 0 0.00
(3V15) (589QA) Overland Park, KS 795 791 99.50% 4 0.50% 0 0 791 0 0 0 2 0 1 0 0 0 1 0 0.70
(3V15) (589A5) Eastern Kansas HCS 58,068 54,699 94.20% 3,369 5.80% 0 127 51,741 41 2,958 19 1,897 19 552 7 182 2 738 39 3.60 13.32 4.59
(3V15) (589A5) Topeka, KS (Colmery-ONeil)
27,497 25,804 93.84% 1,693 6.16% 0 80 24,511 14 1,293 15 788 9 258 6 87 1 560 35 2.31 16.94 4.29
(3V15) (589A6) Leavenworth, KS (Dwight D. Eisenhower)
21,449 20,113 93.77% 1,336 6.23% 0 47 18,849 27 1,264 4 849 10 241 1 83 1 163 4 4.63 10.10 4.01
(3V15) (589BU) Leavenworth, KS -VADOM
1,257 1,257 100.00% 0 0.00% 0 0 1,255 0 2 0 0 0 0 0 0 0 0 0 0.00 0.00
(3V15) (589G9) Ft. Riley 13 2 15.38% 11 84.62% 0 0 0 0 2 0 11 0 0 0 0 0 0 0 32.00
(3V15) (589GI) St. Joseph, MO 2,792 2,730 97.78% 62 2.22% 0 0 2,661 0 69 0 46 0 10 0 2 0 4 0 3.06 6.26 4.67
(3V15) (589GJ) Wyandotte County, KS 891 843 94.61% 48 5.39% 0 0 810 0 33 0 34 0 8 0 4 0 2 0 6.99 0.00 4.68
(3V15) (589GM) Chanute, KS 324 316 97.53% 8 2.47% 0 0 260 0 56 0 7 0 1 0 0 0 0 0 7.85 6.08
(3V15) (589GN) Emporia, KS 86 86 100.00% 0 0.00% 0 0 80 0 6 0 0 0 0 0 0 0 0 0 3.38 5.08
(3V15) (589GP) Garnett, KS 159 157 98.74% 2 1.26% 0 0 153 0 4 0 2 0 0 0 0 0 0 0 3.51 1.08
(3V15) (589GR) Junction City, KS (Lieutenant General Richard J. Seitz-Based)
1,856 1,751 94.34% 105 5.66% 0 0 1,642 0 109 0 81 0 18 0 2 0 4 0 4.47 5.64 6.87
(3V15) (589GU) Lawrence, KS 259 245 94.59% 14 5.41% 0 0 238 0 7 0 10 0 3 0 0 0 1 0 2.38 9.29
(3V15) (589GV) Fort Scott, KS 624 603 96.63% 21 3.37% 0 0 586 0 17 0 15 0 4 0 1 0 1 0 3.74 0.00 6.72
(3V15) (589JE) Platte City, MO 759 729 96.05% 30 3.95% 0 0 681 0 48 0 15 0 9 0 3 0 3 0 4.75 8.42 7.69
(3V15) (589MA) Ft. Riley DES Clinic 79 49 62.03% 30 37.97% 0 0 3 0 46 0 30 0 0 0 0 0 0 0 29.97 20.08
(3V15) (589MD) IDES Fort Leavenworth 23 14 60.87% 9 39.13% 0 0 12 0 2 0 9 0 0 0 0 0 0 0 16.09 0.00
(3V15) (589A7) Wichita, KS HCS 43,784 41,997 95.92% 1,787 4.08% 0 77 40,289 1 1,708 2 1,069 2 377 0 167 2 174 70 2.48 5.68 4.92
(3V15) (589A7) Wichita, KS (Robert J. Dole)
32,387 30,801 95.10% 1,586 4.90% 0 68 29,384 1 1,417 2 944 2 335 0 154 2 153 61 2.70 6.69 5.16
(3V15) (589G2) Dodge City, KS 380 376 98.95% 4 1.05% 0 0 368 0 8 0 1 0 2 0 0 0 1 0 2.87 0.46 2.08
(3V15) (589G3) Liberal, KS 92 71 77.17% 21 22.83% 0 0 69 0 2 0 4 0 10 0 4 0 3 0 28.21 3.50 4.67
(3V15) (589G4) Hays, KS 453 430 94.92% 23 5.08% 0 2 414 0 16 0 19 0 4 0 0 0 0 2 5.07 1.38 2.99
(3V15) (589G5) Parsons, KS 921 910 98.81% 11 1.19% 0 3 890 0 20 0 10 0 1 0 0 0 0 3 0.96 2.12 2.50
(3V15) (589G7) Hutchinson, KS 1,451 1,441 99.31% 10 0.69% 0 3 1,413 0 28 0 6 0 2 0 1 0 1 3 1.75 0.37 2.93
(3V15) (589GW) Salina, KS 3,189 3,168 99.34% 21 0.66% 0 1 3,115 0 53 0 18 0 1 0 1 0 1 1 1.55 0.03 5.33
(3V15) (589MB) IDES McConnel AFB 17 17 100.00% 0 0.00% 0 0 9 0 8 0 0 0 0 0 0 0 0 0 11.54 18.50
(3V15) (589QB) Sedgwick County, KS 1 1 100.00% 0 0.00% 0 0 1 0 0 0 0 0 0 0 0 0 0 0
(3V15) (589QC) South Parklane, KS 4,893 4,782 97.73% 111 2.27% 0 0 4,626 0 156 0 67 0 22 0 7 0 15 0 3.48
(3V15) (657A5) Marion, IL HCS 58,767 57,113 97.19% 1,654 2.81% 0 52 55,034 0 2,079 3 849 9 449 8 223 2 133 30 1.81 6.63 2.82
(3V15) (657A5) Marion, IL 16,380 15,817 96.56% 563 3.44% 0 31 15,133 0 684 1 280 5 144 1 131 0 8 24 1.89 5.19 1.49
(3V15) (657GJ) Evansville, IN 21,284 20,320 95.47% 964 4.53% 0 0 19,297 0 1,023 0 462 0 290 0 90 0 122 0 2.51 8.57 4.21
(3V15) (657GK) Mount Vernon, IL 2,700 2,680 99.26% 20 0.74% 0 0 2,623 0 57 0 20 0 0 0 0 0 0 0 1.86 1.77
(3V15) (657GL) Paducah, KY 4,490 4,470 99.55% 20 0.45% 0 0 4,418 0 52 0 17 0 3 0 0 0 0 0 1.38 2.65
(3V15) (657GM) Effingham, IL 1,666 1,627 97.66% 39 2.34% 0 0 1,579 0 48 0 27 0 9 0 1 0 2 0 1.51 8.35
(3V15) (657GO) Hanson, KY 1,045 1,045 100.00% 0 0.00% 0 0 1,029 0 16 0 0 0 0 0 0 0 0 0 1.00 0.00

Pending Appointment and Electronic Wait List Summary -National, Facility, and Division Level Summaries Wait Time Calculated from Preferred
Date
For the period ending: 3/15/2019
1. Total Appts Scheduled
2. Appts Scheduled 30 Days or Under
3. Percent Appts Scheduled 30 Days or Under
4. Appts Scheduled Over 30 Days
5. Percent Appts Scheduled Over 30 Days
6. New Enroll Appt Req
7. EWL Count
8. Appts Between 0-14 Days
9. EWL 0-14 Days
10. Appts Between 15-30 Days
11. EWL 15 -30 days
12. Appts Between 31-60 Days
13. EWL 31 -60 Days
14. Appts Between 61-90 Days
15. EWL 61 -90 Days
16. Appts Between 91-120 Days
17. EWL 91 -120 Days
18. Appts Beyond 120 Days
19. EWL Greater than 120 Days
20. PC Avg Wait Time
21. SC Avg Wait Time
22. MH Avg Wait Time
(3V15) (657GP) Owensboro, KY 2,570 2,543 98.95% 27 1.05% 0 0 2,479 0 64 0 24 0 2 0 0 0 1 0 1.52 3.01
(3V15) (657GQ) Vincennes, IN 1,017 1,017 100.00% 0 0.00% 0 0 1,003 0 14 0 0 0 0 0 0 0 0 0 1.34 0.78
(3V15) (657GR) Mayfield, KY 2,440 2,427 99.47% 13 0.53% 0 2 2,395 0 32 0 12 0 0 1 1 0 0 1 0.87 2.59
(3V15) (657GT) Carbondale, IL 2,782 2,781 99.96% 1 0.04% 0 0 2,738 0 43 0 1 0 0 0 0 0 0 0 1.25 0.00 0.73
(3V15) (657GU) Harrisburg, IL 1,155 1,153 99.83% 2 0.17% 0 0 1,143 0 10 0 1 0 1 0 0 0 0 0 1.72 1.38
(3V15) (657QD) Heartland Street, IL 1,238 1,233 99.60% 5 0.40% 0 0 1,197 0 36 0 5 0 0 0 0 0 0 0 1.60 5.25 1.31
(3V15) (657A4) Poplar Bluff, MO HCS 25,989 24,852 95.63% 1,137 4.37% 0 0 23,616 0 1,236 0 832 0 207 0 68 0 30 0 3.11 7.86 5.13
(3V15) (657A4) Poplar Bluff, MO (John J. Pershing)
12,785 11,866 92.81% 919 7.19% 0 0 11,026 0 840 0 698 0 156 0 49 0 16 0 5.75 7.91 3.84
(3V15) (657GF) West Plains, MO 2,925 2,913 99.59% 12 0.41% 0 0 2,849 0 64 0 11 0 0 0 0 0 1 0 0.95 7.73 3.47
(3V15) (657GG) Paragould, AR 1,615 1,604 99.32% 11 0.68% 0 0 1,582 0 22 0 9 0 2 0 0 0 0 0 0.89 0.00 2.60
(3V15) (657GH) Cape Girardeau, MO 3,220 3,097 96.18% 123 3.82% 0 0 2,957 0 140 0 67 0 29 0 16 0 11 0 1.97 6.86 6.75
(3V15) (657GI) Farmington, MO 3,139 3,105 98.92% 34 1.08% 0 0 2,998 0 107 0 29 0 4 0 1 0 0 0 2.24 1.33 4.54
(3V15) (657GN) Salem, MO 177 177 100.00% 0 0.00% 0 0 174 0 3 0 0 0 0 0 0 0 0 0 1.74
(3V15) (657GV) Sikeston, MO 1,481 1,445 97.57% 36 2.43% 0 0 1,391 0 54 0 16 0 16 0 2 0 2 0 2.21 3.43 12.92
(3V15) (657GW) Pocahontas, AR 647 645 99.69% 2 0.31% 0 0 639 0 6 0 2 0 0 0 0 0 0 0 1.21 3.54
(3V15) (657) St. Louis, MO HCS 110,651 103,525 93.56% 7,126 6.44% 24 115 97,895 41 5,630 25 4,127 30 1,491 1 754 1 754 17 4.85 9.22 5.62
(3V15) (657) St. Louis-John Cochran, MO (John Cochran)
55,955 51,180 91.47% 4,775 8.53% 0 31 47,779 1 3,401 6 2,801 11 1,009 1 497 0 468 12 12.98 9.07 13.39
(3V15) (657A0) St. Louis-Jefferson Barracks, MO
27,494 25,948 94.38% 1,546 5.62% 0 78 24,784 35 1,164 19 757 19 341 0 215 0 233 5 4.04 14.13 3.56
(3V15) (657GA) Shiloh, IL (St. Clair County)
3,922 3,731 95.13% 191 4.87% 0 0 3,563 0 168 0 122 0 53 0 10 0 6 0 4.03 8.39 14.13
(3V15) (657GB) St. Louis County, MO 4,033 4,002 99.23% 31 0.77% 0 1 3,888 0 114 0 24 0 5 0 0 1 2 0 2.57 3.65 3.56
(3V15) (657GD) St. Charles County-OFallon, MO
3,792 3,636 95.89% 156 4.11% 0 5 3,561 5 75 0 116 0 28 0 5 0 7 0 3.66 2.25 2.55
(3V15) (657GS) Washington, MO (Franklin County)
1,675 1,648 98.39% 27 1.61% 0 0 1,587 0 61 0 21 0 6 0 0 0 0 0 3.06 0.78 1.32
(3V15) (657GX) Washington Avenue, MO 4,150 4,049 97.57% 101 2.43% 0 0 3,804 0 245 0 77 0 12 0 6 0 6 0 3.95 4.00 2.10
(3V15) (657GY) Manchester, MO 3,943 3,763 95.43% 180 4.57% 0 0 3,566 0 197 0 138 0 18 0 9 0 15 0 6.03 4.95 2.00
(3V15) (657MA) IDES Scott AFB 40 40 100.00% 0 0.00% 0 0 40 0 0 0 0 0 0 0 0 0 0 0 0.00
(3V15) (657QA) Olive Street, MO 5,192 5,079 97.82% 113 2.18% 0 0 4,890 0 189 0 65 0 19 0 12 0 17 0 6.71 2.14 42.50
(3V15) (657QB) Washington Boulevard, MO
383 377 98.43% 6 1.57% 0 0 365 0 12 0 6 0 0 0 0 0 0 0
(3V15) (657QE) Scott Air Force Base, IL 72 72 100.00% 0 0.00% 0 0 68 0 4 0 0 0 0 0 0 0 0 0 6.75 7.06
(4V16) (502) Alexandria, LA HCS 53,811 51,488 95.68% 2,323 4.32% 2 25 49,039 10 2,449 1 1,387 2 508 3 207 3 221 6 3.75 8.24 4.17
(4V16) (502) Alexandria, LA 30,605 29,241 95.54% 1,364 4.46% 0 3 27,779 2 1,462 0 892 0 237 1 105 0 130 0 3.21 7.48 3.80
(4V16) (502GA) Jennings, LA 1,717 1,705 99.30% 12 0.70% 0 6 1,676 4 29 0 9 1 1 1 0 0 2 0 1.63 5.11 2.58
(4V16) (502GB) Lafayette, LA 10,417 9,856 94.61% 561 5.39% 0 9 9,329 2 527 1 261 0 156 0 80 3 64 3 5.14 11.58 0.32
(4V16) (502GE) Lake Charles, LA 4,584 4,408 96.16% 176 3.84% 0 7 4,280 2 128 0 78 1 70 1 16 0 12 3 4.44 13.07 2.59
(4V16) (502GF) Fort Polk, LA 3,036 2,972 97.89% 64 2.11% 0 0 2,920 0 52 0 35 0 16 0 2 0 11 0 2.22 0.00 4.98
(4V16) (502GG) Natchitoches, LA 951 918 96.53% 33 3.47% 0 0 892 0 26 0 26 0 7 0 0 0 0 0 2.34 5.00
(4V16) (502QB) Lafayette Campus B, LA 2,501 2,388 95.48% 113 4.52% 0 0 2,163 0 225 0 86 0 21 0 4 0 2 0 5.87
(4V16) (520) Gulf Coast, MS HCS 110,119 103,081 93.61% 7,038 6.39% 19 6 96,973 3 6,108 1 3,847 0 1,630 0 818 2 743 0 7.16 7.37 4.88
(4V16) (520) Biloxi, MS 40,133 37,977 94.63% 2,156 5.37% 0 1 36,087 1 1,890 0 1,272 0 402 0 252 0 230 0 5.12 5.61 5.53
(4V16) (520BZ) Pensacola, FL 42,094 38,454 91.35% 3,640 8.65% 0 5 35,567 2 2,887 1 1,836 0 948 0 435 2 421 0 12.74 8.15 5.44
(4V16) (520GA) Mobile, AL 11,703 11,228 95.94% 475 4.06% 0 0 10,609 0 619 0 320 0 94 0 37 0 24 0 4.59 6.21 4.93
(4V16) (520GB) Panama City Beach, FL 6,660 6,190 92.94% 470 7.06% 0 0 5,944 0 246 0 177 0 137 0 90 0 66 0 2.78 26.86 0.03
(4V16) (520GC) Eglin Air Force Base, FL 8,089 7,823 96.71% 266 3.29% 0 0 7,411 0 412 0 214 0 46 0 4 0 2 0 3.96 6.21 4.00
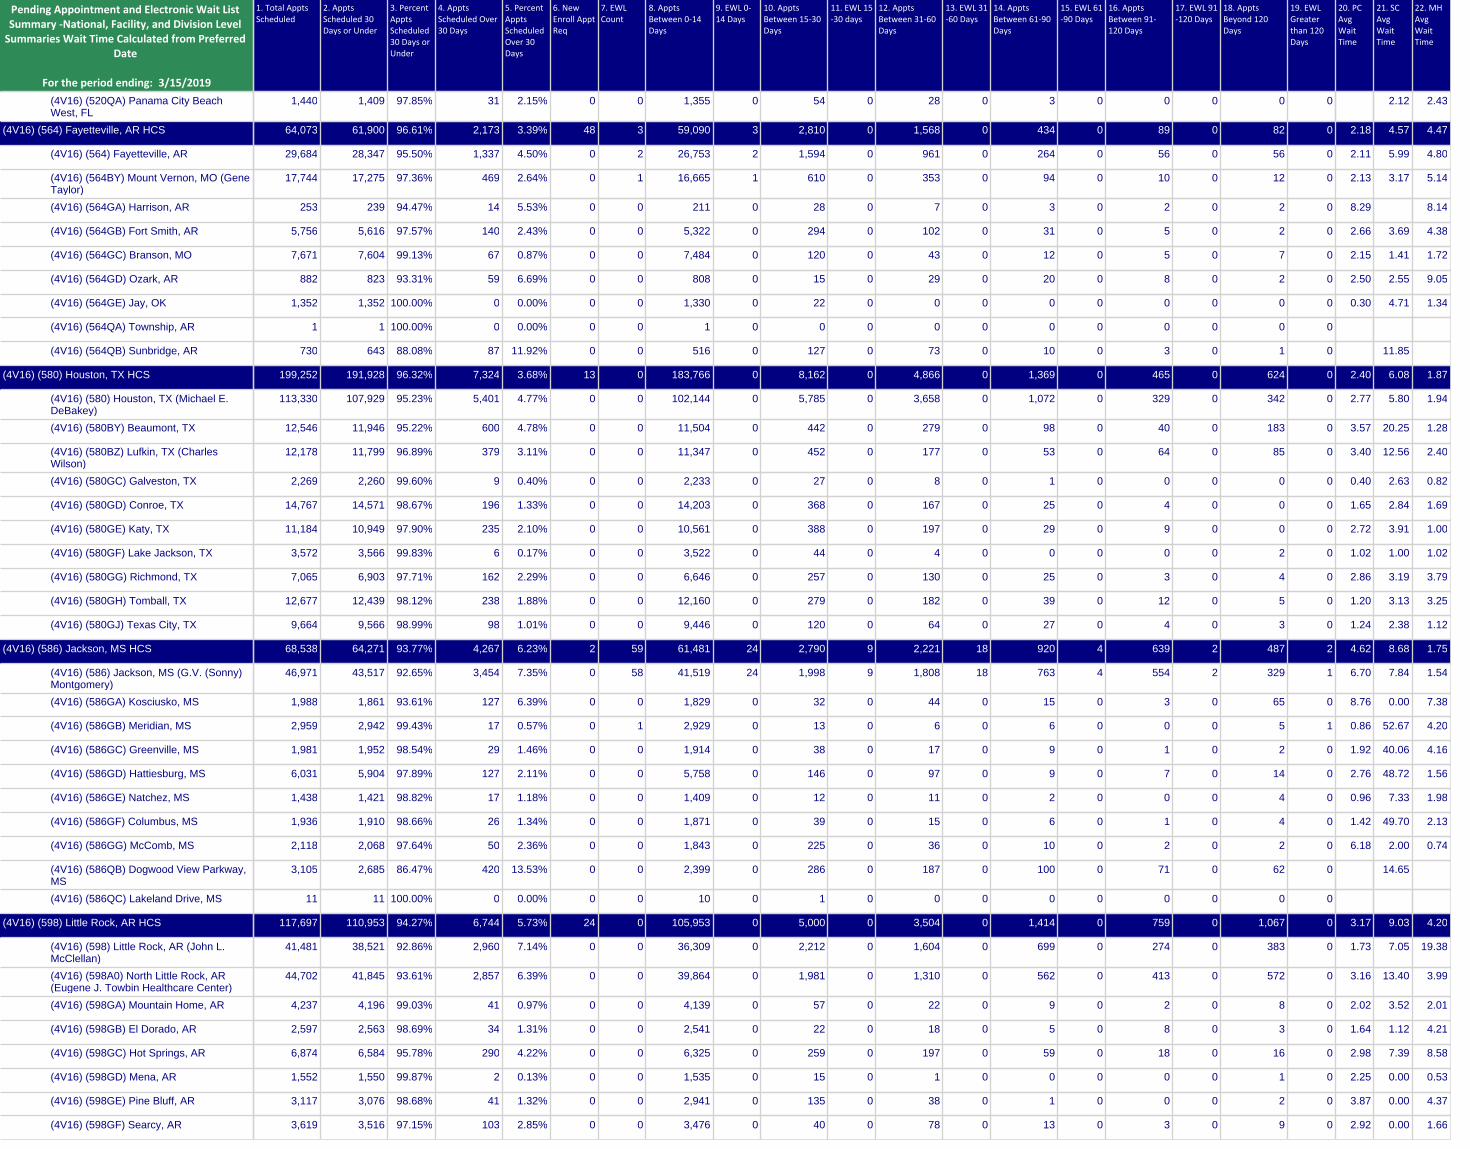
Pending Appointment and Electronic Wait List Summary -National, Facility, and Division Level Summaries Wait Time Calculated from Preferred
Date
For the period ending: 3/15/2019
1. Total Appts Scheduled
2. Appts Scheduled 30 Days or Under
3. Percent Appts Scheduled 30 Days or Under
4. Appts Scheduled Over 30 Days
5. Percent Appts Scheduled Over 30 Days
6. New Enroll Appt Req
7. EWL Count
8. Appts Between 0-14 Days
9. EWL 0-14 Days
10. Appts Between 15-30 Days
11. EWL 15 -30 days
12. Appts Between 31-60 Days
13. EWL 31 -60 Days
14. Appts Between 61-90 Days
15. EWL 61 -90 Days
16. Appts Between 91-120 Days
17. EWL 91 -120 Days
18. Appts Beyond 120 Days
19. EWL Greater than 120 Days
20. PC Avg Wait Time
21. SC Avg Wait Time
22. MH Avg Wait Time
(4V16) (520QA) Panama City Beach West, FL
1,440 1,409 97.85% 31 2.15% 0 0 1,355 0 54 0 28 0 3 0 0 0 0 0 2.12 2.43
(4V16) (564) Fayetteville, AR HCS 64,073 61,900 96.61% 2,173 3.39% 48 3 59,090 3 2,810 0 1,568 0 434 0 89 0 82 0 2.18 4.57 4.47
(4V16) (564) Fayetteville, AR 29,684 28,347 95.50% 1,337 4.50% 0 2 26,753 2 1,594 0 961 0 264 0 56 0 56 0 2.11 5.99 4.80
(4V16) (564BY) Mount Vernon, MO (Gene Taylor)
17,744 17,275 97.36% 469 2.64% 0 1 16,665 1 610 0 353 0 94 0 10 0 12 0 2.13 3.17 5.14
(4V16) (564GA) Harrison, AR 253 239 94.47% 14 5.53% 0 0 211 0 28 0 7 0 3 0 2 0 2 0 8.29 8.14
(4V16) (564GB) Fort Smith, AR 5,756 5,616 97.57% 140 2.43% 0 0 5,322 0 294 0 102 0 31 0 5 0 2 0 2.66 3.69 4.38
(4V16) (564GC) Branson, MO 7,671 7,604 99.13% 67 0.87% 0 0 7,484 0 120 0 43 0 12 0 5 0 7 0 2.15 1.41 1.72
(4V16) (564GD) Ozark, AR 882 823 93.31% 59 6.69% 0 0 808 0 15 0 29 0 20 0 8 0 2 0 2.50 2.55 9.05
(4V16) (564GE) Jay, OK 1,352 1,352 100.00% 0 0.00% 0 0 1,330 0 22 0 0 0 0 0 0 0 0 0 0.30 4.71 1.34
(4V16) (564QA) Township, AR 1 1 100.00% 0 0.00% 0 0 1 0 0 0 0 0 0 0 0 0 0 0
(4V16) (564QB) Sunbridge, AR 730 643 88.08% 87 11.92% 0 0 516 0 127 0 73 0 10 0 3 0 1 0 11.85
(4V16) (580) Houston, TX HCS 199,252 191,928 96.32% 7,324 3.68% 13 0 183,766 0 8,162 0 4,866 0 1,369 0 465 0 624 0 2.40 6.08 1.87
(4V16) (580) Houston, TX (Michael E. DeBakey)
113,330 107,929 95.23% 5,401 4.77% 0 0 102,144 0 5,785 0 3,658 0 1,072 0 329 0 342 0 2.77 5.80 1.94
(4V16) (580BY) Beaumont, TX 12,546 11,946 95.22% 600 4.78% 0 0 11,504 0 442 0 279 0 98 0 40 0 183 0 3.57 20.25 1.28
(4V16) (580BZ) Lufkin, TX (Charles Wilson)
12,178 11,799 96.89% 379 3.11% 0 0 11,347 0 452 0 177 0 53 0 64 0 85 0 3.40 12.56 2.40
(4V16) (580GC) Galveston, TX 2,269 2,260 99.60% 9 0.40% 0 0 2,233 0 27 0 8 0 1 0 0 0 0 0 0.40 2.63 0.82
(4V16) (580GD) Conroe, TX 14,767 14,571 98.67% 196 1.33% 0 0 14,203 0 368 0 167 0 25 0 4 0 0 0 1.65 2.84 1.69
(4V16) (580GE) Katy, TX 11,184 10,949 97.90% 235 2.10% 0 0 10,561 0 388 0 197 0 29 0 9 0 0 0 2.72 3.91 1.00
(4V16) (580GF) Lake Jackson, TX 3,572 3,566 99.83% 6 0.17% 0 0 3,522 0 44 0 4 0 0 0 0 0 2 0 1.02 1.00 1.02
(4V16) (580GG) Richmond, TX 7,065 6,903 97.71% 162 2.29% 0 0 6,646 0 257 0 130 0 25 0 3 0 4 0 2.86 3.19 3.79
(4V16) (580GH) Tomball, TX 12,677 12,439 98.12% 238 1.88% 0 0 12,160 0 279 0 182 0 39 0 12 0 5 0 1.20 3.13 3.25
(4V16) (580GJ) Texas City, TX 9,664 9,566 98.99% 98 1.01% 0 0 9,446 0 120 0 64 0 27 0 4 0 3 0 1.24 2.38 1.12
(4V16) (586) Jackson, MS HCS 68,538 64,271 93.77% 4,267 6.23% 2 59 61,481 24 2,790 9 2,221 18 920 4 639 2 487 2 4.62 8.68 1.75
(4V16) (586) Jackson, MS (G.V. (Sonny) Montgomery)
46,971 43,517 92.65% 3,454 7.35% 0 58 41,519 24 1,998 9 1,808 18 763 4 554 2 329 1 6.70 7.84 1.54
(4V16) (586GA) Kosciusko, MS 1,988 1,861 93.61% 127 6.39% 0 0 1,829 0 32 0 44 0 15 0 3 0 65 0 8.76 0.00 7.38
(4V16) (586GB) Meridian, MS 2,959 2,942 99.43% 17 0.57% 0 1 2,929 0 13 0 6 0 6 0 0 0 5 1 0.86 52.67 4.20
(4V16) (586GC) Greenville, MS 1,981 1,952 98.54% 29 1.46% 0 0 1,914 0 38 0 17 0 9 0 1 0 2 0 1.92 40.06 4.16
(4V16) (586GD) Hattiesburg, MS 6,031 5,904 97.89% 127 2.11% 0 0 5,758 0 146 0 97 0 9 0 7 0 14 0 2.76 48.72 1.56
(4V16) (586GE) Natchez, MS 1,438 1,421 98.82% 17 1.18% 0 0 1,409 0 12 0 11 0 2 0 0 0 4 0 0.96 7.33 1.98
(4V16) (586GF) Columbus, MS 1,936 1,910 98.66% 26 1.34% 0 0 1,871 0 39 0 15 0 6 0 1 0 4 0 1.42 49.70 2.13
(4V16) (586GG) McComb, MS 2,118 2,068 97.64% 50 2.36% 0 0 1,843 0 225 0 36 0 10 0 2 0 2 0 6.18 2.00 0.74
(4V16) (586QB) Dogwood View Parkway, MS
3,105 2,685 86.47% 420 13.53% 0 0 2,399 0 286 0 187 0 100 0 71 0 62 0 14.65
(4V16) (586QC) Lakeland Drive, MS 11 11 100.00% 0 0.00% 0 0 10 0 1 0 0 0 0 0 0 0 0 0
(4V16) (598) Little Rock, AR HCS 117,697 110,953 94.27% 6,744 5.73% 24 0 105,953 0 5,000 0 3,504 0 1,414 0 759 0 1,067 0 3.17 9.03 4.20
(4V16) (598) Little Rock, AR (John L. McClellan)
41,481 38,521 92.86% 2,960 7.14% 0 0 36,309 0 2,212 0 1,604 0 699 0 274 0 383 0 1.73 7.05 19.38
(4V16) (598A0) North Little Rock, AR (Eugene J. Towbin Healthcare Center)
44,702 41,845 93.61% 2,857 6.39% 0 0 39,864 0 1,981 0 1,310 0 562 0 413 0 572 0 3.16 13.40 3.99
(4V16) (598GA) Mountain Home, AR 4,237 4,196 99.03% 41 0.97% 0 0 4,139 0 57 0 22 0 9 0 2 0 8 0 2.02 3.52 2.01
(4V16) (598GB) El Dorado, AR 2,597 2,563 98.69% 34 1.31% 0 0 2,541 0 22 0 18 0 5 0 8 0 3 0 1.64 1.12 4.21
(4V16) (598GC) Hot Springs, AR 6,874 6,584 95.78% 290 4.22% 0 0 6,325 0 259 0 197 0 59 0 18 0 16 0 2.98 7.39 8.58
(4V16) (598GD) Mena, AR 1,552 1,550 99.87% 2 0.13% 0 0 1,535 0 15 0 1 0 0 0 0 0 1 0 2.25 0.00 0.53
(4V16) (598GE) Pine Bluff, AR 3,117 3,076 98.68% 41 1.32% 0 0 2,941 0 135 0 38 0 1 0 0 0 2 0 3.87 0.00 4.37
(4V16) (598GF) Searcy, AR 3,619 3,516 97.15% 103 2.85% 0 0 3,476 0 40 0 78 0 13 0 3 0 9 0 2.92 0.00 1.66
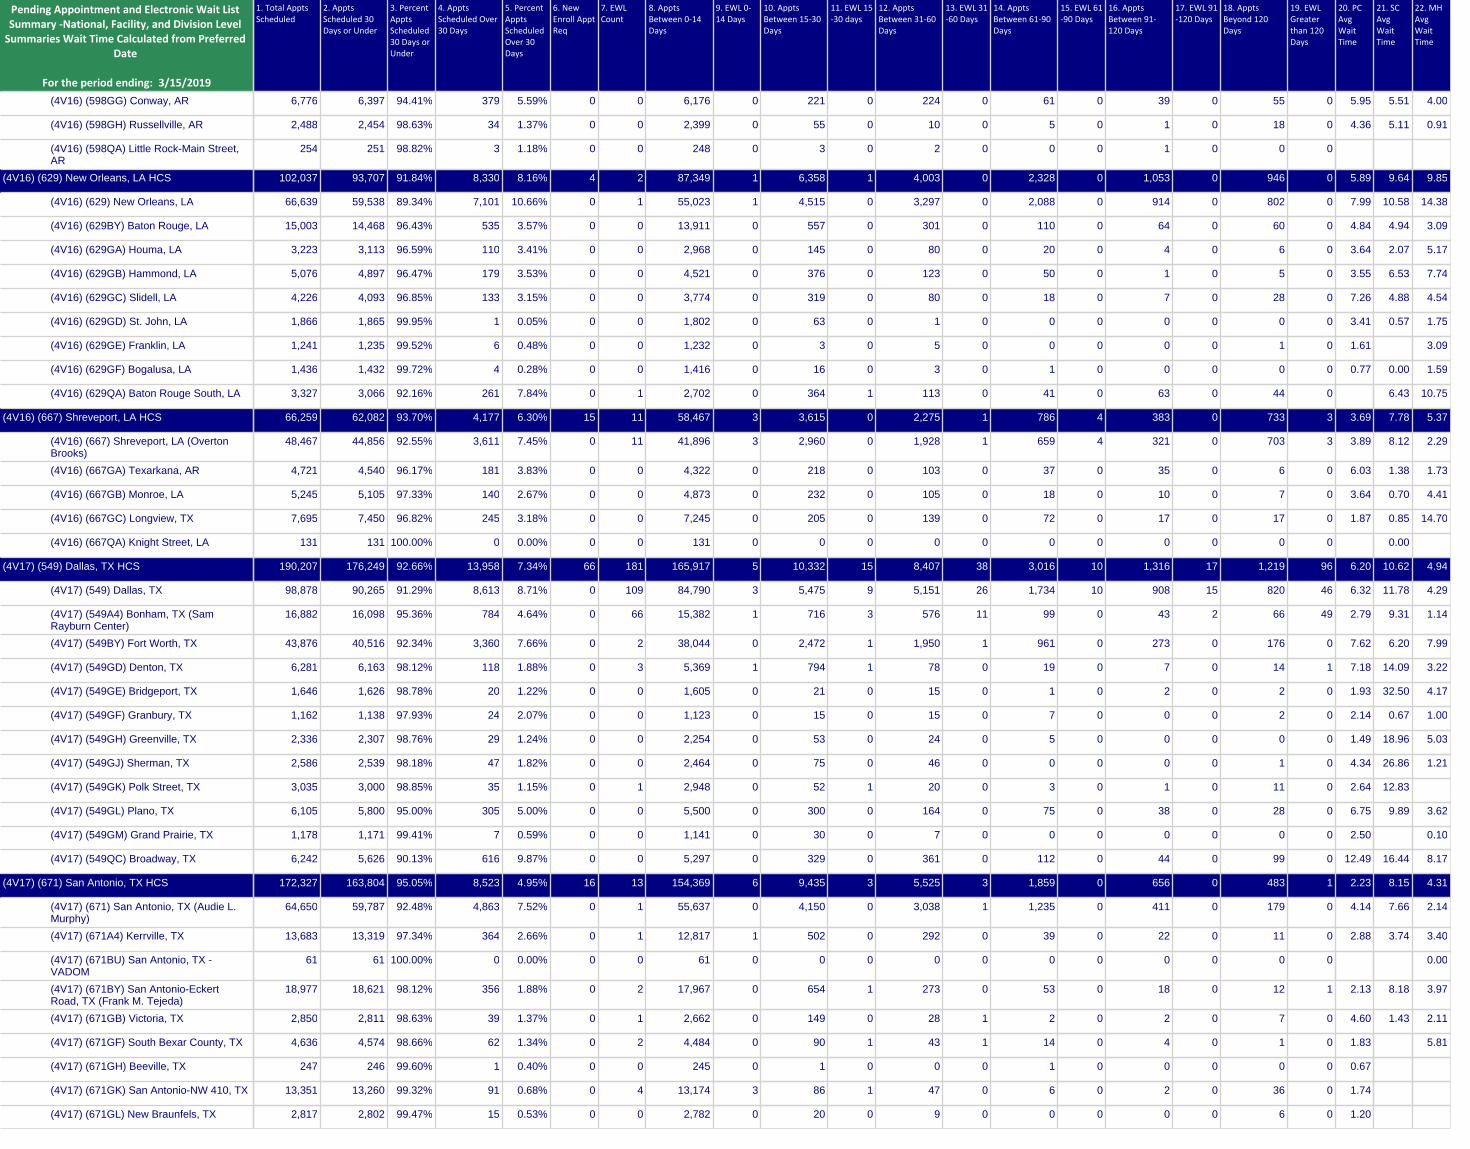
Pending Appointment and Electronic Wait List Summary -National, Facility, and Division Level Summaries Wait Time Calculated from Preferred
Date
For the period ending: 3/15/2019
1. Total Appts Scheduled
2. Appts Scheduled 30 Days or Under
3. Percent Appts Scheduled 30 Days or Under
4. Appts Scheduled Over 30 Days
5. Percent Appts Scheduled Over 30 Days
6. New Enroll Appt Req
7. EWL Count
8. Appts Between 0-14 Days
9. EWL 0-14 Days
10. Appts Between 15-30 Days
11. EWL 15 -30 days
12. Appts Between 31-60 Days
13. EWL 31 -60 Days
14. Appts Between 61-90 Days
15. EWL 61 -90 Days
16. Appts Between 91-120 Days
17. EWL 91 -120 Days
18. Appts Beyond 120 Days
19. EWL Greater than 120 Days
20. PC Avg Wait Time
21. SC Avg Wait Time
22. MH Avg Wait Time
(4V16) (598GG) Conway, AR 6,776 6,397 94.41% 379 5.59% 0 0 6,176 0 221 0 224 0 61 0 39 0 55 0 5.95 5.51 4.00
(4V16) (598GH) Russellville, AR 2,488 2,454 98.63% 34 1.37% 0 0 2,399 0 55 0 10 0 5 0 1 0 18 0 4.36 5.11 0.91
(4V16) (598QA) Little Rock-Main Street, AR
254 251 98.82% 3 1.18% 0 0 248 0 3 0 2 0 0 0 1 0 0 0
(4V16) (629) New Orleans, LA HCS 102,037 93,707 91.84% 8,330 8.16% 4 2 87,349 1 6,358 1 4,003 0 2,328 0 1,053 0 946 0 5.89 9.64 9.85
(4V16) (629) New Orleans, LA 66,639 59,538 89.34% 7,101 10.66% 0 1 55,023 1 4,515 0 3,297 0 2,088 0 914 0 802 0 7.99 10.58 14.38
(4V16) (629BY) Baton Rouge, LA 15,003 14,468 96.43% 535 3.57% 0 0 13,911 0 557 0 301 0 110 0 64 0 60 0 4.84 4.94 3.09
(4V16) (629GA) Houma, LA 3,223 3,113 96.59% 110 3.41% 0 0 2,968 0 145 0 80 0 20 0 4 0 6 0 3.64 2.07 5.17
(4V16) (629GB) Hammond, LA 5,076 4,897 96.47% 179 3.53% 0 0 4,521 0 376 0 123 0 50 0 1 0 5 0 3.55 6.53 7.74
(4V16) (629GC) Slidell, LA 4,226 4,093 96.85% 133 3.15% 0 0 3,774 0 319 0 80 0 18 0 7 0 28 0 7.26 4.88 4.54
(4V16) (629GD) St. John, LA 1,866 1,865 99.95% 1 0.05% 0 0 1,802 0 63 0 1 0 0 0 0 0 0 0 3.41 0.57 1.75
(4V16) (629GE) Franklin, LA 1,241 1,235 99.52% 6 0.48% 0 0 1,232 0 3 0 5 0 0 0 0 0 1 0 1.61 3.09
(4V16) (629GF) Bogalusa, LA 1,436 1,432 99.72% 4 0.28% 0 0 1,416 0 16 0 3 0 1 0 0 0 0 0 0.77 0.00 1.59
(4V16) (629QA) Baton Rouge South, LA 3,327 3,066 92.16% 261 7.84% 0 1 2,702 0 364 1 113 0 41 0 63 0 44 0 6.43 10.75
(4V16) (667) Shreveport, LA HCS 66,259 62,082 93.70% 4,177 6.30% 15 11 58,467 3 3,615 0 2,275 1 786 4 383 0 733 3 3.69 7.78 5.37
(4V16) (667) Shreveport, LA (Overton Brooks)
48,467 44,856 92.55% 3,611 7.45% 0 11 41,896 3 2,960 0 1,928 1 659 4 321 0 703 3 3.89 8.12 2.29
(4V16) (667GA) Texarkana, AR 4,721 4,540 96.17% 181 3.83% 0 0 4,322 0 218 0 103 0 37 0 35 0 6 0 6.03 1.38 1.73
(4V16) (667GB) Monroe, LA 5,245 5,105 97.33% 140 2.67% 0 0 4,873 0 232 0 105 0 18 0 10 0 7 0 3.64 0.70 4.41
(4V16) (667GC) Longview, TX 7,695 7,450 96.82% 245 3.18% 0 0 7,245 0 205 0 139 0 72 0 17 0 17 0 1.87 0.85 14.70
(4V16) (667QA) Knight Street, LA 131 131 100.00% 0 0.00% 0 0 131 0 0 0 0 0 0 0 0 0 0 0 0.00
(4V17) (549) Dallas, TX HCS 190,207 176,249 92.66% 13,958 7.34% 66 181 165,917 5 10,332 15 8,407 38 3,016 10 1,316 17 1,219 96 6.20 10.62 4.94
(4V17) (549) Dallas, TX 98,878 90,265 91.29% 8,613 8.71% 0 109 84,790 3 5,475 9 5,151 26 1,734 10 908 15 820 46 6.32 11.78 4.29
(4V17) (549A4) Bonham, TX (Sam Rayburn Center)
16,882 16,098 95.36% 784 4.64% 0 66 15,382 1 716 3 576 11 99 0 43 2 66 49 2.79 9.31 1.14
(4V17) (549BY) Fort Worth, TX 43,876 40,516 92.34% 3,360 7.66% 0 2 38,044 0 2,472 1 1,950 1 961 0 273 0 176 0 7.62 6.20 7.99
(4V17) (549GD) Denton, TX 6,281 6,163 98.12% 118 1.88% 0 3 5,369 1 794 1 78 0 19 0 7 0 14 1 7.18 14.09 3.22
(4V17) (549GE) Bridgeport, TX 1,646 1,626 98.78% 20 1.22% 0 0 1,605 0 21 0 15 0 1 0 2 0 2 0 1.93 32.50 4.17
(4V17) (549GF) Granbury, TX 1,162 1,138 97.93% 24 2.07% 0 0 1,123 0 15 0 15 0 7 0 0 0 2 0 2.14 0.67 1.00
(4V17) (549GH) Greenville, TX 2,336 2,307 98.76% 29 1.24% 0 0 2,254 0 53 0 24 0 5 0 0 0 0 0 1.49 18.96 5.03
(4V17) (549GJ) Sherman, TX 2,586 2,539 98.18% 47 1.82% 0 0 2,464 0 75 0 46 0 0 0 0 0 1 0 4.34 26.86 1.21
(4V17) (549GK) Polk Street, TX 3,035 3,000 98.85% 35 1.15% 0 1 2,948 0 52 1 20 0 3 0 1 0 11 0 2.64 12.83
(4V17) (549GL) Plano, TX 6,105 5,800 95.00% 305 5.00% 0 0 5,500 0 300 0 164 0 75 0 38 0 28 0 6.75 9.89 3.62
(4V17) (549GM) Grand Prairie, TX 1,178 1,171 99.41% 7 0.59% 0 0 1,141 0 30 0 7 0 0 0 0 0 0 0 2.50 0.10
(4V17) (549QC) Broadway, TX 6,242 5,626 90.13% 616 9.87% 0 0 5,297 0 329 0 361 0 112 0 44 0 99 0 12.49 16.44 8.17
(4V17) (671) San Antonio, TX HCS 172,327 163,804 95.05% 8,523 4.95% 16 13 154,369 6 9,435 3 5,525 3 1,859 0 656 0 483 1 2.23 8.15 4.31
(4V17) (671) San Antonio, TX (Audie L. Murphy)
64,650 59,787 92.48% 4,863 7.52% 0 1 55,637 0 4,150 0 3,038 1 1,235 0 411 0 179 0 4.14 7.66 2.14
(4V17) (671A4) Kerrville, TX 13,683 13,319 97.34% 364 2.66% 0 1 12,817 1 502 0 292 0 39 0 22 0 11 0 2.88 3.74 3.40
(4V17) (671BU) San Antonio, TX -VADOM
61 61 100.00% 0 0.00% 0 0 61 0 0 0 0 0 0 0 0 0 0 0 0.00
(4V17) (671BY) San Antonio-Eckert Road, TX (Frank M. Tejeda)
18,977 18,621 98.12% 356 1.88% 0 2 17,967 0 654 1 273 0 53 0 18 0 12 1 2.13 8.18 3.97
(4V17) (671GB) Victoria, TX 2,850 2,811 98.63% 39 1.37% 0 1 2,662 0 149 0 28 1 2 0 2 0 7 0 4.60 1.43 2.11
(4V17) (671GF) South Bexar County, TX 4,636 4,574 98.66% 62 1.34% 0 2 4,484 0 90 1 43 1 14 0 4 0 1 0 1.83 5.81
(4V17) (671GH) Beeville, TX 247 246 99.60% 1 0.40% 0 0 245 0 1 0 0 0 1 0 0 0 0 0 0.67
(4V17) (671GK) San Antonio-NW 410, TX 13,351 13,260 99.32% 91 0.68% 0 4 13,174 3 86 1 47 0 6 0 2 0 36 0 1.74
(4V17) (671GL) New Braunfels, TX 2,817 2,802 99.47% 15 0.53% 0 0 2,782 0 20 0 9 0 0 0 0 0 6 0 1.20

Pending Appointment and Electronic Wait List Summary -National, Facility, and Division Level Summaries Wait Time Calculated from Preferred
Date
For the period ending: 3/15/2019
1. Total Appts Scheduled
2. Appts Scheduled 30 Days or Under
3. Percent Appts Scheduled 30 Days or Under
4. Appts Scheduled Over 30 Days
5. Percent Appts Scheduled Over 30 Days
6. New Enroll Appt Req
7. EWL Count
8. Appts Between 0-14 Days
9. EWL 0-14 Days
10. Appts Between 15-30 Days
11. EWL 15 -30 days
12. Appts Between 31-60 Days
13. EWL 31 -60 Days
14. Appts Between 61-90 Days
15. EWL 61 -90 Days
16. Appts Between 91-120 Days
17. EWL 91 -120 Days
18. Appts Beyond 120 Days
19. EWL Greater than 120 Days
20. PC Avg Wait Time
21. SC Avg Wait Time
22. MH Avg Wait Time
(4V17) (671GN) Seguin, TX 760 756 99.47% 4 0.53% 0 0 753 0 3 0 3 0 0 0 1 0 0 0 0.68
(4V17) (671GO) North Central Federal, TX
11,705 11,299 96.53% 406 3.47% 0 0 10,964 0 335 0 280 0 97 0 16 0 13 0 1.32 5.75 8.67
(4V17) (671GP) Balcones Heights, TX 8,148 8,070 99.04% 78 0.96% 0 1 7,896 1 174 0 51 0 10 0 5 0 12 0 1.93 10.78 4.79
(4V17) (671GQ) Shavano Park, TX 5,334 5,284 99.06% 50 0.94% 0 0 5,136 0 148 0 44 0 2 0 3 0 1 0 2.82 3.01
(4V17) (671PA) San Antonio SARRTP 71 64 90.14% 7 9.86% 0 0 41 0 23 0 6 0 0 0 1 0 0 0 0.00
(4V17) (671QB) Data Point, TX 25,037 22,850 91.26% 2,187 8.74% 0 1 19,750 1 3,100 0 1,411 0 400 0 171 0 205 0 9.86
(4V17) (674) Temple, TX HCS 194,567 179,609 92.31% 14,958 7.69% 15 5 169,538 3 10,071 1 7,927 0 3,042 0 1,613 0 2,376 1 4.45 13.19 6.18
(4V17) (674) Temple, TX (Olin E. Teague Center)
102,052 92,411 90.55% 9,641 9.45% 0 1 86,756 0 5,655 0 4,819 0 1,892 0 1,175 0 1,755 1 6.60 14.54 7.13
(4V17) (674A4) Waco, TX (Doris Miller) 17,784 16,583 93.25% 1,201 6.75% 0 1 15,582 1 1,001 0 589 0 171 0 117 0 324 0 4.82 18.84 1.98
(4V17) (674BY) Austin, TX 49,509 45,908 92.73% 3,601 7.27% 0 3 43,215 2 2,693 1 2,153 0 908 0 294 0 246 0 3.90 8.86 6.54
(4V17) (674GA) Palestine, TX 2,706 2,682 99.11% 24 0.89% 0 0 2,642 0 40 0 18 0 2 0 0 0 4 0 1.78 15.00 1.17
(4V17) (674GB) Brownwood, TX 3,452 3,362 97.39% 90 2.61% 0 0 3,269 0 93 0 67 0 14 0 4 0 5 0 1.54 28.93 2.78
(4V17) (674GC) Bryan, TX 4,927 4,840 98.23% 87 1.77% 0 0 4,702 0 138 0 55 0 14 0 7 0 11 0 2.16 21.60 3.19
(4V17) (674GD) Cedar Park, TX 8,211 7,999 97.42% 212 2.58% 0 0 7,655 0 344 0 165 0 25 0 8 0 14 0 2.85 8.57 10.61
(4V17) (674GF) Temple-General Bruce Drive, TX
4,840 4,747 98.08% 93 1.92% 0 0 4,652 0 95 0 56 0 16 0 8 0 13 0 2.41 7.53 3.68
(4V17) (674HB) LaGrange, TX 1,086 1,077 99.17% 9 0.83% 0 0 1,065 0 12 0 5 0 0 0 0 0 4 0 1.72 1.23
(4V17) (504) Amarillo, TX HCS 43,542 41,736 95.85% 1,806 4.15% 2 11 40,269 11 1,467 0 1,122 0 281 0 164 0 239 0 2.62 7.58 2.77
(4V17) (504) Amarillo, TX (Thomas E. Creek)
30,365 28,879 95.11% 1,486 4.89% 0 11 27,721 11 1,158 0 865 0 236 0 159 0 226 0 3.33 7.94 3.73
(4V17) (504BY) Lubbock, TX 11,386 11,078 97.29% 308 2.71% 0 0 10,796 0 282 0 249 0 43 0 5 0 11 0 1.92 5.73 1.16
(4V17) (504BZ) Clovis, NM 1,646 1,639 99.57% 7 0.43% 0 0 1,626 0 13 0 3 0 2 0 0 0 2 0 0.92 12.20 1.98
(4V17) (504GA) Childress, TX 67 63 94.03% 4 5.97% 0 0 59 0 4 0 4 0 0 0 0 0 0 0 6.91 1.75
(4V17) (504HB) Dalhart, TX 78 77 98.72% 1 1.28% 0 0 67 0 10 0 1 0 0 0 0 0 0 0 7.40 9.33 0.00
(4V17) (519) Big Spring, TX HCS 22,932 22,029 96.06% 903 3.94% 9 1 21,162 0 867 0 558 1 219 0 60 0 66 0 3.81 5.15 5.28
(4V17) (519) Big Spring, TX (George H. OBrien, Jr.)
9,537 9,041 94.80% 496 5.20% 0 1 8,588 0 453 0 313 1 113 0 39 0 31 0 3.93 6.31 6.09
(4V17) (519GA) Permian Basin, TX 4,177 4,060 97.20% 117 2.80% 0 0 3,886 0 174 0 63 0 45 0 0 0 9 0 4.67 3.09 3.39
(4V17) (519GB) Hobbs, NM 661 658 99.55% 3 0.45% 0 0 653 0 5 0 3 0 0 0 0 0 0 0 0.73 0.00 3.38
(4V17) (519GD) Fort Stockton, TX 128 114 89.06% 14 10.94% 0 0 112 0 2 0 5 0 9 0 0 0 0 0 8.38 0.00
(4V17) (519HC) Abilene, TX 5,154 5,009 97.19% 145 2.81% 0 0 4,861 0 148 0 104 0 24 0 6 0 11 0 4.18 2.25 3.61
(4V17) (519HD) Stamford, TX 62 60 96.77% 2 3.23% 0 0 59 0 1 0 2 0 0 0 0 0 0 0 2.65
(4V17) (519HF) San Angelo, TX 3,213 3,087 96.08% 126 3.92% 0 0 3,003 0 84 0 68 0 28 0 15 0 15 0 2.88 1.96 7.13
(4V17) (756) El Paso, TX HCS 62,834 61,047 97.16% 1,787 2.84% 6 72 58,590 8 2,457 13 1,222 11 310 16 172 16 83 8 3.44 2.66 5.40
(4V17) (756) El Paso, TX 51,794 50,395 97.30% 1,399 2.70% 0 19 48,644 2 1,751 3 939 2 234 1 152 3 74 8 3.84 2.30 5.23
(4V17) (756GA) Las Cruces, NM 4,551 4,485 98.55% 66 1.45% 0 6 4,333 0 152 0 59 0 4 4 2 2 1 0 1.94 23.25 3.11
(4V17) (756GB) El Paso Eastside, TX 6,291 5,970 94.90% 321 5.10% 0 47 5,585 6 385 10 223 9 72 11 18 11 8 0 2.92 19.81 7.71
(4V17) (756MA) IDES Fort Bliss 198 197 99.49% 1 0.51% 0 0 28 0 169 0 1 0 0 0 0 0 0 0 19.40 19.71
(4V17) (740) Texas Valley Coastal Bend HCS 54,869 51,930 94.64% 2,939 5.36% 6 1 49,727 1 2,203 0 1,373 0 632 0 379 0 555 0 5.88 11.18 1.69
(4V17) (740) Harlingen, TX 12,944 11,996 92.68% 948 7.32% 0 0 11,364 0 632 0 437 0 181 0 79 0 251 0 4.92 13.75 2.13
(4V17) (740GA) Harlingen-Treasure Hills, TX
8,602 8,264 96.07% 338 3.93% 0 0 7,852 0 412 0 179 0 100 0 30 0 29 0 3.72 10.09 1.58
(4V17) (740GB) McAllen, TX 13,397 13,053 97.43% 344 2.57% 0 0 12,667 0 386 0 145 0 70 0 95 0 34 0 4.26 6.05 1.26
(4V17) (740GC) Corpus Christi, TX 7,249 6,779 93.52% 470 6.48% 0 1 6,595 1 184 0 170 0 124 0 69 0 107 0 8.40 0.67 0.27
(4V17) (740GD) Laredo, TX 3,257 3,016 92.60% 241 7.40% 0 0 2,890 0 126 0 86 0 59 0 52 0 44 0 11.12 24.70 1.05
(4V17) (740GH) South Enterprize, TX 9,419 8,821 93.65% 598 6.35% 0 0 8,358 0 463 0 356 0 98 0 54 0 90 0 1.83 10.38 2.16

Pending Appointment and Electronic Wait List Summary -National, Facility, and Division Level Summaries Wait Time Calculated from Preferred
Date
For the period ending: 3/15/2019
1. Total Appts Scheduled
2. Appts Scheduled 30 Days or Under
3. Percent Appts Scheduled 30 Days or Under
4. Appts Scheduled Over 30 Days
5. Percent Appts Scheduled Over 30 Days
6. New Enroll Appt Req
7. EWL Count
8. Appts Between 0-14 Days
9. EWL 0-14 Days
10. Appts Between 15-30 Days
11. EWL 15 -30 days
12. Appts Between 31-60 Days
13. EWL 31 -60 Days
14. Appts Between 61-90 Days
15. EWL 61 -90 Days
16. Appts Between 91-120 Days
17. EWL 91 -120 Days
18. Appts Beyond 120 Days
19. EWL Greater than 120 Days
20. PC Avg Wait Time
21. SC Avg Wait Time
22. MH Avg Wait Time
(4V17) (740GI) Old Brownsville, TX 1 1 100.00% 0 0.00% 0 0 1 0 0 0 0 0 0 0 0 0 0 0
(4V19) (623) Muskogee, OK HCS 55,564 52,514 94.51% 3,050 5.49% 12 11 50,290 4 2,224 1 2,262 3 505 2 138 0 145 1 2.14 6.50 7.80
(4V19) (623) Muskogee, OK (Jack C. Montgomery)
25,979 24,684 95.02% 1,295 4.98% 0 0 23,795 0 889 0 977 0 220 0 65 0 33 0 1.18 6.10 5.41
(4V19) (623BY) Tulsa, OK (Ernest Childers)
16,721 15,710 93.95% 1,011 6.05% 0 0 14,875 0 835 0 860 0 83 0 19 0 49 0 3.71 7.80 3.71
(4V19) (623GA) McAlester, OK 1,467 1,438 98.02% 29 1.98% 0 0 1,395 0 43 0 26 0 3 0 0 0 0 0 1.69 6.40 3.03
(4V19) (623GB) Vinita, OK 2,687 2,678 99.67% 9 0.33% 0 0 2,665 0 13 0 9 0 0 0 0 0 0 0 0.51 2.16 0.39
(4V19) (623GC) Idabel, OK (McCurtain County)
842 835 99.17% 7 0.83% 0 0 831 0 4 0 3 0 2 0 1 0 1 0 1.11 0.00 2.60
(4V19) (623QA) Muskogee-Shawnee Road, OK (Jack C. Montgomery)
2,173 2,003 92.18% 170 7.82% 0 0 1,926 0 77 0 137 0 24 0 6 0 3 0 6.52
(4V19) (623QB) Tulsa Eleventh Street, OK
4,086 3,580 87.62% 506 12.38% 0 11 3,353 4 227 1 229 3 172 2 47 0 58 1 11.98
(4V19) (623QC) Yale Avenue, OK 1,609 1,586 98.57% 23 1.43% 0 0 1,450 0 136 0 21 0 1 0 0 0 1 0 3.70
(4V19) (635) Oklahoma City, OK HCS 101,825 95,886 94.17% 5,939 5.83% 33 8 90,839 1 5,047 1 3,599 5 1,242 1 521 0 577 0 2.07 9.13 5.72
(4V19) (635) Oklahoma City, OK 68,712 63,491 92.40% 5,221 7.60% 0 8 59,563 1 3,928 1 2,999 5 1,195 1 503 0 524 0 3.37 8.69 6.61
(4V19) (635GA) Lawton, OK 13,082 12,540 95.86% 542 4.14% 0 0 11,740 0 800 0 441 0 39 0 13 0 49 0 2.24 15.22 1.93
(4V19) (635GB) Wichita Falls, TX 3,078 3,063 99.51% 15 0.49% 0 0 3,009 0 54 0 14 0 1 0 0 0 0 0 1.41 4.54 1.70
(4V19) (635GC) Blackwell, OK 415 409 98.55% 6 1.45% 0 0 406 0 3 0 5 0 1 0 0 0 0 0 0.23 42.00 18.55
(4V19) (635GD) Ada, OK 432 425 98.38% 7 1.62% 0 0 412 0 13 0 5 0 1 0 1 0 0 0 0.46 6.35 5.16
(4V19) (635GE) Stillwater, OK 980 969 98.88% 11 1.12% 0 0 947 0 22 0 10 0 1 0 0 0 0 0 0.67 1.90 5.97
(4V19) (635GF) Altus, OK 1,065 1,058 99.34% 7 0.66% 0 0 1,040 0 18 0 6 0 0 0 1 0 0 0 0.58 1.80 6.80
(4V19) (635GG) Enid, OK 1,007 1,006 99.90% 1 0.10% 0 0 994 0 12 0 1 0 0 0 0 0 0 0 0.78 0.63 4.42
(4V19) (635HB) Ardmore, OK 1,094 1,010 92.32% 84 7.68% 0 0 940 0 70 0 81 0 2 0 0 0 1 0 5.58 4.79 9.20
(4V19) (635PA) Oklahoma City, OK -PRRTP
8 8 100.00% 0 0.00% 0 0 8 0 0 0 0 0 0 0 0 0 0 0
(4V19) (635QA) North May, OK 2,454 2,446 99.67% 8 0.33% 0 0 2,410 0 36 0 7 0 0 0 0 0 1 0 1.18 2.88 5.12
(4V19) (635QB) South Oklahoma City, OK 9,498 9,461 99.61% 37 0.39% 0 0 9,370 0 91 0 30 0 2 0 3 0 2 0 0.57 4.19 5.43
(4V19) (436) Montana HCS 42,732 36,811 86.14% 5,921 13.86% 3 27 34,107 3 2,704 5 2,635 4 1,423 3 673 2 1,190 10 13.45 22.94 4.61
(4V19) (436) Fort Harrison, MT 14,692 12,146 82.67% 2,546 17.33% 0 9 11,096 0 1,050 0 1,047 0 607 2 273 0 619 7 7.09 26.22 8.52
(4V19) (436A4) Miles City, MT 399 356 89.22% 43 10.78% 0 0 316 0 40 0 34 0 6 0 0 0 3 0 5.71 18.46 0.44
(4V19) (436GA) Anaconda, MT 1,701 1,661 97.65% 40 2.35% 0 0 1,621 0 40 0 33 0 3 0 1 0 3 0 2.00 71.25 2.56
(4V19) (436GB) Great Falls, MT 2,449 2,035 83.10% 414 16.90% 0 6 1,835 1 200 1 206 1 121 0 66 1 21 2 14.40 10.95 1.87
(4V19) (436GC) Missoula, MT 7,066 6,677 94.49% 389 5.51% 0 0 6,432 0 245 0 176 0 92 0 39 0 82 0 7.03 12.18 2.59
(4V19) (436GD) Bozeman, MT 1,546 1,453 93.98% 93 6.02% 0 0 1,367 0 86 0 71 0 7 0 6 0 9 0 7.34 36.96 2.14
(4V19) (436GF) Kalispell, MT 3,956 3,655 92.39% 301 7.61% 0 0 3,501 0 154 0 136 0 73 0 43 0 49 0 8.69 24.82 3.63
(4V19) (436GH) Billings, MT 8,133 6,701 82.39% 1,432 17.61% 0 12 5,953 2 748 4 736 3 353 1 130 1 213 1 38.60 18.28 3.60
(4V19) (436GI) Glasgow, MT 374 268 71.66% 106 28.34% 0 0 251 0 17 0 14 0 9 0 23 0 60 0 47.34 0.00 0.90
(4V19) (436GK) Glendive, MT 207 201 97.10% 6 2.90% 0 0 195 0 6 0 2 0 0 0 2 0 2 0 3.74 7.00 0.87
(4V19) (436GL) Cut Bank, MT 189 137 72.49% 52 27.51% 0 0 129 0 8 0 21 0 16 0 2 0 13 0 29.25 14.25 0.71
(4V19) (436GM) Lewistown, MT 409 315 77.02% 94 22.98% 0 0 298 0 17 0 35 0 22 0 16 0 21 0 23.97 40.70 0.21
(4V19) (436HC) Havre, MT (Merril Lundman)
336 258 76.79% 78 23.21% 0 0 237 0 21 0 17 0 32 0 22 0 7 0 26.06 4.73 4.30
(4V19) (436MA) IDES Malmstrom AFB 1 1 100.00% 0 0.00% 0 0 1 0 0 0 0 0 0 0 0 0 0 0 0.00
(4V19) (436QA) Hamilton, MT 285 169 59.30% 116 40.70% 0 0 162 0 7 0 15 0 14 0 24 0 63 0 97.60 15.24 0.83
(4V19) (436QB) Plentywood, MT 48 44 91.67% 4 8.33% 0 0 44 0 0 0 4 0 0 0 0 0 0 0 2.71 19.75 0.00
(4V19) (436QC) Helena, MT 941 734 78.00% 207 22.00% 0 0 669 0 65 0 88 0 68 0 26 0 25 0
(4V19) (442) Cheyenne, WY HCS 18,450 16,762 90.85% 1,688 9.15% 9 0 15,516 0 1,246 0 1,197 0 290 0 114 0 87 0 5.39 8.53 7.43
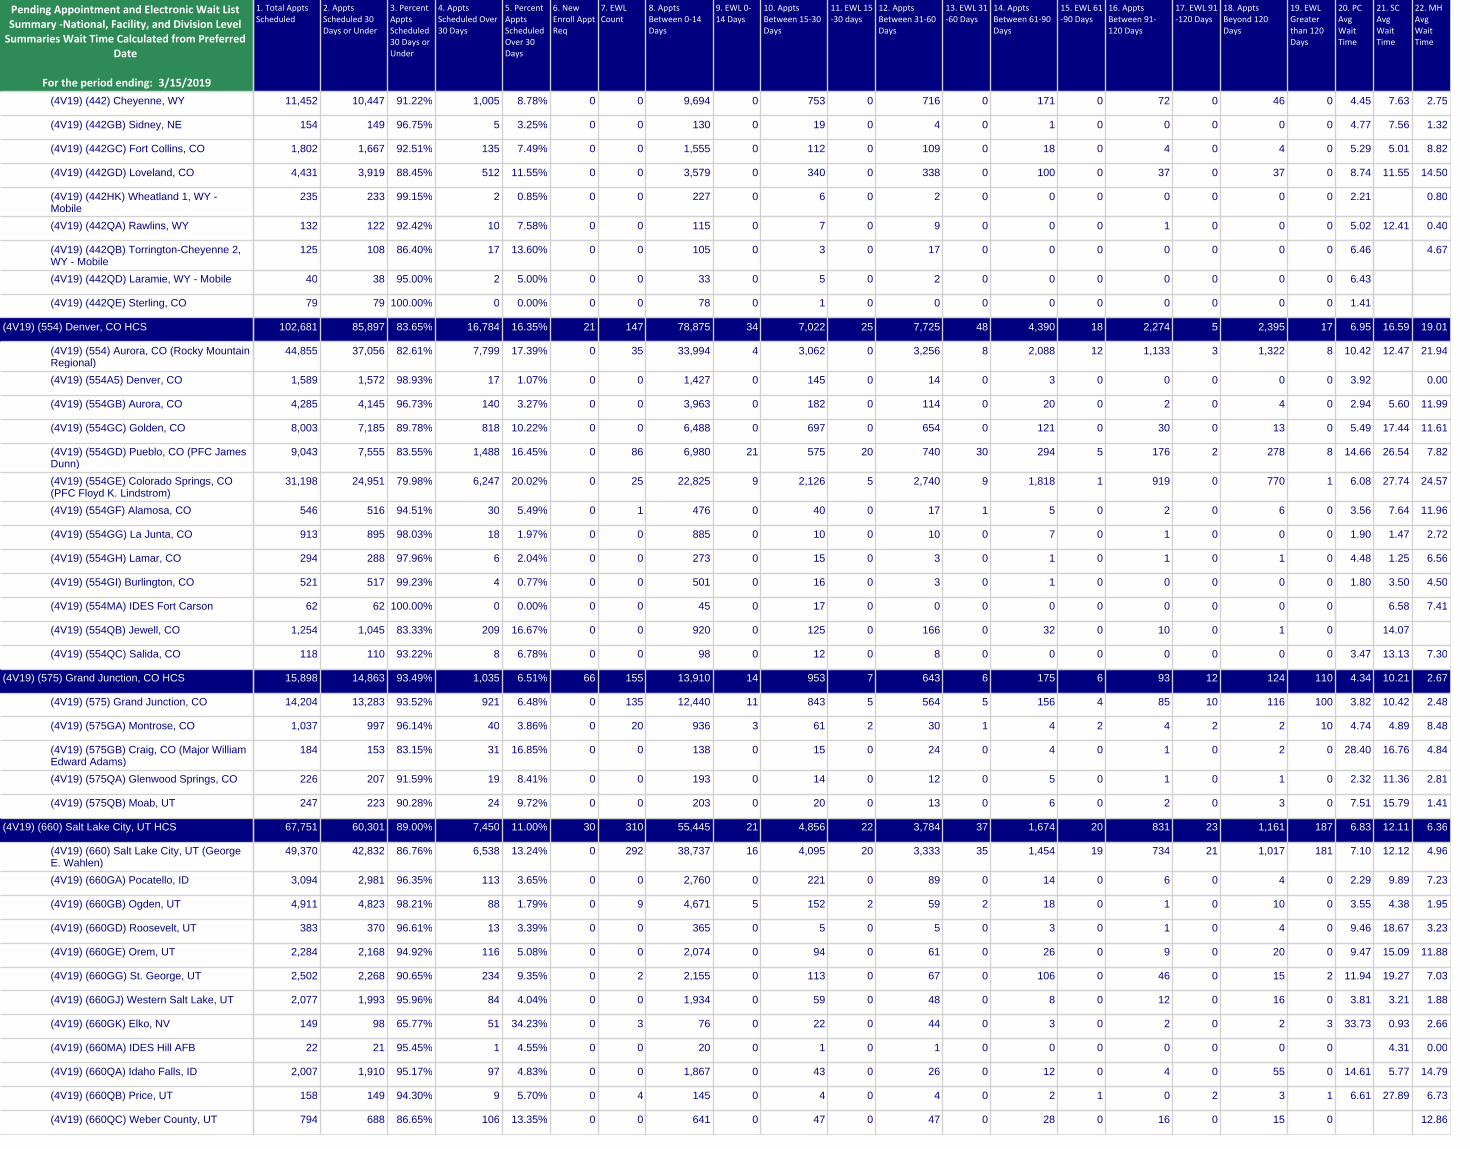
Pending Appointment and Electronic Wait List Summary -National, Facility, and Division Level Summaries Wait Time Calculated from Preferred
Date
For the period ending: 3/15/2019
1. Total Appts Scheduled
2. Appts Scheduled 30 Days or Under
3. Percent Appts Scheduled 30 Days or Under
4. Appts Scheduled Over 30 Days
5. Percent Appts Scheduled Over 30 Days
6. New Enroll Appt Req
7. EWL Count
8. Appts Between 0-14 Days
9. EWL 0-14 Days
10. Appts Between 15-30 Days
11. EWL 15 -30 days
12. Appts Between 31-60 Days
13. EWL 31 -60 Days
14. Appts Between 61-90 Days
15. EWL 61 -90 Days
16. Appts Between 91-120 Days
17. EWL 91 -120 Days
18. Appts Beyond 120 Days
19. EWL Greater than 120 Days
20. PC Avg Wait Time
21. SC Avg Wait Time
22. MH Avg Wait Time
(4V19) (442) Cheyenne, WY 11,452 10,447 91.22% 1,005 8.78% 0 0 9,694 0 753 0 716 0 171 0 72 0 46 0 4.45 7.63 2.75
(4V19) (442GB) Sidney, NE 154 149 96.75% 5 3.25% 0 0 130 0 19 0 4 0 1 0 0 0 0 0 4.77 7.56 1.32
(4V19) (442GC) Fort Collins, CO 1,802 1,667 92.51% 135 7.49% 0 0 1,555 0 112 0 109 0 18 0 4 0 4 0 5.29 5.01 8.82
(4V19) (442GD) Loveland, CO 4,431 3,919 88.45% 512 11.55% 0 0 3,579 0 340 0 338 0 100 0 37 0 37 0 8.74 11.55 14.50
(4V19) (442HK) Wheatland 1, WY -Mobile
235 233 99.15% 2 0.85% 0 0 227 0 6 0 2 0 0 0 0 0 0 0 2.21 0.80
(4V19) (442QA) Rawlins, WY 132 122 92.42% 10 7.58% 0 0 115 0 7 0 9 0 0 0 1 0 0 0 5.02 12.41 0.40
(4V19) (442QB) Torrington-Cheyenne 2, WY - Mobile
125 108 86.40% 17 13.60% 0 0 105 0 3 0 17 0 0 0 0 0 0 0 6.46 4.67
(4V19) (442QD) Laramie, WY - Mobile 40 38 95.00% 2 5.00% 0 0 33 0 5 0 2 0 0 0 0 0 0 0 6.43
(4V19) (442QE) Sterling, CO 79 79 100.00% 0 0.00% 0 0 78 0 1 0 0 0 0 0 0 0 0 0 1.41
(4V19) (554) Denver, CO HCS 102,681 85,897 83.65% 16,784 16.35% 21 147 78,875 34 7,022 25 7,725 48 4,390 18 2,274 5 2,395 17 6.95 16.59 19.01
(4V19) (554) Aurora, CO (Rocky Mountain Regional)
44,855 37,056 82.61% 7,799 17.39% 0 35 33,994 4 3,062 0 3,256 8 2,088 12 1,133 3 1,322 8 10.42 12.47 21.94
(4V19) (554A5) Denver, CO 1,589 1,572 98.93% 17 1.07% 0 0 1,427 0 145 0 14 0 3 0 0 0 0 0 3.92 0.00
(4V19) (554GB) Aurora, CO 4,285 4,145 96.73% 140 3.27% 0 0 3,963 0 182 0 114 0 20 0 2 0 4 0 2.94 5.60 11.99
(4V19) (554GC) Golden, CO 8,003 7,185 89.78% 818 10.22% 0 0 6,488 0 697 0 654 0 121 0 30 0 13 0 5.49 17.44 11.61
(4V19) (554GD) Pueblo, CO (PFC James Dunn)
9,043 7,555 83.55% 1,488 16.45% 0 86 6,980 21 575 20 740 30 294 5 176 2 278 8 14.66 26.54 7.82
(4V19) (554GE) Colorado Springs, CO (PFC Floyd K. Lindstrom)
31,198 24,951 79.98% 6,247 20.02% 0 25 22,825 9 2,126 5 2,740 9 1,818 1 919 0 770 1 6.08 27.74 24.57
(4V19) (554GF) Alamosa, CO 546 516 94.51% 30 5.49% 0 1 476 0 40 0 17 1 5 0 2 0 6 0 3.56 7.64 11.96
(4V19) (554GG) La Junta, CO 913 895 98.03% 18 1.97% 0 0 885 0 10 0 10 0 7 0 1 0 0 0 1.90 1.47 2.72
(4V19) (554GH) Lamar, CO 294 288 97.96% 6 2.04% 0 0 273 0 15 0 3 0 1 0 1 0 1 0 4.48 1.25 6.56
(4V19) (554GI) Burlington, CO 521 517 99.23% 4 0.77% 0 0 501 0 16 0 3 0 1 0 0 0 0 0 1.80 3.50 4.50
(4V19) (554MA) IDES Fort Carson 62 62 100.00% 0 0.00% 0 0 45 0 17 0 0 0 0 0 0 0 0 0 6.58 7.41
(4V19) (554QB) Jewell, CO 1,254 1,045 83.33% 209 16.67% 0 0 920 0 125 0 166 0 32 0 10 0 1 0 14.07
(4V19) (554QC) Salida, CO 118 110 93.22% 8 6.78% 0 0 98 0 12 0 8 0 0 0 0 0 0 0 3.47 13.13 7.30
(4V19) (575) Grand Junction, CO HCS 15,898 14,863 93.49% 1,035 6.51% 66 155 13,910 14 953 7 643 6 175 6 93 12 124 110 4.34 10.21 2.67
(4V19) (575) Grand Junction, CO 14,204 13,283 93.52% 921 6.48% 0 135 12,440 11 843 5 564 5 156 4 85 10 116 100 3.82 10.42 2.48
(4V19) (575GA) Montrose, CO 1,037 997 96.14% 40 3.86% 0 20 936 3 61 2 30 1 4 2 4 2 2 10 4.74 4.89 8.48
(4V19) (575GB) Craig, CO (Major William Edward Adams)
184 153 83.15% 31 16.85% 0 0 138 0 15 0 24 0 4 0 1 0 2 0 28.40 16.76 4.84
(4V19) (575QA) Glenwood Springs, CO 226 207 91.59% 19 8.41% 0 0 193 0 14 0 12 0 5 0 1 0 1 0 2.32 11.36 2.81
(4V19) (575QB) Moab, UT 247 223 90.28% 24 9.72% 0 0 203 0 20 0 13 0 6 0 2 0 3 0 7.51 15.79 1.41
(4V19) (660) Salt Lake City, UT HCS 67,751 60,301 89.00% 7,450 11.00% 30 310 55,445 21 4,856 22 3,784 37 1,674 20 831 23 1,161 187 6.83 12.11 6.36
(4V19) (660) Salt Lake City, UT (George E. Wahlen)
49,370 42,832 86.76% 6,538 13.24% 0 292 38,737 16 4,095 20 3,333 35 1,454 19 734 21 1,017 181 7.10 12.12 4.96
(4V19) (660GA) Pocatello, ID 3,094 2,981 96.35% 113 3.65% 0 0 2,760 0 221 0 89 0 14 0 6 0 4 0 2.29 9.89 7.23
(4V19) (660GB) Ogden, UT 4,911 4,823 98.21% 88 1.79% 0 9 4,671 5 152 2 59 2 18 0 1 0 10 0 3.55 4.38 1.95
(4V19) (660GD) Roosevelt, UT 383 370 96.61% 13 3.39% 0 0 365 0 5 0 5 0 3 0 1 0 4 0 9.46 18.67 3.23
(4V19) (660GE) Orem, UT 2,284 2,168 94.92% 116 5.08% 0 0 2,074 0 94 0 61 0 26 0 9 0 20 0 9.47 15.09 11.88
(4V19) (660GG) St. George, UT 2,502 2,268 90.65% 234 9.35% 0 2 2,155 0 113 0 67 0 106 0 46 0 15 2 11.94 19.27 7.03
(4V19) (660GJ) Western Salt Lake, UT 2,077 1,993 95.96% 84 4.04% 0 0 1,934 0 59 0 48 0 8 0 12 0 16 0 3.81 3.21 1.88
(4V19) (660GK) Elko, NV 149 98 65.77% 51 34.23% 0 3 76 0 22 0 44 0 3 0 2 0 2 3 33.73 0.93 2.66
(4V19) (660MA) IDES Hill AFB 22 21 95.45% 1 4.55% 0 0 20 0 1 0 1 0 0 0 0 0 0 0 4.31 0.00
(4V19) (660QA) Idaho Falls, ID 2,007 1,910 95.17% 97 4.83% 0 0 1,867 0 43 0 26 0 12 0 4 0 55 0 14.61 5.77 14.79
(4V19) (660QB) Price, UT 158 149 94.30% 9 5.70% 0 4 145 0 4 0 4 0 2 1 0 2 3 1 6.61 27.89 6.73
(4V19) (660QC) Weber County, UT 794 688 86.65% 106 13.35% 0 0 641 0 47 0 47 0 28 0 16 0 15 0 12.86
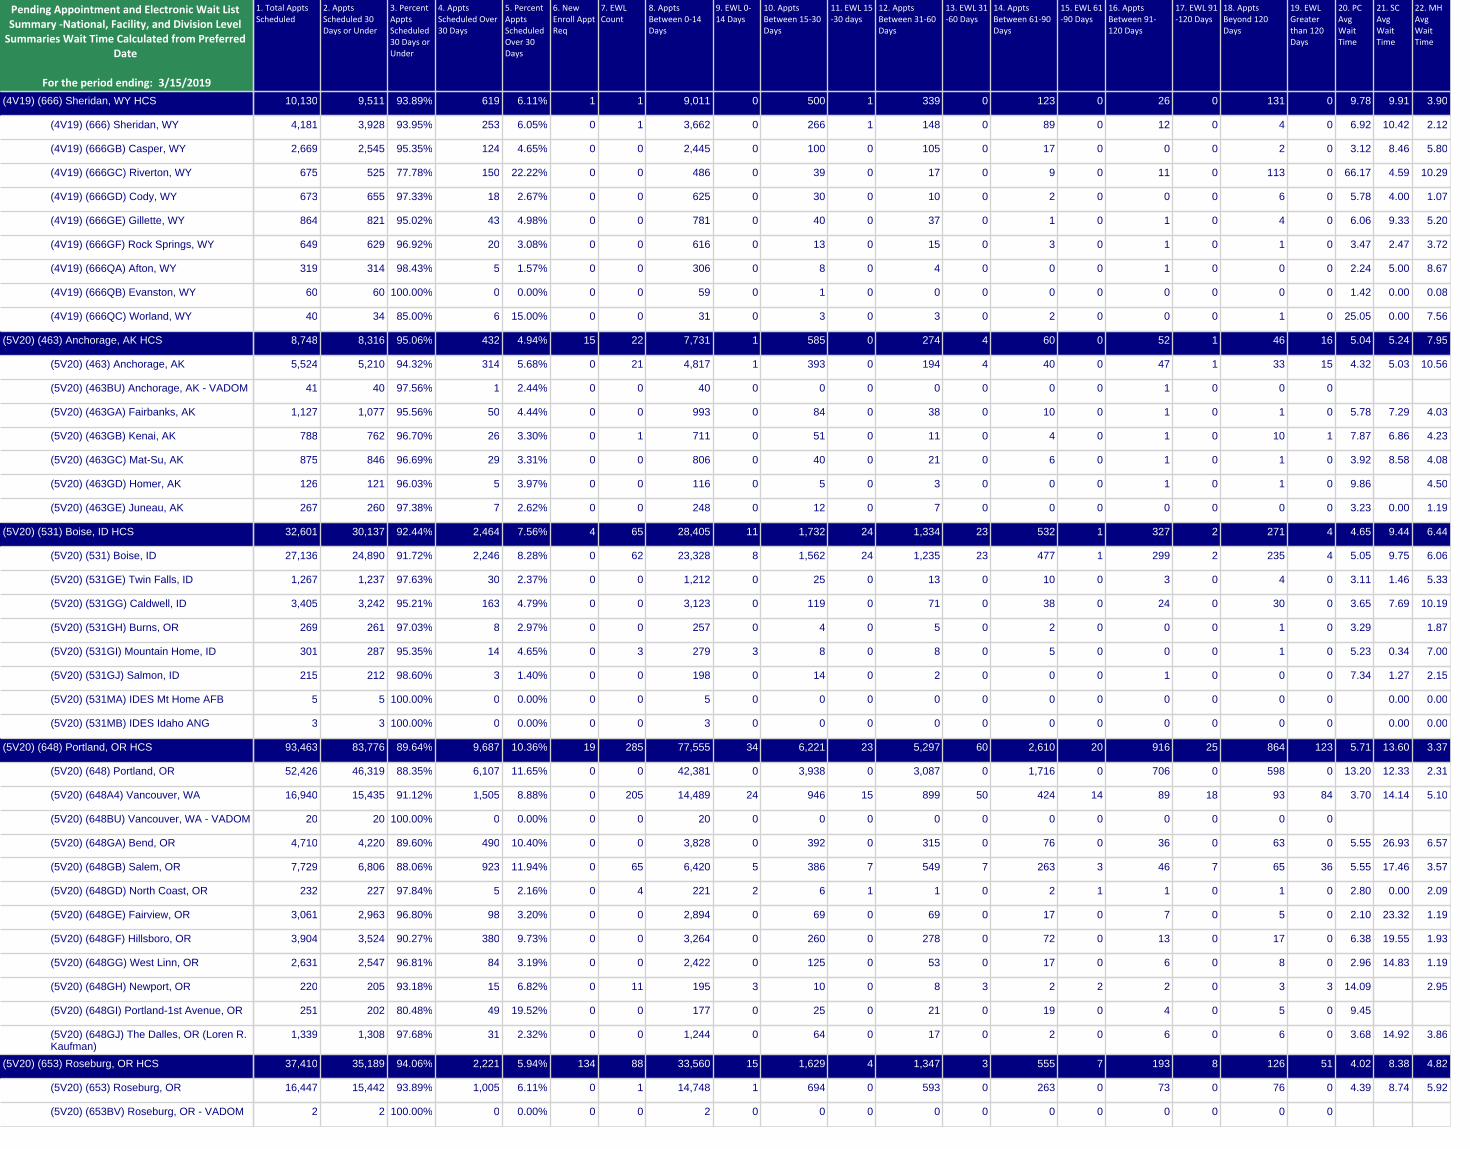
Pending Appointment and Electronic Wait List Summary -National, Facility, and Division Level Summaries Wait Time Calculated from Preferred
Date
For the period ending: 3/15/2019
1. Total Appts Scheduled
2. Appts Scheduled 30 Days or Under
3. Percent Appts Scheduled 30 Days or Under
4. Appts Scheduled Over 30 Days
5. Percent Appts Scheduled Over 30 Days
6. New Enroll Appt Req
7. EWL Count
8. Appts Between 0-14 Days
9. EWL 0-14 Days
10. Appts Between 15-30 Days
11. EWL 15 -30 days
12. Appts Between 31-60 Days
13. EWL 31 -60 Days
14. Appts Between 61-90 Days
15. EWL 61 -90 Days
16. Appts Between 91-120 Days
17. EWL 91 -120 Days
18. Appts Beyond 120 Days
19. EWL Greater than 120 Days
20. PC Avg Wait Time
21. SC Avg Wait Time
22. MH Avg Wait Time
(4V19) (666) Sheridan, WY HCS 10,130 9,511 93.89% 619 6.11% 1 1 9,011 0 500 1 339 0 123 0 26 0 131 0 9.78 9.91 3.90
(4V19) (666) Sheridan, WY 4,181 3,928 93.95% 253 6.05% 0 1 3,662 0 266 1 148 0 89 0 12 0 4 0 6.92 10.42 2.12
(4V19) (666GB) Casper, WY 2,669 2,545 95.35% 124 4.65% 0 0 2,445 0 100 0 105 0 17 0 0 0 2 0 3.12 8.46 5.80
(4V19) (666GC) Riverton, WY 675 525 77.78% 150 22.22% 0 0 486 0 39 0 17 0 9 0 11 0 113 0 66.17 4.59 10.29
(4V19) (666GD) Cody, WY 673 655 97.33% 18 2.67% 0 0 625 0 30 0 10 0 2 0 0 0 6 0 5.78 4.00 1.07
(4V19) (666GE) Gillette, WY 864 821 95.02% 43 4.98% 0 0 781 0 40 0 37 0 1 0 1 0 4 0 6.06 9.33 5.20
(4V19) (666GF) Rock Springs, WY 649 629 96.92% 20 3.08% 0 0 616 0 13 0 15 0 3 0 1 0 1 0 3.47 2.47 3.72
(4V19) (666QA) Afton, WY 319 314 98.43% 5 1.57% 0 0 306 0 8 0 4 0 0 0 1 0 0 0 2.24 5.00 8.67
(4V19) (666QB) Evanston, WY 60 60 100.00% 0 0.00% 0 0 59 0 1 0 0 0 0 0 0 0 0 0 1.42 0.00 0.08
(4V19) (666QC) Worland, WY 40 34 85.00% 6 15.00% 0 0 31 0 3 0 3 0 2 0 0 0 1 0 25.05 0.00 7.56
(5V20) (463) Anchorage, AK HCS 8,748 8,316 95.06% 432 4.94% 15 22 7,731 1 585 0 274 4 60 0 52 1 46 16 5.04 5.24 7.95
(5V20) (463) Anchorage, AK 5,524 5,210 94.32% 314 5.68% 0 21 4,817 1 393 0 194 4 40 0 47 1 33 15 4.32 5.03 10.56
(5V20) (463BU) Anchorage, AK - VADOM 41 40 97.56% 1 2.44% 0 0 40 0 0 0 0 0 0 0 1 0 0 0
(5V20) (463GA) Fairbanks, AK 1,127 1,077 95.56% 50 4.44% 0 0 993 0 84 0 38 0 10 0 1 0 1 0 5.78 7.29 4.03
(5V20) (463GB) Kenai, AK 788 762 96.70% 26 3.30% 0 1 711 0 51 0 11 0 4 0 1 0 10 1 7.87 6.86 4.23
(5V20) (463GC) Mat-Su, AK 875 846 96.69% 29 3.31% 0 0 806 0 40 0 21 0 6 0 1 0 1 0 3.92 8.58 4.08
(5V20) (463GD) Homer, AK 126 121 96.03% 5 3.97% 0 0 116 0 5 0 3 0 0 0 1 0 1 0 9.86 4.50
(5V20) (463GE) Juneau, AK 267 260 97.38% 7 2.62% 0 0 248 0 12 0 7 0 0 0 0 0 0 0 3.23 0.00 1.19
(5V20) (531) Boise, ID HCS 32,601 30,137 92.44% 2,464 7.56% 4 65 28,405 11 1,732 24 1,334 23 532 1 327 2 271 4 4.65 9.44 6.44
(5V20) (531) Boise, ID 27,136 24,890 91.72% 2,246 8.28% 0 62 23,328 8 1,562 24 1,235 23 477 1 299 2 235 4 5.05 9.75 6.06
(5V20) (531GE) Twin Falls, ID 1,267 1,237 97.63% 30 2.37% 0 0 1,212 0 25 0 13 0 10 0 3 0 4 0 3.11 1.46 5.33
(5V20) (531GG) Caldwell, ID 3,405 3,242 95.21% 163 4.79% 0 0 3,123 0 119 0 71 0 38 0 24 0 30 0 3.65 7.69 10.19
(5V20) (531GH) Burns, OR 269 261 97.03% 8 2.97% 0 0 257 0 4 0 5 0 2 0 0 0 1 0 3.29 1.87
(5V20) (531GI) Mountain Home, ID 301 287 95.35% 14 4.65% 0 3 279 3 8 0 8 0 5 0 0 0 1 0 5.23 0.34 7.00
(5V20) (531GJ) Salmon, ID 215 212 98.60% 3 1.40% 0 0 198 0 14 0 2 0 0 0 1 0 0 0 7.34 1.27 2.15
(5V20) (531MA) IDES Mt Home AFB 5 5 100.00% 0 0.00% 0 0 5 0 0 0 0 0 0 0 0 0 0 0 0.00 0.00
(5V20) (531MB) IDES Idaho ANG 3 3 100.00% 0 0.00% 0 0 3 0 0 0 0 0 0 0 0 0 0 0 0.00 0.00
(5V20) (648) Portland, OR HCS 93,463 83,776 89.64% 9,687 10.36% 19 285 77,555 34 6,221 23 5,297 60 2,610 20 916 25 864 123 5.71 13.60 3.37
(5V20) (648) Portland, OR 52,426 46,319 88.35% 6,107 11.65% 0 0 42,381 0 3,938 0 3,087 0 1,716 0 706 0 598 0 13.20 12.33 2.31
(5V20) (648A4) Vancouver, WA 16,940 15,435 91.12% 1,505 8.88% 0 205 14,489 24 946 15 899 50 424 14 89 18 93 84 3.70 14.14 5.10
(5V20) (648BU) Vancouver, WA - VADOM 20 20 100.00% 0 0.00% 0 0 20 0 0 0 0 0 0 0 0 0 0 0
(5V20) (648GA) Bend, OR 4,710 4,220 89.60% 490 10.40% 0 0 3,828 0 392 0 315 0 76 0 36 0 63 0 5.55 26.93 6.57
(5V20) (648GB) Salem, OR 7,729 6,806 88.06% 923 11.94% 0 65 6,420 5 386 7 549 7 263 3 46 7 65 36 5.55 17.46 3.57
(5V20) (648GD) North Coast, OR 232 227 97.84% 5 2.16% 0 4 221 2 6 1 1 0 2 1 1 0 1 0 2.80 0.00 2.09
(5V20) (648GE) Fairview, OR 3,061 2,963 96.80% 98 3.20% 0 0 2,894 0 69 0 69 0 17 0 7 0 5 0 2.10 23.32 1.19
(5V20) (648GF) Hillsboro, OR 3,904 3,524 90.27% 380 9.73% 0 0 3,264 0 260 0 278 0 72 0 13 0 17 0 6.38 19.55 1.93
(5V20) (648GG) West Linn, OR 2,631 2,547 96.81% 84 3.19% 0 0 2,422 0 125 0 53 0 17 0 6 0 8 0 2.96 14.83 1.19
(5V20) (648GH) Newport, OR 220 205 93.18% 15 6.82% 0 11 195 3 10 0 8 3 2 2 2 0 3 3 14.09 2.95
(5V20) (648GI) Portland-1st Avenue, OR 251 202 80.48% 49 19.52% 0 0 177 0 25 0 21 0 19 0 4 0 5 0 9.45
(5V20) (648GJ) The Dalles, OR (Loren R. Kaufman)
1,339 1,308 97.68% 31 2.32% 0 0 1,244 0 64 0 17 0 2 0 6 0 6 0 3.68 14.92 3.86
(5V20) (653) Roseburg, OR HCS 37,410 35,189 94.06% 2,221 5.94% 134 88 33,560 15 1,629 4 1,347 3 555 7 193 8 126 51 4.02 8.38 4.82
(5V20) (653) Roseburg, OR 16,447 15,442 93.89% 1,005 6.11% 0 1 14,748 1 694 0 593 0 263 0 73 0 76 0 4.39 8.74 5.92
(5V20) (653BV) Roseburg, OR - VADOM 2 2 100.00% 0 0.00% 0 0 2 0 0 0 0 0 0 0 0 0 0 0
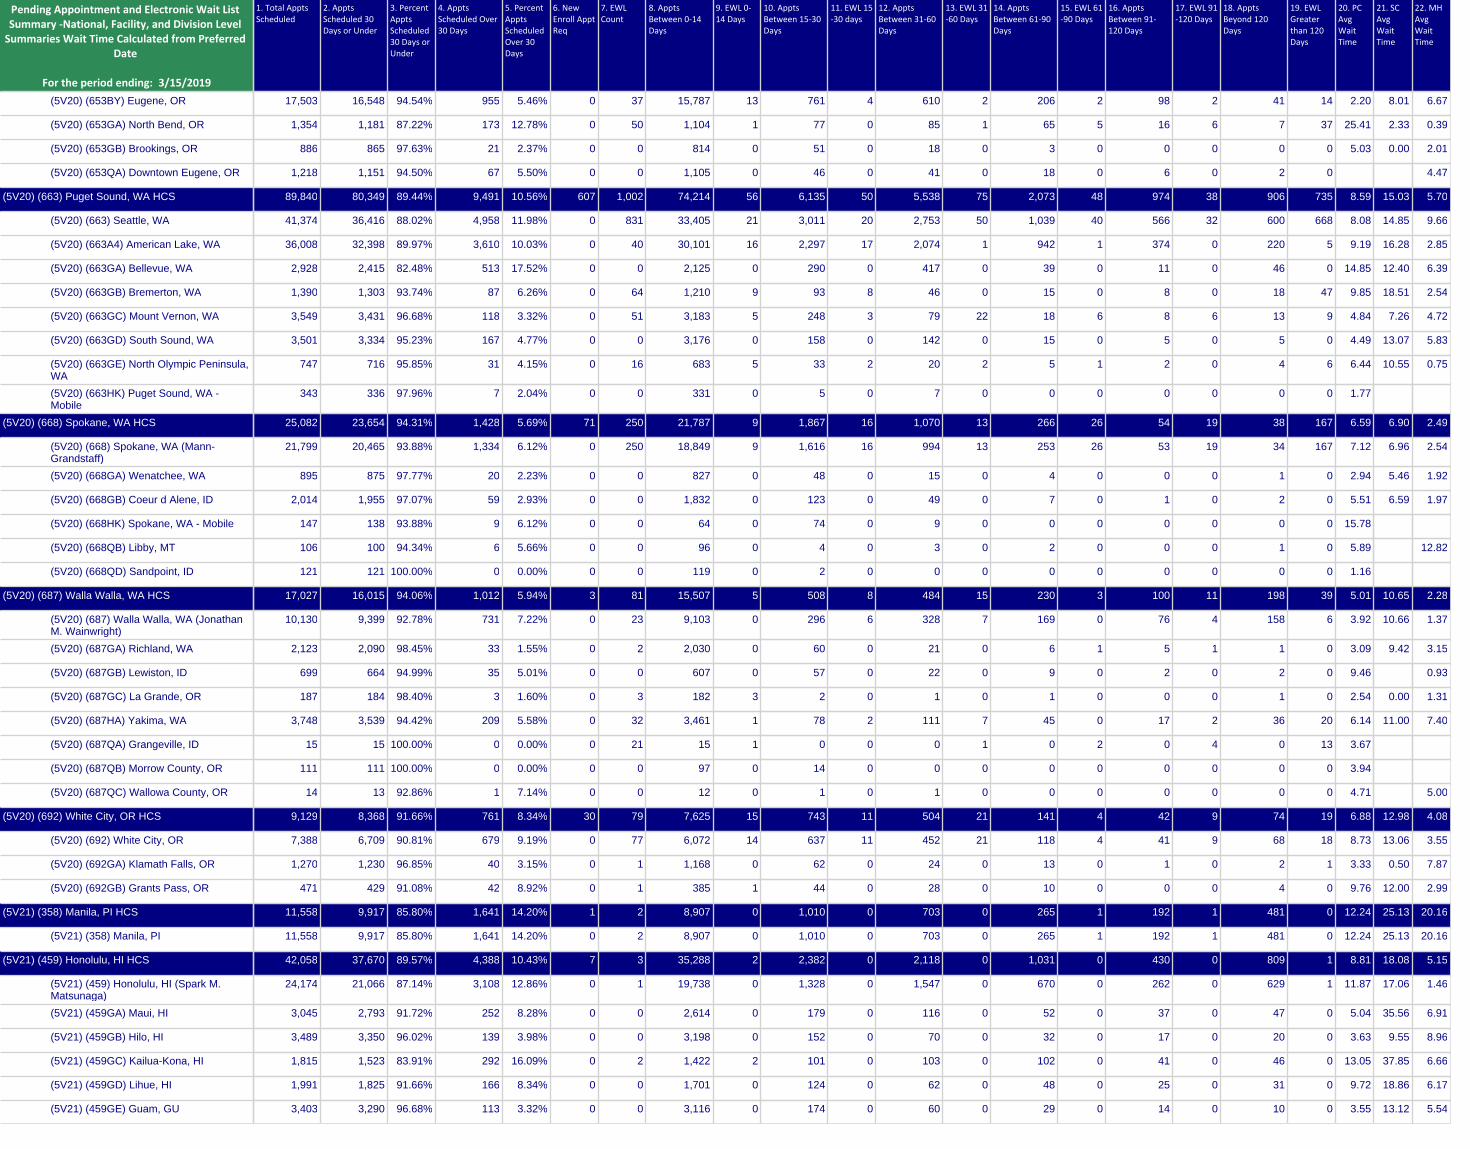
Pending Appointment and Electronic Wait List Summary -National, Facility, and Division Level Summaries Wait Time Calculated from Preferred
Date
For the period ending: 3/15/2019
1. Total Appts Scheduled
2. Appts Scheduled 30 Days or Under
3. Percent Appts Scheduled 30 Days or Under
4. Appts Scheduled Over 30 Days
5. Percent Appts Scheduled Over 30 Days
6. New Enroll Appt Req
7. EWL Count
8. Appts Between 0-14 Days
9. EWL 0-14 Days
10. Appts Between 15-30 Days
11. EWL 15 -30 days
12. Appts Between 31-60 Days
13. EWL 31 -60 Days
14. Appts Between 61-90 Days
15. EWL 61 -90 Days
16. Appts Between 91-120 Days
17. EWL 91 -120 Days
18. Appts Beyond 120 Days
19. EWL Greater than 120 Days
20. PC Avg Wait Time
21. SC Avg Wait Time
22. MH Avg Wait Time
(5V20) (653BY) Eugene, OR 17,503 16,548 94.54% 955 5.46% 0 37 15,787 13 761 4 610 2 206 2 98 2 41 14 2.20 8.01 6.67
(5V20) (653GA) North Bend, OR 1,354 1,181 87.22% 173 12.78% 0 50 1,104 1 77 0 85 1 65 5 16 6 7 37 25.41 2.33 0.39
(5V20) (653GB) Brookings, OR 886 865 97.63% 21 2.37% 0 0 814 0 51 0 18 0 3 0 0 0 0 0 5.03 0.00 2.01
(5V20) (653QA) Downtown Eugene, OR 1,218 1,151 94.50% 67 5.50% 0 0 1,105 0 46 0 41 0 18 0 6 0 2 0 4.47
(5V20) (663) Puget Sound, WA HCS 89,840 80,349 89.44% 9,491 10.56% 607 1,002 74,214 56 6,135 50 5,538 75 2,073 48 974 38 906 735 8.59 15.03 5.70
(5V20) (663) Seattle, WA 41,374 36,416 88.02% 4,958 11.98% 0 831 33,405 21 3,011 20 2,753 50 1,039 40 566 32 600 668 8.08 14.85 9.66
(5V20) (663A4) American Lake, WA 36,008 32,398 89.97% 3,610 10.03% 0 40 30,101 16 2,297 17 2,074 1 942 1 374 0 220 5 9.19 16.28 2.85
(5V20) (663GA) Bellevue, WA 2,928 2,415 82.48% 513 17.52% 0 0 2,125 0 290 0 417 0 39 0 11 0 46 0 14.85 12.40 6.39
(5V20) (663GB) Bremerton, WA 1,390 1,303 93.74% 87 6.26% 0 64 1,210 9 93 8 46 0 15 0 8 0 18 47 9.85 18.51 2.54
(5V20) (663GC) Mount Vernon, WA 3,549 3,431 96.68% 118 3.32% 0 51 3,183 5 248 3 79 22 18 6 8 6 13 9 4.84 7.26 4.72
(5V20) (663GD) South Sound, WA 3,501 3,334 95.23% 167 4.77% 0 0 3,176 0 158 0 142 0 15 0 5 0 5 0 4.49 13.07 5.83
(5V20) (663GE) North Olympic Peninsula, WA
747 716 95.85% 31 4.15% 0 16 683 5 33 2 20 2 5 1 2 0 4 6 6.44 10.55 0.75
(5V20) (663HK) Puget Sound, WA -Mobile
343 336 97.96% 7 2.04% 0 0 331 0 5 0 7 0 0 0 0 0 0 0 1.77
(5V20) (668) Spokane, WA HCS 25,082 23,654 94.31% 1,428 5.69% 71 250 21,787 9 1,867 16 1,070 13 266 26 54 19 38 167 6.59 6.90 2.49
(5V20) (668) Spokane, WA (Mann-Grandstaff)
21,799 20,465 93.88% 1,334 6.12% 0 250 18,849 9 1,616 16 994 13 253 26 53 19 34 167 7.12 6.96 2.54
(5V20) (668GA) Wenatchee, WA 895 875 97.77% 20 2.23% 0 0 827 0 48 0 15 0 4 0 0 0 1 0 2.94 5.46 1.92
(5V20) (668GB) Coeur d Alene, ID 2,014 1,955 97.07% 59 2.93% 0 0 1,832 0 123 0 49 0 7 0 1 0 2 0 5.51 6.59 1.97
(5V20) (668HK) Spokane, WA - Mobile 147 138 93.88% 9 6.12% 0 0 64 0 74 0 9 0 0 0 0 0 0 0 15.78
(5V20) (668QB) Libby, MT 106 100 94.34% 6 5.66% 0 0 96 0 4 0 3 0 2 0 0 0 1 0 5.89 12.82
(5V20) (668QD) Sandpoint, ID 121 121 100.00% 0 0.00% 0 0 119 0 2 0 0 0 0 0 0 0 0 0 1.16
(5V20) (687) Walla Walla, WA HCS 17,027 16,015 94.06% 1,012 5.94% 3 81 15,507 5 508 8 484 15 230 3 100 11 198 39 5.01 10.65 2.28
(5V20) (687) Walla Walla, WA (Jonathan M. Wainwright)
10,130 9,399 92.78% 731 7.22% 0 23 9,103 0 296 6 328 7 169 0 76 4 158 6 3.92 10.66 1.37
(5V20) (687GA) Richland, WA 2,123 2,090 98.45% 33 1.55% 0 2 2,030 0 60 0 21 0 6 1 5 1 1 0 3.09 9.42 3.15
(5V20) (687GB) Lewiston, ID 699 664 94.99% 35 5.01% 0 0 607 0 57 0 22 0 9 0 2 0 2 0 9.46 0.93
(5V20) (687GC) La Grande, OR 187 184 98.40% 3 1.60% 0 3 182 3 2 0 1 0 1 0 0 0 1 0 2.54 0.00 1.31
(5V20) (687HA) Yakima, WA 3,748 3,539 94.42% 209 5.58% 0 32 3,461 1 78 2 111 7 45 0 17 2 36 20 6.14 11.00 7.40
(5V20) (687QA) Grangeville, ID 15 15 100.00% 0 0.00% 0 21 15 1 0 0 0 1 0 2 0 4 0 13 3.67
(5V20) (687QB) Morrow County, OR 111 111 100.00% 0 0.00% 0 0 97 0 14 0 0 0 0 0 0 0 0 0 3.94
(5V20) (687QC) Wallowa County, OR 14 13 92.86% 1 7.14% 0 0 12 0 1 0 1 0 0 0 0 0 0 0 4.71 5.00
(5V20) (692) White City, OR HCS 9,129 8,368 91.66% 761 8.34% 30 79 7,625 15 743 11 504 21 141 4 42 9 74 19 6.88 12.98 4.08
(5V20) (692) White City, OR 7,388 6,709 90.81% 679 9.19% 0 77 6,072 14 637 11 452 21 118 4 41 9 68 18 8.73 13.06 3.55
(5V20) (692GA) Klamath Falls, OR 1,270 1,230 96.85% 40 3.15% 0 1 1,168 0 62 0 24 0 13 0 1 0 2 1 3.33 0.50 7.87
(5V20) (692GB) Grants Pass, OR 471 429 91.08% 42 8.92% 0 1 385 1 44 0 28 0 10 0 0 0 4 0 9.76 12.00 2.99
(5V21) (358) Manila, PI HCS 11,558 9,917 85.80% 1,641 14.20% 1 2 8,907 0 1,010 0 703 0 265 1 192 1 481 0 12.24 25.13 20.16
(5V21) (358) Manila, PI 11,558 9,917 85.80% 1,641 14.20% 0 2 8,907 0 1,010 0 703 0 265 1 192 1 481 0 12.24 25.13 20.16
(5V21) (459) Honolulu, HI HCS 42,058 37,670 89.57% 4,388 10.43% 7 3 35,288 2 2,382 0 2,118 0 1,031 0 430 0 809 1 8.81 18.08 5.15
(5V21) (459) Honolulu, HI (Spark M. Matsunaga)
24,174 21,066 87.14% 3,108 12.86% 0 1 19,738 0 1,328 0 1,547 0 670 0 262 0 629 1 11.87 17.06 1.46
(5V21) (459GA) Maui, HI 3,045 2,793 91.72% 252 8.28% 0 0 2,614 0 179 0 116 0 52 0 37 0 47 0 5.04 35.56 6.91
(5V21) (459GB) Hilo, HI 3,489 3,350 96.02% 139 3.98% 0 0 3,198 0 152 0 70 0 32 0 17 0 20 0 3.63 9.55 8.96
(5V21) (459GC) Kailua-Kona, HI 1,815 1,523 83.91% 292 16.09% 0 2 1,422 2 101 0 103 0 102 0 41 0 46 0 13.05 37.85 6.66
(5V21) (459GD) Lihue, HI 1,991 1,825 91.66% 166 8.34% 0 0 1,701 0 124 0 62 0 48 0 25 0 31 0 9.72 18.86 6.17
(5V21) (459GE) Guam, GU 3,403 3,290 96.68% 113 3.32% 0 0 3,116 0 174 0 60 0 29 0 14 0 10 0 3.55 13.12 5.54

Pending Appointment and Electronic Wait List Summary -National, Facility, and Division Level Summaries Wait Time Calculated from Preferred
Date
For the period ending: 3/15/2019
1. Total Appts Scheduled
2. Appts Scheduled 30 Days or Under
3. Percent Appts Scheduled 30 Days or Under
4. Appts Scheduled Over 30 Days
5. Percent Appts Scheduled Over 30 Days
6. New Enroll Appt Req
7. EWL Count
8. Appts Between 0-14 Days
9. EWL 0-14 Days
10. Appts Between 15-30 Days
11. EWL 15 -30 days
12. Appts Between 31-60 Days
13. EWL 31 -60 Days
14. Appts Between 61-90 Days
15. EWL 61 -90 Days
16. Appts Between 91-120 Days
17. EWL 91 -120 Days
18. Appts Beyond 120 Days
19. EWL Greater than 120 Days
20. PC Avg Wait Time
21. SC Avg Wait Time
22. MH Avg Wait Time
(5V21) (459GF) American Samoa, AS (Faleomavaega Eni Faauaa Hunkin)
989 844 85.34% 145 14.66% 0 0 773 0 71 0 59 0 51 0 22 0 13 0 5.01 29.32 1.82
(5V21) (459GG) Leeward Oahu, HI 3,006 2,837 94.38% 169 5.62% 0 0 2,591 0 246 0 98 0 46 0 12 0 13 0 6.84 100.94 7.21
(5V21) (459GH) Saipan, MP 69 66 95.65% 3 4.35% 0 0 61 0 5 0 2 0 1 0 0 0 0 0 0.00 2.95 5.31
(5V21) (459QB) Molokai, HI 77 76 98.70% 1 1.30% 0 0 74 0 2 0 1 0 0 0 0 0 0 0 1.39 4.63
(5V21) (570) Fresno, CA HCS 40,078 37,514 93.60% 2,564 6.40% 6 6 35,019 2 2,495 1 1,205 0 703 3 393 0 263 0 3.74 8.51 7.17
(5V21) (570) Fresno, CA 35,943 33,539 93.31% 2,404 6.69% 0 6 31,219 2 2,320 1 1,119 0 645 3 386 0 254 0 4.46 8.48 7.91
(5V21) (570GA) Merced, CA 1,846 1,744 94.47% 102 5.53% 0 0 1,695 0 49 0 36 0 54 0 5 0 7 0 1.77 11.06 5.69
(5V21) (570GB) Tulare, CA 1,746 1,728 98.97% 18 1.03% 0 0 1,643 0 85 0 15 0 2 0 1 0 0 0 2.42 4.24 1.91
(5V21) (570GC) Oakhurst, CA 543 503 92.63% 40 7.37% 0 0 462 0 41 0 35 0 2 0 1 0 2 0 7.06 8.05 3.32
(5V21) (612A4) N. California HCS 115,286 106,216 92.13% 9,070 7.87% 24 46 100,768 7 5,448 4 5,372 2 2,044 1 864 0 790 32 4.14 9.23 3.00
(5V21) (612A4) Sacramento, CA 39,615 35,332 89.19% 4,283 10.81% 0 31 33,183 7 2,149 3 2,357 1 1,103 1 462 0 361 19 8.00 10.43 6.05
(5V21) (612B4) Redding, CA 9,030 8,417 93.21% 613 6.79% 0 6 8,084 0 333 0 281 1 185 0 86 0 61 5 4.20 12.02 3.99
(5V21) (612BY) Oakland, CA 5,815 5,430 93.38% 385 6.62% 0 0 5,133 0 297 0 300 0 47 0 21 0 17 0 2.56 8.97 0.32
(5V21) (612GD) Fairfield-Travis Air Force Base, CA
4,859 4,678 96.27% 181 3.73% 0 0 4,538 0 140 0 68 0 55 0 43 0 15 0 1.27 18.42 0.67
(5V21) (612GE) Mare Island-Vallejo, CA 6,289 6,067 96.47% 222 3.53% 0 0 5,940 0 127 0 119 0 64 0 17 0 22 0 1.15 4.58 0.70
(5V21) (612GF) Martinez, CA 17,166 15,433 89.90% 1,733 10.10% 0 5 14,312 0 1,121 0 1,245 0 277 0 127 0 84 5 2.44 11.51 1.17
(5V21) (612GG) Chico, CA 4,594 4,418 96.17% 176 3.83% 0 1 4,134 0 284 1 83 0 46 0 20 0 27 0 5.56 4.04
(5V21) (612GH) McClellan Park, CA 16,782 16,054 95.66% 728 4.34% 0 0 15,450 0 604 0 571 0 99 0 29 0 29 0 2.12 4.80 1.38
(5V21) (612GI) Yuba City, CA 2,373 2,269 95.62% 104 4.38% 0 0 2,195 0 74 0 47 0 29 0 13 0 15 0 5.52 8.80 1.05
(5V21) (612GJ) Yreka, CA 466 441 94.64% 25 5.36% 0 0 381 0 60 0 17 0 3 0 3 0 2 0 7.18 3.89 2.98
(5V21) (612MA) IDES McClellan OPC 5 5 100.00% 0 0.00% 0 0 5 0 0 0 0 0 0 0 0 0 0 0 0.00
(5V21) (612QA) Cohasset, CA 2,675 2,539 94.92% 136 5.08% 0 2 2,470 0 69 0 72 0 17 0 18 0 29 2 6.16 2.83
(5V21) (612QB) Twenty First Street, CA 1,868 1,852 99.14% 16 0.86% 0 0 1,843 0 9 0 13 0 3 0 0 0 0 0 0.80
(5V21) (612QC) Cypress Avenue, CA 3,673 3,205 87.26% 468 12.74% 0 0 3,024 0 181 0 199 0 116 0 25 0 128 0 11.35
(5V21) (612QD) Howe Road, CA 76 76 100.00% 0 0.00% 0 0 76 0 0 0 0 0 0 0 0 0 0 0
(5V21) (640) Palo Alto, CA HCS 50,025 43,472 86.90% 6,553 13.10% 24 72 39,198 10 4,274 14 3,867 20 1,457 8 604 4 625 16 16.54 13.05 7.71
(5V21) (640) Palo Alto, CA 21,571 19,402 89.94% 2,169 10.06% 0 67 17,815 10 1,587 13 1,280 18 493 8 171 4 225 14 10.62 9.83 5.93
(5V21) (640A0) Menlo Park, CA 1,863 1,698 91.14% 165 8.86% 0 0 1,554 0 144 0 73 0 18 0 32 0 42 0 8.93 27.77 5.30
(5V21) (640A4) Livermore, CA 7,748 6,218 80.25% 1,530 19.75% 0 0 5,461 0 757 0 819 0 306 0 202 0 203 0 15.78 23.06 9.08
(5V21) (640BY) San Jose, CA 4,290 3,474 80.98% 816 19.02% 0 0 3,057 0 417 0 522 0 188 0 65 0 41 0 23.92 10.61 10.67
(5V21) (640GA) Capitola, CA 218 187 85.78% 31 14.22% 0 0 160 0 27 0 21 0 2 0 3 0 5 0 28.03 0.47
(5V21) (640GB) Sonora, CA 717 653 91.07% 64 8.93% 0 1 563 0 90 0 54 0 6 0 3 0 1 1 12.98 4.25 7.37
(5V21) (640GC) Fremont, CA 727 706 97.11% 21 2.89% 0 1 643 0 63 0 15 1 4 0 2 0 0 0 3.96 13.29 4.92
(5V21) (640HA) Stockton, CA 3,035 2,540 83.69% 495 16.31% 0 1 2,201 0 339 0 360 1 77 0 28 0 30 0 20.34 8.25 12.15
(5V21) (640HB) Modesto, CA 3,368 2,793 82.93% 575 17.07% 0 1 2,521 0 272 0 260 0 231 0 54 0 30 1 23.29 9.33 6.90
(5V21) (640HC) Monterey, CA (Major General William H. Gourley)
6,488 5,801 89.41% 687 10.59% 0 1 5,223 0 578 1 463 0 132 0 44 0 48 0 9.69 13.38 3.58
(5V21) (654) Reno, NV HCS 40,803 37,158 91.07% 3,645 8.93% 1 111 34,604 48 2,554 8 2,213 37 844 7 301 2 287 9 7.51 10.59 7.09
(5V21) (654) Reno, NV (Ioannis A. Lougaris)
23,862 21,551 90.32% 2,311 9.68% 0 111 20,050 48 1,501 8 1,298 37 611 7 209 2 193 9 9.13 10.90 8.84
(5V21) (654GA) Sierra Foothills, CA 2,165 2,114 97.64% 51 2.36% 0 0 2,042 0 72 0 37 0 8 0 2 0 4 0 3.77 11.42 1.82
(5V21) (654GB) Carson Valley, NV 2,039 1,963 96.27% 76 3.73% 0 0 1,881 0 82 0 52 0 8 0 8 0 8 0 4.18 14.19 17.73
(5V21) (654GC) Lahontan Valley, NV 1,309 1,234 94.27% 75 5.73% 0 0 1,146 0 88 0 48 0 13 0 7 0 7 0 6.93 5.75 11.13
(5V21) (654GD) Diamond View, CA 379 364 96.04% 15 3.96% 0 0 344 0 20 0 10 0 2 0 0 0 3 0 6.77 13.92 3.29
(5V21) (654GE) Reno East, NV 4,513 4,149 91.93% 364 8.07% 0 0 3,922 0 227 0 220 0 66 0 46 0 32 0 9.20 4.80 1.62
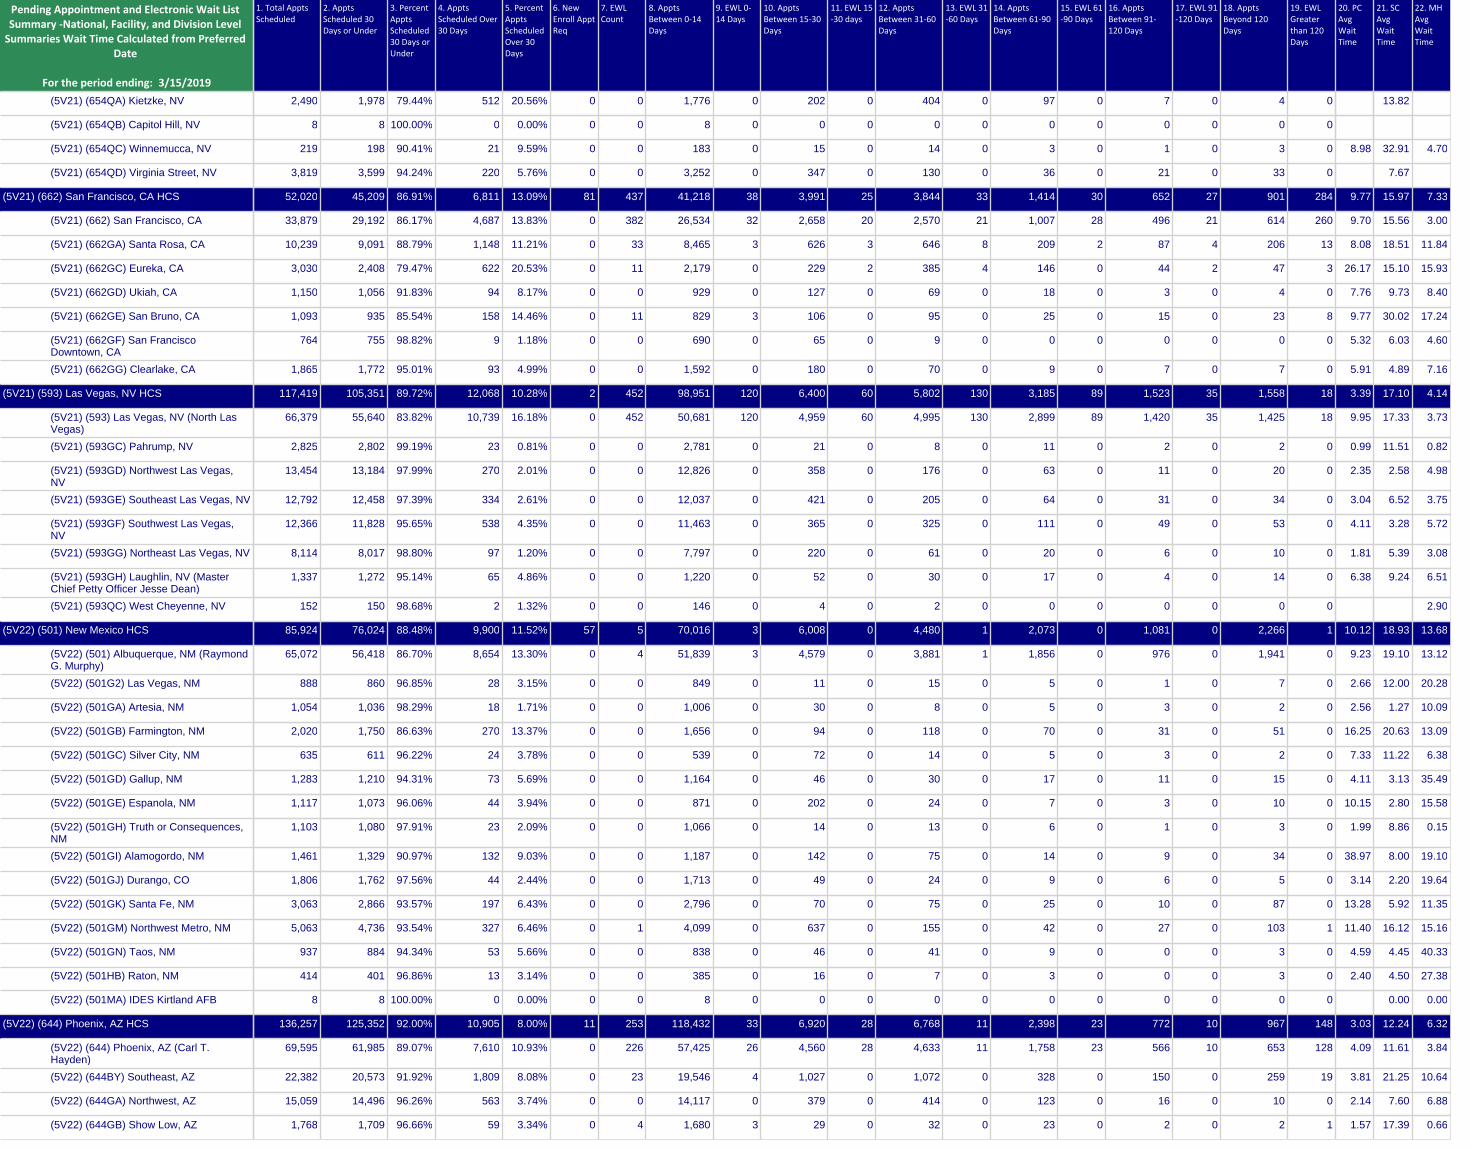
Pending Appointment and Electronic Wait List Summary -National, Facility, and Division Level Summaries Wait Time Calculated from Preferred
Date
For the period ending: 3/15/2019
1. Total Appts Scheduled
2. Appts Scheduled 30 Days or Under
3. Percent Appts Scheduled 30 Days or Under
4. Appts Scheduled Over 30 Days
5. Percent Appts Scheduled Over 30 Days
6. New Enroll Appt Req
7. EWL Count
8. Appts Between 0-14 Days
9. EWL 0-14 Days
10. Appts Between 15-30 Days
11. EWL 15 -30 days
12. Appts Between 31-60 Days
13. EWL 31 -60 Days
14. Appts Between 61-90 Days
15. EWL 61 -90 Days
16. Appts Between 91-120 Days
17. EWL 91 -120 Days
18. Appts Beyond 120 Days
19. EWL Greater than 120 Days
20. PC Avg Wait Time
21. SC Avg Wait Time
22. MH Avg Wait Time
(5V21) (654QA) Kietzke, NV 2,490 1,978 79.44% 512 20.56% 0 0 1,776 0 202 0 404 0 97 0 7 0 4 0 13.82
(5V21) (654QB) Capitol Hill, NV 8 8 100.00% 0 0.00% 0 0 8 0 0 0 0 0 0 0 0 0 0 0
(5V21) (654QC) Winnemucca, NV 219 198 90.41% 21 9.59% 0 0 183 0 15 0 14 0 3 0 1 0 3 0 8.98 32.91 4.70
(5V21) (654QD) Virginia Street, NV 3,819 3,599 94.24% 220 5.76% 0 0 3,252 0 347 0 130 0 36 0 21 0 33 0 7.67
(5V21) (662) San Francisco, CA HCS 52,020 45,209 86.91% 6,811 13.09% 81 437 41,218 38 3,991 25 3,844 33 1,414 30 652 27 901 284 9.77 15.97 7.33
(5V21) (662) San Francisco, CA 33,879 29,192 86.17% 4,687 13.83% 0 382 26,534 32 2,658 20 2,570 21 1,007 28 496 21 614 260 9.70 15.56 3.00
(5V21) (662GA) Santa Rosa, CA 10,239 9,091 88.79% 1,148 11.21% 0 33 8,465 3 626 3 646 8 209 2 87 4 206 13 8.08 18.51 11.84
(5V21) (662GC) Eureka, CA 3,030 2,408 79.47% 622 20.53% 0 11 2,179 0 229 2 385 4 146 0 44 2 47 3 26.17 15.10 15.93
(5V21) (662GD) Ukiah, CA 1,150 1,056 91.83% 94 8.17% 0 0 929 0 127 0 69 0 18 0 3 0 4 0 7.76 9.73 8.40
(5V21) (662GE) San Bruno, CA 1,093 935 85.54% 158 14.46% 0 11 829 3 106 0 95 0 25 0 15 0 23 8 9.77 30.02 17.24
(5V21) (662GF) San Francisco Downtown, CA
764 755 98.82% 9 1.18% 0 0 690 0 65 0 9 0 0 0 0 0 0 0 5.32 6.03 4.60
(5V21) (662GG) Clearlake, CA 1,865 1,772 95.01% 93 4.99% 0 0 1,592 0 180 0 70 0 9 0 7 0 7 0 5.91 4.89 7.16
(5V21) (593) Las Vegas, NV HCS 117,419 105,351 89.72% 12,068 10.28% 2 452 98,951 120 6,400 60 5,802 130 3,185 89 1,523 35 1,558 18 3.39 17.10 4.14
(5V21) (593) Las Vegas, NV (North Las Vegas)
66,379 55,640 83.82% 10,739 16.18% 0 452 50,681 120 4,959 60 4,995 130 2,899 89 1,420 35 1,425 18 9.95 17.33 3.73
(5V21) (593GC) Pahrump, NV 2,825 2,802 99.19% 23 0.81% 0 0 2,781 0 21 0 8 0 11 0 2 0 2 0 0.99 11.51 0.82
(5V21) (593GD) Northwest Las Vegas, NV
13,454 13,184 97.99% 270 2.01% 0 0 12,826 0 358 0 176 0 63 0 11 0 20 0 2.35 2.58 4.98
(5V21) (593GE) Southeast Las Vegas, NV 12,792 12,458 97.39% 334 2.61% 0 0 12,037 0 421 0 205 0 64 0 31 0 34 0 3.04 6.52 3.75
(5V21) (593GF) Southwest Las Vegas, NV
12,366 11,828 95.65% 538 4.35% 0 0 11,463 0 365 0 325 0 111 0 49 0 53 0 4.11 3.28 5.72
(5V21) (593GG) Northeast Las Vegas, NV 8,114 8,017 98.80% 97 1.20% 0 0 7,797 0 220 0 61 0 20 0 6 0 10 0 1.81 5.39 3.08
(5V21) (593GH) Laughlin, NV (Master Chief Petty Officer Jesse Dean)
1,337 1,272 95.14% 65 4.86% 0 0 1,220 0 52 0 30 0 17 0 4 0 14 0 6.38 9.24 6.51
(5V21) (593QC) West Cheyenne, NV 152 150 98.68% 2 1.32% 0 0 146 0 4 0 2 0 0 0 0 0 0 0 2.90
(5V22) (501) New Mexico HCS 85,924 76,024 88.48% 9,900 11.52% 57 5 70,016 3 6,008 0 4,480 1 2,073 0 1,081 0 2,266 1 10.12 18.93 13.68
(5V22) (501) Albuquerque, NM (Raymond G. Murphy)
65,072 56,418 86.70% 8,654 13.30% 0 4 51,839 3 4,579 0 3,881 1 1,856 0 976 0 1,941 0 9.23 19.10 13.12
(5V22) (501G2) Las Vegas, NM 888 860 96.85% 28 3.15% 0 0 849 0 11 0 15 0 5 0 1 0 7 0 2.66 12.00 20.28
(5V22) (501GA) Artesia, NM 1,054 1,036 98.29% 18 1.71% 0 0 1,006 0 30 0 8 0 5 0 3 0 2 0 2.56 1.27 10.09
(5V22) (501GB) Farmington, NM 2,020 1,750 86.63% 270 13.37% 0 0 1,656 0 94 0 118 0 70 0 31 0 51 0 16.25 20.63 13.09
(5V22) (501GC) Silver City, NM 635 611 96.22% 24 3.78% 0 0 539 0 72 0 14 0 5 0 3 0 2 0 7.33 11.22 6.38
(5V22) (501GD) Gallup, NM 1,283 1,210 94.31% 73 5.69% 0 0 1,164 0 46 0 30 0 17 0 11 0 15 0 4.11 3.13 35.49
(5V22) (501GE) Espanola, NM 1,117 1,073 96.06% 44 3.94% 0 0 871 0 202 0 24 0 7 0 3 0 10 0 10.15 2.80 15.58
(5V22) (501GH) Truth or Consequences, NM
1,103 1,080 97.91% 23 2.09% 0 0 1,066 0 14 0 13 0 6 0 1 0 3 0 1.99 8.86 0.15
(5V22) (501GI) Alamogordo, NM 1,461 1,329 90.97% 132 9.03% 0 0 1,187 0 142 0 75 0 14 0 9 0 34 0 38.97 8.00 19.10
(5V22) (501GJ) Durango, CO 1,806 1,762 97.56% 44 2.44% 0 0 1,713 0 49 0 24 0 9 0 6 0 5 0 3.14 2.20 19.64
(5V22) (501GK) Santa Fe, NM 3,063 2,866 93.57% 197 6.43% 0 0 2,796 0 70 0 75 0 25 0 10 0 87 0 13.28 5.92 11.35
(5V22) (501GM) Northwest Metro, NM 5,063 4,736 93.54% 327 6.46% 0 1 4,099 0 637 0 155 0 42 0 27 0 103 1 11.40 16.12 15.16
(5V22) (501GN) Taos, NM 937 884 94.34% 53 5.66% 0 0 838 0 46 0 41 0 9 0 0 0 3 0 4.59 4.45 40.33
(5V22) (501HB) Raton, NM 414 401 96.86% 13 3.14% 0 0 385 0 16 0 7 0 3 0 0 0 3 0 2.40 4.50 27.38
(5V22) (501MA) IDES Kirtland AFB 8 8 100.00% 0 0.00% 0 0 8 0 0 0 0 0 0 0 0 0 0 0 0.00 0.00
(5V22) (644) Phoenix, AZ HCS 136,257 125,352 92.00% 10,905 8.00% 11 253 118,432 33 6,920 28 6,768 11 2,398 23 772 10 967 148 3.03 12.24 6.32
(5V22) (644) Phoenix, AZ (Carl T. Hayden)
69,595 61,985 89.07% 7,610 10.93% 0 226 57,425 26 4,560 28 4,633 11 1,758 23 566 10 653 128 4.09 11.61 3.84
(5V22) (644BY) Southeast, AZ 22,382 20,573 91.92% 1,809 8.08% 0 23 19,546 4 1,027 0 1,072 0 328 0 150 0 259 19 3.81 21.25 10.64
(5V22) (644GA) Northwest, AZ 15,059 14,496 96.26% 563 3.74% 0 0 14,117 0 379 0 414 0 123 0 16 0 10 0 2.14 7.60 6.88
(5V22) (644GB) Show Low, AZ 1,768 1,709 96.66% 59 3.34% 0 4 1,680 3 29 0 32 0 23 0 2 0 2 1 1.57 17.39 0.66

Pending Appointment and Electronic Wait List Summary -National, Facility, and Division Level Summaries Wait Time Calculated from Preferred
Date
For the period ending: 3/15/2019
1. Total Appts Scheduled
2. Appts Scheduled 30 Days or Under
3. Percent Appts Scheduled 30 Days or Under
4. Appts Scheduled Over 30 Days
5. Percent Appts Scheduled Over 30 Days
6. New Enroll Appt Req
7. EWL Count
8. Appts Between 0-14 Days
9. EWL 0-14 Days
10. Appts Between 15-30 Days
11. EWL 15 -30 days
12. Appts Between 31-60 Days
13. EWL 31 -60 Days
14. Appts Between 61-90 Days
15. EWL 61 -90 Days
16. Appts Between 91-120 Days
17. EWL 91 -120 Days
18. Appts Beyond 120 Days
19. EWL Greater than 120 Days
20. PC Avg Wait Time
21. SC Avg Wait Time
22. MH Avg Wait Time
(5V22) (644GC) Southwest, AZ 7,128 6,884 96.58% 244 3.42% 0 0 6,672 0 212 0 144 0 73 0 15 0 12 0 2.53 10.30 11.32
(5V22) (644GD) Payson, AZ 401 399 99.50% 2 0.50% 0 0 393 0 6 0 2 0 0 0 0 0 0 0 0.85 0.57
(5V22) (644GE) Thunderbird, AZ 4,887 4,748 97.16% 139 2.84% 0 0 4,620 0 128 0 112 0 26 0 1 0 0 0 1.67 14.00 5.21
(5V22) (644GF) Globe, AZ 350 346 98.86% 4 1.14% 0 0 337 0 9 0 2 0 1 0 1 0 0 0 2.44 48.33 0.43
(5V22) (644GG) Northeast Phoenix-Via Linda Road, AZ
3,487 3,358 96.30% 129 3.70% 0 0 3,263 0 95 0 91 0 24 0 6 0 8 0 1.85 6.52 10.89
(5V22) (644GH) Phoenix Midtown, AZ 11,192 10,850 96.94% 342 3.06% 0 0 10,376 0 474 0 262 0 42 0 15 0 23 0 3.54 12.00 4.31
(5V22) (644QB) Phoenix, AZ - Mobile 8 4 50.00% 4 50.00% 0 0 3 0 1 0 4 0 0 0 0 0 0 0 23.63
(5V22) (649) Northern Arizona HCS 22,509 20,316 90.26% 2,193 9.74% 36 99 18,897 10 1,419 18 957 28 455 0 277 43 504 0 9.71 13.35 7.51
(5V22) (649) Prescott, AZ (Bob Stump) 14,759 13,184 89.33% 1,575 10.67% 0 99 12,167 10 1,017 18 765 28 312 0 153 43 345 0 8.12 13.45 5.51
(5V22) (649GA) Kingman, AZ 2,656 2,490 93.75% 166 6.25% 0 0 2,386 0 104 0 67 0 38 0 13 0 48 0 8.71 2.00 8.49
(5V22) (649GB) Flagstaff, AZ 465 442 95.05% 23 4.95% 0 0 385 0 57 0 9 0 6 0 5 0 3 0 6.34 2.39 15.22
(5V22) (649GC) Lake Havasu City, AZ 3,117 2,973 95.38% 144 4.62% 0 0 2,834 0 139 0 71 0 27 0 15 0 31 0 5.73 16.89 9.79
(5V22) (649GD) Anthem, AZ 486 435 89.51% 51 10.49% 0 0 380 0 55 0 18 0 16 0 13 0 4 0 6.57 0.00 16.40
(5V22) (649GE) Cottonwood, AZ 817 591 72.34% 226 27.66% 0 0 555 0 36 0 22 0 54 0 77 0 73 0 41.49 3.00 9.52
(5V22) (649QA) Chinle, AZ 138 134 97.10% 4 2.90% 0 0 132 0 2 0 3 0 0 0 1 0 0 0 0.38 19.87
(5V22) (649QB) Holbrook, AZ 15 13 86.67% 2 13.33% 0 0 8 0 5 0 0 0 2 0 0 0 0 0 6.67 24.56
(5V22) (649QD) Page, AZ 10 8 80.00% 2 20.00% 0 0 8 0 0 0 2 0 0 0 0 0 0 0 11.90
(5V22) (649QF) Tuba City, AZ 25 25 100.00% 0 0.00% 0 0 24 0 1 0 0 0 0 0 0 0 0 0 0.00 10.50
(5V22) (649QG) Polacca, AZ 6 6 100.00% 0 0.00% 0 0 6 0 0 0 0 0 0 0 0 0 0 0 0.00
(5V22) (649QH) Kayenta, AZ 15 15 100.00% 0 0.00% 0 0 12 0 3 0 0 0 0 0 0 0 0 0 0.00 7.88
(5V22) (678) Southern Arizona HCS 90,188 84,131 93.28% 6,057 6.72% 10 44 80,031 3 4,100 2 3,269 14 1,653 3 544 5 591 17 1.85 10.08 3.39
(5V22) (678) Tucson, AZ 65,535 59,771 91.20% 5,764 8.80% 0 28 56,332 3 3,439 2 3,051 8 1,613 2 528 2 572 11 2.01 11.05 3.61
(5V22) (678GA) Sierra Vista, AZ 6,149 6,059 98.54% 90 1.46% 0 9 5,912 0 147 0 53 3 19 0 9 2 9 4 1.65 4.67 3.73
(5V22) (678GB) Yuma, AZ 5,274 5,242 99.39% 32 0.61% 0 3 5,170 0 72 0 28 1 3 1 1 0 0 1 1.24 2.28 3.26
(5V22) (678GC) Casa Grande, AZ 2,987 2,926 97.96% 61 2.04% 0 4 2,804 0 122 0 47 2 4 0 4 1 6 1 2.14 4.49 3.39
(5V22) (678GD) Safford, AZ 372 360 96.77% 12 3.23% 0 0 339 0 21 0 9 0 2 0 1 0 0 0 3.46 12.39 3.68
(5V22) (678GE) Green Valley, AZ 1,264 1,259 99.60% 5 0.40% 0 0 1,202 0 57 0 5 0 0 0 0 0 0 0 3.18 0.97 0.00
(5V22) (678GF) Northwest Tucson, AZ 4,748 4,673 98.42% 75 1.58% 0 0 4,536 0 137 0 64 0 10 0 0 0 1 0 1.44 4.87 2.36
(5V22) (678GG) Southeast Tucson, AZ 3,844 3,826 99.53% 18 0.47% 0 0 3,721 0 105 0 12 0 2 0 1 0 3 0 1.69 2.98 1.48
(5V22) (678MB) IDES Fort Huachuca 15 15 100.00% 0 0.00% 0 0 15 0 0 0 0 0 0 0 0 0 0 0 0.15 0.00
(5V22) (600) Long Beach, CA HCS 93,405 83,932 89.86% 9,473 10.14% 7 3 78,083 3 5,849 0 4,876 0 1,991 0 1,239 0 1,367 0 6.05 13.99 5.40
(5V22) (600) Long Beach, CA 79,540 71,073 89.36% 8,467 10.64% 0 2 66,100 2 4,973 0 4,203 0 1,750 0 1,203 0 1,311 0 6.85 14.03 4.60
(5V22) (600GA) Anaheim, CA 3,522 3,213 91.23% 309 8.77% 0 0 2,981 0 232 0 217 0 77 0 7 0 8 0 4.77 6.43 13.33
(5V22) (600GB) Santa Ana, CA 5,411 4,897 90.50% 514 9.50% 0 0 4,527 0 370 0 313 0 141 0 24 0 36 0 3.67 14.34 4.97
(5V22) (600GC) Cabrillo, CA 139 134 96.40% 5 3.60% 0 0 129 0 5 0 2 0 0 0 0 0 3 0 3.49 19.43
(5V22) (600GD) Santa Fe Springs, CA 2,612 2,580 98.77% 32 1.23% 0 0 2,488 0 92 0 28 0 3 0 0 0 1 0 2.56 9.00 5.07
(5V22) (600GE) Laguna Hills, CA 2,181 2,035 93.31% 146 6.69% 0 1 1,858 1 177 0 113 0 20 0 5 0 8 0 8.42 11.78 5.19
(5V22) (605) Loma Linda, CA HCS 133,671 123,423 92.33% 10,248 7.67% 14 40 115,886 9 7,537 7 6,008 4 1,925 7 1,189 3 1,126 10 2.62 12.20 6.98
(5V22) (605) Loma Linda, CA (Jerry L. Pettis)
45,143 39,029 86.46% 6,114 13.54% 0 35 35,534 8 3,495 7 3,195 4 1,179 7 905 3 835 6 3.43 12.93 5.12
(5V22) (605BZ) Loma Linda, CA 52,633 49,259 93.59% 3,374 6.41% 0 2 46,159 1 3,100 0 2,265 0 616 0 246 0 247 1 3.05 11.10 7.46
(5V22) (605GA) Victorville, CA 5,935 5,742 96.75% 193 3.25% 0 0 5,566 0 176 0 184 0 3 0 0 0 6 0 2.28 1.31 6.61
(5V22) (605GB) Murrieta, CA 8,904 8,620 96.81% 284 3.19% 0 2 8,279 0 341 0 170 0 75 0 25 0 14 2 3.39 6.29 9.66
(5V22) (605GC) Palm Desert, CA 9,889 9,842 99.52% 47 0.48% 0 1 9,742 0 100 0 38 0 5 0 0 0 4 1 0.65 3.25 2.93
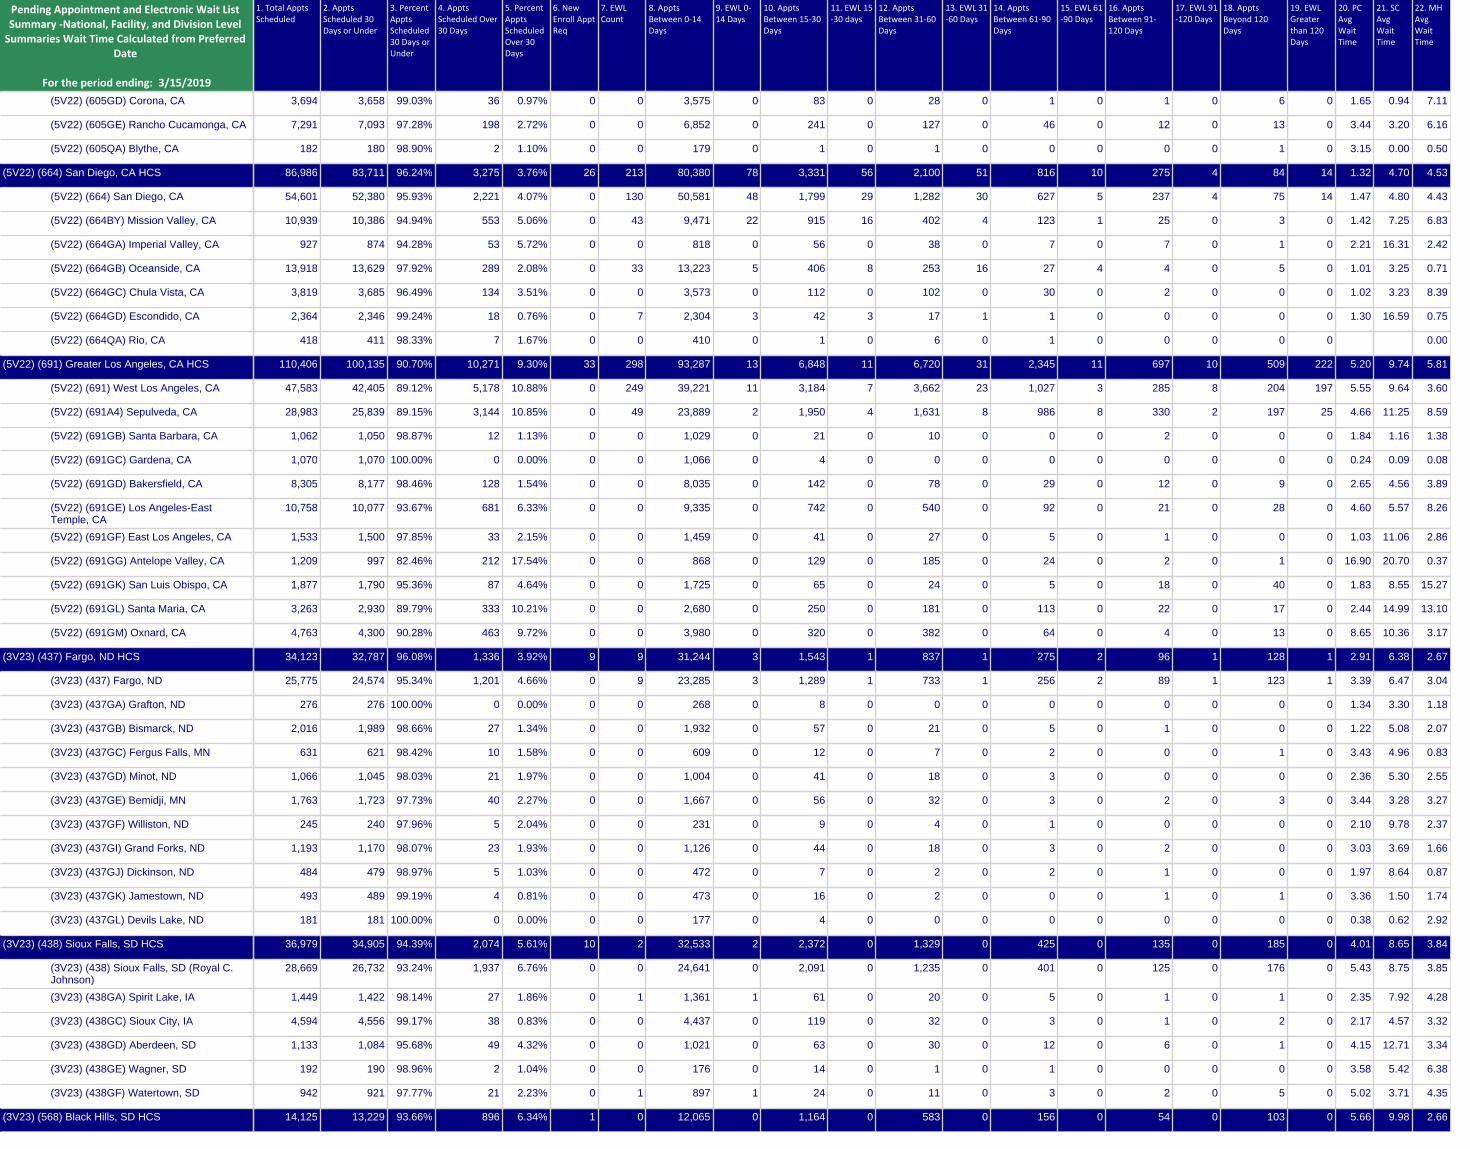
Pending Appointment and Electronic Wait List Summary -National, Facility, and Division Level Summaries Wait Time Calculated from Preferred
Date
For the period ending: 3/15/2019
1. Total Appts Scheduled
2. Appts Scheduled 30 Days or Under
3. Percent Appts Scheduled 30 Days or Under
4. Appts Scheduled Over 30 Days
5. Percent Appts Scheduled Over 30 Days
6. New Enroll Appt Req
7. EWL Count
8. Appts Between 0-14 Days
9. EWL 0-14 Days
10. Appts Between 15-30 Days
11. EWL 15 -30 days
12. Appts Between 31-60 Days
13. EWL 31 -60 Days
14. Appts Between 61-90 Days
15. EWL 61 -90 Days
16. Appts Between 91-120 Days
17. EWL 91 -120 Days
18. Appts Beyond 120 Days
19. EWL Greater than 120 Days
20. PC Avg Wait Time
21. SC Avg Wait Time
22. MH Avg Wait Time
(5V22) (605GD) Corona, CA 3,694 3,658 99.03% 36 0.97% 0 0 3,575 0 83 0 28 0 1 0 1 0 6 0 1.65 0.94 7.11
(5V22) (605GE) Rancho Cucamonga, CA 7,291 7,093 97.28% 198 2.72% 0 0 6,852 0 241 0 127 0 46 0 12 0 13 0 3.44 3.20 6.16
(5V22) (605QA) Blythe, CA 182 180 98.90% 2 1.10% 0 0 179 0 1 0 1 0 0 0 0 0 1 0 3.15 0.00 0.50
(5V22) (664) San Diego, CA HCS 86,986 83,711 96.24% 3,275 3.76% 26 213 80,380 78 3,331 56 2,100 51 816 10 275 4 84 14 1.32 4.70 4.53
(5V22) (664) San Diego, CA 54,601 52,380 95.93% 2,221 4.07% 0 130 50,581 48 1,799 29 1,282 30 627 5 237 4 75 14 1.47 4.80 4.43
(5V22) (664BY) Mission Valley, CA 10,939 10,386 94.94% 553 5.06% 0 43 9,471 22 915 16 402 4 123 1 25 0 3 0 1.42 7.25 6.83
(5V22) (664GA) Imperial Valley, CA 927 874 94.28% 53 5.72% 0 0 818 0 56 0 38 0 7 0 7 0 1 0 2.21 16.31 2.42
(5V22) (664GB) Oceanside, CA 13,918 13,629 97.92% 289 2.08% 0 33 13,223 5 406 8 253 16 27 4 4 0 5 0 1.01 3.25 0.71
(5V22) (664GC) Chula Vista, CA 3,819 3,685 96.49% 134 3.51% 0 0 3,573 0 112 0 102 0 30 0 2 0 0 0 1.02 3.23 8.39
(5V22) (664GD) Escondido, CA 2,364 2,346 99.24% 18 0.76% 0 7 2,304 3 42 3 17 1 1 0 0 0 0 0 1.30 16.59 0.75
(5V22) (664QA) Rio, CA 418 411 98.33% 7 1.67% 0 0 410 0 1 0 6 0 1 0 0 0 0 0 0.00
(5V22) (691) Greater Los Angeles, CA HCS 110,406 100,135 90.70% 10,271 9.30% 33 298 93,287 13 6,848 11 6,720 31 2,345 11 697 10 509 222 5.20 9.74 5.81
(5V22) (691) West Los Angeles, CA 47,583 42,405 89.12% 5,178 10.88% 0 249 39,221 11 3,184 7 3,662 23 1,027 3 285 8 204 197 5.55 9.64 3.60
(5V22) (691A4) Sepulveda, CA 28,983 25,839 89.15% 3,144 10.85% 0 49 23,889 2 1,950 4 1,631 8 986 8 330 2 197 25 4.66 11.25 8.59
(5V22) (691GB) Santa Barbara, CA 1,062 1,050 98.87% 12 1.13% 0 0 1,029 0 21 0 10 0 0 0 2 0 0 0 1.84 1.16 1.38
(5V22) (691GC) Gardena, CA 1,070 1,070 100.00% 0 0.00% 0 0 1,066 0 4 0 0 0 0 0 0 0 0 0 0.24 0.09 0.08
(5V22) (691GD) Bakersfield, CA 8,305 8,177 98.46% 128 1.54% 0 0 8,035 0 142 0 78 0 29 0 12 0 9 0 2.65 4.56 3.89
(5V22) (691GE) Los Angeles-East Temple, CA
10,758 10,077 93.67% 681 6.33% 0 0 9,335 0 742 0 540 0 92 0 21 0 28 0 4.60 5.57 8.26
(5V22) (691GF) East Los Angeles, CA 1,533 1,500 97.85% 33 2.15% 0 0 1,459 0 41 0 27 0 5 0 1 0 0 0 1.03 11.06 2.86
(5V22) (691GG) Antelope Valley, CA 1,209 997 82.46% 212 17.54% 0 0 868 0 129 0 185 0 24 0 2 0 1 0 16.90 20.70 0.37
(5V22) (691GK) San Luis Obispo, CA 1,877 1,790 95.36% 87 4.64% 0 0 1,725 0 65 0 24 0 5 0 18 0 40 0 1.83 8.55 15.27
(5V22) (691GL) Santa Maria, CA 3,263 2,930 89.79% 333 10.21% 0 0 2,680 0 250 0 181 0 113 0 22 0 17 0 2.44 14.99 13.10
(5V22) (691GM) Oxnard, CA 4,763 4,300 90.28% 463 9.72% 0 0 3,980 0 320 0 382 0 64 0 4 0 13 0 8.65 10.36 3.17
(3V23) (437) Fargo, ND HCS 34,123 32,787 96.08% 1,336 3.92% 9 9 31,244 3 1,543 1 837 1 275 2 96 1 128 1 2.91 6.38 2.67
(3V23) (437) Fargo, ND 25,775 24,574 95.34% 1,201 4.66% 0 9 23,285 3 1,289 1 733 1 256 2 89 1 123 1 3.39 6.47 3.04
(3V23) (437GA) Grafton, ND 276 276 100.00% 0 0.00% 0 0 268 0 8 0 0 0 0 0 0 0 0 0 1.34 3.30 1.18
(3V23) (437GB) Bismarck, ND 2,016 1,989 98.66% 27 1.34% 0 0 1,932 0 57 0 21 0 5 0 1 0 0 0 1.22 5.08 2.07
(3V23) (437GC) Fergus Falls, MN 631 621 98.42% 10 1.58% 0 0 609 0 12 0 7 0 2 0 0 0 1 0 3.43 4.96 0.83
(3V23) (437GD) Minot, ND 1,066 1,045 98.03% 21 1.97% 0 0 1,004 0 41 0 18 0 3 0 0 0 0 0 2.36 5.30 2.55
(3V23) (437GE) Bemidji, MN 1,763 1,723 97.73% 40 2.27% 0 0 1,667 0 56 0 32 0 3 0 2 0 3 0 3.44 3.28 3.27
(3V23) (437GF) Williston, ND 245 240 97.96% 5 2.04% 0 0 231 0 9 0 4 0 1 0 0 0 0 0 2.10 9.78 2.37
(3V23) (437GI) Grand Forks, ND 1,193 1,170 98.07% 23 1.93% 0 0 1,126 0 44 0 18 0 3 0 2 0 0 0 3.03 3.69 1.66
(3V23) (437GJ) Dickinson, ND 484 479 98.97% 5 1.03% 0 0 472 0 7 0 2 0 2 0 1 0 0 0 1.97 8.64 0.87
(3V23) (437GK) Jamestown, ND 493 489 99.19% 4 0.81% 0 0 473 0 16 0 2 0 0 0 1 0 1 0 3.36 1.50 1.74
(3V23) (437GL) Devils Lake, ND 181 181 100.00% 0 0.00% 0 0 177 0 4 0 0 0 0 0 0 0 0 0 0.38 0.62 2.92
(3V23) (438) Sioux Falls, SD HCS 36,979 34,905 94.39% 2,074 5.61% 10 2 32,533 2 2,372 0 1,329 0 425 0 135 0 185 0 4.01 8.65 3.84
(3V23) (438) Sioux Falls, SD (Royal C. Johnson)
28,669 26,732 93.24% 1,937 6.76% 0 0 24,641 0 2,091 0 1,235 0 401 0 125 0 176 0 5.43 8.75 3.85
(3V23) (438GA) Spirit Lake, IA 1,449 1,422 98.14% 27 1.86% 0 1 1,361 1 61 0 20 0 5 0 1 0 1 0 2.35 7.92 4.28
(3V23) (438GC) Sioux City, IA 4,594 4,556 99.17% 38 0.83% 0 0 4,437 0 119 0 32 0 3 0 1 0 2 0 2.17 4.57 3.32
(3V23) (438GD) Aberdeen, SD 1,133 1,084 95.68% 49 4.32% 0 0 1,021 0 63 0 30 0 12 0 6 0 1 0 4.15 12.71 3.34
(3V23) (438GE) Wagner, SD 192 190 98.96% 2 1.04% 0 0 176 0 14 0 1 0 1 0 0 0 0 0 3.58 5.42 6.38
(3V23) (438GF) Watertown, SD 942 921 97.77% 21 2.23% 0 1 897 1 24 0 11 0 3 0 2 0 5 0 5.02 3.71 4.35
(3V23) (568) Black Hills, SD HCS 14,125 13,229 93.66% 896 6.34% 1 0 12,065 0 1,164 0 583 0 156 0 54 0 103 0 5.66 9.98 2.66

Pending Appointment and Electronic Wait List Summary -National, Facility, and Division Level Summaries Wait Time Calculated from Preferred
Date
For the period ending: 3/15/2019
1. Total Appts Scheduled
2. Appts Scheduled 30 Days or Under
3. Percent Appts Scheduled 30 Days or Under
4. Appts Scheduled Over 30 Days
5. Percent Appts Scheduled Over 30 Days
6. New Enroll Appt Req
7. EWL Count
8. Appts Between 0-14 Days
9. EWL 0-14 Days
10. Appts Between 15-30 Days
11. EWL 15 -30 days
12. Appts Between 31-60 Days
13. EWL 31 -60 Days
14. Appts Between 61-90 Days
15. EWL 61 -90 Days
16. Appts Between 91-120 Days
17. EWL 91 -120 Days
18. Appts Beyond 120 Days
19. EWL Greater than 120 Days
20. PC Avg Wait Time
21. SC Avg Wait Time
22. MH Avg Wait Time
(3V23) (568) Fort Meade, SD 7,512 6,992 93.08% 520 6.92% 0 0 6,313 0 679 0 310 0 98 0 39 0 73 0 4.90 10.49 2.35
(3V23) (568A4) Hot Springs, SD 2,655 2,457 92.54% 198 7.46% 0 0 2,181 0 276 0 137 0 36 0 10 0 15 0 8.89 9.07 2.92
(3V23) (568GA) Rapid City, SD 2,477 2,321 93.70% 156 6.30% 0 0 2,150 0 171 0 122 0 20 0 5 0 9 0 10.57 8.66 2.46
(3V23) (568GB) Pierre, SD 994 989 99.50% 5 0.50% 0 0 971 0 18 0 2 0 1 0 0 0 2 0 1.18 0.00 8.65
(3V23) (568HA) Newcastle, WY 30 26 86.67% 4 13.33% 0 0 26 0 0 0 2 0 0 0 0 0 2 0 26.18 0.00
(3V23) (568HB) Gordon, NE 40 36 90.00% 4 10.00% 0 0 34 0 2 0 3 0 0 0 0 0 1 0 10.82 12.83
(3V23) (568HF) Pine Ridge, SD 17 16 94.12% 1 5.88% 0 0 15 0 1 0 1 0 0 0 0 0 0 0 5.18 13.33
(3V23) (568HH) Scottsbluff, NE 264 256 96.97% 8 3.03% 0 0 243 0 13 0 6 0 1 0 0 0 1 0 5.54 0.00 4.62
(3V23) (568HJ) Mission, SD 93 93 100.00% 0 0.00% 0 0 93 0 0 0 0 0 0 0 0 0 0 0 0.00
(3V23) (568HP) Winner, SD 42 42 100.00% 0 0.00% 0 0 39 0 3 0 0 0 0 0 0 0 0 0 2.31 0.00 0.00
(3V23) (568MA) IDES Ellsworth AFB 1 1 100.00% 0 0.00% 0 0 0 0 1 0 0 0 0 0 0 0 0 0 21.00
(3V23) (618) Minneapolis, MN HCS 105,341 99,281 94.25% 6,060 5.75% 117 28 93,147 7 6,134 2 3,708 9 1,234 3 500 5 618 2 4.75 8.76 3.19
(3V23) (618) Minneapolis, MN 67,980 63,814 93.87% 4,166 6.13% 0 28 59,346 7 4,468 2 2,681 9 839 3 266 5 380 2 4.47 8.35 2.55
(3V23) (618BY) Twin Ports, WI 8,668 7,985 92.12% 683 7.88% 0 0 7,550 0 435 0 279 0 78 0 144 0 182 0 3.91 24.74 7.07
(3V23) (618GA) St. James, MN 326 320 98.16% 6 1.84% 0 0 312 0 8 0 4 0 0 0 1 0 1 0 3.26 1.62 0.79
(3V23) (618GB) Hibbing, MN 1,331 1,315 98.80% 16 1.20% 0 0 1,276 0 39 0 10 0 4 0 1 0 1 0 1.60 7.06 2.89
(3V23) (618GD) Maplewood, MN 3,265 3,186 97.58% 79 2.42% 0 0 2,955 0 231 0 63 0 13 0 2 0 1 0 3.42 9.85 0.94
(3V23) (618GE) Chippewa Valley, WI 3,447 3,219 93.39% 228 6.61% 0 0 3,055 0 164 0 168 0 47 0 10 0 3 0 7.95 11.10 1.61
(3V23) (618GG) Rochester, MN 4,363 4,062 93.10% 301 6.90% 0 0 3,933 0 129 0 167 0 90 0 31 0 13 0 6.22 4.56 3.66
(3V23) (618GH) Hayward, WI 576 556 96.53% 20 3.47% 0 0 516 0 40 0 13 0 7 0 0 0 0 0 3.70 0.00 6.56
(3V23) (618GI) Northwest Metro, MN 8,578 8,346 97.30% 232 2.70% 0 0 7,976 0 370 0 161 0 48 0 9 0 14 0 2.69 4.39 7.75
(3V23) (618GJ) Shakopee, MN 1,915 1,843 96.24% 72 3.76% 0 0 1,786 0 57 0 39 0 19 0 5 0 9 0 4.47 14.56 2.10
(3V23) (618GK) Albert Lea, MN 1,004 976 97.21% 28 2.79% 0 0 929 0 47 0 15 0 13 0 0 0 0 0 2.10 8.53 3.93
(3V23) (618GL) Minneapolis-Harmon Place, MN
284 281 98.94% 3 1.06% 0 0 275 0 6 0 3 0 0 0 0 0 0 0 0.32
(3V23) (618GM) Rice Lake, WI 941 905 96.17% 36 3.83% 0 0 847 0 58 0 33 0 2 0 1 0 0 0 5.90 2.43 1.88
(3V23) (618GN) Mankato, MN (Lyle C. Pearson)
2,216 2,026 91.43% 190 8.57% 0 0 1,949 0 77 0 72 0 74 0 30 0 14 0 11.68 3.05 1.00
(3V23) (618QA) Fort Snelling, MN 333 333 100.00% 0 0.00% 0 0 330 0 3 0 0 0 0 0 0 0 0 0 0.27
(3V23) (618QB) Ely, MN 114 114 100.00% 0 0.00% 0 0 112 0 2 0 0 0 0 0 0 0 0 0 1.37 10.00 3.27
(3V23) (636A6) Central Iowa HCS 29,190 26,411 90.48% 2,779 9.52% 0 0 24,539 0 1,872 0 1,520 0 625 0 299 0 335 0 9.60 10.82 7.01
(3V23) (636A6) Des Moines, IA 22,169 19,939 89.94% 2,230 10.06% 0 0 18,425 0 1,514 0 1,248 0 504 0 245 0 233 0 9.48 10.76 8.07
(3V23) (636BU) Des Moines, IA - VADOM 41 41 100.00% 0 0.00% 0 0 41 0 0 0 0 0 0 0 0 0 0 0
(3V23) (636GC) Mason City, IA 1,925 1,590 82.60% 335 17.40% 0 0 1,486 0 104 0 125 0 92 0 43 0 75 0 21.23 27.19 9.18
(3V23) (636GD) Marshalltown, IA 614 544 88.60% 70 11.40% 0 0 458 0 86 0 53 0 10 0 4 0 3 0 13.56 9.69 8.53
(3V23) (636GK) Fort Dodge, IA 2,187 2,125 97.17% 62 2.83% 0 0 2,063 0 62 0 37 0 5 0 1 0 19 0 4.40 7.74
(3V23) (636GM) Carroll, IA 589 571 96.94% 18 3.06% 0 0 549 0 22 0 11 0 4 0 2 0 1 0 4.02 5.84 3.06
(3V23) (636GR) Knoxville, IA 1,111 1,066 95.95% 45 4.05% 0 0 999 0 67 0 34 0 5 0 3 0 3 0 8.58 4.66 2.74
(3V23) (636GX) Fort Dodge North, IA 450 432 96.00% 18 4.00% 0 0 415 0 17 0 11 0 5 0 1 0 1 0 4.09
(3V23) (636QB) Des Moines-Center Street, IA
104 103 99.04% 1 0.96% 0 0 103 0 0 0 1 0 0 0 0 0 0 0
(3V23) (636A8) Iowa City, IA HCS 44,495 41,071 92.30% 3,424 7.70% 0 0 37,978 0 3,093 0 2,180 0 644 0 266 0 334 0 6.55 11.59 3.20
(3V23) (636A8) Iowa City, IA 20,273 17,886 88.23% 2,387 11.77% 0 0 15,942 0 1,944 0 1,582 0 436 0 178 0 191 0 10.63 11.51 10.43
(3V23) (636GF) Quad Cities, IA 2,779 2,658 95.65% 121 4.35% 0 0 2,513 0 145 0 63 0 37 0 7 0 14 0 9.34 15.25 2.67
(3V23) (636GG) Quincy, IL 1,515 1,470 97.03% 45 2.97% 0 0 1,398 0 72 0 39 0 2 0 0 0 4 0 3.40 5.64 6.94
(3V23) (636GH) Waterloo, IA 2,125 1,980 93.18% 145 6.82% 0 0 1,854 0 126 0 107 0 20 0 3 0 15 0 10.96 3.61 4.73
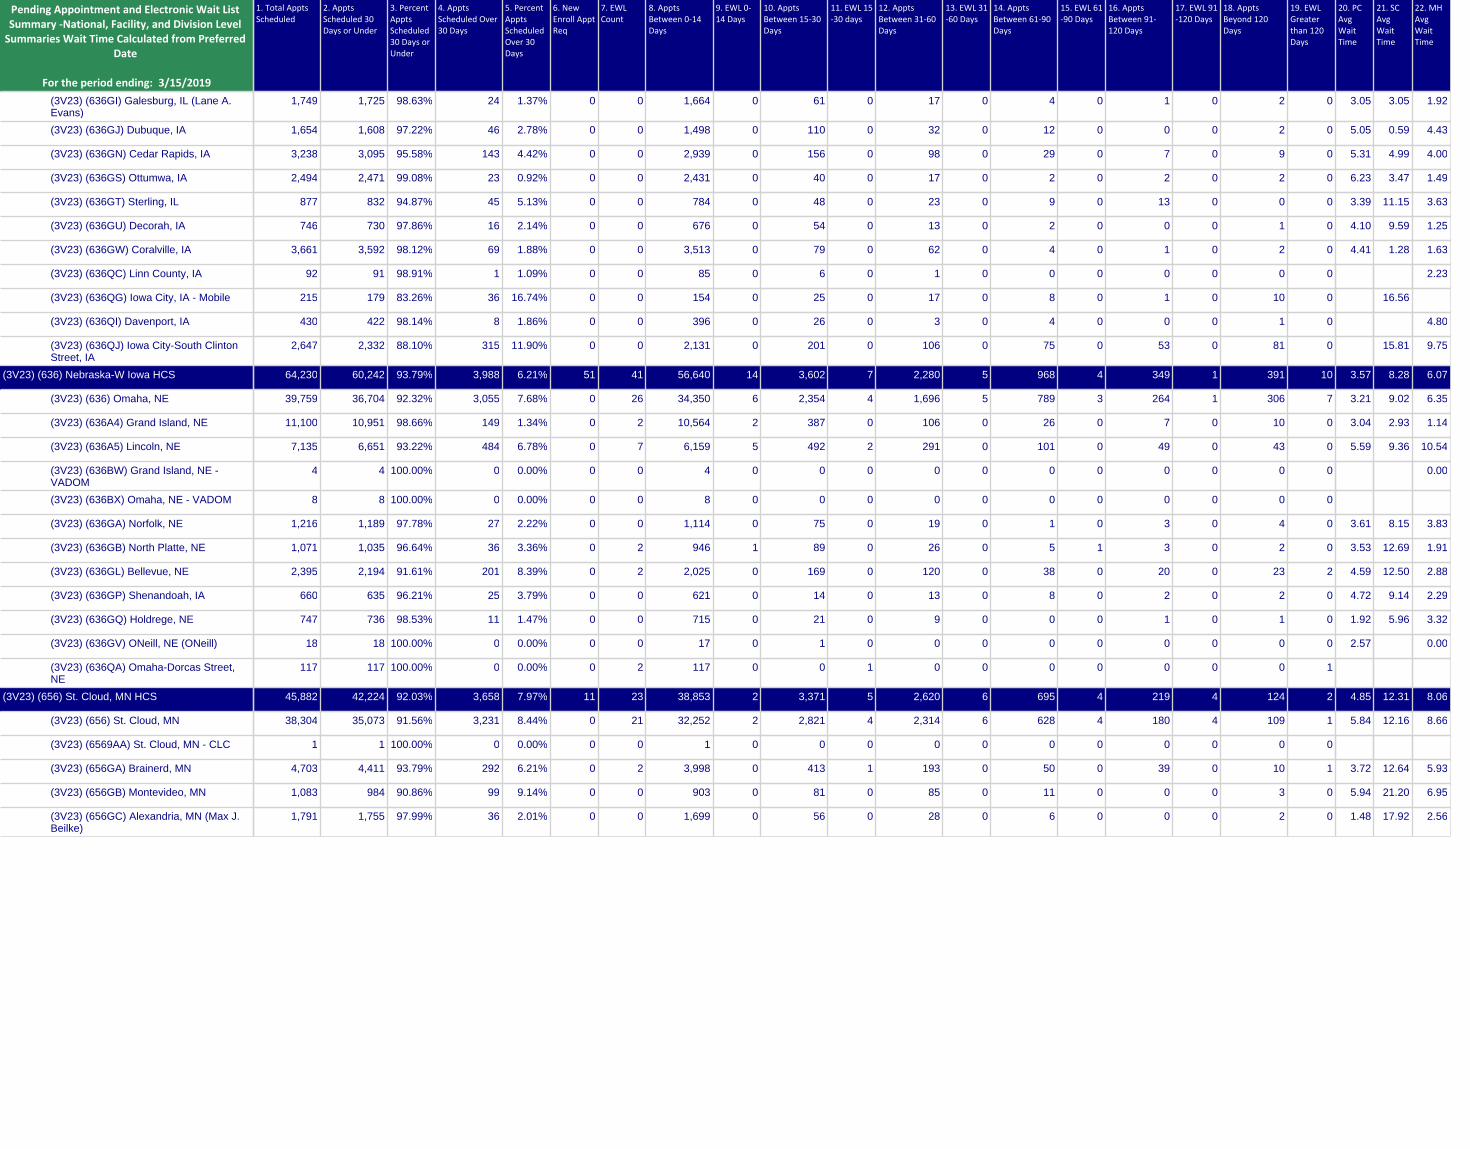
Pending Appointment and Electronic Wait List Summary -National, Facility, and Division Level Summaries Wait Time Calculated from Preferred
Date
For the period ending: 3/15/2019
1. Total Appts Scheduled
2. Appts Scheduled 30 Days or Under
3. Percent Appts Scheduled 30 Days or Under
4. Appts Scheduled Over 30 Days
5. Percent Appts Scheduled Over 30 Days
6. New Enroll Appt Req
7. EWL Count
8. Appts Between 0-14 Days
9. EWL 0-14 Days
10. Appts Between 15-30 Days
11. EWL 15 -30 days
12. Appts Between 31-60 Days
13. EWL 31 -60 Days
14. Appts Between 61-90 Days
15. EWL 61 -90 Days
16. Appts Between 91-120 Days
17. EWL 91 -120 Days
18. Appts Beyond 120 Days
19. EWL Greater than 120 Days
20. PC Avg Wait Time
21. SC Avg Wait Time
22. MH Avg Wait Time
(3V23) (636GI) Galesburg, IL (Lane A. Evans)
1,749 1,725 98.63% 24 1.37% 0 0 1,664 0 61 0 17 0 4 0 1 0 2 0 3.05 3.05 1.92
(3V23) (636GJ) Dubuque, IA 1,654 1,608 97.22% 46 2.78% 0 0 1,498 0 110 0 32 0 12 0 0 0 2 0 5.05 0.59 4.43
(3V23) (636GN) Cedar Rapids, IA 3,238 3,095 95.58% 143 4.42% 0 0 2,939 0 156 0 98 0 29 0 7 0 9 0 5.31 4.99 4.00
(3V23) (636GS) Ottumwa, IA 2,494 2,471 99.08% 23 0.92% 0 0 2,431 0 40 0 17 0 2 0 2 0 2 0 6.23 3.47 1.49
(3V23) (636GT) Sterling, IL 877 832 94.87% 45 5.13% 0 0 784 0 48 0 23 0 9 0 13 0 0 0 3.39 11.15 3.63
(3V23) (636GU) Decorah, IA 746 730 97.86% 16 2.14% 0 0 676 0 54 0 13 0 2 0 0 0 1 0 4.10 9.59 1.25
(3V23) (636GW) Coralville, IA 3,661 3,592 98.12% 69 1.88% 0 0 3,513 0 79 0 62 0 4 0 1 0 2 0 4.41 1.28 1.63
(3V23) (636QC) Linn County, IA 92 91 98.91% 1 1.09% 0 0 85 0 6 0 1 0 0 0 0 0 0 0 2.23
(3V23) (636QG) Iowa City, IA - Mobile 215 179 83.26% 36 16.74% 0 0 154 0 25 0 17 0 8 0 1 0 10 0 16.56
(3V23) (636QI) Davenport, IA 430 422 98.14% 8 1.86% 0 0 396 0 26 0 3 0 4 0 0 0 1 0 4.80
(3V23) (636QJ) Iowa City-South Clinton Street, IA
2,647 2,332 88.10% 315 11.90% 0 0 2,131 0 201 0 106 0 75 0 53 0 81 0 15.81 9.75
(3V23) (636) Nebraska-W Iowa HCS 64,230 60,242 93.79% 3,988 6.21% 51 41 56,640 14 3,602 7 2,280 5 968 4 349 1 391 10 3.57 8.28 6.07
(3V23) (636) Omaha, NE 39,759 36,704 92.32% 3,055 7.68% 0 26 34,350 6 2,354 4 1,696 5 789 3 264 1 306 7 3.21 9.02 6.35
(3V23) (636A4) Grand Island, NE 11,100 10,951 98.66% 149 1.34% 0 2 10,564 2 387 0 106 0 26 0 7 0 10 0 3.04 2.93 1.14
(3V23) (636A5) Lincoln, NE 7,135 6,651 93.22% 484 6.78% 0 7 6,159 5 492 2 291 0 101 0 49 0 43 0 5.59 9.36 10.54
(3V23) (636BW) Grand Island, NE -VADOM
4 4 100.00% 0 0.00% 0 0 4 0 0 0 0 0 0 0 0 0 0 0 0.00
(3V23) (636BX) Omaha, NE - VADOM 8 8 100.00% 0 0.00% 0 0 8 0 0 0 0 0 0 0 0 0 0 0
(3V23) (636GA) Norfolk, NE 1,216 1,189 97.78% 27 2.22% 0 0 1,114 0 75 0 19 0 1 0 3 0 4 0 3.61 8.15 3.83
(3V23) (636GB) North Platte, NE 1,071 1,035 96.64% 36 3.36% 0 2 946 1 89 0 26 0 5 1 3 0 2 0 3.53 12.69 1.91
(3V23) (636GL) Bellevue, NE 2,395 2,194 91.61% 201 8.39% 0 2 2,025 0 169 0 120 0 38 0 20 0 23 2 4.59 12.50 2.88
(3V23) (636GP) Shenandoah, IA 660 635 96.21% 25 3.79% 0 0 621 0 14 0 13 0 8 0 2 0 2 0 4.72 9.14 2.29
(3V23) (636GQ) Holdrege, NE 747 736 98.53% 11 1.47% 0 0 715 0 21 0 9 0 0 0 1 0 1 0 1.92 5.96 3.32
(3V23) (636GV) ONeill, NE (ONeill) 18 18 100.00% 0 0.00% 0 0 17 0 1 0 0 0 0 0 0 0 0 0 2.57 0.00
(3V23) (636QA) Omaha-Dorcas Street, NE
117 117 100.00% 0 0.00% 0 2 117 0 0 1 0 0 0 0 0 0 0 1
(3V23) (656) St. Cloud, MN HCS 45,882 42,224 92.03% 3,658 7.97% 11 23 38,853 2 3,371 5 2,620 6 695 4 219 4 124 2 4.85 12.31 8.06
(3V23) (656) St. Cloud, MN 38,304 35,073 91.56% 3,231 8.44% 0 21 32,252 2 2,821 4 2,314 6 628 4 180 4 109 1 5.84 12.16 8.66
(3V23) (6569AA) St. Cloud, MN - CLC 1 1 100.00% 0 0.00% 0 0 1 0 0 0 0 0 0 0 0 0 0 0
(3V23) (656GA) Brainerd, MN 4,703 4,411 93.79% 292 6.21% 0 2 3,998 0 413 1 193 0 50 0 39 0 10 1 3.72 12.64 5.93
(3V23) (656GB) Montevideo, MN 1,083 984 90.86% 99 9.14% 0 0 903 0 81 0 85 0 11 0 0 0 3 0 5.94 21.20 6.95
(3V23) (656GC) Alexandria, MN (Max J. Beilke)
1,791 1,755 97.99% 36 2.01% 0 0 1,699 0 56 0 28 0 6 0 0 0 2 0 1.48 17.92 2.56
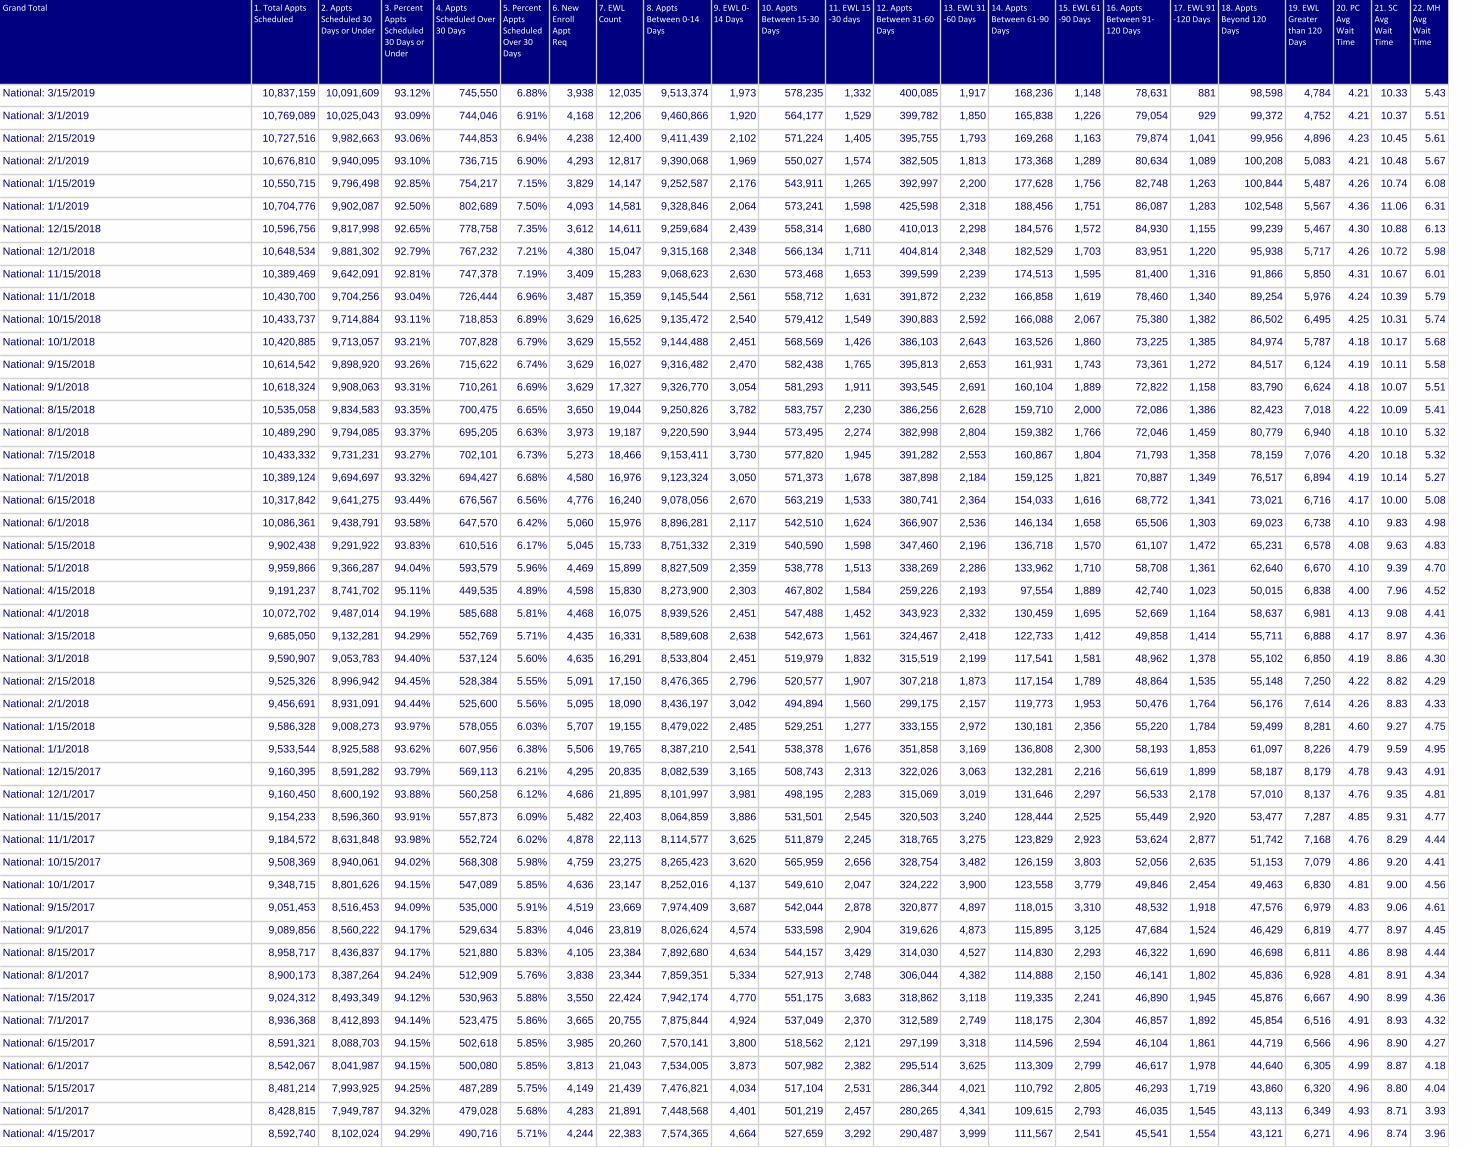
Grand Total 1. Total Appts Scheduled
2. Appts Scheduled 30 Days or Under
3. Percent Appts Scheduled 30 Days or Under
4. Appts Scheduled Over 30 Days
5. Percent Appts Scheduled Over 30 Days
6. New Enroll Appt Req
7. EWL Count
8. Appts Between 0-14 Days
9. EWL 0-14 Days
10. Appts Between 15-30 Days
11. EWL 15 -30 days
12. Appts Between 31-60 Days
13. EWL 31 -60 Days
14. Appts Between 61-90 Days
15. EWL 61 -90 Days
16. Appts Between 91-120 Days
17. EWL 91 -120 Days
18. Appts Beyond 120 Days
19. EWL Greater than 120 Days
20. PC Avg Wait Time
21. SC Avg Wait Time
22. MH Avg Wait Time
National: 3/15/2019 10,837,159 10,091,609 93.12% 745,550 6.88% 3,938 12,035 9,513,374 1,973 578,235 1,332 400,085 1,917 168,236 1,148 78,631 881 98,598 4,784 4.21 10.33 5.43
National: 3/1/2019 10,769,089 10,025,043 93.09% 744,046 6.91% 4,168 12,206 9,460,866 1,920 564,177 1,529 399,782 1,850 165,838 1,226 79,054 929 99,372 4,752 4.21 10.37 5.51
National: 2/15/2019 10,727,516 9,982,663 93.06% 744,853 6.94% 4,238 12,400 9,411,439 2,102 571,224 1,405 395,755 1,793 169,268 1,163 79,874 1,041 99,956 4,896 4.23 10.45 5.61
National: 2/1/2019 10,676,810 9,940,095 93.10% 736,715 6.90% 4,293 12,817 9,390,068 1,969 550,027 1,574 382,505 1,813 173,368 1,289 80,634 1,089 100,208 5,083 4.21 10.48 5.67
National: 1/15/2019 10,550,715 9,796,498 92.85% 754,217 7.15% 3,829 14,147 9,252,587 2,176 543,911 1,265 392,997 2,200 177,628 1,756 82,748 1,263 100,844 5,487 4.26 10.74 6.08
National: 1/1/2019 10,704,776 9,902,087 92.50% 802,689 7.50% 4,093 14,581 9,328,846 2,064 573,241 1,598 425,598 2,318 188,456 1,751 86,087 1,283 102,548 5,567 4.36 11.06 6.31
National: 12/15/2018 10,596,756 9,817,998 92.65% 778,758 7.35% 3,612 14,611 9,259,684 2,439 558,314 1,680 410,013 2,298 184,576 1,572 84,930 1,155 99,239 5,467 4.30 10.88 6.13
National: 12/1/2018 10,648,534 9,881,302 92.79% 767,232 7.21% 4,380 15,047 9,315,168 2,348 566,134 1,711 404,814 2,348 182,529 1,703 83,951 1,220 95,938 5,717 4.26 10.72 5.98
National: 11/15/2018 10,389,469 9,642,091 92.81% 747,378 7.19% 3,409 15,283 9,068,623 2,630 573,468 1,653 399,599 2,239 174,513 1,595 81,400 1,316 91,866 5,850 4.31 10.67 6.01
National: 11/1/2018 10,430,700 9,704,256 93.04% 726,444 6.96% 3,487 15,359 9,145,544 2,561 558,712 1,631 391,872 2,232 166,858 1,619 78,460 1,340 89,254 5,976 4.24 10.39 5.79
National: 10/15/2018 10,433,737 9,714,884 93.11% 718,853 6.89% 3,629 16,625 9,135,472 2,540 579,412 1,549 390,883 2,592 166,088 2,067 75,380 1,382 86,502 6,495 4.25 10.31 5.74
National: 10/1/2018 10,420,885 9,713,057 93.21% 707,828 6.79% 3,629 15,552 9,144,488 2,451 568,569 1,426 386,103 2,643 163,526 1,860 73,225 1,385 84,974 5,787 4.18 10.17 5.68
National: 9/15/2018 10,614,542 9,898,920 93.26% 715,622 6.74% 3,629 16,027 9,316,482 2,470 582,438 1,765 395,813 2,653 161,931 1,743 73,361 1,272 84,517 6,124 4.19 10.11 5.58
National: 9/1/2018 10,618,324 9,908,063 93.31% 710,261 6.69% 3,629 17,327 9,326,770 3,054 581,293 1,911 393,545 2,691 160,104 1,889 72,822 1,158 83,790 6,624 4.18 10.07 5.51
National: 8/15/2018 10,535,058 9,834,583 93.35% 700,475 6.65% 3,650 19,044 9,250,826 3,782 583,757 2,230 386,256 2,628 159,710 2,000 72,086 1,386 82,423 7,018 4.22 10.09 5.41
National: 8/1/2018 10,489,290 9,794,085 93.37% 695,205 6.63% 3,973 19,187 9,220,590 3,944 573,495 2,274 382,998 2,804 159,382 1,766 72,046 1,459 80,779 6,940 4.18 10.10 5.32
National: 7/15/2018 10,433,332 9,731,231 93.27% 702,101 6.73% 5,273 18,466 9,153,411 3,730 577,820 1,945 391,282 2,553 160,867 1,804 71,793 1,358 78,159 7,076 4.20 10.18 5.32
National: 7/1/2018 10,389,124 9,694,697 93.32% 694,427 6.68% 4,580 16,976 9,123,324 3,050 571,373 1,678 387,898 2,184 159,125 1,821 70,887 1,349 76,517 6,894 4.19 10.14 5.27
National: 6/15/2018 10,317,842 9,641,275 93.44% 676,567 6.56% 4,776 16,240 9,078,056 2,670 563,219 1,533 380,741 2,364 154,033 1,616 68,772 1,341 73,021 6,716 4.17 10.00 5.08
National: 6/1/2018 10,086,361 9,438,791 93.58% 647,570 6.42% 5,060 15,976 8,896,281 2,117 542,510 1,624 366,907 2,536 146,134 1,658 65,506 1,303 69,023 6,738 4.10 9.83 4.98
National: 5/15/2018 9,902,438 9,291,922 93.83% 610,516 6.17% 5,045 15,733 8,751,332 2,319 540,590 1,598 347,460 2,196 136,718 1,570 61,107 1,472 65,231 6,578 4.08 9.63 4.83
National: 5/1/2018 9,959,866 9,366,287 94.04% 593,579 5.96% 4,469 15,899 8,827,509 2,359 538,778 1,513 338,269 2,286 133,962 1,710 58,708 1,361 62,640 6,670 4.10 9.39 4.70
National: 4/15/2018 9,191,237 8,741,702 95.11% 449,535 4.89% 4,598 15,830 8,273,900 2,303 467,802 1,584 259,226 2,193 97,554 1,889 42,740 1,023 50,015 6,838 4.00 7.96 4.52
National: 4/1/2018 10,072,702 9,487,014 94.19% 585,688 5.81% 4,468 16,075 8,939,526 2,451 547,488 1,452 343,923 2,332 130,459 1,695 52,669 1,164 58,637 6,981 4.13 9.08 4.41
National: 3/15/2018 9,685,050 9,132,281 94.29% 552,769 5.71% 4,435 16,331 8,589,608 2,638 542,673 1,561 324,467 2,418 122,733 1,412 49,858 1,414 55,711 6,888 4.17 8.97 4.36
National: 3/1/2018 9,590,907 9,053,783 94.40% 537,124 5.60% 4,635 16,291 8,533,804 2,451 519,979 1,832 315,519 2,199 117,541 1,581 48,962 1,378 55,102 6,850 4.19 8.86 4.30
National: 2/15/2018 9,525,326 8,996,942 94.45% 528,384 5.55% 5,091 17,150 8,476,365 2,796 520,577 1,907 307,218 1,873 117,154 1,789 48,864 1,535 55,148 7,250 4.22 8.82 4.29
National: 2/1/2018 9,456,691 8,931,091 94.44% 525,600 5.56% 5,095 18,090 8,436,197 3,042 494,894 1,560 299,175 2,157 119,773 1,953 50,476 1,764 56,176 7,614 4.26 8.83 4.33
National: 1/15/2018 9,586,328 9,008,273 93.97% 578,055 6.03% 5,707 19,155 8,479,022 2,485 529,251 1,277 333,155 2,972 130,181 2,356 55,220 1,784 59,499 8,281 4.60 9.27 4.75
National: 1/1/2018 9,533,544 8,925,588 93.62% 607,956 6.38% 5,506 19,765 8,387,210 2,541 538,378 1,676 351,858 3,169 136,808 2,300 58,193 1,853 61,097 8,226 4.79 9.59 4.95
National: 12/15/2017 9,160,395 8,591,282 93.79% 569,113 6.21% 4,295 20,835 8,082,539 3,165 508,743 2,313 322,026 3,063 132,281 2,216 56,619 1,899 58,187 8,179 4.78 9.43 4.91
National: 12/1/2017 9,160,450 8,600,192 93.88% 560,258 6.12% 4,686 21,895 8,101,997 3,981 498,195 2,283 315,069 3,019 131,646 2,297 56,533 2,178 57,010 8,137 4.76 9.35 4.81
National: 11/15/2017 9,154,233 8,596,360 93.91% 557,873 6.09% 5,482 22,403 8,064,859 3,886 531,501 2,545 320,503 3,240 128,444 2,525 55,449 2,920 53,477 7,287 4.85 9.31 4.77
National: 11/1/2017 9,184,572 8,631,848 93.98% 552,724 6.02% 4,878 22,113 8,114,577 3,625 511,879 2,245 318,765 3,275 123,829 2,923 53,624 2,877 51,742 7,168 4.76 8.29 4.44
National: 10/15/2017 9,508,369 8,940,061 94.02% 568,308 5.98% 4,759 23,275 8,265,423 3,620 565,959 2,656 328,754 3,482 126,159 3,803 52,056 2,635 51,153 7,079 4.86 9.20 4.41
National: 10/1/2017 9,348,715 8,801,626 94.15% 547,089 5.85% 4,636 23,147 8,252,016 4,137 549,610 2,047 324,222 3,900 123,558 3,779 49,846 2,454 49,463 6,830 4.81 9.00 4.56
National: 9/15/2017 9,051,453 8,516,453 94.09% 535,000 5.91% 4,519 23,669 7,974,409 3,687 542,044 2,878 320,877 4,897 118,015 3,310 48,532 1,918 47,576 6,979 4.83 9.06 4.61
National: 9/1/2017 9,089,856 8,560,222 94.17% 529,634 5.83% 4,046 23,819 8,026,624 4,574 533,598 2,904 319,626 4,873 115,895 3,125 47,684 1,524 46,429 6,819 4.77 8.97 4.45
National: 8/15/2017 8,958,717 8,436,837 94.17% 521,880 5.83% 4,105 23,384 7,892,680 4,634 544,157 3,429 314,030 4,527 114,830 2,293 46,322 1,690 46,698 6,811 4.86 8.98 4.44
National: 8/1/2017 8,900,173 8,387,264 94.24% 512,909 5.76% 3,838 23,344 7,859,351 5,334 527,913 2,748 306,044 4,382 114,888 2,150 46,141 1,802 45,836 6,928 4.81 8.91 4.34
National: 7/15/2017 9,024,312 8,493,349 94.12% 530,963 5.88% 3,550 22,424 7,942,174 4,770 551,175 3,683 318,862 3,118 119,335 2,241 46,890 1,945 45,876 6,667 4.90 8.99 4.36
National: 7/1/2017 8,936,368 8,412,893 94.14% 523,475 5.86% 3,665 20,755 7,875,844 4,924 537,049 2,370 312,589 2,749 118,175 2,304 46,857 1,892 45,854 6,516 4.91 8.93 4.32
National: 6/15/2017 8,591,321 8,088,703 94.15% 502,618 5.85% 3,985 20,260 7,570,141 3,800 518,562 2,121 297,199 3,318 114,596 2,594 46,104 1,861 44,719 6,566 4.96 8.90 4.27
National: 6/1/2017 8,542,067 8,041,987 94.15% 500,080 5.85% 3,813 21,043 7,534,005 3,873 507,982 2,382 295,514 3,625 113,309 2,799 46,617 1,978 44,640 6,305 4.99 8.87 4.18
National: 5/15/2017 8,481,214 7,993,925 94.25% 487,289 5.75% 4,149 21,439 7,476,821 4,034 517,104 2,531 286,344 4,021 110,792 2,805 46,293 1,719 43,860 6,320 4.96 8.80 4.04
National: 5/1/2017 8,428,815 7,949,787 94.32% 479,028 5.68% 4,283 21,891 7,448,568 4,401 501,219 2,457 280,265 4,341 109,615 2,793 46,035 1,545 43,113 6,349 4.93 8.71 3.93
National: 4/15/2017 8,592,740 8,102,024 94.29% 490,716 5.71% 4,244 22,383 7,574,365 4,664 527,659 3,292 290,487 3,999 111,567 2,541 45,541 1,554 43,121 6,271 4.96 8.74 3.96
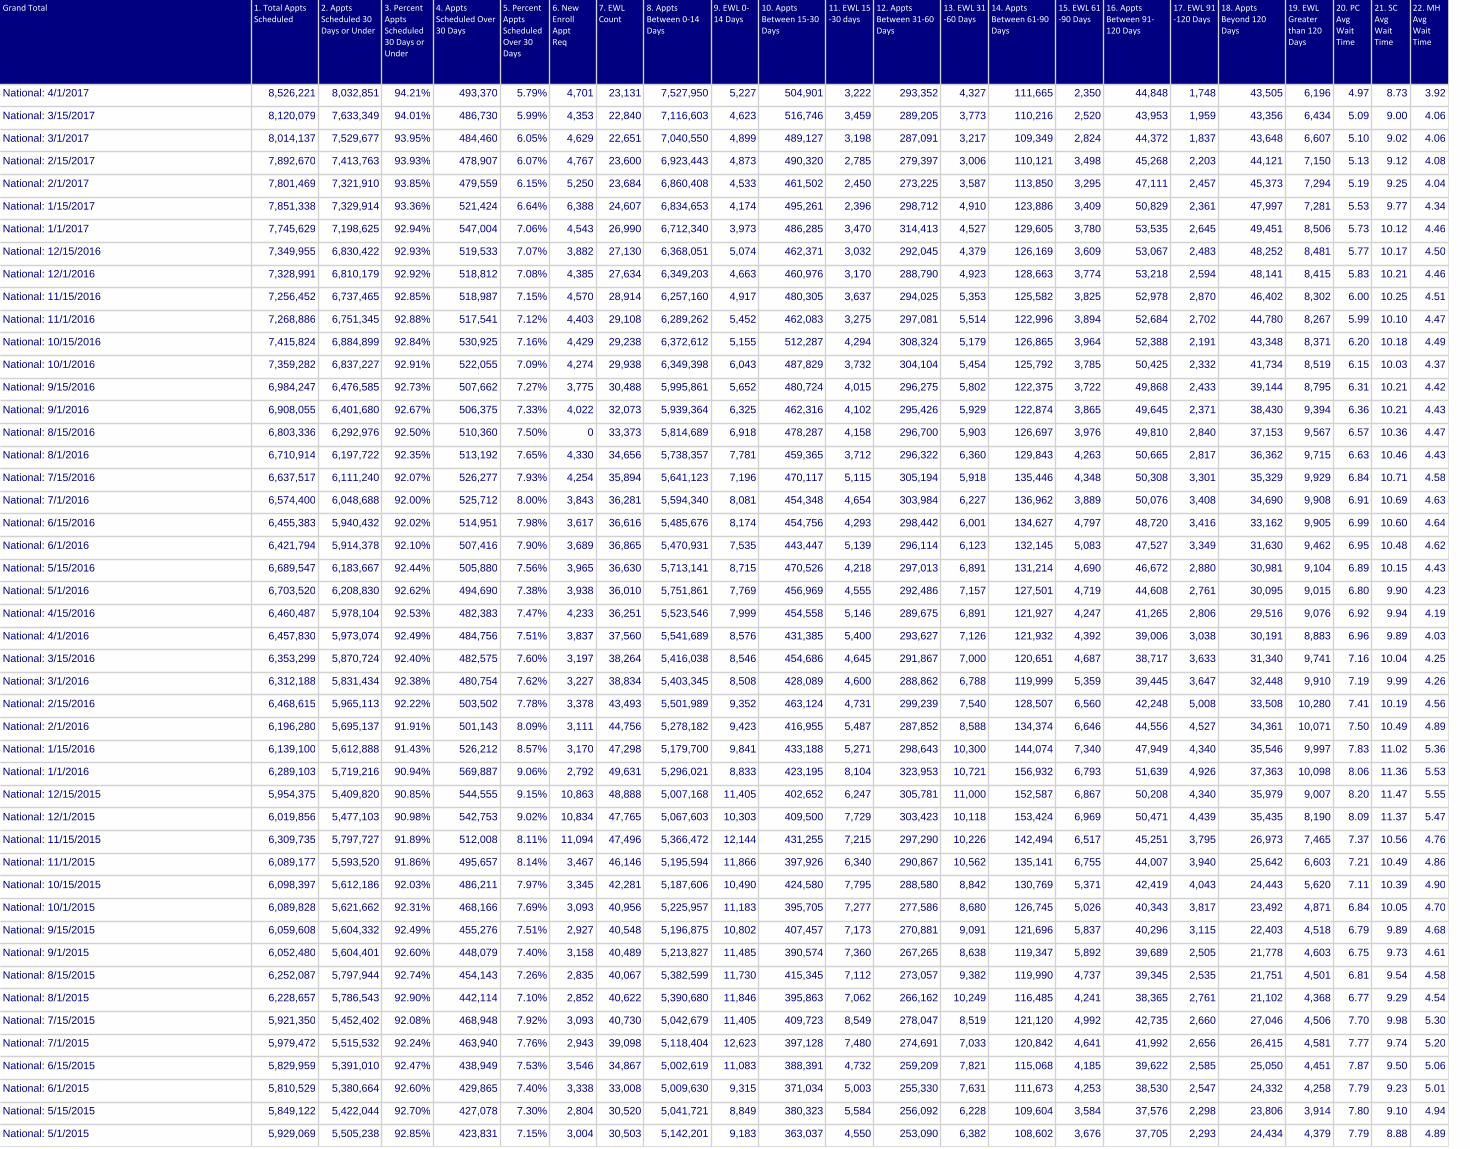
Grand Total 1. Total Appts Scheduled
2. Appts Scheduled 30 Days or Under
3. Percent Appts Scheduled 30 Days or Under
4. Appts Scheduled Over 30 Days
5. Percent Appts Scheduled Over 30 Days
6. New Enroll Appt Req
7. EWL Count
8. Appts Between 0-14 Days
9. EWL 0-14 Days
10. Appts Between 15-30 Days
11. EWL 15 -30 days
12. Appts Between 31-60 Days
13. EWL 31 -60 Days
14. Appts Between 61-90 Days
15. EWL 61 -90 Days
16. Appts Between 91-120 Days
17. EWL 91 -120 Days
18. Appts Beyond 120 Days
19. EWL Greater than 120 Days
20. PC Avg Wait Time
21. SC Avg Wait Time
22. MH Avg Wait Time
National: 4/1/2017 8,526,221 8,032,851 94.21% 493,370 5.79% 4,701 23,131 7,527,950 5,227 504,901 3,222 293,352 4,327 111,665 2,350 44,848 1,748 43,505 6,196 4.97 8.73 3.92
National: 3/15/2017 8,120,079 7,633,349 94.01% 486,730 5.99% 4,353 22,840 7,116,603 4,623 516,746 3,459 289,205 3,773 110,216 2,520 43,953 1,959 43,356 6,434 5.09 9.00 4.06
National: 3/1/2017 8,014,137 7,529,677 93.95% 484,460 6.05% 4,629 22,651 7,040,550 4,899 489,127 3,198 287,091 3,217 109,349 2,824 44,372 1,837 43,648 6,607 5.10 9.02 4.06
National: 2/15/2017 7,892,670 7,413,763 93.93% 478,907 6.07% 4,767 23,600 6,923,443 4,873 490,320 2,785 279,397 3,006 110,121 3,498 45,268 2,203 44,121 7,150 5.13 9.12 4.08
National: 2/1/2017 7,801,469 7,321,910 93.85% 479,559 6.15% 5,250 23,684 6,860,408 4,533 461,502 2,450 273,225 3,587 113,850 3,295 47,111 2,457 45,373 7,294 5.19 9.25 4.04
National: 1/15/2017 7,851,338 7,329,914 93.36% 521,424 6.64% 6,388 24,607 6,834,653 4,174 495,261 2,396 298,712 4,910 123,886 3,409 50,829 2,361 47,997 7,281 5.53 9.77 4.34
National: 1/1/2017 7,745,629 7,198,625 92.94% 547,004 7.06% 4,543 26,990 6,712,340 3,973 486,285 3,470 314,413 4,527 129,605 3,780 53,535 2,645 49,451 8,506 5.73 10.12 4.46
National: 12/15/2016 7,349,955 6,830,422 92.93% 519,533 7.07% 3,882 27,130 6,368,051 5,074 462,371 3,032 292,045 4,379 126,169 3,609 53,067 2,483 48,252 8,481 5.77 10.17 4.50
National: 12/1/2016 7,328,991 6,810,179 92.92% 518,812 7.08% 4,385 27,634 6,349,203 4,663 460,976 3,170 288,790 4,923 128,663 3,774 53,218 2,594 48,141 8,415 5.83 10.21 4.46
National: 11/15/2016 7,256,452 6,737,465 92.85% 518,987 7.15% 4,570 28,914 6,257,160 4,917 480,305 3,637 294,025 5,353 125,582 3,825 52,978 2,870 46,402 8,302 6.00 10.25 4.51
National: 11/1/2016 7,268,886 6,751,345 92.88% 517,541 7.12% 4,403 29,108 6,289,262 5,452 462,083 3,275 297,081 5,514 122,996 3,894 52,684 2,702 44,780 8,267 5.99 10.10 4.47
National: 10/15/2016 7,415,824 6,884,899 92.84% 530,925 7.16% 4,429 29,238 6,372,612 5,155 512,287 4,294 308,324 5,179 126,865 3,964 52,388 2,191 43,348 8,371 6.20 10.18 4.49
National: 10/1/2016 7,359,282 6,837,227 92.91% 522,055 7.09% 4,274 29,938 6,349,398 6,043 487,829 3,732 304,104 5,454 125,792 3,785 50,425 2,332 41,734 8,519 6.15 10.03 4.37
National: 9/15/2016 6,984,247 6,476,585 92.73% 507,662 7.27% 3,775 30,488 5,995,861 5,652 480,724 4,015 296,275 5,802 122,375 3,722 49,868 2,433 39,144 8,795 6.31 10.21 4.42
National: 9/1/2016 6,908,055 6,401,680 92.67% 506,375 7.33% 4,022 32,073 5,939,364 6,325 462,316 4,102 295,426 5,929 122,874 3,865 49,645 2,371 38,430 9,394 6.36 10.21 4.43
National: 8/15/2016 6,803,336 6,292,976 92.50% 510,360 7.50% 0 33,373 5,814,689 6,918 478,287 4,158 296,700 5,903 126,697 3,976 49,810 2,840 37,153 9,567 6.57 10.36 4.47
National: 8/1/2016 6,710,914 6,197,722 92.35% 513,192 7.65% 4,330 34,656 5,738,357 7,781 459,365 3,712 296,322 6,360 129,843 4,263 50,665 2,817 36,362 9,715 6.63 10.46 4.43
National: 7/15/2016 6,637,517 6,111,240 92.07% 526,277 7.93% 4,254 35,894 5,641,123 7,196 470,117 5,115 305,194 5,918 135,446 4,348 50,308 3,301 35,329 9,929 6.84 10.71 4.58
National: 7/1/2016 6,574,400 6,048,688 92.00% 525,712 8.00% 3,843 36,281 5,594,340 8,081 454,348 4,654 303,984 6,227 136,962 3,889 50,076 3,408 34,690 9,908 6.91 10.69 4.63
National: 6/15/2016 6,455,383 5,940,432 92.02% 514,951 7.98% 3,617 36,616 5,485,676 8,174 454,756 4,293 298,442 6,001 134,627 4,797 48,720 3,416 33,162 9,905 6.99 10.60 4.64
National: 6/1/2016 6,421,794 5,914,378 92.10% 507,416 7.90% 3,689 36,865 5,470,931 7,535 443,447 5,139 296,114 6,123 132,145 5,083 47,527 3,349 31,630 9,462 6.95 10.48 4.62
National: 5/15/2016 6,689,547 6,183,667 92.44% 505,880 7.56% 3,965 36,630 5,713,141 8,715 470,526 4,218 297,013 6,891 131,214 4,690 46,672 2,880 30,981 9,104 6.89 10.15 4.43
National: 5/1/2016 6,703,520 6,208,830 92.62% 494,690 7.38% 3,938 36,010 5,751,861 7,769 456,969 4,555 292,486 7,157 127,501 4,719 44,608 2,761 30,095 9,015 6.80 9.90 4.23
National: 4/15/2016 6,460,487 5,978,104 92.53% 482,383 7.47% 4,233 36,251 5,523,546 7,999 454,558 5,146 289,675 6,891 121,927 4,247 41,265 2,806 29,516 9,076 6.92 9.94 4.19
National: 4/1/2016 6,457,830 5,973,074 92.49% 484,756 7.51% 3,837 37,560 5,541,689 8,576 431,385 5,400 293,627 7,126 121,932 4,392 39,006 3,038 30,191 8,883 6.96 9.89 4.03
National: 3/15/2016 6,353,299 5,870,724 92.40% 482,575 7.60% 3,197 38,264 5,416,038 8,546 454,686 4,645 291,867 7,000 120,651 4,687 38,717 3,633 31,340 9,741 7.16 10.04 4.25
National: 3/1/2016 6,312,188 5,831,434 92.38% 480,754 7.62% 3,227 38,834 5,403,345 8,508 428,089 4,600 288,862 6,788 119,999 5,359 39,445 3,647 32,448 9,910 7.19 9.99 4.26
National: 2/15/2016 6,468,615 5,965,113 92.22% 503,502 7.78% 3,378 43,493 5,501,989 9,352 463,124 4,731 299,239 7,540 128,507 6,560 42,248 5,008 33,508 10,280 7.41 10.19 4.56
National: 2/1/2016 6,196,280 5,695,137 91.91% 501,143 8.09% 3,111 44,756 5,278,182 9,423 416,955 5,487 287,852 8,588 134,374 6,646 44,556 4,527 34,361 10,071 7.50 10.49 4.89
National: 1/15/2016 6,139,100 5,612,888 91.43% 526,212 8.57% 3,170 47,298 5,179,700 9,841 433,188 5,271 298,643 10,300 144,074 7,340 47,949 4,340 35,546 9,997 7.83 11.02 5.36
National: 1/1/2016 6,289,103 5,719,216 90.94% 569,887 9.06% 2,792 49,631 5,296,021 8,833 423,195 8,104 323,953 10,721 156,932 6,793 51,639 4,926 37,363 10,098 8.06 11.36 5.53
National: 12/15/2015 5,954,375 5,409,820 90.85% 544,555 9.15% 10,863 48,888 5,007,168 11,405 402,652 6,247 305,781 11,000 152,587 6,867 50,208 4,340 35,979 9,007 8.20 11.47 5.55
National: 12/1/2015 6,019,856 5,477,103 90.98% 542,753 9.02% 10,834 47,765 5,067,603 10,303 409,500 7,729 303,423 10,118 153,424 6,969 50,471 4,439 35,435 8,190 8.09 11.37 5.47
National: 11/15/2015 6,309,735 5,797,727 91.89% 512,008 8.11% 11,094 47,496 5,366,472 12,144 431,255 7,215 297,290 10,226 142,494 6,517 45,251 3,795 26,973 7,465 7.37 10.56 4.76
National: 11/1/2015 6,089,177 5,593,520 91.86% 495,657 8.14% 3,467 46,146 5,195,594 11,866 397,926 6,340 290,867 10,562 135,141 6,755 44,007 3,940 25,642 6,603 7.21 10.49 4.86
National: 10/15/2015 6,098,397 5,612,186 92.03% 486,211 7.97% 3,345 42,281 5,187,606 10,490 424,580 7,795 288,580 8,842 130,769 5,371 42,419 4,043 24,443 5,620 7.11 10.39 4.90
National: 10/1/2015 6,089,828 5,621,662 92.31% 468,166 7.69% 3,093 40,956 5,225,957 11,183 395,705 7,277 277,586 8,680 126,745 5,026 40,343 3,817 23,492 4,871 6.84 10.05 4.70
National: 9/15/2015 6,059,608 5,604,332 92.49% 455,276 7.51% 2,927 40,548 5,196,875 10,802 407,457 7,173 270,881 9,091 121,696 5,837 40,296 3,115 22,403 4,518 6.79 9.89 4.68
National: 9/1/2015 6,052,480 5,604,401 92.60% 448,079 7.40% 3,158 40,489 5,213,827 11,485 390,574 7,360 267,265 8,638 119,347 5,892 39,689 2,505 21,778 4,603 6.75 9.73 4.61
National: 8/15/2015 6,252,087 5,797,944 92.74% 454,143 7.26% 2,835 40,067 5,382,599 11,730 415,345 7,112 273,057 9,382 119,990 4,737 39,345 2,535 21,751 4,501 6.81 9.54 4.58
National: 8/1/2015 6,228,657 5,786,543 92.90% 442,114 7.10% 2,852 40,622 5,390,680 11,846 395,863 7,062 266,162 10,249 116,485 4,241 38,365 2,761 21,102 4,368 6.77 9.29 4.54
National: 7/15/2015 5,921,350 5,452,402 92.08% 468,948 7.92% 3,093 40,730 5,042,679 11,405 409,723 8,549 278,047 8,519 121,120 4,992 42,735 2,660 27,046 4,506 7.70 9.98 5.30
National: 7/1/2015 5,979,472 5,515,532 92.24% 463,940 7.76% 2,943 39,098 5,118,404 12,623 397,128 7,480 274,691 7,033 120,842 4,641 41,992 2,656 26,415 4,581 7.77 9.74 5.20
National: 6/15/2015 5,829,959 5,391,010 92.47% 438,949 7.53% 3,546 34,867 5,002,619 11,083 388,391 4,732 259,209 7,821 115,068 4,185 39,622 2,585 25,050 4,451 7.87 9.50 5.06
National: 6/1/2015 5,810,529 5,380,664 92.60% 429,865 7.40% 3,338 33,008 5,009,630 9,315 371,034 5,003 255,330 7,631 111,673 4,253 38,530 2,547 24,332 4,258 7.79 9.23 5.01
National: 5/15/2015 5,849,122 5,422,044 92.70% 427,078 7.30% 2,804 30,520 5,041,721 8,849 380,323 5,584 256,092 6,228 109,604 3,584 37,576 2,298 23,806 3,914 7.80 9.10 4.94
National: 5/1/2015 5,929,069 5,505,238 92.85% 423,831 7.15% 3,004 30,503 5,142,201 9,183 363,037 4,550 253,090 6,382 108,602 3,676 37,705 2,293 24,434 4,379 7.79 8.88 4.89
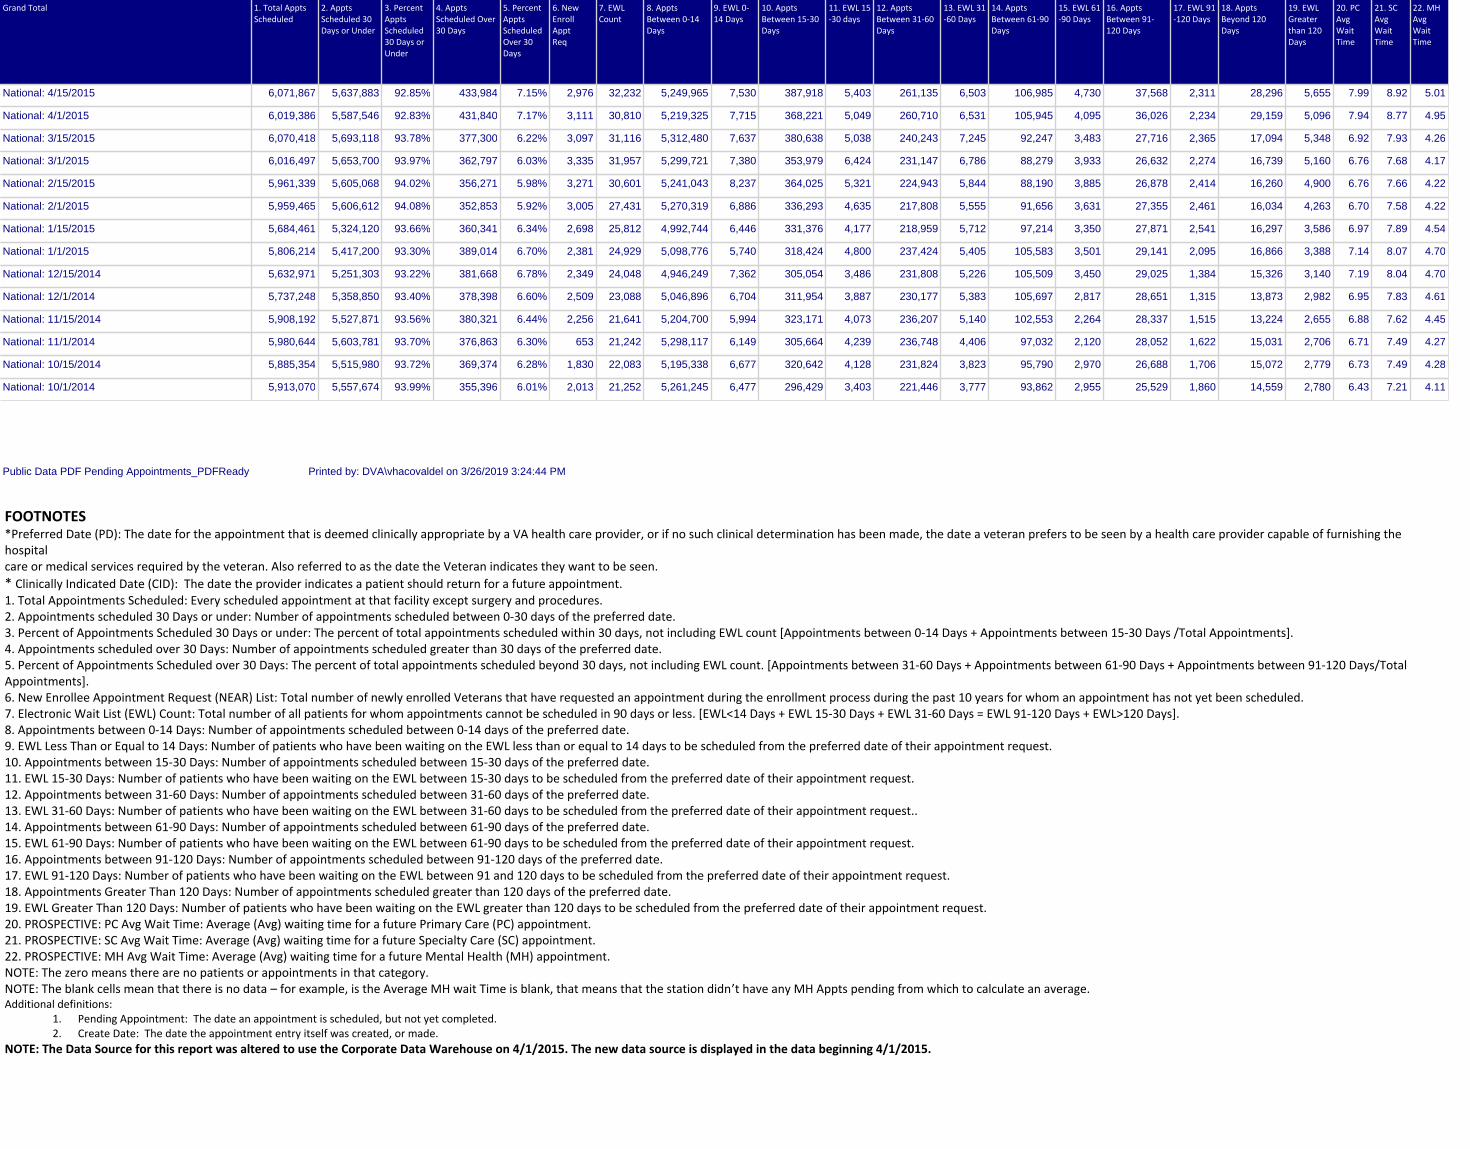
Grand Total 1. Total Appts Scheduled
2. Appts Scheduled 30 Days or Under
3. Percent Appts Scheduled 30 Days or Under
4. Appts Scheduled Over 30 Days
5. Percent Appts Scheduled Over 30 Days
6. New Enroll Appt Req
7. EWL Count
8. Appts Between 0-14 Days
9. EWL 0-14 Days
10. Appts Between 15-30 Days
11. EWL 15 -30 days
12. Appts Between 31-60 Days
13. EWL 31 -60 Days
14. Appts Between 61-90 Days
15. EWL 61 -90 Days
16. Appts Between 91-120 Days
17. EWL 91 -120 Days
18. Appts Beyond 120 Days
19. EWL Greater than 120 Days
20. PC Avg Wait Time
21. SC Avg Wait Time
22. MH Avg Wait Time
National: 4/15/2015 6,071,867 5,637,883 92.85% 433,984 7.15% 2,976 32,232 5,249,965 7,530 387,918 5,403 261,135 6,503 106,985 4,730 37,568 2,311 28,296 5,655 7.99 8.92 5.01
National: 4/1/2015 6,019,386 5,587,546 92.83% 431,840 7.17% 3,111 30,810 5,219,325 7,715 368,221 5,049 260,710 6,531 105,945 4,095 36,026 2,234 29,159 5,096 7.94 8.77 4.95
National: 3/15/2015 6,070,418 5,693,118 93.78% 377,300 6.22% 3,097 31,116 5,312,480 7,637 380,638 5,038 240,243 7,245 92,247 3,483 27,716 2,365 17,094 5,348 6.92 7.93 4.26
National: 3/1/2015 6,016,497 5,653,700 93.97% 362,797 6.03% 3,335 31,957 5,299,721 7,380 353,979 6,424 231,147 6,786 88,279 3,933 26,632 2,274 16,739 5,160 6.76 7.68 4.17
National: 2/15/2015 5,961,339 5,605,068 94.02% 356,271 5.98% 3,271 30,601 5,241,043 8,237 364,025 5,321 224,943 5,844 88,190 3,885 26,878 2,414 16,260 4,900 6.76 7.66 4.22
National: 2/1/2015 5,959,465 5,606,612 94.08% 352,853 5.92% 3,005 27,431 5,270,319 6,886 336,293 4,635 217,808 5,555 91,656 3,631 27,355 2,461 16,034 4,263 6.70 7.58 4.22
National: 1/15/2015 5,684,461 5,324,120 93.66% 360,341 6.34% 2,698 25,812 4,992,744 6,446 331,376 4,177 218,959 5,712 97,214 3,350 27,871 2,541 16,297 3,586 6.97 7.89 4.54
National: 1/1/2015 5,806,214 5,417,200 93.30% 389,014 6.70% 2,381 24,929 5,098,776 5,740 318,424 4,800 237,424 5,405 105,583 3,501 29,141 2,095 16,866 3,388 7.14 8.07 4.70
National: 12/15/2014 5,632,971 5,251,303 93.22% 381,668 6.78% 2,349 24,048 4,946,249 7,362 305,054 3,486 231,808 5,226 105,509 3,450 29,025 1,384 15,326 3,140 7.19 8.04 4.70
National: 12/1/2014 5,737,248 5,358,850 93.40% 378,398 6.60% 2,509 23,088 5,046,896 6,704 311,954 3,887 230,177 5,383 105,697 2,817 28,651 1,315 13,873 2,982 6.95 7.83 4.61
National: 11/15/2014 5,908,192 5,527,871 93.56% 380,321 6.44% 2,256 21,641 5,204,700 5,994 323,171 4,073 236,207 5,140 102,553 2,264 28,337 1,515 13,224 2,655 6.88 7.62 4.45
National: 11/1/2014 5,980,644 5,603,781 93.70% 376,863 6.30% 653 21,242 5,298,117 6,149 305,664 4,239 236,748 4,406 97,032 2,120 28,052 1,622 15,031 2,706 6.71 7.49 4.27
National: 10/15/2014 5,885,354 5,515,980 93.72% 369,374 6.28% 1,830 22,083 5,195,338 6,677 320,642 4,128 231,824 3,823 95,790 2,970 26,688 1,706 15,072 2,779 6.73 7.49 4.28
National: 10/1/2014 5,913,070 5,557,674 93.99% 355,396 6.01% 2,013 21,252 5,261,245 6,477 296,429 3,403 221,446 3,777 93,862 2,955 25,529 1,860 14,559 2,780 6.43 7.21 4.11
Public Data PDF Pending Appointments_PDFReady Printed by: DVA\vhacovaldel on 3/26/2019 3:24:44 PM
FOOTNOTES *Preferred Date (PD): The date for the appointment that is deemed clinically appropriate by a VA health care provider, or if no such clinical determination has been made, the date a veteran prefers to be seen by a health care provider capable of furnishing the hospital care or medical services required by the veteran. Also referred to as the date the Veteran indicates they want to be seen. * Clinically Indicated Date (CID): The date the provider indicates a patient should return for a future appointment. 1. Total Appointments Scheduled: Every scheduled appointment at that facility except surgery and procedures. 2. Appointments scheduled 30 Days or under: Number of appointments scheduled between 0-30 days of the preferred date. 3. Percent of Appointments Scheduled 30 Days or under: The percent of total appointments scheduled within 30 days, not including EWL count [Appointments between 0-14 Days + Appointments between 15-30 Days /Total Appointments]. 4. Appointments scheduled over 30 Days: Number of appointments scheduled greater than 30 days of the preferred date. 5. Percent of Appointments Scheduled over 30 Days: The percent of total appointments scheduled beyond 30 days, not including EWL count. [Appointments between 31-60 Days + Appointments between 61-90 Days + Appointments between 91-120 Days/Total Appointments]. 6. New Enrollee Appointment Request (NEAR) List: Total number of newly enrolled Veterans that have requested an appointment during the enrollment process during the past 10 years for whom an appointment has not yet been scheduled. 7. Electronic Wait List (EWL) Count: Total number of all patients for whom appointments cannot be scheduled in 90 days or less. [EWL<14 Days + EWL 15-30 Days + EWL 31-60 Days = EWL 91-120 Days + EWL>120 Days]. 8. Appointments between 0-14 Days: Number of appointments scheduled between 0-14 days of the preferred date. 9. EWL Less Than or Equal to 14 Days: Number of patients who have been waiting on the EWL less than or equal to 14 days to be scheduled from the preferred date of their appointment request. 10. Appointments between 15-30 Days: Number of appointments scheduled between 15-30 days of the preferred date. 11. EWL 15-30 Days: Number of patients who have been waiting on the EWL between 15-30 days to be scheduled from the preferred date of their appointment request. 12. Appointments between 31-60 Days: Number of appointments scheduled between 31-60 days of the preferred date. 13. EWL 31-60 Days: Number of patients who have been waiting on the EWL between 31-60 days to be scheduled from the preferred date of their appointment request.. 14. Appointments between 61-90 Days: Number of appointments scheduled between 61-90 days of the preferred date. 15. EWL 61-90 Days: Number of patients who have been waiting on the EWL between 61-90 days to be scheduled from the preferred date of their appointment request. 16. Appointments between 91-120 Days: Number of appointments scheduled between 91-120 days of the preferred date. 17. EWL 91-120 Days: Number of patients who have been waiting on the EWL between 91 and 120 days to be scheduled from the preferred date of their appointment request. 18. Appointments Greater Than 120 Days: Number of appointments scheduled greater than 120 days of the preferred date. 19. EWL Greater Than 120 Days: Number of patients who have been waiting on the EWL greater than 120 days to be scheduled from the preferred date of their appointment request. 20. PROSPECTIVE: PC Avg Wait Time: Average (Avg) waiting time for a future Primary Care (PC) appointment. 21. PROSPECTIVE: SC Avg Wait Time: Average (Avg) waiting time for a future Specialty Care (SC) appointment. 22. PROSPECTIVE: MH Avg Wait Time: Average (Avg) waiting time for a future Mental Health (MH) appointment. NOTE: The zero means there are no patients or appointments in that category. NOTE: The blank cells mean that there is no data – for example, is the Average MH wait Time is blank, that means that the station didn’t have any MH Appts pending from which to calculate an average. Additional definitions:
1. Pending Appointment: The date an appointment is scheduled, but not yet completed. 2. Create Date: The date the appointment entry itself was created, or made.
NOTE: The Data Source for this report was altered to use the Corporate Data Warehouse on 4/1/2015. The new data source is displayed in the data beginning 4/1/2015.