Pembina Pipeline Corporation Files/2017… · Pembina Pipeline Corporation 4 Operating expenses...
119
Pembina Pipeline Corporation 2017 ANNUAL REPORT Building Something Extraordinary
Transcript of Pembina Pipeline Corporation Files/2017… · Pembina Pipeline Corporation 4 Operating expenses...

Pembina Pipeline Corporation
Building Something Extraordinary
2017 ANNUAL R EPO RT
Building Something Extraordinary

Management’s Discussion & Analysis
Pembina Pipeline Corporation
1
MANAGEMENT'S DISCUSSION AND ANALYSIS
The following Management's Discussion and Analysis ("MD&A") of the financial and operating results of Pembina Pipeline
Corporation ("Pembina" or the "Company") is dated February 22, 2018 and is supplementary to, and should be read in
conjunction with, Pembina's audited annual consolidated Financial Statements for the period ended December 31, 2017
("Financial Statements"). All dollar amounts contained in this MD&A are expressed in Canadian dollars unless otherwise
noted.
Management is responsible for preparing the MD&A. This MD&A has been approved by Pembina's Board of Directors.
This MD&A contains forward-looking statements (see "Forward-Looking Statements & Information") and refers to financial
measures that are not defined by Generally Accepted Accounting Principles ("GAAP"). For more information about the
measures which are not defined by GAAP, see "Non-GAAP Measures."
Readers should refer to page 49 for a list of abbreviations that may be used in this MD&A.
About Pembina
Calgary-based Pembina Pipeline Corporation is a leading transportation and midstream service provider that has been
serving North America's energy industry for over 60 years. Pembina owns an integrated system of pipelines that transport
various hydrocarbon liquids and natural gas products produced primarily in western Canada. The Company also owns gas
gathering and processing facilities and an oil and natural gas liquids infrastructure and logistics business. Pembina's
integrated assets and commercial operations along the majority of the hydrocarbon value chain allow it to offer a full
spectrum of midstream and marketing services to the energy sector.
Pembina is committed to working with its community and aboriginal neighbours, while providing value for investors in a
safe, environmentally-responsible manner. This balanced approach to operating ensures the trust Pembina builds among
all of its stakeholders is sustainable over the long term.
Pembina's common shares trade on the Toronto and New York stock exchanges under PPL and PBA, respectively. For more
information, visit www.pembina.com.
Pembina's goal is to provide highly competitive and reliable returns to investors through monthly dividends on its common
shares while enhancing the long-term value of its securities. To achieve this, Pembina's strategy is to:
• Preserve value by providing safe, responsible, cost-effective and reliable services;
• Diversify the Company's asset base along the hydrocarbon value chain by providing integrated service offerings
which enhance profitability;
• Pursue projects or assets that are expected to generate increased cash flow per share and capture long-life,
economic hydrocarbon reserves; and
• Maintain a strong balance sheet through the application of prudent financial management to all business
decisions.
Pembina is structured into five businesses: Conventional Pipelines, Oil Sands & Heavy Oil, Gas Services, Midstream and
Veresen, which are described in their respective sections of this MD&A.
Pembina Pipeline Corporation
2
Acquisition of Veresen Inc. ("Veresen")
On October 2, 2017 (the "Acquisition Date"), Pembina completed its acquisition of Veresen by way of a plan of
arrangement pursuant to Section 193 of the Business Corporations Act (Alberta) (the "Acquisition"). Total consideration of
$6.4 billion was comprised of $1.5 billion in cash, $4.4 billion of Pembina common shares and $522 million of Pembina
preferred shares.
The operational and financial results contained in this MD&A and the Financial Statements include Pembina's post-
Acquisition results for the 91-day period from October 2, 2017 to December 31, 2017. Operational and financial results
from Veresen are not reflected in Pembina's operational and financial results prior to October 2, 2017. The results of the
business acquired through the Acquisition are reported as a standalone segment. In combination with future integration
efforts, it can be expected that the acquired assets will be re-allocated to other operating segments in the first quarter of
2018.
Assets acquired in the Acquisition include the following:
• A pipeline transportation business comprised of interests in three pipeline systems:
o 100 percent interest in the Alberta Ethane Gathering System ("AEGS") with capacity of 330 mbpd;
o 50 percent interest in the Alliance Pipeline (''Alliance'') with capacity of 1,600 MMcf/d gross (800 MMcf/d
net);
o 50 percent convertible preferred interest in the Ruby Pipeline ("Ruby") with capacity of 1,500 MMcf/d gross
(750 MMcf/d net) which entitles Pembina to a US$91 million distribution per year;
• A gas service business comprised of:
o 46.3 percent interest (as of December 31, 2017) in Veresen Midstream ("Veresen Midstream"), which owns
assets in western Canada serving the Montney geological play in northwestern Alberta and northeastern B.C.
including gas processing plants with capacity of 1,516 MMcf/d gross (702 MMcf/d net), as well as gas
gathering pipelines and compression;
• An ownership interest in Aux Sable (approximately 42.7 percent in Aux Sable U.S. and 50 percent in Aux Sable
Canada) (combined, "Aux Sable"), which includes a 131 mbpd gross (56 mbpd net) NGL fractionation facility and
gas processing capacity of 2.1 bcf/d gross (0.897 bcf/d net) near Chicago, Illinois and other natural gas and NGL
processing facilities, logistics and distribution assets in the U.S. and Canada, as well as transportation contracts on
Alliance;
• A wholly-owned 1 mmbbls barrel ethane storage facility under construction near Burstall, Saskatchewan; and
• A 75 percent jointly controlled interest in Grand Valley 1 Limited Partnership ("Grand Valley").

Pembina Pipeline Corporation
3
Financial & Operating Overview
3 Months Ended
December 31 (unaudited)
12 Months Ended December 31
($ millions, except where noted) 2017 2016 2017 2016
Revenue 1,716 1,251 5,408 4,265
Net revenue(1) 709 514 2,246 1,764
Operating expense 130 123 450 419
Realized loss on commodity-related derivative financial instruments 42 15 94 10
Share of profit of investments in equity accounted investees 116 116 1
Depreciation and amortization included in operations 112 73 359 273
Unrealized (gain) loss on commodity-related derivative financial instruments (14 ) 33 (23 ) 61
Gross profit 555 270 1,482 1,002
General and administrative expenses (excluding corporate depreciation) and other expenses
57 44 213 175
Other expense (income) 16 (6 ) 28 (1 )
Net finance costs (income) 71 38 185 153
Current income tax expense 29 12 48 50
Deferred tax (recovery) expense (70 ) 46 94 139
Total tax (recovery) expense (41 ) 58 142 189
Earnings 445 131 891 466
Earnings per common share – basic (dollars) 0.83 0.29 1.89 1.02
Earnings per common share – diluted (dollars) 0.83 0.28 1.88 1.01
Cash flow from operating activities 523 286 1,513 1,077
Cash flow from operating activities per common share – basic (dollars)(1) 1.04 0.73 3.55 2.78
Adjusted cash flow from operating activities(1) 499 292 1,396 986
Adjusted cash flow from operating activities per common share – basic (dollars)(1) 0.99 0.74 3.27 2.54
Common share dividends declared 272 190 873 737
Dividends per common share (dollars) 0.54 0.48 2.04 1.90
Preferred share dividends declared 26 19 83 69
Capital expenditures 314 453 1,839 1,745
Acquisitions 6,400 6,400 566
Proportionately Consolidated Financial Overview
Total Volume (mboe/d) 2,917 1,941 2,300 1,907
Operating Margin(1) 749 382 1,930 1,357
Adjusted EBITDA(1) 674 342 1,705 1,189 (1) Refer to "Non-GAAP Measures."
Financial Overview
Pembina delivered strong financial and operational results in the fourth quarter of 2017. Revenue in the fourth quarter of
2017 was $1.7 billion compared to $1.3 billion for the same period in 2016. Full year revenue was $5.4 billion for 2017
compared to $4.3 billion for the same period in 2016. The increases in revenue for the quarter and full year were driven by
a larger asset base generating higher revenue volumes and improvements in NGL market pricing. Net revenue (revenue
less cost of goods sold including product purchases) was $709 million for the fourth quarter of 2017 compared to $514
million in the same period of 2016 and $2.2 billion year-to-date in 2017 compared to $1.8 billion for the same period in
2016. These increases were driven by higher revenue and sales volumes from new assets being placed into service and
improvements in commodity prices and margins in the current period.

Pembina Pipeline Corporation
4
Operating expenses were $130 million for the fourth quarter of 2017 compared to $123 million during the same period of
2016. For the year ended December 31, 2017, operating expenses were $450 million compared to $419 million in the
same period of 2016. These increases were predominantly driven by a larger asset base which resulted in higher power,
labour and repairs and maintenance expenses partially offset by lower integrity spending.
Share of profit of investments in equity accounted investees represents net earnings from investments in equity accounted
investees primarily including Alliance, Ruby, Aux Sable and Veresen Midstream. Share of profit of investments in equity
accounted investees was $116 million in the fourth quarter and full-year of 2017 as compared to nil and $1 million in
2016, respectively. The increases in the current year were driven by the Acquisition which closed in the fourth quarter of
2017.
Depreciation and amortization included in operations during the fourth quarter of 2017 was $112 million compared to $73
million for the same period in 2016. For the year ended December 31, 2017, depreciation and amortization included in
operations was $359 million compared to $273 million in 2016. These increases were largely the result of the year-over-
year growth in Pembina's asset base with the Company's pipeline system expansions and new fractionation facilities and
gas processing plants which were placed into service. In addition, certain useful life adjustments were made in addition to
the increased asset base as a result of the Acquisition.
Gross profit for the fourth quarter of 2017 was $555 million compared to $270 million during the fourth quarter of 2016.
This 106 percent increase was driven by the Acquisition and stronger performance from the Midstream, Conventional
Pipelines and Gas Services businesses resulting from increases in volume and revenues due to new assets placed into
service within these businesses. Also impacting this is higher gross profit in the Midstream business driven by
improvements in commodity prices in the current year and an unrealized gain on the market-to-market positions of
commodity-related derivative financial instruments of $14 million for the fourth quarter of 2017 compared to a loss of $33
million for the fourth quarter of 2016. These increases were partially offset by increased depreciation and amortization as
noted above and an increase in the realized loss on commodity-related derivative financial instruments of $42 million in
the fourth quarter of 2017 compared to a loss of $15 million in the fourth quarter of 2016. For the year ended
December 31, 2017, gross profit was $1,482 million compared to $1,002 million in 2016 for the same reasons discussed
above. For the twelve months ended December 31, 2017, the realized loss on commodity-related derivative financial
instruments was $94 million compared to $10 million for the same period in the prior year. Pembina's unrealized gain on
the market-to-market positions of commodity-related derivative financial instruments of $23 million for 2017 compared to
an unrealized loss of $61 million for 2016.
For the three-month period ended December 31, 2017, Pembina incurred general and administrative expenses (excluding
corporate depreciation and amortization) of $57 million compared to $44 million during the comparable period of 2016.
This increase was largely due to an increase in share price which impacted the measurement of Pembina's compensation
plan liabilities, as well as additional staff to support the growth in the Company's asset base. For the full year of 2017,
Pembina incurred general and administrative expenses (excluding corporate depreciation and amortization) of $213
million, compared to $175 million in the prior year. This increase was primarily driven by the same factors as noted above,
partially offset by decreased rent expense in the current year due to non-cash and non-recurring rental adjustments of
$10 million recognized during 2016.
Other expenses incurred during the fourth quarter of 2017 were $16 million compared to a recovery of $6 million for the
same period in 2016. For the year ended 2017, other expenses were $28 million compared to other income of $1 million
in 2016. Other expenses in 2017 largely related to the Veresen Acquisition as compared to 2016 which was comprised of
derecognized project costs.

Pembina Pipeline Corporation
5
Net finance costs incurred during the fourth quarter of 2017 were $71 million compared to $38 million for the same
period in 2016. This increase was primarily due to increased interest expense driven by higher loans and borrowings,
partially offset by fluctuations in the fair value of the convertible debentures conversion feature and increased foreign
exchange gains. For 2017, net finance costs were $185 million compared to $153 million for 2016. This increase was
primarily due to increased interest expense and fluctuations in the fair value of the convertible debentures conversion
feature, partially offset by increased foreign exchange gains and fluctuations in the fair value of non-commodity related
derivative financial instruments. Capitalized interest expense declined from $72 million in 2016 to $63 million in 2017 as
additional assets were placed into service over the course of 2017 which results in comparatively higher net finance costs.
Income tax recovery for the fourth quarter of 2017 totaled $41 million, including current tax expense of $29 million offset
by a deferred tax recovery of $70 million, compared to income tax expense of $58 million in the same period of 2016,
including current tax expense of $12 million and deferred tax expense of $46 million. Current tax expense for the fourth
quarter of 2017 was higher than the comparable period in 2016 due mainly to a provision relating to the recent
enactment of the Tax Cuts and Jobs Act ("US Tax Reform"), offset by lower taxable income allocations from partnerships in
Pembina's corporate structure. The deferred tax recovery that occurred in the fourth quarter of 2017 resulted from the
reduction of US federal corporate tax rate from 35 percent to 21 percent enacted under the US Tax Reform which was
partially offset by the utilizations of deductions to reduce partnership income as described above. Income tax expense was
$142 million for the year ended December 31, 2017, including current taxes of $48 million and deferred taxes of $94
million, compared to income tax expense of $189 million in 2016, including current taxes of $50 million and deferred taxes
of $139 million in the same period of 2016. The variances in current and deferred tax expense are due to the same factors
noted above. The Company's estimates of the impact of US Tax Reform to the tax provision may be adjusted in the future
based on anticipated future guidance and regulations from the U.S. Treasury and the Internal Revenue Service (See "US
Tax Reform" section below).
The Company's earnings were $445 million ($0.83 per common share – basic and diluted) during the fourth quarter of
2017 compared to $131 million ($0.29 per common share – basic and $0.28 per common share – diluted) in the same
period of 2016. Higher gross profit combined with lower tax expense were partially offset by higher net finance costs,
general and administrative expenses and other expenses. Earnings attributable to common shareholders, net of dividends
attributable to preferred shareholders, during the fourth quarter of 2017 were $417 million (fourth quarter of 2016: $112
million). Full-year earnings were $891 million ($1.89 per common share – basic and $1.88 per common share – diluted)
during 2017 compared to $466 million ($1.02 per common share – basic and $1.01 per common share – diluted) during
2016. On a year-to-date basis, earnings attributable to common shareholders, net of dividends attributable to preferred
shareholders, in 2017 were $805 million (2016: $394 million).
Cash flow from operating activities for the quarter ended December 31, 2017 was $523 million ($1.04 per common share
– basic) compared to $286 million ($0.73 per common share – basic) during the fourth quarter of 2016. This increase was
primarily due to higher gross profit and higher distributions from investments in equity accounted investees, partially
offset by higher taxes paid and interest paid. For the twelve months ended December 31, 2017, cash flow from operating
activities was $1,513 million ($3.55 per common share – basic) compared to $1,077 million ($2.78 per common share –
basic) during the same period last year. This increase was primarily due to the same factors noted above combined with a
decreased change in non-cash working capital and higher payments received and deferred.
Adjusted cash flow from operating activities for the fourth quarter of 2017 was $499 million ($0.99 per common share –
basic) compared to $292 million ($0.74 per common share – basic) during the fourth quarter of 2016. Increased cash flow
from operating activities (net of changes in non-cash working capital) was partially offset by increased current tax
expense, additional preferred share dividends and accrued share-based payment expense. For the twelve months ended
Pembina Pipeline Corporation
6
December 31, 2017, adjusted cash flow from operating activities was $1,396 million ($3.27 per common share – basic)
compared to $986 million ($2.54 per common share – basic). Increased cash flow from operating activities (net of changes
in non-cash working capital) was partially offset by additional preferred share dividends, and accrued share-based
payment expense.
Full-year 2017 per common share metrics were also impacted by increased common shares outstanding due to the
Acquisition and Premium Dividend™ and Dividend Reinvestment Plan ("DRIP") which was suspended effective April 25,
2017.
Capital expenditures were $314 million in the fourth quarter of 2017 as compared to $453 million in 2016. Full-year capital
expenditures were $1.8 billion compared to $1.7 billion in 2016. The majority of spending in both 2017 and 2016 related
to Pembina's expansion programs. Please refer to disclosure under the heading "Capital Expenditures" for further detail,
as discussed further in the MD&A.
Proportionately Consolidated Overview
In accordance with IFRS, Pembina's Investments in Equity Accounted Investees are accounted for using equity accounting.
Under equity accounting, the assets and liabilities of the investment are net into a single line item on the Consolidated
Statement of Financial Position, Investments in Equity Accounted Investees. Net earnings from Investments in Equity
Accounted Investees are recognized in a single line item in the Consolidated Statement of Earnings and Comprehensive
Earnings, Share of Profit of Investments in Equity Accounted Investees. Cash contributions and distributions from Investments
in Equity Accounted Investees represent Pembina's proportionate share paid and received in the period to and from the
investments in equity accounted investees.
To assist the readers' understanding and evaluation of the performance of these investments, Pembina is supplementing
the IFRS disclosure with non-GAAP disclosure of Pembina's proportionately consolidated interest in the Investments in
Equity Accounted Investees. Pembina's proportionate interest in equity accounted investees has been included in
operating margin and Adjusted EBITDA and other reconciling items to share of profit. Refer to "Non-GAAP Measures." For
comparison purposes, total volumes have also been disclosed on a proportionately consolidated basis.
Total volumes were 2,917 mboe/d in the fourth quarter of 2017 as compared to 1,941 mboe/d in 2016. Full-year volumes
were 2,300 mboe/d compared to 1,907 mboe/d in 2016. See table below under "Proportionately Consolidated Operating
Margin and Volumes" for breakdown by business.
During the fourth quarter of 2017, operating margin increased by 96 percent to $749 million compared to $382 million in
the fourth quarter of 2016. This increase was driven by the Acquisition and stronger performance from the Midstream,
Conventional Pipelines and Gas Services businesses resulting from increases in volume and revenues due to new assets
placed into service within these businesses as well as higher operating margin in the Midstream business driven by
improvements in commodity prices in the current year. For 2017, operating margin was $1.9 billion compared to $1.4
billion for the same period of 2016. This was due to higher operating margin across all businesses resulting from the same
factors mentioned above.
Pembina generated Adjusted EBITDA of $674 million and $1.7 billion during the fourth quarter and the full year of 2017
compared to $342 million and $1.2 billion for the same periods in 2016. These 97 and 43 percent increases were due to
increased operating margin relating to the Acquisition (see Note 6 of the Consolidated Financial Statements) and other
factors noted above.
Pembina Pipeline Corporation
7
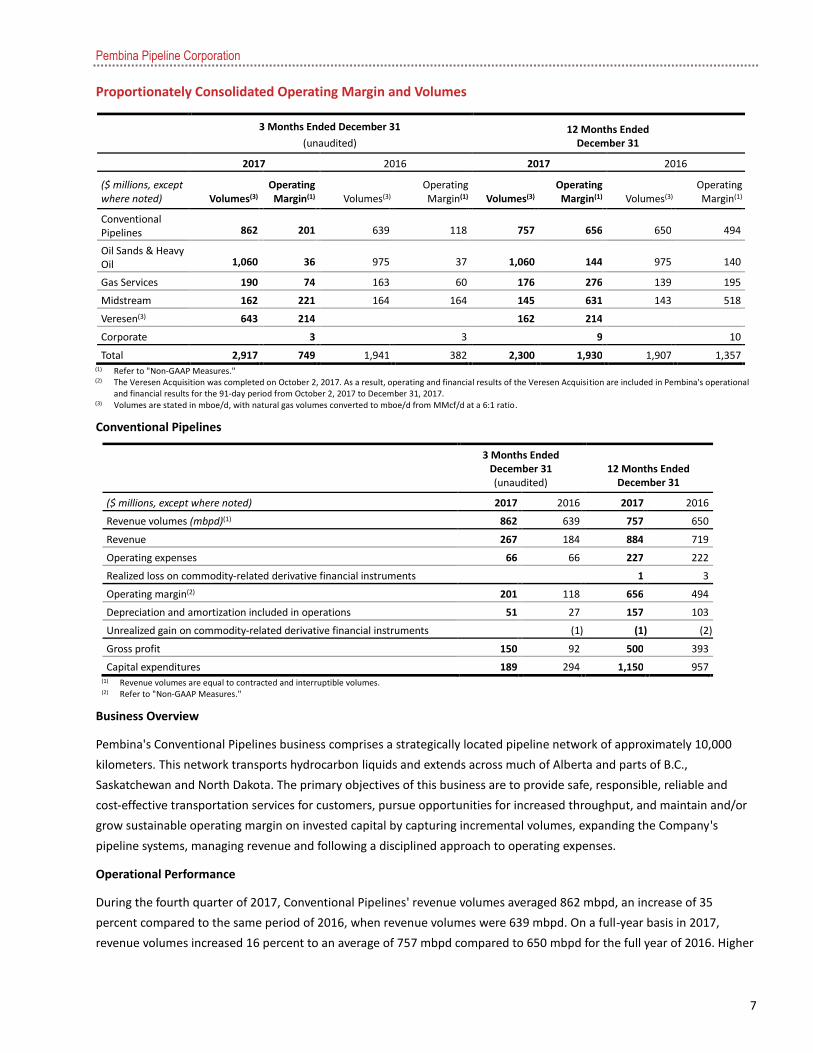
Proportionately Consolidated Operating Margin and Volumes
3 Months Ended December 31
(unaudited) 12 Months Ended
December 31
2017 2016 2017 2016
($ millions, except where noted) Volumes(3)
Operating Margin(1) Volumes(3)
Operating Margin(1) Volumes(3)
Operating Margin(1) Volumes(3)
Operating Margin(1)
Conventional Pipelines 862
201
639
118
757
656
650
494
Oil Sands & Heavy Oil 1,060
36
975
37
1,060
144
975
140
Gas Services 190 74 163 60 176 276 139 195
Midstream 162 221 164 164 145 631 143 518
Veresen(3) 643 214 162 214
Corporate 3 3 9 10
Total 2,917 749 1,941 382 2,300 1,930 1,907 1,357 (1) Refer to "Non-GAAP Measures."
(2) The Veresen Acquisition was completed on October 2, 2017. As a result, operating and financial results of the Veresen Acquisition are included in Pembina's operational and financial results for the 91-day period from October 2, 2017 to December 31, 2017.
(3) Volumes are stated in mboe/d, with natural gas volumes converted to mboe/d from MMcf/d at a 6:1 ratio.
Conventional Pipelines
3 Months Ended
December 31 (unaudited)
12 Months Ended December 31
($ millions, except where noted) 2017 2016 2017 2016
Revenue volumes (mbpd)(1) 862 639 757 650
Revenue 267 184 884 719
Operating expenses 66 66 227 222
Realized loss on commodity-related derivative financial instruments 1 3
Operating margin(2) 201 118 656 494
Depreciation and amortization included in operations 51 27 157 103
Unrealized gain on commodity-related derivative financial instruments (1 ) (1 ) (2 )
Gross profit 150 92 500 393
Capital expenditures 189 294 1,150 957 (1) Revenue volumes are equal to contracted and interruptible volumes.
(2) Refer to "Non-GAAP Measures."
Business Overview
Pembina's Conventional Pipelines business comprises a strategically located pipeline network of approximately 10,000
kilometers. This network transports hydrocarbon liquids and extends across much of Alberta and parts of B.C.,
Saskatchewan and North Dakota. The primary objectives of this business are to provide safe, responsible, reliable and
cost-effective transportation services for customers, pursue opportunities for increased throughput, and maintain and/or
grow sustainable operating margin on invested capital by capturing incremental volumes, expanding the Company's
pipeline systems, managing revenue and following a disciplined approach to operating expenses.
Operational Performance
During the fourth quarter of 2017, Conventional Pipelines' revenue volumes averaged 862 mbpd, an increase of 35
percent compared to the same period of 2016, when revenue volumes were 639 mbpd. On a full-year basis in 2017,
revenue volumes increased 16 percent to an average of 757 mbpd compared to 650 mbpd for the full year of 2016. Higher

Pembina Pipeline Corporation
8
volumes as a result of system expansions were realized on Pembina's Peace and Northern pipeline systems, namely the
Phase III pipeline expansion ("Phase III Expansion") as well as the Vantage pipeline system.
Financial Performance
During the fourth quarter of 2017, Conventional Pipelines generated revenue of $267 million, 45 percent higher than the
$184 million generated in the same quarter of the previous year. For the full year of 2017, revenue was $884 million, a 23
percent increase compared to $719 million for the same period in 2016. These increases resulted from higher revenue
volumes as discussed above as well as higher posted tolls on some systems.
During the fourth quarter of 2017, operating expenses of $66 million were consistent with those recognized in the fourth
quarter of 2016. Lower integrity spending based on the current year's work plan were offset by higher power, field
maintenance expenses and labour associated with Pembina's systems expansions, some of which are flow-through
expenses. For the twelve months ended December 31, 2017, operating expenses were $227 million compared to $222
million in the same period of 2016. This increase was primarily the result of higher power costs, field maintenance
spending to support Pembina's pipeline system expansions and higher labour expenses associated with increased
headcount, partially offset by lower integrity spending primarily due to reduced activity associated with integrity
management program scheduling.
Operating margin was $201 million in the fourth quarter of 2017 compared to $118 million for the same period of 2016.
For the full year of 2017, operating margin was $656 million, $162 million or 33 percent higher than the $494 million
recorded for the full year of 2016. Both increases were due to the same factors impacting revenue and operating expenses
noted above.
Depreciation and amortization included in operations during the fourth quarter and the full year of 2017 was $51 million
and $157 million, respectively, compared to $27 million and $103 million recognized during the same periods of the prior
year. The increases in 2017 were due to additional in-service assets relating to Pembina's system expansions, as well as
certain useful life adjustments.
For the three and twelve months ended December 31, 2017, gross profit was $150 million and $500 million, respectively,
compared to $92 million and $393 million for the same periods of 2016. These increases were due to higher operating
margin, partially offset by increased depreciation and amortization included in operations.
Capital expenditures for the fourth quarter and full year in 2017 totaled $189 million and $1,150 million, respectively,
compared to $294 million and $957 million for the same periods of 2016. The majority of this spending is related to
Pembina's ongoing pipeline expansion projects some of which are described below including clean-up costs for assets
already placed into service.
New Developments
As previously announced and in support of the liquids-rich Montney resource play, Pembina placed its northeast B.C.
pipeline (the "NEBC Expansion") and its Altares lateral pipeline into service at the end of October 2017. The NEBC
Expansion is centrally located to accommodate further incremental transportation demands for the majority of producers
in the liquids-rich Montney resource play. With continued development in the Montney, the NEBC Expansion offers
producers a transportation solution and access to Pembina's existing infrastructure at Taylor, B.C.
The Company has now received regulatory and environmental approval for the Phase IV expansion ("Phase IV") and is
continuing to progress design, engineering and civil work. Phase IV is expected to be placed into service in late 2018 and
will add approximately 180 mbpd of capacity between Fox Creek and Namao, Alberta. Pembina has the ability to further
expand capacity between Fox Creek and Namao to approximately 1,200 mbpd by adding additional pump stations.
Pembina Pipeline Corporation
9
As previously announced in September 2017, the Company is adding additional infrastructure to its Phase V expansion
("Phase V"), which will add approximately 260 mbpd of capacity between Lator and Fox Creek, Alberta. In addition to
accommodating further customer demand, the Company will improve operational efficiencies and offer more optionality,
which will ultimately provide a better service offering for Pembina's customers. The incremental cost for the additional
infrastructure is $135 million for a total project capital cost of $385 million. Clearing work is now complete and pipeline
construction is underway, with the expectation of bringing Phase V into service in late 2018.
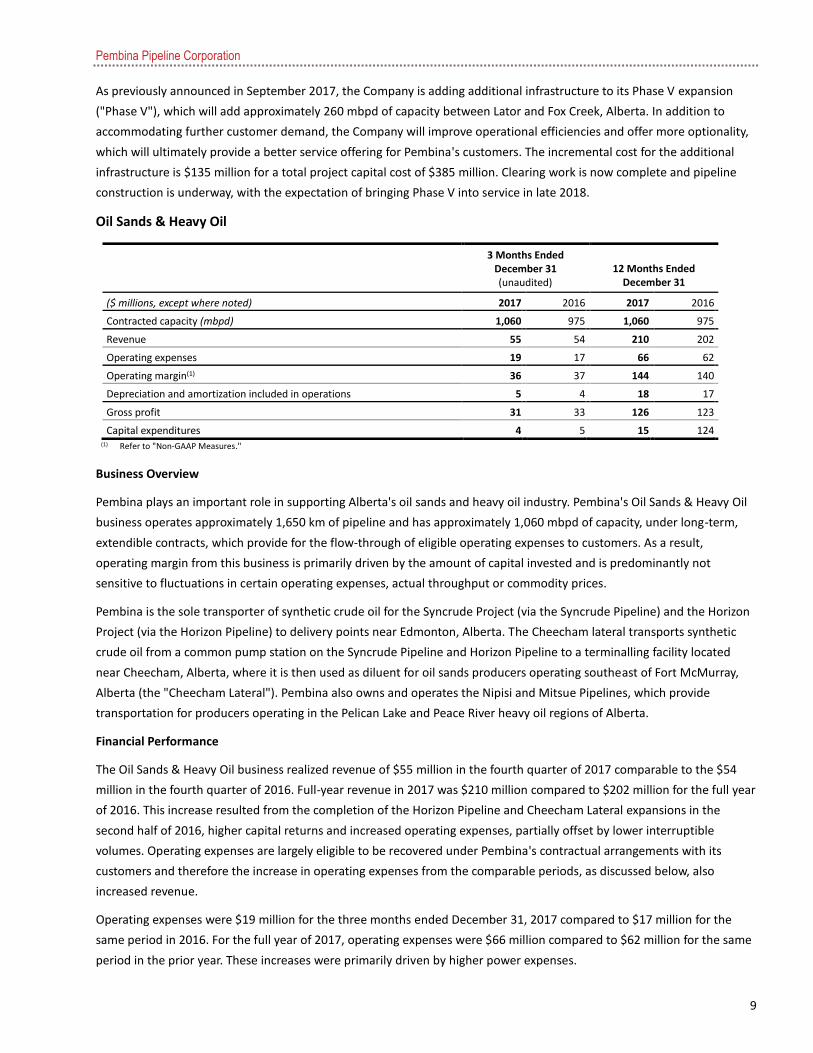
Oil Sands & Heavy Oil
3 Months Ended
December 31 (unaudited)
12 Months Ended December 31
($ millions, except where noted) 2017 2016 2017 2016
Contracted capacity (mbpd) 1,060 975 1,060 975
Revenue 55 54 210 202
Operating expenses 19 17 66 62
Operating margin(1) 36 37 144 140
Depreciation and amortization included in operations 5 4 18 17
Gross profit 31 33 126 123
Capital expenditures 4 5 15 124
(1) Refer to "Non-GAAP Measures."
Business Overview
Pembina plays an important role in supporting Alberta's oil sands and heavy oil industry. Pembina's Oil Sands & Heavy Oil
business operates approximately 1,650 km of pipeline and has approximately 1,060 mbpd of capacity, under long-term,
extendible contracts, which provide for the flow-through of eligible operating expenses to customers. As a result,
operating margin from this business is primarily driven by the amount of capital invested and is predominantly not
sensitive to fluctuations in certain operating expenses, actual throughput or commodity prices.
Pembina is the sole transporter of synthetic crude oil for the Syncrude Project (via the Syncrude Pipeline) and the Horizon
Project (via the Horizon Pipeline) to delivery points near Edmonton, Alberta. The Cheecham lateral transports synthetic
crude oil from a common pump station on the Syncrude Pipeline and Horizon Pipeline to a terminalling facility located
near Cheecham, Alberta, where it is then used as diluent for oil sands producers operating southeast of Fort McMurray,
Alberta (the "Cheecham Lateral"). Pembina also owns and operates the Nipisi and Mitsue Pipelines, which provide
transportation for producers operating in the Pelican Lake and Peace River heavy oil regions of Alberta.
Financial Performance
The Oil Sands & Heavy Oil business realized revenue of $55 million in the fourth quarter of 2017 comparable to the $54
million in the fourth quarter of 2016. Full-year revenue in 2017 was $210 million compared to $202 million for the full year
of 2016. This increase resulted from the completion of the Horizon Pipeline and Cheecham Lateral expansions in the
second half of 2016, higher capital returns and increased operating expenses, partially offset by lower interruptible
volumes. Operating expenses are largely eligible to be recovered under Pembina's contractual arrangements with its
customers and therefore the increase in operating expenses from the comparable periods, as discussed below, also
increased revenue.
Operating expenses were $19 million for the three months ended December 31, 2017 compared to $17 million for the
same period in 2016. For the full year of 2017, operating expenses were $66 million compared to $62 million for the same
period in the prior year. These increases were primarily driven by higher power expenses.
Pembina Pipeline Corporation
10
For the fourth quarter and year ended December 31, 2017, operating margin was $36 million and $144 million,
respectively, compared to $37 million and $140 million for the same periods in 2016 due to the factors discussed above.
Depreciation and amortization included in operations for the fourth quarter and full year of 2017 of $5 million and $18
million, respectively, remained comparable to the $4 million and $17 million recognized in the same periods in 2016.
For the three and twelve-month periods ended December 31, 2017, gross profit was $31 million and $126 million
compared to $33 million and $123 million during the same periods in the prior year. These variances were due to the
same factors that impacted operating margin.
Capital expenditures for the three and twelve months ended December 31, 2017 were $4 million and $15 million
compared to $5 million and $124 million for the same periods in 2016. This spending related to the expansion of the
Horizon Pipeline, an expansion of the Cheecham Lateral and other sustainment activities.
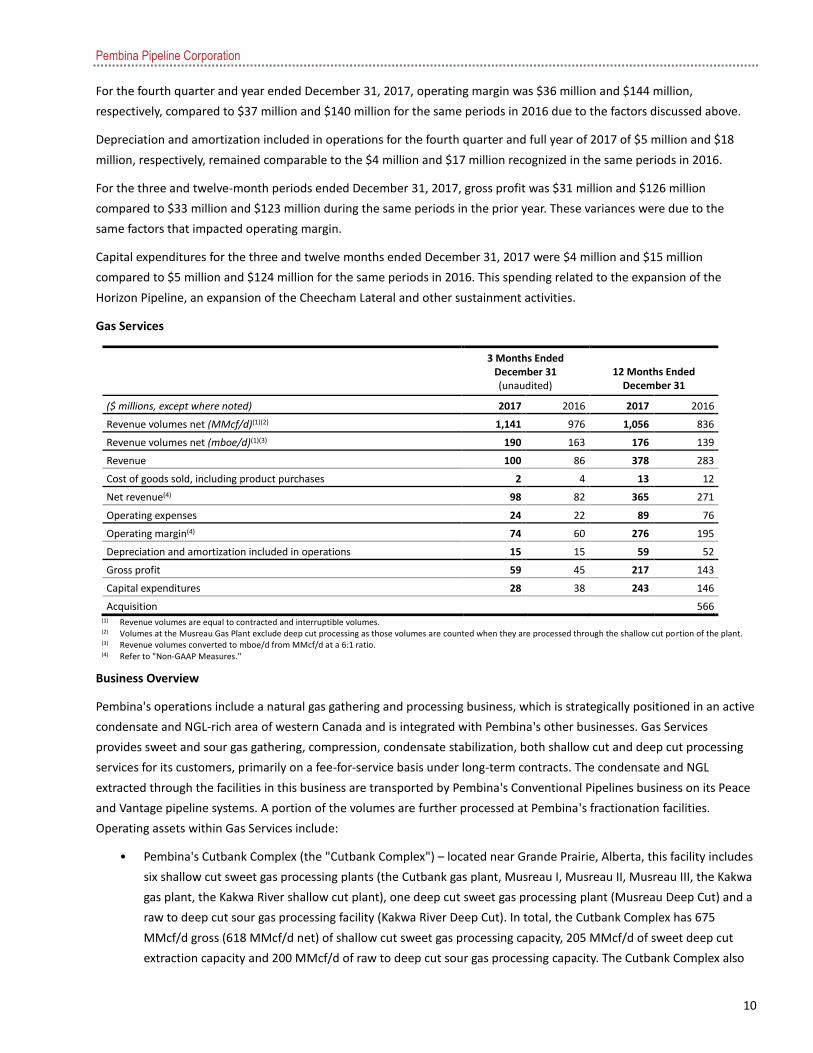
Gas Services
3 Months Ended
December 31 (unaudited)
12 Months Ended December 31
($ millions, except where noted) 2017 2016 2017 2016
Revenue volumes net (MMcf/d)(1)(2) 1,141 976 1,056 836
Revenue volumes net (mboe/d)(1)(3) 190 163 176 139
Revenue 100 86 378 283
Cost of goods sold, including product purchases 2 4 13 12
Net revenue(4) 98 82 365 271
Operating expenses 24 22 89 76
Operating margin(4) 74 60 276 195
Depreciation and amortization included in operations 15 15 59 52
Gross profit 59 45 217 143
Capital expenditures 28 38 243 146
Acquisition 566 (1) Revenue volumes are equal to contracted and interruptible volumes.
(2) Volumes at the Musreau Gas Plant exclude deep cut processing as those volumes are counted when they are processed through the shallow cut portion of the plant.
(3) Revenue volumes converted to mboe/d from MMcf/d at a 6:1 ratio.
(4) Refer to "Non-GAAP Measures."
Business Overview
Pembina's operations include a natural gas gathering and processing business, which is strategically positioned in an active
condensate and NGL-rich area of western Canada and is integrated with Pembina's other businesses. Gas Services
provides sweet and sour gas gathering, compression, condensate stabilization, both shallow cut and deep cut processing
services for its customers, primarily on a fee-for-service basis under long-term contracts. The condensate and NGL
extracted through the facilities in this business are transported by Pembina's Conventional Pipelines business on its Peace
and Vantage pipeline systems. A portion of the volumes are further processed at Pembina's fractionation facilities.
Operating assets within Gas Services include:
• Pembina's Cutbank Complex (the "Cutbank Complex") – located near Grande Prairie, Alberta, this facility includes
six shallow cut sweet gas processing plants (the Cutbank gas plant, Musreau I, Musreau II, Musreau III, the Kakwa
gas plant, the Kakwa River shallow cut plant), one deep cut sweet gas processing plant (Musreau Deep Cut) and a
raw to deep cut sour gas processing facility (Kakwa River Deep Cut). In total, the Cutbank Complex has 675
MMcf/d gross (618 MMcf/d net) of shallow cut sweet gas processing capacity, 205 MMcf/d of sweet deep cut
extraction capacity and 200 MMcf/d of raw to deep cut sour gas processing capacity. The Cutbank Complex also

Pembina Pipeline Corporation
11
includes approximately 450 km of gathering pipelines, nine field compression stations, and centralized
condensate stabilization.
• Pembina's Saturn complex (the "Saturn Complex") – located near Hinton, Alberta; includes two identical 200
MMcf/d deep cut sweet gas processing plants (the "Saturn I" and "Saturn II" facilities) for a total of 400 MMcf/d
of deep cut processing capacity, as well as 25 km of gathering pipelines.
• Pembina's Resthaven facility ("Resthaven") – located near Grande Cache, Alberta; includes 300 MMcf/d gross
(214 MMcf/d net) of raw to deep cut sweet gas processing capacity, as well as 30 km of gathering pipelines.
• Pembina's Saskatchewan Ethane Extraction Plant ("SEEP") – located to service the southeast Saskatchewan
Bakken region; has deep cut sweet gas processing capacity of 60 MMcf/d, ethane fractionation capabilities of up
to 4.5 mbpd and a 104 km ethane delivery pipeline.
• Pembina's Duvernay Complex (the "Duvernay Complex") – located near Fox Creek, Alberta, includes 100 MMcf/d
(75 MMcf/d net) shallow cut sweet gas processing plant ("Duvernay I") and 12 km of sales gas pipeline, and
supporting infrastructure, which includes 35 km of gas gathering pipeline and fuel gas pipeline respectively, 30
MMcf/d gas compression, 10 mbpd raw condensate stabilization, and 5 mbpd water handling in the field ("Field
Hub").
Operational Performance
Revenue volumes were a record 1,141 MMcf/d during the fourth quarter of 2017, 17 percent higher than the 976 MMcf/d
recorded during the fourth quarter of 2016. This increase was due to higher volumes being received at the Cutbank
Complex, Resthaven and the Saturn Complex as well as the startup of the Duvernay I gas plant on November 1, 2017. On a
full-year basis in 2017, volumes increased 26 percent to 1,056 MMcf/d compared to 836 MMcf/d in the same period of
2016. Revenue volumes in 2017 were positively impacted by a full-year contribution from the Kakwa River facility,
Musreau III and the Resthaven expansion, higher realized revenue volumes at the Saturn Complex and the startup of the
Duvernay I gas plant in late 2017. In addition, revenue volumes in 2016 at Resthaven and the Saturn Complex were
negatively impacted by extended facility outages in that year.
Financial Performance
Gas Services realized $98 million in net revenue during the fourth quarter of 2017 compared to $82 million in the fourth
quarter of 2016. For the full year of 2017, net revenue was $365 million compared to $271 million in the same period of
2016. These 20 percent and 35 percent increases in net revenue were due to higher revenue volumes at the Cutbank
Complex, Resthaven and the Saturn Complex as well as the startup of the Duvernay I gas plant in the fourth quarter, as
well as increased revenue associated with the recovery of operating costs and the recognition of $10 million previously
unrecorded revenue received from a customer receivership settlement in the first quarter of 2017.
During the fourth quarter of 2017, Gas Services incurred operating expenses of $24 million compared to $22 million in the
fourth quarter of 2016. This increase was predominantly due to the addition of facilities and associated expenses as noted
above partially offset by lower transportation expenses at the Kakwa gas plant with the installation of a water disposal
system. Full-year operating expenses totaled $89 million in 2017 compared to $76 million in 2016. This increase was
predominantly due to the addition of facilities and associated expenses as noted above combined with lower operating
expenses in the comparative period due to an outage at the Saturn Complex.
Gas Services realized operating margin of $74 million in the fourth quarter and $276 million for the full year of 2017
compared to $60 million and $195 million during the same periods of the prior year. These increases were the result of the
factors discussed above.
Pembina Pipeline Corporation
12
Depreciation and amortization included in operations during the fourth quarter and the full year of 2017 totaled $15
million and $59 million, respectively, compared to $15 million and $52 million during the same periods of the prior year.
The full year increase was primarily attributable to the addition of the Duvernay Complex in 2017 as well as increases
related to the Kakwa River facility, Musreau III and the Resthaven expansion which included a full year of depreciation in
2017 compared to nine months in 2016.
For the three months ended December 31, 2017, gross profit was $59 million compared to $45 million in the same period
of 2016. On a year-to-date basis, gross profit was $217 million compared to $143 million during the prior year. The
increase year-over-year was due to higher operating margin, partially offset by increased depreciation expense.
Capital expenditures for the fourth quarter and the full year of 2017 were $28 million and $243 million, respectively,
compared to $38 million and $146 million for the same periods of 2016. Capital spending in 2017 was largely to complete
the Duvernay Complex, as well as producer-requested modifications, including a water disposal system at the Kakwa River
facility. In 2016, capital spending was largely to advance and complete construction at Musreau III and the Resthaven
expansion as well as to progress the development in the Duvernay.
New Developments
As previously announced, Pembina placed its Duvernay Complex into service in November 2017, ahead of schedule and
under budget. The Duvernay Complex represents Pembina's first large-scale processing plant and infrastructure that was
specifically designed to handle the liquids-rich Duvernay production.
In early 2017, Pembina entered into a 20-year infrastructure development and service agreement (the "Agreement") with
a multinational, investment grade customer, which includes an area of dedication in the Duvernay resource play near Fox
Creek, Alberta. On November 6, 2017, Pembina announced that it had executed further agreements to develop and
construct Duvernay infrastructure at the Company's Duvernay Complex for a capital cost of approximately $290 million.
The Duvernay infrastructure includes: raw product separation and water removal infrastructure; a 30 mbpd of raw inlet
condensate stabilization facility; a 100 MMcf/d sweet gas shallow cut processing facility ("Duvernay II" a replica of
Pembina's Duvernay I facility); and a 10-inch condensate pipeline lateral that will connect to the Company's Peace Pipeline
system. The facilities will have a 20-year contractual life and would be back-stopped by a combination of fee-for-service
and fixed-return arrangements with an expected in-service date of mid-to-late 2019, subject to regulatory and
environmental approvals. Detailed engineering for Duvernay II is progressing with some long lead equipment now
ordered. Additionally, agreements were executed for NGL and condensate transportation on Pembina's Peace Pipeline
system and NGL fractionation at the Company's Redwater fractionation complex in respect of this Duvernay development.

Pembina Pipeline Corporation
13
Midstream
3 Months Ended
December 31
(unaudited)
12 Months Ended December 31
($ millions, except where noted) 2017 2016 2017 2016
Financial Highlights
NGL sales volumes (mbpd) 162 164 145 143
Revenue 1,305 954 4,034 3,183
Cost of goods sold 1,031 760 3,262 2,611
Net revenue(1) 274 194 772 572
Operating expenses 16 21 69 69
Realized loss on commodity-related derivative financial instruments 42 15 93 7
Depreciation and amortization included in operations 32 27 116 101
Unrealized (gain) loss on commodity-related derivative financial instruments (14 ) 34 (22 ) 63
Share of profit of investments in equity accounted investees 1
Gross profit 198 97 516 333
Capital expenditures 68 112 395 504
Proportionately Consolidated
Operating margin(1) 221 164 631 518 (1) Refer to "Non-GAAP Measures."
Business Overview
Pembina offers customers a comprehensive suite of midstream products and services through its Midstream business as
follows:
• Crude oil midstream assets include:
o 14 truck terminals providing pipeline and market access for crude oil and condensate production that are not
pipeline connected;
o Pembina Nexus Terminal ("PNT") includes an area in Alberta between Namao, Heartland and Edmonton
where 21 inbound pipeline connections and 13 outbound pipeline connections converge providing access to
approximately 1.2 mmbpd of crude oil and condensate supply;
o Edmonton North Terminal ("ENT") located within PNT includes approximately 900 mbbls of above ground
storage having access to crude oil, synthetic crude oil and condensate supply transported on Pembina's
operated pipelines and products from various third-party operated pipelines; and
o Canadian Diluent Hub ("CDH"), located within PNT in the Heartland area and includes 500 mbbls of above
ground storage, providing direct connectivity for growing domestic condensate volumes to the oil sands via
downstream third-party pipelines.
• NGL midstream includes two vertically integrated NGL operating systems – Redwater West and Empress East (as
defined below).
o The Redwater West NGL system ("Redwater West") includes the 750 MMcf/d (322.5 MMcf/d net) Younger
extraction and fractionation facility in B.C. ("Younger"); two 73 mbpd NGL fractionators ("RFS I" and "RFS II"),
a 55 mbpd propane-plus fractionator ("RFS III") and 8.3 mmbbls of finished product cavern storage at
Redwater, Alberta; and third-party fractionation capacity in Fort Saskatchewan, Alberta. Redwater West
purchases NGL mix from various natural gas and NGL producers and fractionates it into finished products for

Pembina Pipeline Corporation
14
further distribution and sale. Also located at the Redwater site is Pembina's rail-based terminal which
services Pembina's proprietary and customer needs for importing and exporting NGL products.
o The Empress East NGL system ("Empress East") includes 2.1 bcf/d of capacity in the straddle plants at
Empress, Alberta; 20 mbpd of fractionation capacity and 1.1 mmbbls of cavern storage in Sarnia, Ontario;
and 7.1 mmbbls of hydrocarbon storage at Corunna, Ontario. Empress East extracts NGL mix from natural gas
at the Empress straddle plants and purchases NGL mix from other producers/suppliers. Ethane and
condensate are generally fractionated out of the NGL mix at Empress and sold into western Canadian
markets. Pembina transports propane/butane NGL mix predominantly to Sarnia, Ontario for further
fractionation, distribution and sale into markets in Central Canada and the eastern U.S. Storage and
terminalling services are also provided to customers at the Pembina Corunna Terminal.
The financial performance of Pembina's Midstream business can be affected by seasonal demands for products and other
market factors. In NGL midstream, propane inventory generally builds over the second and third quarters of the year and
is sold in the fourth quarter and the first quarter of the following year during the winter heating season. Condensate,
butane and ethane are generally sold rateably throughout the year. See "Risk Factors" for more information.
Operational & Financial Performance
During the fourth quarter and full-year of 2017, NGL sales volumes averaged 162 mbpd and 145 mbpd, respectively,
consistent with 164 mbpd and 143 mbpd recognized during the same periods in 2016. NGL sales volumes were relatively
flat over the periods compared to 2016 and was largely a result of RFS III fractionated volumes being returned to the
customer which is not reflected in the Company's NGL sales volumes.
In the Midstream business, revenue was $1,305 million during the fourth quarter of 2017, compared to $954 million in the
same period of 2016, with the increase primarily driven by the start-up of RFS III on July 1, 2017 and improvements in
commodity prices in the current year. For the full year of 2017, revenue was $4.0 billion compared to $3.2 billion in the
same period of 2016. This increase was driven by the same factors impacting the fourth quarter as noted above as well as
increased storage opportunities in the first half of 2017 as compared to the same period in the prior year. Pembina's
Midstream business generated net revenue of $274 million during the fourth quarter of 2017 compared to $194 million
during the fourth quarter of 2016. Full-year net revenue was $772 million in 2017 compared to $572 million in 2016.
These increases are primarily due to improvements in commodity prices and margins in the current periods compared to
the same periods in the prior year as well as RFS III coming into service on June 30, 2017.
Operating expenses during the fourth quarter of 2017 were $16 million compared to the $21 million recognized in the
same period of 2016. The decrease in operating expenses during the current period is due to lower routine integrity and
other expenses. Operating expenses of $69 million for the full year of 2017 were consistent with 2016.
Operating margin was $221 million and $631 million during the fourth quarter and the full year of 2017 compared to $164
million and $518 million in the comparable periods of 2016. These increases were due to the same factors affecting
revenue, net revenue and operating expenses, as discussed above, offset by changes in the realized loss on commodity-
related financial instruments. In the fourth quarter of 2017, operating margin was impacted by a realized loss on
commodity-related derivatives of $42 million compared to $15 million in the fourth quarter of 2016. For the year ended
December 31, 2017, the realized loss on commodity-related derivatives was $93 million compared to $7 million in 2016.
Pembina enters into commodity-related financial instruments to protect margins in changing commodity price
environments. The current year loss was predominantly driven by decreases in natural gas prices and increases in the price
of propane and butane. Pembina entered into hedge contracts to de-risk operating margin derived from the spread

Pembina Pipeline Corporation
15
between the value of natural gas liquids and natural gas. Currently, Pembina has hedged approximately 65 percent of the
Company's frac spread throughput for 2018 (excluding its interest in Aux Sable).
Operating margin for Pembina's NGL midstream activities was $170 million for the fourth quarter of 2017 compared to
$118 million for the fourth quarter of 2016. For the twelve months ended December 31, 2017, operating margin was $488
million compared to $356 million for the same period of 2016. These increases are due to product margin increases,
partially offset by increased realized losses on commodity-related derivatives.
The Company's crude oil midstream operating margin was $51 million in the fourth quarter of 2017 compared to $46
million for the same period in 2016. This increase was due to higher fee-for-service revenue as the CDH was placed into
service in June 2017 and wider commodity price differentials. For the full year, crude oil midstream operating margin
totaled $143 million compared to $162 million during the same period of the prior year. Although crude oil prices have
strengthened year-over-year, average differentials were narrower making the underlying margins tighter, which resulted in
reduced operating margin. Further, the shape of the forward curve created more opportunities for storage in 2016,
compared to 2017. In addition, due to the increase in domestic condensate production, the rail import of condensate was
not economic during 2017, as it was during 2016. This was partially offset by higher fee-for-service operating margin at
CDH in the current year.
Depreciation and amortization included in operations for Pembina's Midstream business was $32 million in the fourth
quarter of 2017 compared to $27 million for the same period of 2016. Full-year 2017 depreciation and amortization
included in operations was $116 million compared to $101 million for the same period of 2016. These increases were due
to new assets being brought into service including RFS III, NGL storage caverns and CDH.
For the three and twelve months ended December 31, 2017, gross profit in this business was $198 million and $516
million, respectively, compared to $97 million and $333 million during the same periods in 2016. Gross profit was
impacted by the same factors as operating margin and depreciation noted above, as well as fluctuations in the unrealized
gain or loss on commodity-related financial instruments. In the fourth quarter of 2017, gross profit was impacted by an
unrealized gain on commodity-related derivatives of $14 million compared to a loss of $34 million in the fourth quarter of
2016. On a year-to-date basis in 2017, gross profit was impacted by an unrealized gain on commodity-related derivatives
of $22 million compared to a loss of $63 million in the same period of 2016.
Capital expenditures for the fourth quarter and the full year of 2017 totaled $68 million and $395 million, respectively,
compared to $112 million and $504 million for the same periods of 2016. Capital spending in this business in 2017 was
primarily directed towards the completion of RFS III, as well as infrastructure in support of the North West refinery and at
CDH and ENT, as discussed in the "New Developments" section below. Capital spending in this business in 2016 was
primarily directed towards the development of RFS III, as well as completion of above ground storage at ENT and
progressing construction of CDH.
New Developments
Pembina's Board of Directors has approved the construction of fractionation and terminalling facilities at the Company's
Empress, Alberta extraction plant. The new facilities will add approximately 30,000 bpd of propane-plus fractionation
capacity to the Company's Empress East NGL system. For the fractionation infrastructure, Pembina will repurpose existing
assets for depropanization and will construct a new debutanizer and a finished product treating facility. Pembina will also
add propane rail loading and butane truck terminalling services to the site. The total expected capital cost for this project
is approximately $120 million and is anticipated to be placed into service in late 2020, subject to environmental and
regulatory approval. These facilities will provide the Company with increased NGL volumes and market optionality, as well

Pembina Pipeline Corporation
16
as enhanced propane supply access which could further support the Company's Prince Rupert export terminal and
proposed propane dehydrogenation and polypropylene production facility (as discussed below).
On November 29, 2017, Pembina announced approval by its Board of Directors for the development of the Company's
previously proposed liquefied petroleum gas ("LPG") export terminal (the "Prince Rupert Terminal"). The Prince Rupert
Terminal will be located on Watson Island, British Columbia on lands leased from a wholly-owned subsidiary of the City of
Prince Rupert (the "City"). The Prince Rupert Terminal is expected to have a permitted capacity of approximately 25,000
barrels per day of LPG with the LPG supply primarily being sourced from Pembina's Redwater fractionation complex. The
Company continues to progress stakeholder consultation and detailed engineering work to support facility design and
various permit applications expected to be submitted throughout 2018. The expected capital cost is approximately $250
million and is anticipated to be in service mid-2020, subject to regulatory and environmental approvals.
As of December 31, 2017, Pembina has declared its infrastructure which supports the North West Redwater Partnership's
("North West") refinery to be in service.
Canada Kuwait Petrochemical Company ("CKPC") continues to progress front end engineering design ("FEED") for a
combined propane dehydrogenation and polypropylene production facility. It is expected that FEED activities will be
completed by late 2018, followed by a final investment decision. Pembina and Kuwait's Petrochemical Industries Company
K.S.C. (''PIC'') are each 50 percent joint venture partners of CKPC. The CKPC partnership strategically combines expertise
from both companies. Pembina is an experienced operator and builder of large-scale infrastructure and is the largest
supply aggregator of propane in the WCSB, and PIC, the petrochemical subsidiary of Kuwait Petroleum Corporation, is a
global petrochemical company with a diversified production and marketing portfolio in olefins and aromatics products.
CDH is capable of delivering approximately 400 mbpd of condensate to regional third-party diluent pipelines and has 500
mbbls of above ground storage. In February 2018, Pembina placed a fifth third-party condensate connection into service
at CDH. Condensate deliveries to CDH continue to increase as volumes on the Phase III Expansion ramp up, with
condensate receipts exceeding 145 mbpd in December 2017.
Pembina has completed several initiatives to further support operations and improve customer service offerings at ENT.
The Pembina Edmonton Delivery System ("PEDS"), which was previously placed into service, connects the Company's
Namao hub to large-scale, third-party infrastructure in the Edmonton area. PEDS also accommodates increased volumes
from the Phase III Expansion and improves access of commodities into ENT.
Effective April 1, 2018, Pembina will become the operator of the Company's Younger facility, which has been previously
operated by its joint interest partner. Given Pembina's extensive experience as an operator and its ability to leverage and
integrate with its current operational systems, the Company expects to realize efficiencies going forward.

Pembina Pipeline Corporation
17
Veresen
3 and 12 Months Ended
December 31(2)
($ millions, except where noted) 2017
Financial Highlights
Revenue 15
Operating expenses 8
Depreciation and amortization included in operations 9
Share of profit of investments in equity accounted investees 116
Gross profit 114
Capital expenditures 24
Contributions to equity accounted investees 6
Distributions from equity accounted investees(3) 144
Proportionately Consolidated
Total revenue and sales volumes (mboe/d)(4)(5) 643
Operating margin(1) 214
Adjusted EBITDA(1) 189 (1) Refer to "Non-GAAP Measures."
(2) The Veresen Acquisition was completed on October 2, 2017. As a result, operating and financial results of the Veresen Acquisition are included in Pembina's operational and financial results for the 91-day period from October 2, 2017 to December 31, 2017.
(3) Net of amortization of debt held within the equity accounted investees.
(4) Million cubic feet per day ("MMcf/d") converted to mboe/d (thousands of barrels of oil equivalent per day) at 6:1 ratio.
(5) The figure presented in the above table represents the revenue and sales volumes for the 3 months ended December 31, 2017. Revenue and sales volumes for the 12 month period ended December 31, 2017 were 162 mboe/d.
Business Overview
Pembina acquired assets and investments through the Veresen Acquisition that include:
• 100 percent interest in the Alberta Ethane Gathering System with capacity of 330 mbpd;
• 50 percent interest in the Alliance Pipeline with capacity of 1,600 MMcf/d gross (800 MMcf/d net);
• 50 percent convertible preferred interest in the Ruby Pipeline with capacity of 1,500 MMcf/d gross (750 MMcf/d
net) which entitles Pembina to a US$91 million distribution per year;
• 46.3 percent interest (as of December 31, 2017) in Veresen Midstream, which owns assets in western Canada
serving the Montney geological play in northwestern Alberta and northeastern B.C. including: gas processing
plants with capacity of approximately 1,516 MMcf/d gross (702 MMcf/d net), as well as gas gathering pipelines
and compression;
• An ownership interest in Aux Sable (approximately 42.7 percent in Aux Sable U.S. and 50 percent in Aux Sable
Canada), which includes a 131 mbpd gross (56 mbpd net) NGL fractionation facility and gas processing capacity of
2.1 bcf/d gross (0.897 bcf/d net) near Chicago, Illinois and other natural gas and NGL processing facilities, logistics
and distribution assets in the U.S. and Canada, as well as transportation contracts on Alliance; and
• A wholly-owned 1 mmbbls ethane storage facility under construction near Burstall, Saskatchewan.
Pembina Pipeline Corporation
18
Operational and Financial Performance
During the fourth quarter of 2017, AEGS operations, which are fully consolidated, met expectations with revenue volumes
remaining stable at 295 mbpd. During the period AEGS generated revenue of $15 million, operating expenses of $8 million
and operating margin of $7 million. During September 2017, new 20-year take-or-pay agreements were entered into for
approximately 95 percent of the existing capacity, effective January 1, 2019.
Share of profit of investments in equity accounted investees totaled $116 million for the period and the year ended
December 31, 2017. Share of profit of investments in equity accounted investees represents the net earnings of the
investees adjusted for incremental amortization of purchase price allocation adjustments from the Acquisition and interest
and amortization from investment in equity accounted investee level debt. The $116 million share of profit of investments
in equity accounted investees is comprised of $40 million attributable to Alliance, $29 million attributable to Ruby, $22
million attributable to Veresen Midstream, $22 million attributable to Aux Sable and $3 million derived from other
investments in equity accounted investees.
Pembina's share of profit from Alliance pipeline during the period totaled $40 million. Revenue volumes of 1,724 MMcf/d
gross (862 MMcf /d net) during the period resulted from increased seasonal interruptible service which benefited from
high demand driven by a wide Chicago-AECO gas price differential as well as outages or curtailments on other egress
options out of western Canada. Pembina's share of profit from Alliance is net of $10 million of equity investment level
interest expense and $32 million of depreciation and amortization.
Share of profit from Veresen Midstream for the period ended December 31, 2017 was $22 million. Veresen Midstream's
relative share of volumes during the period of 591 MMcf/d were positively impacted from the early startup of the Sunrise
and Tower facilities in September 2017 and the Saturn I facility on November 1, 2017. The increase in revenue volumes
during the period translated into an increase in Veresen Midstream operating margin. During the period, Veresen
Midstream negotiated a reduction in pricing on its outstanding debt facilities, reducing the interest rate on its Term Loan B
by 0.5 percent and on its bank credit facilities by 0.75 percent. As a result, a gain of $24 million, net to Pembina, has been
recorded during the period, reflecting the benefit of the reduced interest rates over the term of the debt obligation. This
gain will be amortized back as higher interest expense for the balance of the term of the credit facilities, offsetting the
lower future cash interest costs. Pembina's share of profit from Veresen Midstream is net of $12 million of equity
investment level interest income and $19 million of depreciation and amortization.
Ruby pipeline generated share of profit for the period of $29 million. Share of profit recognized for Ruby continued to
trend as expected because of protection from take-or-pay contracts and the preferred interest structure. Ruby has long-
term take-or-pay contracts in place for approximately 1,068 MMcf/d gross (534 MMcf/d net), or 69 percent, of the
pipeline's capacity. Operating expenses were in line with management's expectations. Pembina's share of profit
recognized in respect of the Company's investment in Ruby of $29 million represents the dividend received associated
with the Company's preferred interest.
Share of profit recognized from Aux Sable for the period ended December 31, 2017 was $22 million. During the quarter,
Aux Sable processed approximately 96 percent of the natural gas delivered by Alliance. Total NGL sales volumes were 50
mbpd during the period. Revenue recognized by Aux Sable during the period benefited from a recovery in US exports
resulting in relatively strong propane plus margins driven by cold weather and a wide Chicago-AECO differential.
Pembina's share of profit from Aux Sable is net of $2 million of subsidiary level interest expense and $5 million of
depreciation and amortization.
Distributions received from equity accounted investees during the period were $144 million.

Pembina Pipeline Corporation
19
New Developments
On November 29, 2017, the Board of Directors approved Pembina's investment in Veresen Midstream's development of
the North Central liquids hub ("North Central Liquids Hub"), which supports operations for the Cutbank Ridge Partnership
("CRP"), a partnership between Encana Corporation and Cutbank Dawson Resources Ltd., an investment grade subsidiary
of Mitsubishi Corporation, within the world class Montney formation. The estimated capital cost for this project is $320
million ($150 million net) and is expected to be placed into service in late 2018 and is currently trending under budget and
ahead of schedule. The North Central Liquids Hub will provide separation and stabilization of increased condensate
volumes from CRP to support the recently-in service Sunrise and Saturn gas plants. The project can also be further
expanded to serve the future requirements of the CRP as well as other potential third-party produces. Additionally, the
North Central Liquids Hub will connect into Pembina's pipeline systems.
On January 23, 2018, Veresen Midstream placed its second 200 MMcf/d gross (93 MMcf/d net) gas processing Saturn
facility into service ahead of schedule and under budget. In September 2017, Veresen Midstream placed 200 MMcf/d
(gross) of gas processing capacity at the Tower facility and 400 MMcf/d gross (185 MMcf/d net) of gas processing capacity
at the Sunrise facility into service; and in November 2017, it placed the first 200 MMcf/d gross (93 MMcf/d net) of gas
processing capacity at the Saturn facility into service. In support of the development of the liquids-rich Montney resource
play, Veresen Midstream has now placed 1 bcf/d (gross) of gas processing capacity into service over late 2017 and early
2018.
Pembina continues to progress its proposed liquefied natural gas export terminal in Coos Bay, Oregon, and the related
Pacific Connector Gas Pipeline (combined "Jordan Cove") that will transport natural gas from the Malin Hub in southern
Oregon to the export terminal. In September 2017, the Company filed applications with the United States Federal Energy
Regulatory Commission ("FERC") for the construction and operation of Jordan Cove and is positioned to receive a FERC
decision in late 2018. Pembina has committed a 2018 capital budget of $135 million to progress Jordan Cove to a final
investment decision, pending the receipt of the necessary regulatory approvals and other requirements.
The Company continues to advance the construction of a 1 mmbbls barrel ethane storage facility ("Burstall Ethane
Storage") located near Burstall, Saskatchewan for a total expected capital cost of approximately $180 million. The Burstall
Ethane Storage is underpinned by a 20-year agreement and is expected to be placed into service in late 2018.
U.S. Tax Reform
The U.S. Tax Reform was substantively enacted on December 22, 2017 with the majority of the legislation effective
January 1, 2018. The new tax legislation includes tax reforms affecting businesses, including corporate tax rate reduction,
business deductions and international tax provisions. Pembina has analyzed the provisions in the new legislation and
estimated the impact on the Company's US businesses, however these estimates may be adjusted in the future based on
anticipated future regulations and guidance from the U.S. Treasury and the Internal Revenue Service. Overall, Pembina
expects the benefit of a lower U.S. tax rate will exceed any incremental tax payable, as a result of other provisions of U.S.
Tax Reform. Areas identified which have had significant impact include:
Corporate Tax Rate Reduction
The new tax law reduces the federal statutory corporate tax rate from 35 percent to 21 percent for tax years beginning
after December 31, 2017. This rate reduction requires deferred tax assets and liabilities to be re-measured. The rate
reduction had a favorable impact to Pembina as recognized in the deferred tax recovery for the quarter ending December
31, 2017 mainly resulting from our acquisition of Veresen. Pembina expects to realize more significant tax savings in future

Pembina Pipeline Corporation
20
US taxable income due to the corporate tax rate reduction and believes that the rates of return anticipated from our
investments should increase due to the lower tax rate and the increased tax depreciation deductions.
Mandatory Repatriation
The new legislation requires a mandatory deemed repatriation of post 1986 undistributed foreign earnings and profits of
foreign subsidiaries of a US entity. Pembina has recognized this one-time mandatory repatriation tax of approximately $30
million, which is payable over eight years, in current tax expense. At this time, Pembina does not anticipate a similar
repatriation tax impact in the future.
Other Non-Operating Expenses
Other Expense (Income)
Included in other expense are transaction costs incurred in respect of acquisitions of $18 million and $25 million for the
fourth quarter and full year of 2017, respectively, compared to nil and $1 million in the comparable periods of 2016.
Acquisition costs incurred in 2017 pertained to the acquisition of Veresen (see Note 6 to the Consolidated Financial
Statements) and in 2016 to the acquisition of the Kakwa River facility.
Pension Liability
Pembina maintains a defined contribution plan and non-contributory defined benefit pension plans covering employees
and retirees. The defined benefit plans include a funded registered plan for all qualified employees and an unfunded
supplemental retirement plan for those employees affected by the Canada Revenue Agency maximum pension limits. At
the end of 2017, the pension plans carried a net obligation of $21 million compared to a net obligation of $26 million at
the end of 2016. At December 31, 2017, plan obligations amounted to $203 million (2016: $190 million) compared to plan
assets of $182 million (2016: $164 million). In 2017, the pension plans' expense was $14 million (2016: $11 million).
Pembina's contributions to the pension plans totaled $16 million in 2017 (2016: $15 million).
Financing Activity
On January 20, 2017, Pembina closed an offering of $300 million of senior unsecured Series 8 medium-term notes (the
"Series 8 Notes"). The Series 8 Notes have a fixed coupon of 2.99 percent per annum, paid semi-annually, and mature on
January 22, 2024. Simultaneously, Pembina closed an offering of $300 million of senior unsecured Series 9 medium-term
notes (the "Series 9 Notes").
On August 16, 2017, Pembina closed an offering of $600 million of senior unsecured medium-term notes. The offering was
conducted in two tranches consisting of $350 million principal amount through the re-opening of Pembina's Series 8 Notes
and $250 million through the re-opening of Pembina's Series 9 Notes.
On October 2, 2017, in connection with the Acquisition, the outstanding preferred shares of Veresen have been exchanged
for Pembina Class A Series 15, 17 and 19 Preferred Shares with the same terms and conditions as the shares previously
issued by Veresen. Dividends on the Series 15, 17 and 19 Preferred Shares will continue to be paid on the last business day
of March, June, September and December in each year, if, as and when declared by the Board of Directors.
Also in conjunction with the closing of the Acquisition on October 2, 2017, Pembina and Veresen undertook an
amalgamation under the Alberta Business Corporations Act. As a result, Pembina assumed all obligations related to the
Veresen medium-term notes and, indirectly, the Alberta Ethane Gathering System L.P. notes.
On December 7, 2017 Pembina closed an offering of $400 million of 16 million Series 21 Preferred Shares. Dividends on
the Series 21 Preferred Shares are expected to be $1.225 per share annually, payable quarterly on the 1st day of March,
Pembina Pipeline Corporation
21
June, September and December, as and when declared by the Board of Directors, for the initial fixed rate period to, but
excluding, March 1, 2023. The first dividend will be payable March 1, 2018, in the amount of $0.2819 per share.
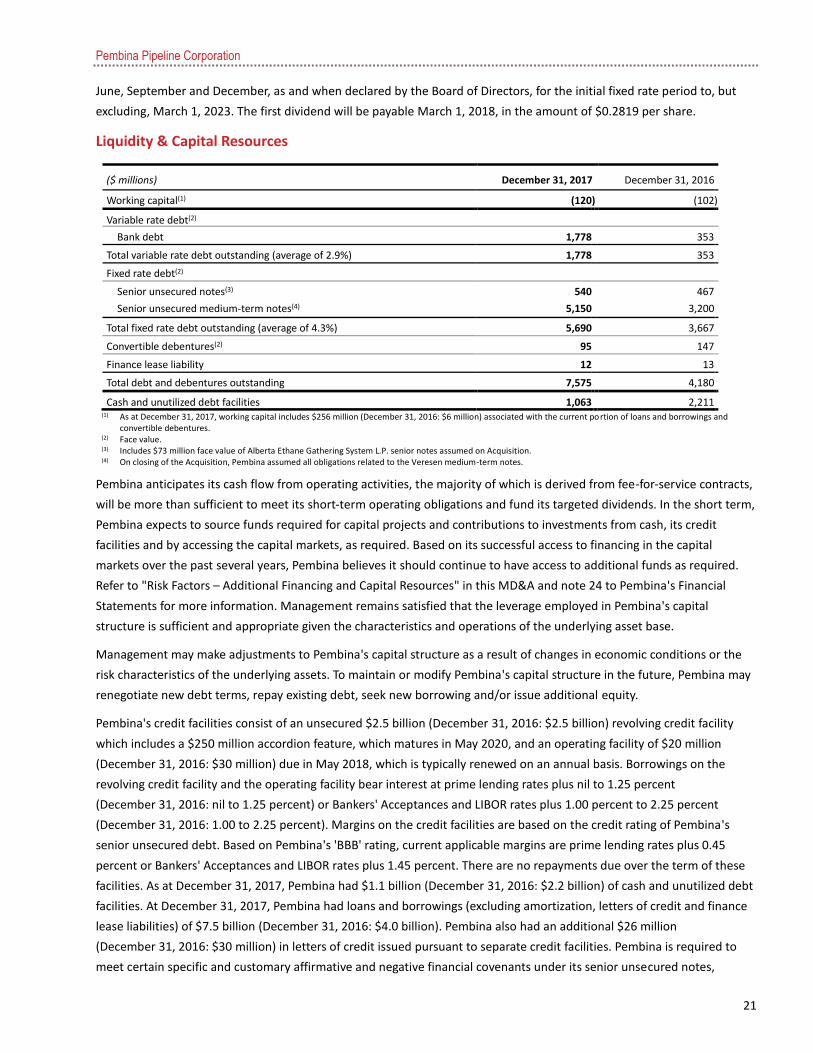
Liquidity & Capital Resources
($ millions) December 31, 2017 December 31, 2016
Working capital(1) (120 ) (102 )
Variable rate debt(2)
Bank debt 1,778 353
Total variable rate debt outstanding (average of 2.9%) 1,778 353
Fixed rate debt(2)
Senior unsecured notes(3) 540 467
Senior unsecured medium-term notes(4) 5,150 3,200
Total fixed rate debt outstanding (average of 4.3%) 5,690 3,667
Convertible debentures(2) 95 147
Finance lease liability 12 13
Total debt and debentures outstanding 7,575 4,180
Cash and unutilized debt facilities 1,063 2,211 (1) As at December 31, 2017, working capital includes $256 million (December 31, 2016: $6 million) associated with the current portion of loans and borrowings and
convertible debentures.
(2) Face value.
(3) Includes $73 million face value of Alberta Ethane Gathering System L.P. senior notes assumed on Acquisition.
(4) On closing of the Acquisition, Pembina assumed all obligations related to the Veresen medium-term notes.
Pembina anticipates its cash flow from operating activities, the majority of which is derived from fee-for-service contracts,
will be more than sufficient to meet its short-term operating obligations and fund its targeted dividends. In the short term,
Pembina expects to source funds required for capital projects and contributions to investments from cash, its credit
facilities and by accessing the capital markets, as required. Based on its successful access to financing in the capital
markets over the past several years, Pembina believes it should continue to have access to additional funds as required.
Refer to "Risk Factors – Additional Financing and Capital Resources" in this MD&A and note 24 to Pembina's Financial
Statements for more information. Management remains satisfied that the leverage employed in Pembina's capital
structure is sufficient and appropriate given the characteristics and operations of the underlying asset base.
Management may make adjustments to Pembina's capital structure as a result of changes in economic conditions or the
risk characteristics of the underlying assets. To maintain or modify Pembina's capital structure in the future, Pembina may
renegotiate new debt terms, repay existing debt, seek new borrowing and/or issue additional equity.
Pembina's credit facilities consist of an unsecured $2.5 billion (December 31, 2016: $2.5 billion) revolving credit facility
which includes a $250 million accordion feature, which matures in May 2020, and an operating facility of $20 million
(December 31, 2016: $30 million) due in May 2018, which is typically renewed on an annual basis. Borrowings on the
revolving credit facility and the operating facility bear interest at prime lending rates plus nil to 1.25 percent
(December 31, 2016: nil to 1.25 percent) or Bankers' Acceptances and LIBOR rates plus 1.00 percent to 2.25 percent
(December 31, 2016: 1.00 to 2.25 percent). Margins on the credit facilities are based on the credit rating of Pembina's
senior unsecured debt. Based on Pembina's 'BBB' rating, current applicable margins are prime lending rates plus 0.45
percent or Bankers' Acceptances and LIBOR rates plus 1.45 percent. There are no repayments due over the term of these
facilities. As at December 31, 2017, Pembina had $1.1 billion (December 31, 2016: $2.2 billion) of cash and unutilized debt
facilities. At December 31, 2017, Pembina had loans and borrowings (excluding amortization, letters of credit and finance
lease liabilities) of $7.5 billion (December 31, 2016: $4.0 billion). Pembina also had an additional $26 million
(December 31, 2016: $30 million) in letters of credit issued pursuant to separate credit facilities. Pembina is required to
meet certain specific and customary affirmative and negative financial covenants under its senior unsecured notes,
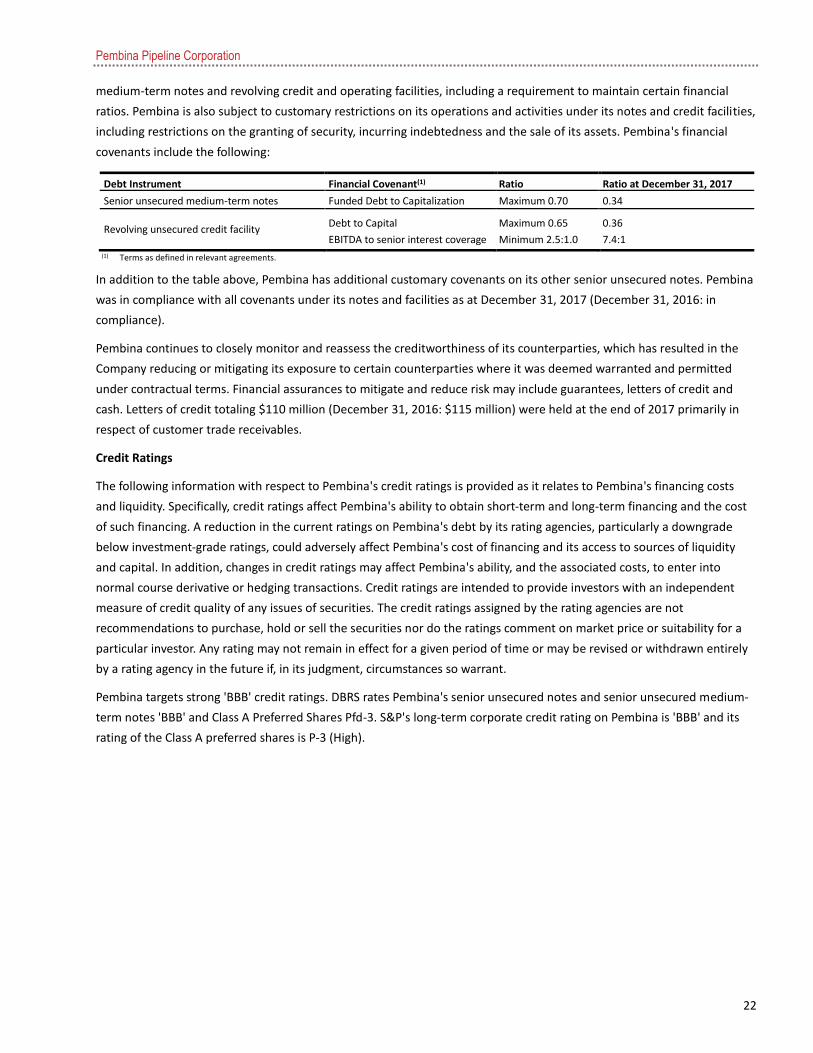
Pembina Pipeline Corporation
22
medium-term notes and revolving credit and operating facilities, including a requirement to maintain certain financial
ratios. Pembina is also subject to customary restrictions on its operations and activities under its notes and credit facilities,
including restrictions on the granting of security, incurring indebtedness and the sale of its assets. Pembina's financial
covenants include the following:
Debt Instrument Financial Covenant(1) Ratio Ratio at December 31, 2017
Senior unsecured medium-term notes Funded Debt to Capitalization Maximum 0.70 0.34
Revolving unsecured credit facility Debt to Capital
EBITDA to senior interest coverage
Maximum 0.65
Minimum 2.5:1.0
0.36
7.4:1
(1) Terms as defined in relevant agreements.
In addition to the table above, Pembina has additional customary covenants on its other senior unsecured notes. Pembina
was in compliance with all covenants under its notes and facilities as at December 31, 2017 (December 31, 2016: in
compliance).
Pembina continues to closely monitor and reassess the creditworthiness of its counterparties, which has resulted in the
Company reducing or mitigating its exposure to certain counterparties where it was deemed warranted and permitted
under contractual terms. Financial assurances to mitigate and reduce risk may include guarantees, letters of credit and
cash. Letters of credit totaling $110 million (December 31, 2016: $115 million) were held at the end of 2017 primarily in
respect of customer trade receivables.
Credit Ratings
The following information with respect to Pembina's credit ratings is provided as it relates to Pembina's financing costs
and liquidity. Specifically, credit ratings affect Pembina's ability to obtain short-term and long-term financing and the cost
of such financing. A reduction in the current ratings on Pembina's debt by its rating agencies, particularly a downgrade
below investment-grade ratings, could adversely affect Pembina's cost of financing and its access to sources of liquidity
and capital. In addition, changes in credit ratings may affect Pembina's ability, and the associated costs, to enter into
normal course derivative or hedging transactions. Credit ratings are intended to provide investors with an independent
measure of credit quality of any issues of securities. The credit ratings assigned by the rating agencies are not
recommendations to purchase, hold or sell the securities nor do the ratings comment on market price or suitability for a
particular investor. Any rating may not remain in effect for a given period of time or may be revised or withdrawn entirely
by a rating agency in the future if, in its judgment, circumstances so warrant.
Pembina targets strong 'BBB' credit ratings. DBRS rates Pembina's senior unsecured notes and senior unsecured medium-
term notes 'BBB' and Class A Preferred Shares Pfd-3. S&P's long-term corporate credit rating on Pembina is 'BBB' and its
rating of the Class A preferred shares is P-3 (High).
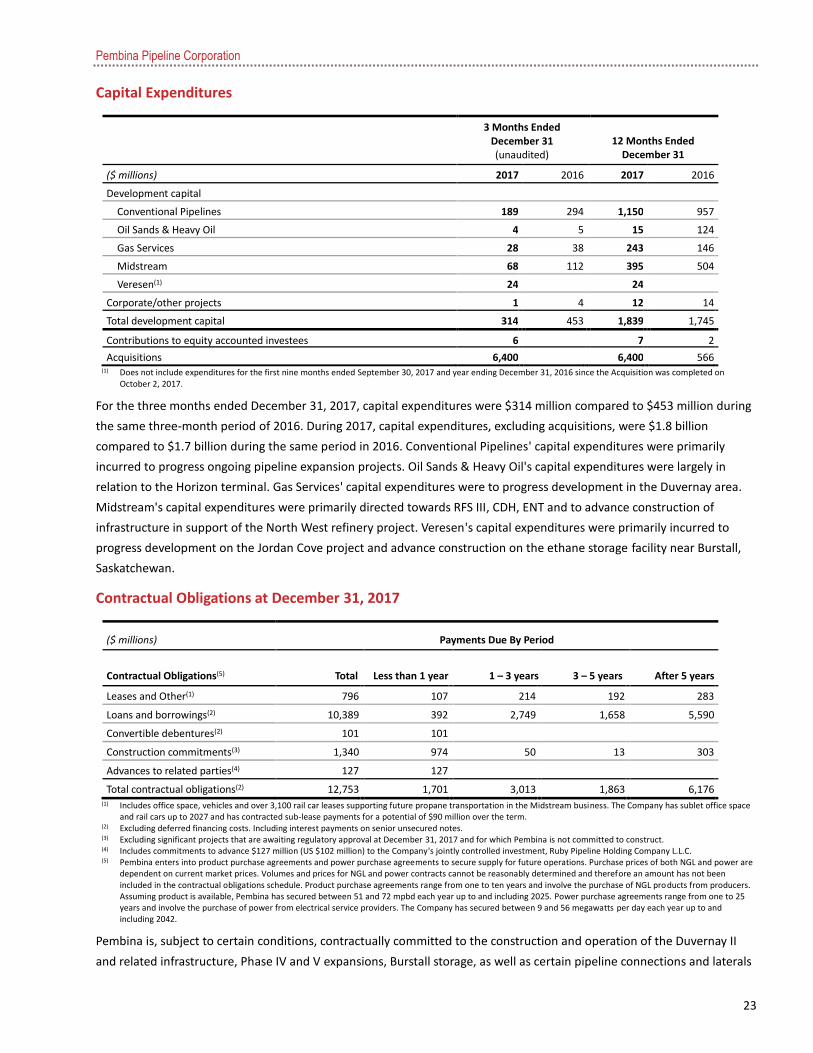
Pembina Pipeline Corporation
23
Capital Expenditures
3 Months Ended
December 31 (unaudited)
12 Months Ended December 31
($ millions) 2017 2016 2017 2016
Development capital
Conventional Pipelines 189 294 1,150 957
Oil Sands & Heavy Oil 4 5 15 124
Gas Services 28 38 243 146
Midstream 68 112 395 504
Veresen(1) 24 24
Corporate/other projects 1 4 12 14
Total development capital 314 453 1,839 1,745
Contributions to equity accounted investees 6 7 2
Acquisitions 6,400 6,400 566 (1) Does not include expenditures for the first nine months ended September 30, 2017 and year ending December 31, 2016 since the Acquisition was completed on
October 2, 2017.
For the three months ended December 31, 2017, capital expenditures were $314 million compared to $453 million during
the same three-month period of 2016. During 2017, capital expenditures, excluding acquisitions, were $1.8 billion
compared to $1.7 billion during the same period in 2016. Conventional Pipelines' capital expenditures were primarily
incurred to progress ongoing pipeline expansion projects. Oil Sands & Heavy Oil's capital expenditures were largely in
relation to the Horizon terminal. Gas Services' capital expenditures were to progress development in the Duvernay area.
Midstream's capital expenditures were primarily directed towards RFS III, CDH, ENT and to advance construction of
infrastructure in support of the North West refinery project. Veresen's capital expenditures were primarily incurred to
progress development on the Jordan Cove project and advance construction on the ethane storage facility near Burstall,
Saskatchewan.
Contractual Obligations at December 31, 2017
($ millions) Payments Due By Period
Contractual Obligations(5) Total Less than 1 year 1 – 3 years 3 – 5 years After 5 years
Leases and Other(1) 796 107 214 192 283
Loans and borrowings(2) 10,389 392 2,749 1,658 5,590
Convertible debentures(2) 101 101
Construction commitments(3) 1,340 974 50 13 303
Advances to related parties(4) 127 127
Total contractual obligations(2) 12,753 1,701 3,013 1,863 6,176 (1) Includes office space, vehicles and over 3,100 rail car leases supporting future propane transportation in the Midstream business. The Company has sublet office space
and rail cars up to 2027 and has contracted sub-lease payments for a potential of $90 million over the term.
(2) Excluding deferred financing costs. Including interest payments on senior unsecured notes.
(3) Excluding significant projects that are awaiting regulatory approval at December 31, 2017 and for which Pembina is not committed to construct.
(4) Includes commitments to advance $127 million (US $102 million) to the Company's jointly controlled investment, Ruby Pipeline Holding Company L.L.C.
(5) Pembina enters into product purchase agreements and power purchase agreements to secure supply for future operations. Purchase prices of both NGL and power are dependent on current market prices. Volumes and prices for NGL and power contracts cannot be reasonably determined and therefore an amount has not been included in the contractual obligations schedule. Product purchase agreements range from one to ten years and involve the purchase of NGL products from producers. Assuming product is available, Pembina has secured between 51 and 72 mpbd each year up to and including 2025. Power purchase agreements range from one to 25 years and involve the purchase of power from electrical service providers. The Company has secured between 9 and 56 megawatts per day each year up to and including 2042.
Pembina is, subject to certain conditions, contractually committed to the construction and operation of the Duvernay II
and related infrastructure, Phase IV and V expansions, Burstall storage, as well as certain pipeline connections and laterals

Pembina Pipeline Corporation
24
and select caverns at the Company's Redwater site. Additional commitments exist in relation to assets recently brought
into service and other corporate infrastructure. See "Forward-Looking Statements & Information" and "Liquidity & Capital
Resources."
Dividends
Common Share Dividends
Common share dividends are payable if, as, and when declared by Pembina's Board of Directors. The amount and
frequency of dividends declared and payable is at the discretion of the Board of Directors, which considers earnings, cash
flow, capital requirements, the financial condition of Pembina and other relevant factors when making its dividend
determination.
Pembina's Board of Directors approved a 6.25 percent increase in its monthly common share dividend rate (from $0.16
per common share to $0.17 per common share), commencing with the dividend paid on May 15, 2017. In connection with
the Acquisition, Pembina increased its monthly dividend by an additional 5.88 percent to $0.18 per common share,
effective for the dividend paid on November 15, 2017.
Preferred Share Dividends
The holders of Pembina's class A preferred shares are entitled to receive fixed cumulative dividends. Dividends on the
Series 1, 3, 5, 7, 9, 11, 13 and 21 preferred shares are payable quarterly on the 1st day of March, June, September and
December, if, as and when declared by the Board of Directors of Pembina, for the initial fixed-rate period for each series of
preferred share. Dividends on the preferred shares Series 15 (previously Series A preferred of Veresen), 17 (previously
Series C preferred of Veresen) and 19 (previously Series E preferred of Veresen) (refer to Note 16 in the Financial
Statements) are payable on the last day of March, June, September and December in each year, if, as and when declared
by the Board of Directors.
DRIP
Pembina suspended its Premium Dividend™ and Dividend Reinvestment Plan ("DRIP"), effective April 25, 2017.
Accordingly, the March 2017 dividend was the last dividend with the ability to be reinvested through the DRIP.
Shareholders who were enrolled in the program automatically receive dividends in the form of cash. If Pembina elects to
reinstate the DRIP in the future, shareholders that were enrolled in the DRIP at suspension and remained enrolled at
reinstatement will automatically resume participation in the DRIP.
Related Party Transactions
During the fourth quarter and twelve months ended December 31, 2017, Pembina advanced $7 million and $13 million,
respectively, in funds to its jointly controlled investment in CKPC. In addition, during the fourth quarter and twelve months
ended December 31, 2017, Pembina advanced US$10 million in addition to the US$13 million balance assumed on
Acquisition for a total of US$23 million advanced to its jointly controlled investment in Ruby Pipeline Holding Company
L.L.C., and has additional commitments to advance US$102 million to the same related party by March 31, 2018.
For the twelve months ended December 31, 2017, Pembina had no other transactions with related parties as defined in
International Accounting Standard 24 – Related Party Disclosures, except those pertaining to contributions to Pembina's
defined benefit pension plan and remuneration of key management personnel, including the Board of Directors, in the
ordinary course of their employment or directorship agreements.

Pembina Pipeline Corporation
25
Critical Accounting Judgments and Estimates
The preparation of the Consolidated Financial Statements in conformity with IFRS requires management to make
judgments, estimates and assumptions that are based on the circumstances and estimates at the date of the financial
statements and affect the application of accounting policies and the reported amounts of assets, liabilities, income and
expenses. Actual results may differ from these estimates.
Judgments, estimates and underlying assumptions are reviewed on an ongoing basis. Revisions to accounting estimates
are recognized in the period in which the estimates are revised and in any future periods affected.
The following judgment and estimation uncertainties are those management considers material to the Company's
financial statements:
Judgments
(i) Business combinations
Business combinations are accounted for using the acquisition method of accounting. The determination of fair value
often requires management to make judgments about future possible events. The assumptions with respect to
determining the fair value of equity accounted investees, property, plant and equipment and intangible assets acquired
generally require the most judgment.
(ii) Depreciation and amortization
Depreciation and amortization of property, plant and equipment and intangible assets are based on management's
judgment of the most appropriate method to reflect the pattern of an asset's future economic benefit expected to be
consumed by the Company. Among other factors, these judgments are based on industry standards and historical
experience.
(iii) Impairment
Assessment of impairment is based on management's judgment of whether there are internal and external factors that
would indicate that an asset, investment, or cash generating unit ("CGU") is impaired. The determination of a CGU is also
based on management's judgment and is an assessment of the smallest group of assets that generate cash inflows
independently of other assets. The asset composition of a CGU can directly impact the recoverability of the assets
included therein. In assessing the recoverability, each CGU's carrying value is compared to its recoverable amount, defined
as the greater of fair value less costs to sell and value in use.
(iv) Assessment of joint control over joint arrangements
Jointly controlled arrangements which entitle the Company to the rights of the net assets to the arrangement are
accounted for using the equity method. The determination of joint control requires judgment about the influence the
Company has over the financial and operating decisions of the arrangement and the extent of the benefits it obtains
based on the facts and circumstances of the arrangement during the reporting period. Joint control exists when decisions
about the relevant activities require the unanimous consent of the parties that control the arrangement collectively.
Ownership percentage alone may not be a determinant of joint control.
Estimates
(i) Business Combinations
Estimates of future cash flows, forecast prices, interest rates and discount rates are made in determining the fair value of
assets acquired and liabilities assumed. Changes in any of the assumptions or estimates used in determining the fair value

Pembina Pipeline Corporation
26
of acquired assets and liabilities could impact the amounts assigned to assets, liabilities, intangible assets and goodwill in
the purchase price equation. Future earnings can be affected as a result of changes in future depreciation and
amortization, asset or goodwill impairment.
(ii) Provisions and contingencies
Provisions recognized are based on management's judgment about assessing contingent assets and liabilities and timing,
scope and amount of assets and liabilities. Management uses judgment in determining the likelihood of realization of
contingent assets and liabilities to determine the outcome of contingencies.
Based on the long-term nature of the decommissioning provision, the most significant uncertainties in estimating the
provision are the discount and inflation rates used, the costs that will be incurred and the timing of when these costs will
occur.
(iii) Deferred taxes
The calculation of the deferred tax asset or liability is based on assumptions about the timing of many taxable events and
the enacted or substantively enacted rates anticipated to be applicable to income in the years in which temporary
differences are expected to be realized or reversed.
(iv) Depreciation and amortization
Estimated useful lives of property, plant and equipment and intangible assets are based on management's assumptions
and estimates of the physical useful lives of the assets, the economic lives, which may be associated with the reserve lives
and commodity type of the production area, in addition to the estimated residual value.
(v) Impairment tests
Impairment tests include management's best estimates of future cash flows and discount rates.
Changes in Accounting Policies
New standards adopted in 2017
The Company has adopted IFRS 9 Financial Instruments (2014) effective January 1, 2017. The new standard addresses the
classification and measurement of financial assets and financial liabilities, impairment and hedge accounting.
IFRS 9 introduces new requirements for the measurement and classification of financial assets, replacing the previous
multiple classification and measurement models. IFRS 9 requires the classification of financial assets in three main
categories: fair value through profit or loss, fair value through other comprehensive income, and amortized cost. All of the
Company's financial assets have been reclassified from loans and receivables at amortized cost to financial assets at
amortized cost. There was no change in the carrying value of the Company's financial assets.
New standards and interpretations not yet adopted
Certain new standards, interpretations, amendments and improvements to existing standards were issued by the IASB or
IFRIC and are effective for accounting periods beginning after January 1, 2017. These standards have not been applied in
preparing these Financial Statements. Those which may be relevant to Pembina are described below:
IFRS 15 Revenue from Contracts with Customers
In May 2014, the International Accounting Standards Board issued IFRS 15 Revenue from contracts with customers, which
supersedes existing revenue guidance, effective for periods beginning on or after January 1, 2018. IFRS 15 contains a single
model that applies to contracts with customers and two approaches to recognizing revenue: at a point in time or over

Pembina Pipeline Corporation
27
time. The model outlines a five step analysis to assess contracts which involves identifying the contract, identifying the
performance obligations, determining the transaction price, allocating the transaction price to the performance
obligations and recognizing revenue when or as the entity satisfies a performance obligation. Detailed guidance is also
provided on a number of areas for which there was no previous guidance, including contract costs and contract
modifications. In April 2016, the IASB issued Clarifications to IFRS 15, Revenue from Contracts with Customers, which is
effective at the same time as IFRS 15, and provides additional guidance on the five step analysis and transition.
The Company is on track to adopt IFRS 15 and the clarifications on the January 1, 2018 effective date. On transition, the
standard permits either a full retrospective approach with restatement of all prior periods presented or a modified
retrospective approach where the cumulative effect of initially applying the new standard is recognized as an adjustment
to opening retained earnings in the period of adoption. The Company has tentatively decided to adopt IFRS 15 using the
full retrospective approach.
The Company has completed a detailed implementation plan, identified revenue streams and major contract types. Within
each identified revenue stream, the Company has substantively reviewed and analyzed the revenue contracts in
accordance with the five steps. The Company has also assessed the impact of the new standard on its systems and
processes.
Based on the assessments completed to date, the Company has determined that the application of the new standard will
result in a change to the timing and pattern of revenue recognition, specifically with respect to certain long term Take or
Pay ("ToP") revenue contracts with make-up rights in our Conventional Pipelines and Gas Services businesses. The change
in timing of revenue recognition for ToP revenue contracts will be a result of revenues being recognized based on the
volumes flowed or processed rather than when the service capacity is provided for long term ToP contracts with make-up
rights. Under long term ToP contracts, customers are committed to meet minimum volume or revenue commitments.
Make-up rights arise when a customer does not meet its minimum ToP volume or revenue commitment in a certain
period, but is contractually permitted to use future volumes or revenues to meet past ToP commitments. These make-up
rights are subject to expiry and have varying conditions associated with them. Depending on the specific conditions and
terms of the make-up rights, revenue recognition may be deferred early in a contract year when certain make-up rights
are outstanding and recognized later in the contract year once these make-up rights are used, expire, or it is determined
to be remote that a customer will use them. While this change is not expected to have a material impact on annual
revenue, it is expected to result in a change in timing for quarterly revenue recognition (i.e. potentially lower revenue in
the first and second quarters with higher revenue in the third and fourth quarters). There will be no impact on the timing
of cash flow.
In addition, IFRS 15 will result in significant changes to disclosures based on the additional requirements outlined in the
standard. These disclosures include the identification of significant judgments that have been made in applying the
standard, information on changes to contract assets and liabilities, and details regarding how the Company recognizes
revenue including performance obligations identified, determination of transaction price, and how the transaction price
has been allocated to performance obligations. IFRS 15 also requires the disclosure of the amount of the transaction price
that has been allocated to remaining unsatisfied performance obligations. This disclosure will primarily impact long-term
contracts with ToP contract terms.
The Company has determined that there will be no material impact on existing systems on implementation of IFRS 15,
however, new processes and controls are being designed and will be implemented as needed with respect to revenue
recognition for impacted ToP contracts and to meet disclosure requirements.
Pembina Pipeline Corporation
28
IFRS 16 Leases
IFRS 16 Leases is effective for annual periods beginning on or after January 1, 2019. The new standard results in
substantially all lessee leases being recorded on the statement of financial position.
The Company intends to adopt IFRS 16 for the annual period beginning on January 1, 2019. The Company is currently
evaluating the impact that the standard will have on its results of operations and financial position.
Controls and Procedures
Disclosure Controls and Procedures
Pembina maintains disclosure controls and procedures designed to provide reasonable assurance that information
required to be disclosed in Pembina's filings is reviewed, recognized and disclosed accurately and in the appropriate time
period.
An evaluation, as at December 31, 2017, of the effectiveness of the design and operation of Pembina's disclosure controls
and procedures, as defined in Rule 13a - 15(e) and 15d - 15(e) under the United States Securities Exchange Act of 1934, as
amended (the "Exchange Act") and National Instrument 52-109 Certification of Disclosure in Issuer's Annual and Interim
Filings ("NI 52-109"), was carried out by management, including the Chief Executive Offer ("CEO") and the Chief Financial
Officer ("CFO"). Based on that evaluation, the CEO and CFO have concluded that the design and operation of Pembina's
disclosure controls and procedures were effective as at December 31, 2017 to ensure that material information relating to
the Company is made known to the CEO and CFO by others.
It should be noted that while the CEO and CFO believe that Pembina's disclosure controls and procedures provide a
reasonable level of assurance that they are effective, they do not expect that Pembina's disclosure controls and
procedures will prevent all errors or fraud. A control system, no matter how well conceived or operated, can provide only
reasonable, not absolute, assurance that the objectives of the control system are met.
Management's Annual Report on Internal Control over Financial Reporting
Pembina maintains internal control over financial reporting which is designed to provide reasonable assurance regarding
the reliability of financial reporting and the preparation of financial statements for external purposes in accordance with
IFRS.
Management is responsible for establishing and maintaining adequate internal control over financial reporting, as defined
in Rules 13a - 15(f) and 15d - 15(f) under the Exchange Act and under NI 52-109.
Management, including the CEO and the CFO, has conducted an evaluation of Pembina's internal control over financial
reporting based on criteria established in Internal Control - Integrated Framework (2013) issued by the Committee of
Sponsoring Organizations of the Treadway Commission (COSO). Based on management's assessment as at December 31,
2017, the CEO and CFO have concluded that Pembina's internal control over financial reporting is effective.
In accordance with the provisions of NI 52-109 and consistent with SEC guidance, the scope of the evaluation did not
include internal controls over financial reporting of Veresen, which the Company acquired on October 2, 2017. Veresen
was excluded from management's evaluation of the effectiveness of the Company's internal control over financial
reporting as at December 31, 2017 due to the proximity of the Acquisition to year-end. Further details related to the
Acquisition are disclosed in Note 6 to the Company's Consolidated Financial Statements for the year ended December 31,
2017. Veresen's assets and revenue represented approximately 28 percent and nil percent, respectively, of the Company's
total assets and revenue as at December 31, 2017. Share of profit from Veresen's equity accounted investees amounted to
$116 million from the date of acquisition.
Pembina Pipeline Corporation
29
Due to its inherent limitations, internal control over financial reporting is not intended to provide absolute assurance that
a misstatement of Pembina's financial statements would be prevented or detected. Further, the evaluation of the
effectiveness of internal control over financial reporting was made as at a specific date, and continued effectiveness in
future periods is subject to the risks that controls may become inadequate.
The effectiveness of internal control over financial reporting as at December 31, 2017 was audited by KPMG LLP, an
independent registered public accounting firm, as stated in their Report of Independent Registered Public Accounting
Firm, which is included in this 2017 Annual Report to shareholders.
Changes in Internal Control over Financial Reporting
The Company's internal controls over financial reporting commencing October 2, 2017 include Veresen's systems,
processes and controls, as well as additional controls designed to result in complete and accurate consolidation of
Veresen's results. Other than Veresen, there has been no change in the Company's internal control over financial reporting
that occurred during the year covered by this Annual Report that has materially affected, or are reasonably likely to
materially affect, Pembina's internal control over financial reporting.
Risk Factors
Pembina's value proposition is based on balancing economic benefit against risk. Where appropriate, Pembina will reduce
risk. Pembina continually works to mitigate the impact of potential risks to its business by identifying all significant risks so
that they can be appropriately managed. To assist with identifying risk, Pembina has implemented a comprehensive Risk
Management Program. The risks that may affect the business and operation of Pembina and its operating subsidiaries are
described at a high level within this MD&A and more fully within Pembina's Annual Information Form ("AIF"), an electronic
copy of which is available at www.pembina.com or on Pembina's SEDAR profile at www.sedar.com and which is filed under
Form 40-F on Pembina's EDGAR profile at www.sec.gov. Further, additional discussion about counterparty risk, market
risk, liquidity risk and additional information on financial risk management can be found in Note 24.
Operational Risks
Operational risks include: pipeline leaks; the breakdown or failure of equipment, pipelines and facilities, information
systems or processes; the compromise of information and control systems; the performance of equipment at levels below
those originally intended (whether due to misuse, unexpected degradation or design, construction or manufacturing
defects); spills at truck terminals and hubs; spills associated with the loading and unloading of harmful substances onto rail
cars and trucks; failure to maintain adequate supplies of spare parts; operator error; labour disputes; disputes with
interconnected facilities and carriers; operational disruptions or apportionment on third-party systems or refineries, which
may prevent the full utilization of Pembina's facilities and pipelines; and catastrophic events including, but not limited to,
extreme weather events, including fires, floods and other natural disasters, explosions, train derailments, earthquakes,
acts of terrorists and saboteurs, and other similar events, many of which are beyond the control of Pembina and all of
which could result in damage to assets, related spills or other environmental issues, operational disruptions, and delays in
construction, labour and materials. Pembina may also be exposed from time to time to additional operational risks not
stated in the immediately preceding sentences. The occurrence or continuance of any of these events could increase the
cost of operating Pembina's assets or reduce revenue, thereby impacting earnings. Additionally, facilities and pipelines are
reliant on electrical power for their operations. A failure or disruption within the local or regional electrical power supply
or distribution or transmission systems could significantly affect ongoing operations. Further, a significant increase in the
cost of power or fuel could have a materially negative effect on the level of profit realized in cases where the relevant
contracts do not provide for recovery of such costs. In the long-term, constraints on natural resources could be impacted
by climate change initiatives or policies, resulting in additional operational costs, delays or restrictions.

Pembina Pipeline Corporation
30
Pembina is committed to preserving customer and Shareholder value by proactively managing operational risk through
safe and reliable operations. Senior managers are responsible for the daily supervision of operational risk by ensuring
appropriate policies, procedures and systems are in place within their business units and internal controls are operating
efficiently. Pembina also has an extensive program to manage system integrity, which includes the development and use of
in-line inspection tools and various other leak detection technologies. Pembina's maintenance, excavation and repair
programs are focused on risk mitigation and, as such, resources are directed to the areas of greatest benefit and
infrastructure is replaced or repaired as required. Pembina carries insurance coverage with respect to some, but not all,
casualty occurrences in amounts customary for similar business operations, which coverage may not be sufficient to
compensate for all casualty occurrences. In addition, Pembina has a comprehensive Corporate Security Management
Program designed to reduce security-related risks.
Possible Failure to Realize Anticipated Benefits of Corporate Strategy or the Veresen Acquisition
Pembina evaluates the value proposition for expansion projects, new acquisitions or divestitures on an ongoing basis.
Planning and investment analysis is highly dependent on accurate forecasting assumptions and to the extent that these
assumptions do not materialize, financial performance may be lower or more volatile than expected. Volatility in the
economy, change in cost estimates, project scoping and risk assessment could result in a loss in profits for Pembina. Large
scale acquisitions in particular may involve significant pricing and integration risk. As part of its ongoing strategy, Pembina
may complete acquisitions of assets or other entities in the future. Achieving the benefits of completed and future
acquisitions depends in part on successfully consolidating functions and integrating operations, procedures and personnel
in a timely and efficient manner, as well as Pembina's ability to realize the anticipated growth opportunities and synergies
from combining the acquired businesses and operations with those of Pembina. The integration of acquired businesses
and entities requires the dedication of substantial management effort, time and resources which may divert
management's focus and resources from other strategic opportunities and from operational matters during this process.
The integration process may result in the loss of key employees and the disruption of ongoing business, customer and
employee relationships that may adversely affect Pembina's ability to achieve the anticipated benefits of any acquisitions.
Acquisitions may also expose Pembina to additional risks, including entry into markets or businesses in which Pembina has
little or no direct prior experience, increased credit risks through the assumption of additional debt, costs and contingent
liabilities and exposure to liabilities of the acquired business or assets. See "General Risk Factors - Additional Financing
and Capital Resources" below.
Pembina completed the Veresen Acquisition to strengthen its position in the pipeline industry through a combined asset
base that is highly integrated across the value chain, benefit from diversification across basin and products, as well as
customers and currency, maintain a strong balance sheet and to pursue large growth projects. Achieving the benefits of
the Veresen Acquisition depends in part on successfully consolidating functions and integrating operations, procedures
and personnel in a timely and efficient manner, as well as the ability of Pembina, to realize the anticipated growth
opportunities and synergies from combining the acquired businesses and operations of Veresen with those of Pembina.
The integration of the Veresen assets requires the dedication of substantial management effort, time and resources which
may divert management's focus and resources from other strategic opportunities and from operational matters during this
process. The integration process may result in the loss of key employees and the disruption of ongoing business, customer
and employee relationships that may adversely affect Pembina's ability to achieve the anticipated benefits of the Veresen
Acquisition.
Pembina has been working with the Commissioner of Competition and his staff relating to their review of the Veresen
Acquisition, and in particular, AEGS. Should Pembina and the Commissioner of Competition not reach a mutual agreement
relating to AEGS, the matter may be referred to the Competition Tribunal by the Commissioner of Competition for
Pembina Pipeline Corporation
31
resolution for a period of up to one year from closing. The Company is of the view that its ownership of AEGS is
complementary to its NGL infrastructure, and Pembina's fee-for-service business model will continue to drive increased
volumes across both AEGS and its NGL infrastructure benefiting producers and the broader NGL market. However, should
a mutual agreement between the Commissioner of Competition and Pembina not be reached, the Competition Tribunal
may impose remedies on Pembina as may be permitted by the Competition Act, which may have an adverse effect on
Pembina's business and operations. At this time Pembina is unable to predict with certainty what impact any such
remedies may have but management's current assessment is that any such remedy will have a minimal impact on
Pembina's business and operations.
Joint Ownership and Third Party Operators
Certain of Pembina's assets are jointly held and are governed by partnership and shareholder agreements. As a result,
certain decisions regarding these assets require a simple majority, while others require 100 percent approval of the
owners. In addition, certain of these assets are operated by unrelated third party entities. The business success of these
assets is to some extent dependent on the effectiveness of the business relationship and decision making among Pembina
and the other joint owner(s) and the expertise and ability of these third party operators to successfully operate and
maintain the assets. While Pembina believes that there are prudent governance and contractual rights in place, there can
be no assurance that Pembina will not encounter disputes with partners or that assets operated by third parties may not
perform as expected. Such events could impact operations or cash flows of these assets or cause them to not operate as
Pembina expects which, in turn, could have a negative impact on Pembina's business operations and financial results, and
could reduce Pembina's expected return on investment, thereby reducing the level of cash available for dividends and to
service obligations under Pembina's debt securities and other debt obligations.
Commodity Price Risk
Pembina's Midstream business includes activities related to product storage, terminalling, and hub services. These
activities expose Pembina to certain risks including that Pembina may experience volatility in revenue, and impairments
related to the book value of stored product, due to fluctuations in commodity prices. Primarily, Pembina enters into
contracts to purchase and sell crude oil, NGL and natural gas at floating market prices. The prices of products that are
marketed by Pembina are subject to volatility as a result of such factors as seasonal demand changes, extreme weather
conditions, market inventory levels, general economic conditions, changes in crude oil markets and other factors. Pembina
manages its risk exposure by balancing purchases and sales to lock-in margins. Notwithstanding Pembina's management
of price and quality risk, marketing margins for commodities can vary and have varied significantly from period to period.
This variability could have an adverse effect on the results of Pembina's Midstream business and to a lesser extent, its
Veresen business, and its overall results of operations. To assist in effectively smoothing that variability inherent in this
business, Pembina is investing in assets that have a fee-based revenue component, and is looking to expand this area
going forward.
Pembina is also exposed to possible price declines between the time Pembina purchases NGL feedstock and sells NGL
products, and to decreasing frac spreads. Frac spread is the difference between the sale prices of NGL products and the
cost of NGL sourced from natural gas and acquired at natural gas related prices. Frac spreads can change significantly from
period to period depending on the relationship between NGL and natural gas prices (the "frac spread ratio"), absolute
commodity prices, and changes in the Canadian to U.S. dollar foreign exchange rate. There is also a differential between
NGL product prices and crude oil prices which can change margins realized for midstream products separate from frac
spread ratio changes. The amount of profit or loss made on the extraction portion of the business will generally increase
or decrease with frac spreads. This exposure could result in variability of cash flow generated by the NGL Midstream

Pembina Pipeline Corporation
32
business and to a lesser extent, the Veresen business, which could affect Pembina and the cash dividends that Pembina is
able to distribute.
The Company utilizes financial derivative instruments as part of its overall risk management strategy to assist in managing
the exposure to commodity prices, as well as interest rates, cost of power and foreign exchange risk. As an example of
commodity price mitigation, the Company actively fixes a proportion of its exposure to fractionation margins through the
use of derivative financial instruments. Additionally, Pembina's Midstream business is also exposed to variability in quality,
time and location differentials, and financial instruments may be used to offset the Company's exposures to these basis
differentials. The Company does not trade financial instruments for speculative purposes. Commodity price fluctuations
and volatility can also impact producer activity and throughput in Pembina's infrastructure, as set out below.
For more information with respect to Pembina's financial instruments and financial risk management program, see Note
24 to Pembina's Financial Statements, which note is incorporated by reference herein.
Reserve Replacement, Throughput and Product Demand
Pembina's pipeline tariff revenue is based upon a variety of tolling arrangements, including fee-for-service, cost-of-service
agreements and market-based tolls. As a result, certain pipeline tariff revenue is heavily dependent upon throughput
levels of crude oil, NGL, natural gas and condensate. Future throughput on crude oil, natural gas and NGL pipelines and
replacement of oil and gas reserves in the service areas will be dependent upon the activities of producers operating in
those areas as they relate to exploiting their existing reserve bases and exploring for and developing additional reserves,
and technological improvements leading to increased recovery rates. Similarly, the volumes of natural gas processed
through Pembina's gas processing assets depends on production of natural gas in the areas serviced by the gas processing
business and associated pipelines. Without reserve additions, or expansion of the service areas, volumes on such pipelines
and in such facilities would decline over time as reserves are depleted. As oil and gas reserves are depleted, production
costs may increase relative to the value of the remaining reserves in place, causing producers to shut-in production or seek
out lower cost alternatives for transportation. If the level of tariffs collected by Pembina decreases as a result, cash flow
available for dividends to Shareholders and to service obligations under Pembina's debt securities and Pembina's other
debt obligations could be adversely affected.
Over the long-term, the ability and willingness of shippers to continue production, and as a consequence, Pembina's
business, will also depend, in part, on the level of demand and prices for crude oil, condensate, NGL and natural gas in the
markets served by the crude oil, natural gas and NGL pipelines and gas processing and gathering infrastructure in which
Pembina has an interest. Producers may shut-in production at lower product prices or higher production costs.
Global economic events may continue to have a substantial impact on the prices of such products. Pembina cannot predict
the impact of future supply/demand or economic conditions, fuel conservation measures, alternative fuel requirements,
governmental regulation or technological advances in fuel economy and energy generation devices on the energy and
petrochemical industries or future demand for and prices of natural gas, crude oil, condensate and NGL. A lower
commodity price environment will generally reduce drilling activity and, as a result, the supply growth that has been
fuelling the growth in midstream infrastructure could slow down. Producers in the areas serviced by the business may not
be successful in exploring for and developing additional reserves or achieving technological improvements to increase
recovery rates and production costs given lower commodity prices, and the gas plants and the pipelines may not be able
to maintain existing volumes of throughput. These factors could negatively affect pipeline and processing capacity value as
transportation and processing capacity becomes more abundant. Future prices of these products are determined by
supply and demand factors, including weather and general economic conditions as well as economic, political and other
conditions in other oil and natural gas regions, all of which are beyond Pembina's control. Lower production volumes will

Pembina Pipeline Corporation
33
also increase the competition for natural gas supply at gas processing plants, which could result in higher shrinkage
premiums being paid to natural gas producers.
The rate and timing of production from proven natural gas reserves tied into the gas plants is at the discretion of the
producers and is subject to regulatory constraints. The producers have no obligation to produce natural gas from these
lands. Pembina's gas processing assets are connected to various third-party trunk line systems. Operational disruptions or
apportionment on those third-party systems may prevent the full utilization of Pembina's gas processing assets, which
may have an adverse effect on its business.
Customer Contracts
Throughput on Pembina's pipelines is governed by transportation contracts or tolling arrangements with various
producers of petroleum products and natural gas and Pembina is party to numerous contracts of varying durations in
respect of its gas gathering, processing and fractionation facilities as well as terminalling and storage services. Any default
by counterparties under such contracts or any expiration of such contracts or tolling arrangements without renewal or
replacement may have an adverse effect on Pembina's business. Further, some of the contracts associated with the
services described above are comprised of a mixture of firm and non-firm contracts and the revenue that Pembina earns
on contracts which are based on non-firm or firm without take-or-pay service is dependent on the volume of natural gas,
NGL, crude oil and condensate produced by producers in the relevant geographic areas. Accordingly, lower than historical
production volumes in these areas (for reasons such as low commodity prices) may have an adverse effect on Pembina's
revenue. See "Description of Pembina's Business and Operations - Oil Sands & Heavy Oil Business", "Description of
Pembina's Business and Operations - Conventional Pipelines Business", "Description of Pembina's Business and Operations
- Gas Services Business" and "Description of Pembina's Business and Operations - Veresen Business."
Reputation
Reputational risk is the potential that market or company specific events, or other factors, could result in the deterioration
of Pembina's reputation with key stakeholders. The potential for harming Pembina's corporate reputation exists in every
business decision and all risks can have an impact on reputation, which in turn can negatively impact Pembina's business
and its securities. Reputational risk cannot be managed in isolation from other forms of risk. Credit, market, operational,
insurance, liquidity, regulatory and legal, and technology risks, among others, must all be managed effectively to safeguard
Pembina's reputation. Pembina's reputation could also be impacted by the actions and activities of other companies
operating in the energy industry, particularly other energy infrastructure providers, over which it has no control. In
particular, Pembina's reputation could be impacted by negative publicity related to pipeline incidents, unpopular
expansion plans or new projects, and due to opposition from organizations opposed to energy, oil sands and pipeline
development and particularly with shipment of production from oil sands regions. Further, Pembina's reputation could be
negatively impacted by changing public attitudes towards climate change and the perceived causes thereof, over which
the Company has no control. Negative impacts from a compromised reputation, whether as a result of Pembina's actions
or otherwise, could include revenue loss, reduction in customer base, delays in obtaining regulatory approvals with
respect to growth projects, reduced access to capital and decreased value of Pembina's securities.
Environmental Costs and Liabilities
Pembina's operations, facilities and petroleum product shipments are subject to extensive national, regional and local
environmental, health and safety laws and regulations governing, among other things, discharges to air, land and water,
the handling and storage of petroleum products and hazardous materials, waste disposal, the protection of employee
health, safety and the environment, and the investigation and remediation of contamination. Pembina's facilities could
experience incidents, malfunctions or other unplanned events that result in spills or emissions in excess of permitted
Pembina Pipeline Corporation
34
levels and result in personal injury, fines, penalties or other sanctions and property damage. Pembina could also incur
liability in the future for environmental contamination associated with past and present activities and properties. The
facilities and pipelines must maintain a number of environmental and other permits from various governmental
authorities in order to operate, and these facilities are subject to inspection from time to time. Failure to maintain
compliance with these requirements could result in operational interruptions, fines or penalties, or the need to install
additional pollution control technology. Licenses and permits must be renewed from time to time and there is no
guarantee that a license or permit will be renewed on the same or similar conditions. There can be no assurance that
Pembina will be able to obtain all of the licenses, permits, registrations, approvals and authorizations that may be required
to conduct operations that it may wish to undertake. Further, if at any time regulatory authorities deem any one of
Pembina's pipelines or facilities unsafe or not in compliance with applicable laws, they may order it to be shut down.
Certain significant environmental legislative initiatives that may materially impact Pembina's business and financial results
and conditions are outlined below.
In 2016, the Canadian federal government announced that its initial proposed pan-Canadian carbon tax will be $10 per
tonne commencing in 2018 and will escalate to $50 per tonne by 2022. In Alberta, the provincial government has
launched two of the initiatives under the Climate Change Act that were part of the Alberta Climate Leadership Plan. These
initiatives included the enactment of the carbon levy on all carbon emissions commencing on January 1, 2017 as well as
the release of the revised regulations for large facility emitters under the Carbon Competitiveness Incentive Regulations
that came into force on January 1, 2018. Pembina continues to follow the proposed changes to the regulatory framework
for the reduction of methane from fugitive and vented gas emissions. All Pembina business entities within Alberta have
obtained exemption certification from the carbon levy for the majority of its business activities, which will limit Pembina's
exposure to the levy until those exemptions expire in 2023. Where applicable, business entities have also obtained
licences under the carbon levy regulations for the buying and selling of regulated fuels without the need to recover and
remit the carbon levy on those fuel transactions. Alberta transitioned from the Specified Gas Emitters Regulation ("SGER")
to the Carbon Competitiveness Incentive Regulations in January 2018. This new system uses an output-based emission
allocations approach for emissions-intensive industries. Through active participation with industry associations and direct
engagement with regulatory bodies, Pembina will continue to monitor and assess for material impacts to Pembina's
business as regulations and policies continue to be developed.
Pembina has three natural gas processing facilities subject to the large emitter Carbon Competitiveness Incentive
Regulations. At present, the operational and financial impacts are minimal and are anticipated to not change substantially
under the new regulatory framework. As more facilities expand and increase production, we anticipate additional facilities
will become subject to the large emitter regulations. The potential costs and benefits of those facilities under the new
large emitter regulations are continuing to be assessed.
The Government of Alberta, in its climate change legislation and guidelines, is also transitioning oil sands facilities from
SGER to an output-based allocation approach for the carbon price and will legislate an overall limit to oil sands greenhouse
gas emissions. The legislated emissions limit on oil sands operations will be a maximum 100 megatonnes in any year;
currently oil sands operations emit roughly 70 megatonnes per year. This legislated change may limit oil sands production
growth in the future.
Similar policy reviews on climate change are underway in British Columbia, Saskatchewan, Manitoba, and Ontario. In
Ontario, Pembina is fully registered under the Ontario Climate Change Act, the Cap and Trade Program Regulations and
the Quantification, Reporting and Verification of Greenhouse Gas Emissions Regulations, and the product pricing
adjustments have been initiated for transactions starting on January 1, 2017 to recover/offset our anticipated compliance
costs.
Pembina Pipeline Corporation
35
While Pembina believes its current operations are in compliance with all applicable significant environmental and safety
regulations, there can be no assurance that substantial costs or liabilities will not be incurred. Moreover, it is possible that
other developments, such as changes in environmental and safety laws, regulations and enforcement policies thereunder,
including with respect to climate change, claims for damages to persons or property resulting from Pembina's operations,
and the discovery of any new pre-existing environmental liabilities in relation to any of Pembina's existing or future
properties or operations, could result in significant costs and liabilities to Pembina. If Pembina is not able to recover the
resulting costs or increased costs through insurance or increased tariffs, cash flow available to pay dividends to
Shareholders and to service obligations under Pembina's debt securities and Pembina's other debt obligations could be
adversely affected.
Changes in environmental and safety regulations and legislation, including with respect to climate change, are also likely to
impact Pembina's customers and could result in development and production becoming uneconomical, which would
impact throughput and revenue on Pembina's systems and in their facilities. See "Reserve Replacement, Throughput and
Product Demand" above.
While Pembina maintains insurance in respect of damage caused by seepage or pollution in an amount it considers
prudent and in accordance with industry standards, certain provisions of such insurance may limit the availability thereof
in respect of certain occurrences unless they are discovered within fixed time periods, which typically range from 72 hours
to 30 days. Although Pembina believes it has adequate pipeline monitoring systems in place to monitor for a significant
spill of product, if Pembina is unaware of a problem or is unable to locate the problem within the relevant time period,
insurance coverage may lapse and not be available.
Regulation and Legislation
Legislation in Alberta and British Columbia exists to ensure that producers have fair and reasonable opportunities to
produce, process and market their reserves. In Alberta, the AER and in British Columbia, the BCUC, may declare the
operator of a pipeline a common carrier of oil or NGL and, as such, must not discriminate between producers who seek
access to the pipeline. Producers and shippers may also apply to the appropriate regulatory authorities for a review of
tariffs, and such tariffs may then be regulated if it is proven that the tariffs are not just and reasonable. Regulatory
authorities that declare pipeline operators a common carrier may also establish conditions under which the carrier must
accept and carry product, including the tolls that may be charged. The potential for direct regulation of tolls, while
considered remote by Pembina, could result in toll levels that are less advantageous to Pembina and could impair the
economic operation of such regulated pipeline systems.
Since 2014, the AER is the primary regulatory body that Pembina deals with related to Alberta-issued energy permits, with
some minor exceptions. In 2018, Pembina will continue to monitor for legislative or procedural changes that could impose
an administrative or financial burden on the Company as a result of a single regulator. Additionally, certain of Pembina's
subsidiaries own pipelines in British Columbia, which are regulated by the BCOGC, and pipelines that cross provincial or
international boundaries, which are regulated by the NEB and FERC. Certain of Pembina's operations and expansion
projects are subject to additional regulations, and as Pembina's operations expand throughout Canada and North
America, Pembina may be required to comply with the requirements of additional regulators and legislative bodies,
including the Canadian Environmental Assessment Agency ("CEAA"), the British Columbia Environmental Assessment
Office ("BCEAO"), the Ontario Ministry of Natural Resources, the Saskatchewan Ministry of Economy, and The Petroleum
Branch of Manitoba Mineral Resources. In the U.S., tolls on pipelines are regulated by and reported to the FERC and
pipeline operations are governed by the PHMSA, which sets standards for the design, construction, pressure testing,
operation and maintenance, corrosion control, training and qualification of personnel, accident reporting and record
keeping. The Office of Pipeline Safety, within PHMSA, inspects and enforces the pipeline safety regulations across the U.S.

Pembina Pipeline Corporation
36
All regulations and environmental compliance obligations are subject to change at the initiative of the governing body.
Pembina continually monitors existing and changing regulations in all jurisdictions in which it currently operates or into
which it may expand in the future, and their implications to its operations. However, Pembina cannot predict future
regulatory changes, and any such compliance and regulatory changes in any one or multiple jurisdictions could have a
material adverse impact on Pembina, its financial results and its Shareholders.
On February 8, 2018, the Canadian federal government introduced Bill C-69 Act to enact the Impact Assessment Act and
the Canadian Energy Regulator Act, to amend the Navigation Protection Act and to make consequential amendments to
other Acts ("Bill C-69"), which proposes to, among other things, overhaul the federal environmental assessment regime in
Canada under the Canadian Environmental Assessment Act (Canada), as well as replace the NEB with a new regulator, the
Canadian Energy Regulator (the "CER"). If passed, Bill C-69 would replace the Canadian Environmental Assessment Act
with the Impact Assessment Act (Canada) (the "IAA") and the CEAA with the new Impact Assessment Agency of Canada as
the authority responsible for conducting all federal impact assessments (formerly "environmental assessments") for
certain designated projects under the IAA, unless referred to a review panel. It is not yet known whether the list of
designated projects will be the same as or similar to those under the Canadian Environmental Assessment Act. The
proposed IAA also contains a broader project assessment process than under the Canadian Environmental Assessment Act
and provides for enhanced consultation with groups that may be affected by proposed projects, while also expanding the
scope of factors and considerations that need to be taken into account under the project assessment process. Bill C-69
also contemplates the adoption of the Canadian Energy Regulator Act (Canada) (the "CERA") and the repeal of the
National Energy Board Act (Canada), which would replace the NEB with the CER. The CERA would then continue to
oversee approved federal, interprovincial and international energy projects in a manner similar to the current regime
under the NEB, with new projects being referred to a review panel under the IAA. Pembina continues to actively monitor
developments relating to Bill C-69, and other regulatory initiatives. However, as there can be no assurances that Bill C-69
will be passed in its current form, or at all, Pembina cannot predict the outcome of this or any other future regulatory
initiatives. As such, the impact on Pembina resulting from the enactment of the IAA or the CERA, and any other future
regulatory initiatives, is uncertain. In the event that such changes, or any future proposed changes, negatively impact
Pembina's current business and/or its ability to receive approvals for current and future growth projects in a timely and
cost-effective manner, such changes could materially and directly impact Pembina's business and financial results. Such
regulatory initiatives could also indirectly affect Pembina's business and financial results, by impacting the financial
condition and growth projects of its customers and, ultimately, production levels and throughput on Pembina's pipelines
and in its facilities.
Recent political events in the U.S. have led to uncertainty regarding ongoing trade relationships, in particular in relation to
the North American Free Trade Agreement ("NAFTA"). While the current U.S. administration has indicated its intention to
renegotiate or withdraw from NAFTA, there have been no formal steps taken in this regard to date. As such, at this time
Pembina is unable to predict what impact any such renegotiation or withdrawal may have.
Pembina's business and financial condition could also be influenced by federal and foreign legislation affecting, in
particular, foreign investment, through legislation such as the Competition Act (Canada) and the Investment Canada Act
(Canada), and their equivalents in foreign jurisdictions.
There can be no assurance that income tax laws, regulatory and environmental laws or policies and government incentive
programs relating to the pipeline or oil and natural gas industry will not be changed in a manner which adversely affects
Pembina or its Shareholders or other security holders.
Pembina Pipeline Corporation
37
Abandonment Costs
Pembina is responsible for compliance with all applicable laws and regulations regarding the dismantling,
decommissioning and site disturbance remediation activities and abandonment of its pipeline systems and other assets at
the end of their economic life, and these abandonment costs may be substantial. An accounting provision is made for the
estimated cost of site restoration and capitalized in the relevant asset category. A provision is recognized if, as a result of a
past event, Pembina has a present legal or constructive obligation that can be estimated reliably, and it is probable that an
outflow of economic benefits will be required to settle the obligation. Pembina's estimates as to the costs of such
abandonment or decommissioning could be materially different than the actual costs incurred.
For more information with respect to Pembina's estimated net present value of decommissioning obligations, see Note 15
to Pembina's Financial Statements for the year ended December 31, 2017, which note is incorporated by reference herein.
Electronic copies of this document can be found on Pembina's profile on the SEDAR website at www.sedar.com and the
EDGAR website at www.sec.gov.
The proceeds of the disposition of certain assets, including in respect of certain pipeline systems and line fill, may be
available to offset abandonment costs. Pembina may, in the future, determine it prudent or be required by applicable laws
or regulations to establish and fund additional reclamation funds to provide for payment of future abandonment costs.
Such reserves could decrease cash flow available for dividends to Shareholders and to service obligations under Pembina's
debt securities and Pembina's other debt obligations.
Pembina has complied with the NEB requirements on its NEB-regulated pipelines for the creation of abandonment funds
and has completed the compliance-based filings that are required under the applicable NEB rules and regulations
regarding the abandonment of its pipeline systems and assets. Pembina also has a 50 percent ownership in an NEB-
regulated pipeline lateral which is operated by a joint venture partner, and has paid its share of required abandonment
funds into trust. The joint venture partner is responsible for the submission of the NEB-compliance based filings for this
asset. Pembina will continue to monitor any regulatory changes prior to the next five-year review and will complete the
annual reporting as required by the NEB. Pembina owned and/or operated rate-regulated pipelines account for
approximately 873 km of the total infrastructure in its Conventional Pipelines business.
Completion and Timing of Expansion Projects
The successful completion of Pembina's growth and expansion projects is dependent on a number of factors outside of
Pembina's control, including the impact of general economic, business and market conditions, availability of capital at
attractive rates, receipt of regulatory approvals, reaching long-term commercial arrangements with customers in respect
of certain portions of the expansions, construction schedules and costs that may change depending on supply, demand
and/or inflation, labour, materials and equipment availability, contractor non-performance, civil disobedience, weather
conditions, and cost of engineering services. There is no certainty, nor can Pembina provide any assurance, that necessary
regulatory approvals will be received on terms that maintain the expected return on investment associated with a specific
project, or at all, or that satisfactory commercial arrangements with customers will be reached where needed on a timely
basis or at all, or that third parties will comply with contractual obligations in a timely manner. Factors such as special
interest group opposition, Aboriginal, landowner and other stakeholder consultation requirements, civil disobedience,
changes in shipper support over time, and changes to the legislative or regulatory framework could all have an impact on
contractual and regulatory milestones being accomplished. As a result, the cost estimates and completion dates for
Pembina's major projects can change during different stages of the project. Early stage projects face additional challenges,
including securing leases, easements, rights-of-way, permits and/or licenses from landowners or governmental authorities
allowing access for such purposes, as well as Aboriginal consultation requirements. Accordingly, actual costs and timing

Pembina Pipeline Corporation
38
estimates may vary from initial estimates and these differences can be significant, and certain projects may not proceed as
planned, or at all. Further, there is a risk that maintenance will be required more often than currently planned or that
significant maintenance capital projects could arise that were not previously anticipated.
Under most of Pembina's construction and operation agreements, the Company is obligated to construct the facilities
regardless of delays and cost increases and Pembina bears the risk for any cost overruns and future agreements with
customers entered into with respect to expansions may contain similar conditions. While Pembina is not currently aware
of any significant undisclosed cost overruns at the date hereof, any such cost overruns in the future may adversely affect
the economics of particular projects, as well as Pembina's business operations and financial results, and could reduce
Pembina's expected return on investment which, in turn, could reduce the level of cash available for dividends and to
service obligations under Pembina's debt securities and other debt obligations. See "General Risk Factors - Additional
Financing and Capital Resources" and "Shipper and Processing Contracts" below.
Operating and Capital Costs
Operating and capital costs of Pembina's business may vary considerably from current and forecast values and rates and
represent significant components of the cost of providing service. In general, as equipment ages, costs associated with
such equipment may increase over time. Dividends may be reduced if significant increases in operating or capital costs are
incurred and this may also impact the ability of Pembina to service obligations under its debt securities and other debt
obligations.
Although operating costs are to be recaptured through the tariffs charged on natural gas volumes processed and oil and
NGL transported, respectively, to the extent such charges escalate, producers may seek lower cost alternatives or stop
production of their natural gas and/or crude oil.
Risks Relating to NGL by Rail
Pembina's operations include rail loading, offloading and terminalling facilities. Pembina relies on railroads and trucks to
distribute its products for customers as well as to transport raw materials to its processing facilities. Costs for
environmental damage, damage to property and personal injury in the event of a railway incident involving hydrocarbons
have the potential to be significant and liabilities to Pembina are possible. At this time, the Railway Safety Act (Canada),
which governs the operation of railway equipment, does not contemplate regulatory enforcement proceedings against
shippers, but consignors and shippers may be subject to regulatory proceedings under the Transportation of Dangerous
Goods Act (Canada), which specifies the obligations of shippers to identify and classify dangerous goods, select
appropriate equipment and prepare shipping documentation. While the Canada Transportation Act was amended in 2015
to preclude railway companies from shifting liability for third party claims to shippers by tariff publication alone, major
Canadian railways have adopted standard contract provisions designed to implement such a shift. Under various
environmental statutes in both Canada and the U.S., Pembina could be held responsible for environmental damage caused
by hydrocarbons loaded at its facilities or being carried on its leased rail cars. Pembina partially mitigates this risk by
securing insurance coverage.
Railway incidents in Canada and the U.S. have prompted regulatory bodies to initiate reviews of transportation rules and
publish various directives. Regulators in Canada and the U.S. have begun to phase-in more stringent engineering standards
for tank cars used to move petroleum products which required all North American tank cars carrying crude oil or ethanol
to be retrofitted by May 1, 2017, and will require all tank cars carrying flammable liquids to be compliant by May 1, 2025.
While most legislative changes apply directly to railway companies, costs associated with retrofitting locomotives and rail
cars, implementing safety systems, increased inspection and reporting requirements may be indirectly passed on to
Pembina through increased freight rates and car leasing costs. In addition, regulators in Canada and the U.S. have

Pembina Pipeline Corporation
39
implemented changes that impose obligations relating to certification of product and equipment procedures and
emergency response procedures, directly on consignors and shippers such as Pembina.
In the event that Pembina is ultimately held liable for any damages resulting from its activities relating to transporting
NGLs by rail, for which insurance is not available, or increased costs or obligations are imposed on Pembina as a result of
new regulations, this could have an impact on Pembina's business, operations and prospects and could impact earnings
and cash flow available to pay dividends and to service obligations under Pembina's debt securities and other debt
obligations.
Competition
Pembina competes with other pipelines, midstream, marketing and gas processing and handling services providers in its
service areas as well as other transporters of crude oil, NGL and natural gas. The introduction of competing transportation
alternatives into Pembina's service areas could potentially have the impact of limiting Pembina's ability to adjust tolls as it
may deem necessary and result in the reduction of throughput in Pembina's pipelines. Additionally, potential pricing
differentials on the components of NGL may result in these components being transported by competing gas pipelines.
Pembina believes it is prepared for and determined to meet these existing and potential competitive pressures. Pembina
also competes with other businesses for growth and business opportunities, which could impact its ability to grow
through acquisitions and could impact earnings and cash flow available to pay dividends and to service obligations under
Pembina's debt securities and other debt obligations. See "Description of Pembina's Business and Operations -
Conventional Pipelines Business - Competitive Environment", "Description of Pembina's Business and Operations -Oil Sands
and Heavy Oil Business - Competitive Environment", "Description of Pembina's Business and Operations -Gas Services
Business - Competitive Environment", "Description of Pembina's Business and Operations - Midstream Business -
Competitive Environment" and "Description of Pembina's Business and Operations - Veresen Business - Competitive
Environment."
Reliance on Principal Customers
Pembina relies on several significant customers to purchase product from the Midstream, and to a lesser extent Veresen,
business. If for any reason these parties were unable to perform their obligations under the various agreements with
Pembina, the revenue and dividends of the Company and the operations of the Midstream business could be negatively
impacted. See "General Risk Factors - Credit Risk" below.
Risk Factors Relating to the Securities of Pembina
Dilution of Shareholders
Pembina is authorized to issue, among other classes of shares, an unlimited number of Common Shares for consideration
and on terms and conditions as established by the Board of Directors without the approval of Shareholders in certain
instances. The Shareholders will have no pre-emptive rights in connection with such further issuances. Any issuance of
Common Shares may have a dilutive effect on existing Shareholders.
Risk Factors Relating to the Activities of Pembina and the Ownership of Securities
The following is a list of certain risk factors relating to the activities of Pembina and the ownership of its securities:
• The level of Pembina's indebtedness from time to time could impair Pembina's ability to obtain additional
financing on a timely basis to take advantage of business opportunities that may arise;
• The uncertainty of future dividend payments by Pembina and the level thereof, as Pembina's dividend policy and
the funds available for the payment of dividends from time to time will be dependent upon, among other things,
Pembina Pipeline Corporation
40
operating cash flow generated by Pembina and its subsidiaries, financial requirements for Pembina's operations,
the execution of its growth strategy and the satisfaction of solvency tests imposed by the ABCA for the
declaration and payment of dividends;
• Pembina may make future acquisitions or may enter into financings or other transactions involving the issuance
of securities of Pembina which may be dilutive to the holders of Pembina's securities;
• The inability of Pembina to manage growth effectively, and realize the anticipated growth opportunities from
acquisitions and new projects, could have a material adverse impact on its business, operations and prospects;
and
• The risk that the market value of the Common Shares may deteriorate materially if Pembina is unable to meet its
cash dividend targets or make cash dividends in the future.
Market Value of Common Shares and Other Securities
Pembina cannot predict at what price the Common Shares, Series F Convertible Debentures, Class A Preferred Shares or
other securities issued by Pembina will trade in the future. Common Shares, Series F Convertible Debentures, Class A
Preferred Shares and other securities of Pembina will not necessarily trade at values determined solely by reference to the
underlying value of Pembina's assets. One of the factors that may influence the market price of such securities is the
annual yield on the Common Shares, Series F Convertible Debentures and the Class A Preferred Shares. An increase in
market interest rates may lead purchasers of Common Shares, Series F Convertible Debentures or Class A Preferred Shares
to demand a higher annual yield and this could adversely affect the market price of the Common Shares, Series F
Convertible Debentures or Class A Preferred Shares. In addition, the market price for the Common Shares, Series F
Convertible Debentures and the Class A Preferred Shares may be affected by announcements of new developments,
changes in Pembina's operating results, failure to meet analysts' expectations, changes in credit ratings, changes in general
market conditions, fluctuations in the market for equity or debt securities and numerous other factors beyond the control
of Pembina.
Shareholders are encouraged to obtain independent legal, tax and investment advice in their jurisdiction of residence with
respect to the holding of Common Shares, Series F Convertible Debentures or Class A Preferred Shares.
General Risk Factors
Additional Financing and Capital Resources
The timing and amount of Pembina's capital expenditures and contributions to Equity Accounted Investees, and the ability
of the Company to repay or refinance existing debt as it becomes due, directly affects the amount of cash dividends that
Pembina pays. Future acquisitions, expansions of Pembina's assets, and other capital expenditures and the repayment or
refinancing of existing debt as it becomes due will be financed from sources such as cash generated from operations, the
issuance of additional shares or other securities (including debt securities) of Pembina, and borrowings. Dividends may be
reduced, or even eliminated, at times when significant capital or other expenditures are made. There can be no assurance
that sufficient capital will be available on terms acceptable to Pembina, or at all, to make additional investments, fund
future expansions or make other required capital expenditures. As a result of the ongoing weakness in the global
economy, and in particular the commodity-related industry sectors, Pembina may experience restricted access to capital
and increased borrowing costs. Although Pembina's business and asset base have not changed materially, the ability of
Pembina to raise capital is dependent upon, among other factors, the overall state of capital markets, its credit rating and
investor demand for investments in the energy industry and Pembina's securities in particular. To the extent that external
sources of capital, including the issuance of additional shares or other securities or the availability of additional credit
Pembina Pipeline Corporation
41
facilities, become limited or unavailable on favourable terms or at all due to credit market conditions or otherwise, the
ability of Pembina to make the necessary capital investments to maintain or expand its operations, to repay outstanding
debt and to invest in assets, as the case may be, may be impaired. To the extent Pembina is required to use cash flow to
finance capital expenditures or acquisitions or to repay existing debt as it becomes due, the level of dividends payable may
be reduced.
Counterparty Credit Risk
Counterparty credit risk represents the financial loss Pembina would experience if a counterparty to a financial instrument
or commercial agreement failed to meet its contractual obligations in accordance with the terms and conditions of such
instruments or agreements with Pembina. Counterparty credit risk arises primarily from Pembina's cash and cash
equivalents, trade and other receivables, and from counterparties to its derivative financial instruments.
Pembina continues to closely monitor and reassess the creditworthiness of its counterparties, including financial
institutions. This may result in Pembina reducing or mitigating its exposure to certain counterparties where it is deemed
warranted and permitted under contractual terms. Pembina manages counterparty credit risk through established credit
management techniques, including conducting comprehensive financial and other assessments for all new counterparties
and regular reviews of existing counterparties to establish and monitor counterparties' creditworthiness, setting exposure
limits, monitoring exposures against these limits and seeking and obtaining financial assurances where warranted and
permitted under contractual terms. Pembina utilizes various sources of financial, credit and business information in
assessing the creditworthiness of a counterparty including external credit ratings, where available, and in other cases,
detailed financial statement analysis in order to generate an internal credit rating based on quantitative and qualitative
factors. The establishment of counterparty exposure limits is governed by a Board-designated counterparty exposure limit
matrix which represents the maximum dollar amounts of counterparty exposure by debt rating that can be approved for a
counterparty. Pembina continues to closely monitor and reassess the creditworthiness of its counterparties, which has
resulted in Pembina reducing or mitigating its exposure to certain counterparties where it was deemed warranted and
permitted under contractual terms.
Financial assurances may include guarantees, letters of credit and cash. As at December 31, 2017, letters of credit totaling
$110 million (December 31, 2016: $115 million) were held primarily in respect of customer trade receivables.
Typically, Pembina has collected its receivables in full and at December 31, 2017, approximately 96 percent were current.
Pembina has a general lien and a continuing and first priority security interest in, and a secured charge on, all of a
shipper's petroleum in its custody. The risk of non-collection is considered to be low and no material impairment of trade
and other receivables has been made.
Pembina monitors and manages its concentration of counterparty credit risk on an ongoing basis. Pembina also evaluates
counterparty risk from the perspective of future exposure that is created through commercial agreements with existing or
new counterparties that support future capital expansion projects. Pembina believes these measures are prudent and
allow for effective management of its counterparty credit risk but there is no certainty that they will protect it against all
material losses. As part of its ongoing operations, Pembina must balance its market and counterparty credit risks when
making business decisions.
Debt Service
At the end of 2017, Pembina had exposure to floating interest rates on $1.8 billion in debt. Floating rate debt exposure is,
in part, managed by using derivative financial instruments.

Pembina Pipeline Corporation
42
Variations in interest rates and scheduled principal repayments, if required under the terms of Pembina's banking
agreements could result in significant changes in the amounts required to be applied to debt service before payment of
any dividends. Certain covenants in the Company's agreements with its lenders may also limit payments and dividends
paid by Pembina.
Pembina and its subsidiaries are permitted to borrow funds to finance the purchase of pipelines and other energy
infrastructure assets, to fund capital expenditures and other financial obligations or expenditures in respect of those
assets and for working capital purposes. Amounts paid in respect of interest and principal on debt incurred in respect of
those assets reduce the amount of cash flow available for dividends on Common Shares. Variations in interest rates and
scheduled principal repayments for which Pembina may not be able to refinance at favourable rates or at all, could result
in significant changes in the amount required to be applied to service debt, which could have detrimental effects on the
amount of cash available for dividends on Common Shares. Pembina, on a consolidated basis, is also required to meet
certain financial covenants under the Credit Facilities and is subject to customary restrictions on its operations and
activities, including restrictions on the granting of security, incurring indebtedness and the sale of its assets.
The lenders under Pembina's unsecured credit facilities have also been provided with guarantees and subordination
agreements. If Pembina becomes unable to pay its debt service charges or otherwise commits an event of default, such as
bankruptcy, payments to all of the lenders will rank in priority to dividends and payments to holders of Series F
Convertible Debentures.
Although Pembina believes the existing Credit Facilities are sufficient for immediate requirements, there can be no
assurance that the amount will be adequate for the future financial obligations of Pembina or that additional funds will be
able to be obtained on terms favourable to Pembina or at all.
Credit Ratings
Rating agencies regularly evaluate Pembina, basing their ratings of its long-term and short-term debt and Class A Preferred
Shares on a number of factors. This includes Pembina's financial strength as well as factors not entirely within its control,
including conditions affecting the industry in which Pembina operates generally and the wider state of the economy. There
can be no assurance that one or more of Pembina's credit ratings will not be downgraded.
Pembina's borrowing costs and ability to raise funds are directly impacted by its credit ratings. Credit ratings may be
important to suppliers or counterparties when they seek to engage in certain transactions. A credit rating downgrade
could potentially impair Pembina's ability to enter into arrangements with suppliers or counterparties, to engage in certain
transactions, and could limit Pembina's access to private and public credit markets and increase the costs of borrowing
under its existing credit facilities. A downgrade could also limit Pembina's access to debt and preferred share markets and
increase its cost of borrowing.
The occurrence of a downgrade in Pembina's credit ratings could adversely affect its ability to execute portions of its
business strategy and could have a material adverse effect on its liquidity, results of operations and capital position.
Reliance on Management and Labour
Shareholders and other security holders of Pembina will be dependent on senior management and directors of the
Company in respect of the governance, administration and management of all matters relating to Pembina and its
operations and administration. The loss of the services of key individuals could have a detrimental effect on Pembina.
Further, the costs associated with retaining key individuals could adversely affect Pembina's business opportunities and
financial results. There is no assurance that Pembina will continue to attract and retain all personnel necessary for the
development and operation of its business.

Pembina Pipeline Corporation
43
Aboriginal Land Claims and Consultation Obligations
Aboriginal peoples have claimed title and rights to a substantial portion of the lands in western Canada. Such claims, if
successful, could have a significant adverse effect on Pembina's Canadian operations. Further, the successful assertion of
Aboriginal title or other claims could have a significant adverse effect on natural gas production or oil sands development
in Alberta, which in turn could have a material adverse effect on Pembina's business and operations, including the volume
of natural gas and NGL handled through Pembina's facilities.
Additionally, the federal and provincial governments in Canada have a duty to consult and, where appropriate,
accommodate Aboriginal people where the interests of the Aboriginal peoples may be affected by a Crown action or
decision. Accordingly, the Crown's duty may result in regulatory approvals being delayed or not being obtained in relation
to Pembina's Canadian operations.
In mid-2016, the Government of Canada issued changes to the Canadian Environmental Assessment Agency ("CEAA")
Technical Guidance for Assessing the Current Use of Lands for Traditional Purposes. This technical guidance document is
used on projects with a CEAA 2012 trigger, including resource projects currently under review by the NEB. The impact on
existing third-party projects has been to add up to six months of time to the project review process. These changes could
materially impact the amount of time and capital resources required by Pembina if we were to apply for longer NEB
regulated pipelines projects or projects with a CEAA 2012 trigger.
On February 14, 2018, the federal government announced that it will develop, in consultation with First Nations, Inuit, and
Métis peoples, a Recognition and Implementation of Rights Framework ("Rights Framework"). The contents of the Rights
Framework will be determined through engagement activities led by the Minister of Crown-Indigenous Relations and
Northern Affairs with the intention of having the Rights Framework introduced in 2018 and implemented before October
2019, with such implementation possibly including the introduction of new legislation and policy. Pembina will continue to
monitor and assess the impacts the Rights Framework to its business as legislation and/or policies continue to be
developed.
Potential Conflicts of Interest
Shareholders and other security holders of Pembina are dependent upon senior management and the directors of
Pembina for the governance, administration and management of the Company. Certain directors and officers of Pembina
may be directors or officers of entities in competition to Pembina or may be directors or officers of certain entities in
which Pembina holds an equity investment in, and, as such, these directors or officers of Pembina may encounter conflicts
of interest in the administration of their duties with respect to Pembina. Pembina partially mitigates this risk by requiring
directors and officers to disclose the existence of potential conflicts in accordance with Pembina's Code of Ethics and in
accordance with the ABCA.
Litigation
Pembina and its various subsidiaries and affiliates may be, in the course of their business, subject to lawsuits and other
claims. Defence and settlement costs associated with such lawsuits and claims can be substantial, even with respect to
lawsuits and claims that have no merit. Due to the inherent uncertainty of the litigation process, the resolution of any
particular legal proceeding could have a material adverse effect on the financial position or operating results of Pembina.
Foreign Exchange Risk
Pembina's investments, commodity-related transactions, rail car leases, the portion of the Vantage Pipeline located in the
U.S., tariff cash flows and some of its capital and other expenditure commitments may be subject to currency risk,
primarily arising from the denomination of specific earnings, cash flows and expenditure commitments in U.S. dollars.

Pembina Pipeline Corporation
44
Pembina partially mitigates this risk using an active Risk Management Program to exchange foreign currency for domestic
currency at a fixed rate.
Interest Rate Risk
Pembina has floating interest rate debt which subjects the Company to interest rate risk. Pembina responds to this risk
under the active Risk Management Program by entering into financial derivative contracts to fix interest rates.
Cyber Security
Pembina's infrastructure, technologies and data are becoming increasingly integrated, which creates a risk that failure of
one system could lead to failure of other systems. The risk of a cyber-attack targeting the industry is also increasing. A
breach in the security or failure of the Company's information technology could result in operational outages, delays,
damage to assets or the environment, reputational harm, lost profits, lost data and other adverse outcomes. The
Company's security strategy focuses on information technology security risk management, which includes continuous
monitoring, threat detection and an incident response protocol.
Health and Safety
The operation of Pembina's business is subject to hazards of gathering, processing, transporting, fractionating, storing and
marketing hydrocarbon products, including but not limited to: blowouts; fires; explosions; gaseous leaks; migration of
harmful substances; oil spills; corrosion; and acts of vandalism and terrorism. Any of these hazards can interrupt
operations, impact Pembina's reputation, cause loss of life or personal injury, result in loss of or damage to equipment,
property, information technology systems, related data and control systems, and cause environmental damage that may
include polluting water, land or air.
Risks Relating to U.S. Tax Reform
On December 22, 2017, President Trump signed into law P.L. 115-97, informally titled the Tax Cuts and Jobs Act (the
"TCJA"). The TCJA makes major changes to the Internal Revenue Code of 1986, as amended, including decreasing the U.S.
corporate tax rate from 35 percent to 21 percent, effective January 1, 2018. The overall future impact of the TCJA to the
Company is uncertain due to, among other things, future amendments and changes in its interpretation.
Selected Quarterly Operating Information
(mbpd unless stated otherwise) 2017 2016
Q4 Q3 Q2 Q1 Q4 Q3 Q2 Q1
Average volume
Conventional Pipelines revenue volumes(1) 862 780 692 691 639 643 648 670
Oil Sands & Heavy Oil contracted capacity 1,060 1,060 975 975 975 975 880 880
Gas Services revenue volumes (mboe/d) net(1)(2) 190 171 172 171 163 149 133 113
Midstream NGL sales volumes 162 123 124 173 164 136 132 141
Veresen revenue and sales volumes (1)(2)(3) 643
Total 2,917 2,134 1,963 2,010 1,941 1,903 1,793 1,804 (1) Revenue volumes are equal to contracted and interruptible volumes.
(2) Revenue volumes converted to mboe/d from MMcf/d at 6:1 ratio.
(3) Includes Pembina's proportionate share of results from equity accounted investees.

Pembina Pipeline Corporation
45
Quarterly Financial Information
($ millions, except where noted) 2017 2016
Q4 Q3 Q2 Q1 Q4 Q3 Q2 Q1
Standard Financial Overview
Revenue 1,716 1,041 1,166 1,485 1,251 970 1,027 1,017
Net Revenue(1) 709 532 451 554 514 427 429 394
Operating expenses 130 112 101 107 123 109 93 94
Realized loss (gain) on commodity-related derivative financial instruments
42 17 (5 ) 40 15 1 9 (15 )
Share of profit of investments in equity accounted investees
116 1
Gross profit 555 270 276 381 270 246 248 238
Earnings for the period 445 107 124 215 131 120 113 102
Earnings per common share – basic (dollars) 0.83 0.22 0.26 0.49 0.29 0.25 0.25 0.23
Earnings per common share – diluted (dollars) 0.83 0.22 0.26 0.49 0.28 0.25 0.25 0.23
Cash flow from operating activities 523 302 362 326 286 247 273 271
Cash flow from operating activities per common share – basic (dollars)(1) 1.04 0.75 0.90 0.82 0.73 0.63 0.70 0.72
Adjusted cash flow from operating activities(1) 499 314 275 308 292 250 235 209
Adjusted cash flow from operating activities per common share – basic(1) (dollars) 0.99 0.78 0.68 0.77 0.74 0.64 0.60 0.56
Common shares outstanding (millions):
Weighted average – basic 502 403 401 398 395 392 389 376
Weighted average – diluted 507 404 403 400 397 393 390 376
End of period 503 403 403 400 397 394 391 387
Common share dividends declared 272 205 205 191 190 188 187 172
Dividends per common share 0.5400 0.5100 0.5100 0.4800 0.4800 0.4800 0.4800 0.4575
Preferred share dividends declared 26 19 19 19 19 20 16 14
Capital Expenditures 314 341 475 709 453 537 380 375
Contributions to equity accounted investees 6 1 2
Proportionately Consolidated Financial Overview
Operating margin(1) 749 409 360 412 379 320 331 318
Adjusted EBITDA(1) 674 365 303 363 342 287 291 269 (1) Refer to "Non-GAAP Measures."
During the periods in the prior table, Pembina's results were impacted by the following factors and trends:
• Acquisition of Veresen on October 2, 2017;
• Increased production in key operating areas and resource plays within the WCSB (Deep Basin, Montney and
Duvernay) which has supported increased revenue and sales volumes on Pembina's existing Conventional
Pipelines, Gas Services and NGL Midstream infrastructure as well as the development of large-scale expansions
across these businesses;
• New large-scale growth projects across Pembina's business being placed into service and the acquisition of the
Kakwa River facility (April 2016);
• Significantly weaker commodity market (especially the weaker propane and butane market) during the early part
of 2016 with a modest commodity market recovery through mid-2016 and year-to-date in 2017;

Pembina Pipeline Corporation
46
• Pre-financed portions of capital for projects under construction and increased common shares outstanding and
common share dividends due to: the DRIP, debenture conversions, common share issuance, increases in the
common share dividend rate; and
• Increased preferred share dividends due to additional preferred shares issued.
Selected Annual Financial Information
($ millions, except where noted) 2017 2016 2015
Revenue 5,408 4,265 4,635
Earnings 891 466 406
Per common share - basic (dollars) 1.89 1.02 1.02
Per common share - diluted (dollars) 1.88 1.01 1.02
Total assets 25,566 15,017 12,902
Long-term financial liabilities(1) 8,199 4,832 3,908
Declared dividends per common share ($ per share) 2.04 1.90 1.80
Preferred share dividends declared 83 69 48 (1) Includes long-term loans and borrowings, long-term convertible debentures, long-term derivative financial instruments, deferred revenue, provisions and employee
benefits, share-based payments, taxes payable and other liabilities.
Additional Information
Additional information about Pembina filed with Canadian and U.S. securities commissions, including quarterly and annual
reports, Annual Information Forms (filed with the U.S. Securities and Exchange Commission under Form 40-F),
Management Information Circulars and financial statements can be found online at www.sedar.com, www.sec.gov and
through Pembina's website at www.pembina.com. Information contained in or otherwise accessible through Pembina's
website or other websites, though referenced herein, is not incorporated by reference herein unless otherwise specifically
indicated.
Non-GAAP Measures
Throughout this MD&A, Pembina has used the following terms that are not defined by GAAP but are used by management
to evaluate the performance of Pembina and its businesses. Since non-GAAP measures do not have a standardized
meaning prescribed by IFRS and are therefore unlikely to be comparable to similar measures presented by other
companies, securities regulations require that non-GAAP measures are clearly defined, qualified and reconciled to their
nearest GAAP measure. With the exception of operating margin and Adjusted EBITDA which definitions were modified to
capture proportionate interest in investments in equity accounted investees as a result of the Acquisition, these non-GAAP
measures are calculated and disclosed on a consistent basis from period to period. Comparative figures have been
restated for the adjustments made to the definitions.
The intent of non-GAAP measures is to provide additional useful information with respect to Pembina's operational and
financial performance to investors and analysts though the measures do not have any standardized meaning under IFRS.
The measures should not, therefore, be considered in isolation or used in substitute for measures of performance
prepared in accordance with IFRS. Other issuers may calculate these non-GAAP measures differently.
Investors should be cautioned that net revenue, Adjusted EBITDA, adjusted cash flow from operating activities, cash flow
from operating activities per common share, adjusted cash flow from operating activities per common share and
operating margin should not be construed as alternatives to revenue, earnings, cash flow from operating activities, gross
profit or other measures of financial results determined in accordance with GAAP as indicators of Pembina's performance.
Pembina Pipeline Corporation
47
Non-GAAP Proportionate Consolidation of Investments in Equity Accounted Investees Results
In accordance with IFRS, Pembina's jointly controlled investments are accounted for using equity accounting. Under equity
accounting, the assets and liabilities of the investment are net into a single line item on the Consolidated Statement of
Financial Position, Investments in Equity Accounted Investees. Net earnings from Investments in Equity Accounted
Investees are recognized in a single line item in the Consolidated Statement of Earnings and Comprehensive Earnings,
Share of Profit of Investments in Equity Accounted Investees. Cash contributions and distributions from Investments in
Equity Accounted Investees represent Pembina's proportionate share paid and received in the period to and from the
Investments in Equity Accounted Investees. To assist the readers understanding and evaluate the performance of these
investments, Pembina is supplementing the IFRS disclosure with non-GAAP proportionate consolidation of Pembina's
interest in the Investments in Equity Accounted Investees. Pembina's proportionate interest in equity accounted investees
has been included in operating margin and Adjusted EBITDA.
Net revenue
Net revenue is a non-GAAP financial measure which is defined as total revenue less cost of goods sold including product
purchases. Management believes that net revenue provides investors with a single measure to indicate the margin on
sales before non-product operating expenses that is comparable between periods. Management utilizes net revenue to
compare consecutive results, particularly in the Midstream business, to aggregate revenue generated by each of the
Company's businesses and to set comparable objectives.
3 Months Ended December 31 (unaudited)
12 Months Ended December 31
($ millions) 2017 2016 2017 2016
Revenue 1,716 1,251 5,408 4,265
Cost of goods sold, including product purchases 1,007 737 3,162 2,501
Net revenue 709 514 2,246 1,764
Adjusted earnings before interest, taxes, depreciation and amortization ("Adjusted EBITDA")
Adjusted EBITDA is a non-GAAP measure and is calculated as earnings for the year before net finance costs, income taxes,
depreciation and amortization (included in operations and general and administrative expense) and unrealized gains or
losses on commodity-related derivative financial instruments. The exclusion of unrealized gains or losses on commodity-
related derivative financial instruments eliminates the non-cash impact of such gains or losses.
Adjusted EBITDA also includes adjustments to earnings for loss (gain) on disposal of assets, transaction costs incurred in
respect of acquisitions, impairment charges or reversals and write-downs in respect of goodwill, intangible assets and
property plant and equipment, and certain non-cash provisions. The adjustments made to earnings are also made to share
of profit from investments in equity accounted investees. Pembina's proportionate share of results from investments in
equity accounted investees with a preferred interest is presented in Adjusted EBITDA as a 50 percent common interest.
These additional adjustments are made to exclude various non-cash and other items that are not reflective of ongoing
operations. Management believes that Adjusted EBITDA provides useful information to investors as it is an important
indicator of an issuer's ability to generate liquidity through cash flow from operating activities. Adjusted EBITDA is also
used by investors and analysts for assessing financial performance and for the purpose of valuing an issuer, including
calculating financial and leverage ratios. Management utilizes Adjusted EBITDA to set objectives and as a key performance
indicator of the Company's success. Pembina presents Adjusted EBITDA as management believes it is a measure
frequently used by analysts, investors and other stakeholders in evaluating the Company's financial performance.
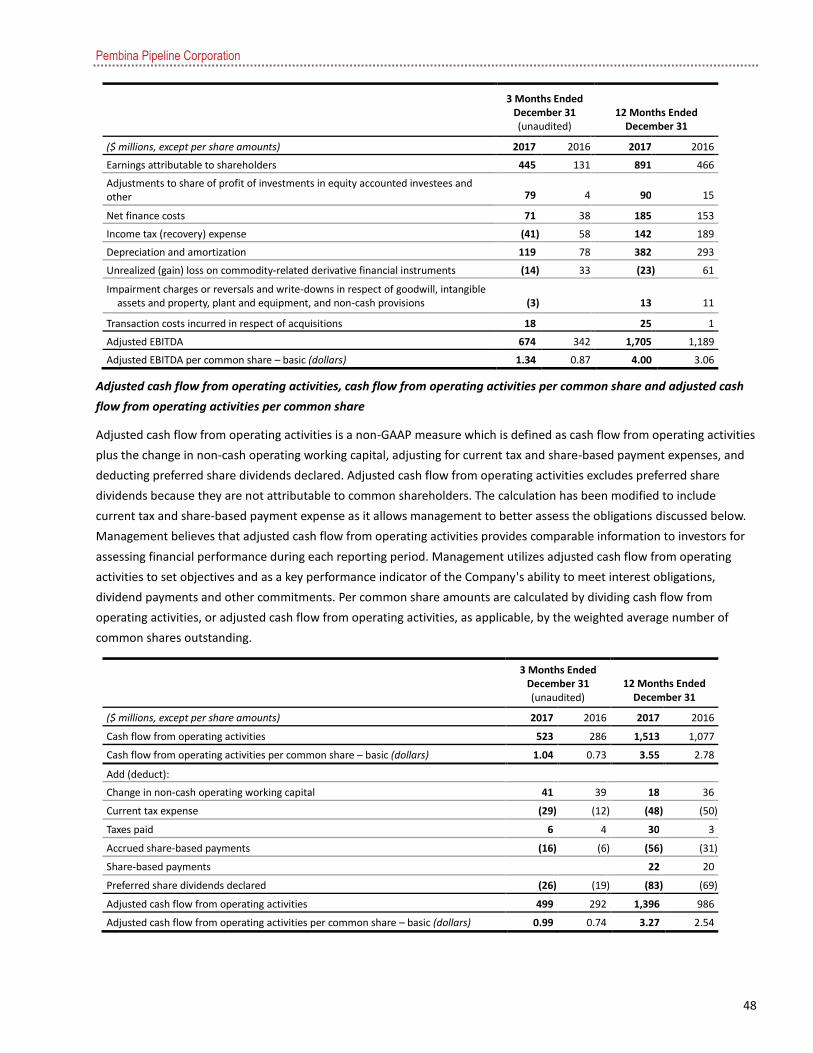
Pembina Pipeline Corporation
48
3 Months Ended December 31 (unaudited)
12 Months Ended December 31
($ millions, except per share amounts) 2017 2016 2017 2016
Earnings attributable to shareholders 445 131 891 466
Adjustments to share of profit of investments in equity accounted investees and other 79
4
90
15
Net finance costs 71 38 185 153
Income tax (recovery) expense (41 ) 58 142 189
Depreciation and amortization 119 78 382 293
Unrealized (gain) loss on commodity-related derivative financial instruments (14 ) 33 (23 ) 61
Impairment charges or reversals and write-downs in respect of goodwill, intangible assets and property, plant and equipment, and non-cash provisions (3 )
13
11
Transaction costs incurred in respect of acquisitions 18 25 1
Adjusted EBITDA 674 342 1,705 1,189
Adjusted EBITDA per common share – basic (dollars) 1.34 0.87 4.00 3.06
Adjusted cash flow from operating activities, cash flow from operating activities per common share and adjusted cash
flow from operating activities per common share
Adjusted cash flow from operating activities is a non-GAAP measure which is defined as cash flow from operating activities
plus the change in non-cash operating working capital, adjusting for current tax and share-based payment expenses, and
deducting preferred share dividends declared. Adjusted cash flow from operating activities excludes preferred share
dividends because they are not attributable to common shareholders. The calculation has been modified to include
current tax and share-based payment expense as it allows management to better assess the obligations discussed below.
Management believes that adjusted cash flow from operating activities provides comparable information to investors for
assessing financial performance during each reporting period. Management utilizes adjusted cash flow from operating
activities to set objectives and as a key performance indicator of the Company's ability to meet interest obligations,
dividend payments and other commitments. Per common share amounts are calculated by dividing cash flow from
operating activities, or adjusted cash flow from operating activities, as applicable, by the weighted average number of
common shares outstanding.
3 Months Ended December 31 (unaudited)
12 Months Ended December 31
($ millions, except per share amounts) 2017 2016 2017 2016
Cash flow from operating activities 523 286 1,513 1,077
Cash flow from operating activities per common share – basic (dollars) 1.04 0.73 3.55 2.78
Add (deduct):
Change in non-cash operating working capital 41 39 18 36
Current tax expense (29 ) (12 ) (48 ) (50 )
Taxes paid 6 4 30 3
Accrued share-based payments (16 ) (6 ) (56 ) (31 )
Share-based payments 22 20
Preferred share dividends declared (26 ) (19 ) (83 ) (69 )
Adjusted cash flow from operating activities 499 292 1,396 986
Adjusted cash flow from operating activities per common share – basic (dollars) 0.99 0.74 3.27 2.54

Pembina Pipeline Corporation
49
Operating margin
Operating margin is a non-GAAP measure which is defined as gross profit on a proportionately consolidated basis before
depreciation and amortization included in operations and unrealized gain/loss on commodity-related derivative financial
instruments from assets directly held and proportionate interest in operating margin or preferred income from
investments in equity accounted investees. Pembina's proportionate share of results from investments in equity
accounted investees with a preferred distribution is presented in operating margin as a 50 percent common interest.
Management believes that operating margin provides useful information to investors for assessing the financial
performance of the Company's operations. Management utilizes operating margin in setting objectives and views it as a
key performance indicator of the Company's success. For more information see unaudited supplemental financial
information for investments in equity accounted investees.
Reconciliation of operating margin to gross profit:
3 Months Ended December 31 (unaudited)
12 Months Ended December 31
($ millions) 2017 2016 2017 2016
Revenue 1,716 1,251 5,408 4,265
Cost of sales (excluding depreciation and amortization included in operations)
Operating expenses 130 123 450 419
Cost of goods sold, including product purchases 1,007 737 3,162 2,501
Realized loss on commodity-related derivative financial instruments 42 15 94 10
Proportionate operating margin from Investments in Equity Accounted Investees(1) 212 6 228 22
Operating margin 749 382 1,930 1,357
Depreciation and amortization included in operations 112 73 359 273
Unrealized loss (gain) on commodity-related derivative financial instruments (14 ) 33 (23 ) 61
Share of profit of investments in equity accounted investees
116 116 1
Proportionate operating margin from Investments in Equity Accounted Investees(1) 212 6 228 22
Gross profit 555 270 1,482 1,002 (1) Excludes depreciation and amortization included in earnings from investments in equity accounted investees of $83 million, general and administrative expenses of $23
million and finance costs of $6 million for a total equity income of $116 million.
The following is a list of abbreviations that may be used in this MD&A:
Measurement
mbbls thousands of barrels
mbpd thousands of barrels per day
mmbpd millions of barrels per day
mmbbls millions of barrels
mboe/d thousands of barrels of oil equivalent per day
MMcf/d millions of cubic feet per day
bcf/d billions of cubic feet per day
km kilometre
Other
B.C. British Columbia
DRIP Premium Dividend™1 and Dividend Reinvestment Plan
IFRS International Financial Reporting Standards
NGL Natural gas liquids
U.S. United States
WCSB Western Canadian Sedimentary Basin
deep cut Ethane-plus capacity extraction gas processing capabilities
shallow cut Sweet gas processing with propane and/or condensate-plus extraction capabilities
1 TM denotes trademark of Canaccord Genuity Corp.
Pembina Pipeline Corporation
50
Forward-Looking Statements & InformationIn the interest of providing Pembina's security holders and potential investors with information regarding Pembina, including management's assessment of the Company's future plans and operations, certain statements contained in this MD&A constitute forward-looking statements or information (collectively, "forward-looking statements"). Forward-looking statements are typically identified by words such as "anticipate", "continue", "estimate", "expect", "may", "will", "project", "should", "could", "would", "believe", "plan", "intend", "design", "target", "undertake", "view", "indicate", "maintain", "explore", "entail", "schedule", "objective", "strategy", "likely", "potential", "outlook", "aim", "purpose", "goal" and similar expressions suggesting future events or future performance. By their nature, such forward-looking statements involve known and unknown risks, uncertainties and other factors that may cause actual results or events to differ materially from those anticipated in such forward-looking statements. Pembina believes the expectations reflected in those forward-looking statements are reasonable but no assurance can be given that these expectations will prove to be correct and such forward-looking statements included in this MD&A should not be unduly relied upon. These statements speak only as of the date of the MD&A.
In particular, this MD&A contains forward-looking statements pertaining to the following: • the future levels and sustainability of cash dividends that Pembina intends to
pay to its shareholders, the dividend payment date and the tax treatment thereof;
• planning, construction, capital expenditure estimates, schedules, regulatory and environmental applications and anticipated approvals, expected capacity, incremental volumes, in-service dates, rights, activities, benefits and operations with respect to new construction of, or expansions on existing, pipelines, gas services facilities, fractionation facilities, terminalling, storage and hub facilities and other facilities or energy infrastructure, as well as the impact of the Company's new projects on its future financial performance;
• the potential future benefits and impacts of acquisition of Veresen Inc. including the timing thereof;
• anticipated synergies between assets under development, assets being acquired and existing assets of the Company;
• pipeline, processing, fractionation and storage facility and system operations and throughput levels;
• treatment under governmental regulatory regimes in Canada and the U.S. including taxes and tax regimes, environmental and greenhouse gas regulations and related abandonment and reclamation obligations, and Aboriginal, landowner and other stakeholder consultation requirements;
• Pembina's estimates of and strategy for payment of future abandonment costs and decommissioning obligations, and deferred tax liability;
• Pembina's strategy and the development and expected timing of new business initiatives and growth opportunities and the impact thereof;
• increased throughput potential, processing capacity and fractionation capacity due to increased oil and gas industry activity and new connections and other initiatives on Pembina's pipelines and at Pembina's facilities;
• expected future cash flows and the sufficiency thereof, financial strength, sources of and access to funds at attractive rates, future contractual obligations, future financing options, future renewal of credit facilities, availability of capital to fund growth plans, operating obligations and dividends and the use of proceeds from financings;
• tolls and tariffs and processing, transportation, fractionation, storage and services commitments and contracts;
• operating risks (including the amount of future liabilities related to pipelines spills and other environmental incidents) and related insurance coverage and inspection and integrity programs;
• the adoption and impact of new accounting standards; • inventory and pricing in North American liquids market; • the impact of the current commodity price environment on Pembina; and • competitive conditions and Pembina's ability to position itself competitively
in the industry.
Various factors or assumptions are typically applied by Pembina in drawing
conclusions or making the forecasts, projections, predictions or estimations set out in forward-looking statements based on information currently available to Pembina. These factors and assumptions include, but are not limited to: • oil and gas industry exploration and development activity levels and the
geographic region of such activity; • the success of Pembina's operations; • prevailing commodity prices, interest rates and exchange rates and the ability
of Pembina to maintain current credit ratings; • the availability of capital to fund future capital requirements relating to
existing assets and projects; • expectations regarding pension plan;
• future operating costs including geotechnical and integrity costs being consistent with historical costs;
• oil and gas industry compensation levels remaining consistent; • in respect of current developments, expansions, planned capital
expenditures, completion dates and capacity expectations: that third parties will provide any necessary support; that any third-party projects relating to growth projects will be sanctioned and completed as expected; that any required commercial agreements can be reached; that all required regulatory and environmental approvals can be obtained on the necessary terms in a timely manner; that counterparties will comply with contracts in a timely manner; that there are no unforeseen events preventing the performance of contracts or the completion of the relevant facilities, and that there are no unforeseen material costs relating to the facilities which are not recoverable from customers;
• in respect of the stability of Pembina's dividends: prevailing commodity prices, margins and exchange rates; that Pembina's future results of operations will be consistent with past performance and management expectations in relation thereto; the continued availability of capital at attractive prices to fund future capital requirements relating to existing assets and projects, including but not limited to future capital expenditures relating to expansion, upgrades and maintenance shutdowns; the success of growth projects; future operating costs; that counterparties to material agreements will continue to perform in a timely manner; that there are no unforeseen events preventing the performance of contracts; and that there are no unforeseen material construction or other costs related to current growth projects or current operations;
• prevailing regulatory, tax and environmental laws and regulations and tax pool utilization; and
• the amount of future liabilities relating to lawsuits and environmental incidents and the availability of coverage under Pembina's insurance policies (including in respect of Pembina's business interruption insurance policy).
The actual results of Pembina could differ materially from those anticipated in these forward-looking statements as a result of the material risk factors set forth below: • the regulatory environment and decisions and Aboriginal and landowner
consultation requirements; • the impact of competitive entities and pricing; • labour and material shortages; • the failure to realize the anticipated benefits of the Acquisition following
closing due to the factors set out herein, integration issues or otherwise; • reliance on key relationships and agreements and the outcome of
stakeholder engagement; • the strength and operations of the oil and natural gas production industry
and related commodity prices; • non-performance or default by counterparties to agreements which Pembina
or one or more of its subsidiaries has entered into in respect of its business; • actions by governmental or regulatory authorities including changes in tax
laws and treatment, changes in royalty rates or increased environmental regulation;
• fluctuations in operating results; • adverse general economic and market conditions in Canada, North America
and elsewhere, including changes, or prolonged weakness, as applicable, in interest rates, foreign currency exchange rates, commodity prices, supply/demand trends and overall industry activity levels;
• constraints on, or the unavailability of adequate infrastructure; • changes in the political environment, in North America and elsewhere, and
public opinion; • ability to access various sources of debt and equity capital; • changes in credit ratings; • technology and security risks; • natural catastrophe; and • the other factors discussed under "Risk Factors" herein and in Pembina's AIF
for the year ended December 31, 2017. Pembina's AIF is available at www.pembina.com and in Canada under Pembina's company profile on www.sedar.com and in the U.S. on the Company's profile at www.sec.gov.
These factors should not be construed as exhaustive. Unless required by law, Pembina does not undertake any obligation to publicly update or revise any forward-looking statements, whether as a result of new information, future events or otherwise. Any forward-looking statements contained herein are expressly qualified by this cautionary statement.

Financial Statements & Notes
51
MANAGEMENT'S REPORT
The audited Consolidated Financial Statements of Pembina Pipeline Corporation (the "Company" or "Pembina") are the
responsibility of Pembina's management. The financial statements have been prepared in accordance with International
Financial Reporting Standards as issued by the International Accounting Standards Board, using management's best
estimates and judgments, where appropriate.
Management is responsible for the reliability and integrity of the financial statements, the notes to the financial
statements and other financial information contained in this report. In the preparation of these financial statements,
estimates are sometimes necessary because a precise determination of certain assets and liabilities is dependent on
future events. Management believes such estimates have been based on careful judgments and have been properly
reflected in the accompanying financial statements.
Management's Assessment of Internal Controls over Financial Reporting
Management is responsible for establishing and maintaining adequate internal control over financial reporting, as defined
in Rules 13a - 15(f) and 15d - 15(f) under the Exchange Act and under NI 52-109.
Management, including the CEO and the CFO, has conducted an evaluation of Pembina's internal control over financial
reporting based on criteria established in Internal Control - Integrated Framework (2013) issued by the Committee of
Sponsoring Organizations of the Treadway Commission (COSO). Based on management's assessment as at December 31,
2017, the CEO and CFO have concluded that Pembina's internal control over financial reporting is effective.
In accordance with the provisions of NI 52-109 and consistent with SEC guidance, the scope of the evaluation did not
include internal controls over financial reporting of Veresen, which the Company acquired on October 2, 2017. Veresen
was excluded from management's evaluation of the effectiveness of the Company's internal control over financial
reporting as at December 31, 2017 due to the proximity of the Acquisition to year-end. Further details related to the
Acquisition are disclosed in Note 6 to the Company's Consolidated Financial Statements for the year ended December 31,
2017. Veresen's assets and revenue represented approximately 28 percent and nil percent, respectively, of the Company's
total assets and revenue as at December 31, 2017. Share of profit from Veresen's equity accounted investees amounted to
$116 million from the date of acquisition.
Due to its inherent limitations, internal control over financial reporting is not intended to provide absolute assurance that
a misstatement of Pembina's financial statements would be prevented or detected. Further, the evaluation of the
effectiveness of internal control over financial reporting was made as at a specific date, and continued effectiveness in
future periods is subject to the risks that controls may become inadequate.
The Board of Directors of the Company (the "Board") is responsible for ensuring management fulfils its responsibilities for
financial reporting and internal control. The Board is assisted in exercising its responsibilities through the Audit
Committee, which consists of five non-management directors. The Audit Committee meets periodically with management
and the auditors to satisfy itself that management's responsibilities are properly discharged, to review the financial
statements and to recommend approval of the financial statements to the Board.
KPMG LLP, the independent auditors, have audited the Company's financial statements in accordance with Canadian
generally accepted auditing standards and the standards of the Public Company Accounting Oversight Board (United
States), and have also audited the effectiveness of Pembina's internal control over financial reporting as of December 31,
2017 and has included an attestation report on management's assessment in their reports which follow. The independent
auditors have full and unrestricted access to the Audit Committee to discuss their audit and their related findings.
52
Changes in Internal Controls over Financial Reporting
The Company's internal controls over financial reporting commencing October 2, 2017 include Veresen's systems,
processes and controls, as well as additional controls designed to result in complete and accurate consolidation of
Veresen's results. Other than Veresen, there has been no change in the Company's internal control over financial reporting
that occurred during the year covered by this Annual Report that has materially affected, or are reasonably likely to
materially affect, Pembina's internal control over financial reporting.
M. H. Dilger J. Scott Burrows
President and Chief Executive Officer Senior Vice President and Chief Financial Officer Pembina Pipeline Corporation Pembina Pipeline Corporation
February 22, 2018

KPMG LLP 205 5th Avenue SW Suite 3100 Calgary AB T2P 4B9 Telephone (403) 691-8000 Fax (403) 691-8008 www.kpmg.ca
53
KPMG LLP is a Canadian limited liability partnership and a member firm of the KPMG network of independent member firms affiliated with KPMG International Cooperative ("KPMG International"), a Swiss entity. KPMG Canada provides services to KPMG LLP.
REPORT OF INDEPENDENT REGISTERED PUBLIC ACCOUNTING FIRM
To the Shareholders and the Board of Directors of Pembina Pipeline Corporation
Opinion on the Consolidated Financial Statements
We have audited the accompanying consolidated financial statements of Pembina Pipeline Corporation, which comprise
the consolidated statements of financial position as at December 31, 2017 and December 31, 2016, the consolidated
statements of earnings and comprehensive income, changes in equity and cash flows for the years then ended, and
notes, comprising a summary of significant accounting policies and other explanatory information (collectively referred to
as the "consolidated financial statements").
In our opinion, the consolidated financial statements present fairly, in all material respects, the consolidated financial
position of Pembina Pipeline Corporation as at December 31, 2017 and December 31, 2016, and its consolidated financial
performance and its consolidated cash flows for the years then ended in accordance with International Financial
Reporting Standards as issued by the International Accounting Standards Board.
Report on Internal Control over Financial Reporting
We also have audited, in accordance with the standards of the Public Company Accounting Oversight Board (United
States) ("PCAOB"), Pembina Pipeline Corporation's internal control over financial reporting as of December 31, 2017,
based on the criteria established in Internal Control – Integrated Framework (2013) issued by the Committee of
Sponsoring Organizations of the Treadway Commission (COSO), and our report dated February 22, 2018, expressed an
unqualified (unmodified) opinion on the effectiveness of Pembina Pipeline Corporation’s internal control over financial
reporting.
Basis for Opinion
A – Management's Responsibility for the Consolidated Financial Statements
Management is responsible for the preparation and fair presentation of these consolidated financial statements in
accordance with International Financial Reporting Standards as issued by the International Accounting Standards Board,
and for such internal control as management determines is necessary to enable the preparation of consolidated financial
statements that are free from material misstatement, whether due to fraud or error.
B – Auditors' Responsibility
Our responsibility is to express an opinion on these consolidated financial statements based on our audits. We conducted
our audits in accordance with Canadian generally accepted auditing standards and the standards of the PCAOB. Those
standards require that we plan and perform the audit to obtain reasonable assurance about whether the consolidated
financial statements are free from material misstatement, whether due to error or fraud. Those standards also require
that we comply with ethical requirements, including independence. We are required to be independent with respect to
54
Pembina Pipeline Corporation in accordance with the ethical requirements that are relevant to our audit of the
consolidated financial statements in Canada, the U.S. federal securities laws and the applicable rules and regulations of
the Securities and Exchange Commission and PCAOB. We are a public accounting firm registered with the PCAOB.
An audit includes performing procedures to assess the risks of material misstatements of the consolidated financial
statements, whether due to error or fraud, and performing procedures to respond to those risks. Such procedures
included obtaining and examining, on a test basis, audit evidence regarding the amounts and disclosures in the
consolidated financial statements. The procedures selected depend on our judgment, including the assessment of the
risks of material misstatement of the consolidated financial statements, whether due to fraud or error. In making those
risk assessments, we consider internal control relevant to Pembina Pipeline Corporation’s preparation and fair
presentation of the consolidated financial statements in order to design audit procedures that are appropriate in the
circumstances.
An audit also includes evaluating the appropriateness of accounting policies and principles used and the reasonableness
of accounting estimates made by management, as well as evaluating the overall presentation of the consolidated
financial statements.
We believe that the audit evidence we have obtained in our audits is sufficient and appropriate to provide a reasonable
basis for our audit opinion.
Chartered Professional Accountants
We have served as Pembina Pipeline Corporation’s auditor since 1997.
February 22, 2018
Calgary, Canada
KPMG LLP 205 5th Avenue SW Suite 3100 Calgary AB T2P 4B9 Telephone (403) 691-8000 Fax (403) 691-8008 www.kpmg.ca
55
KPMG LLP is a Canadian limited liability partnership and a member firm of the KPMG network of independent member firms affiliated with KPMG International Cooperative ("KPMG International"), a Swiss entity. KPMG Canada provides services to KPMG LLP.
REPORT OF INDEPENDENT REGISTERED PUBLIC ACCOUNTING FIRM
To the Shareholders and the Board of Directors of Pembina Pipeline Corporation
Opinion on Internal Control over Financial Reporting
We have audited Pembina Pipeline Corporation’s (the "Corporation") internal control over financial reporting as of
December 31, 2017, based on the criteria established in Internal Control – Integrated Framework (2013) issued by the
Committee of Sponsoring Organizations of the Treadway Commission (COSO).
In our opinion, the Corporation maintained, in all material respects, effective internal control over financial reporting as of
December 31, 2017, based on the criteria established in Internal Control – Integrated Framework (2013) issued by the
Committee of Sponsoring Organizations of the Treadway Commission (COSO).
The Corporation acquired Veresen Inc. on October 2, 2017, and management excluded from its assessment of the
effectiveness of the Corporation's internal control over financial reporting as of December 31, 2017, Veresen Inc.'s internal
control over financial reporting associated with approximately 28 percent of total assets and nil percent of total revenues
included in the consolidated financial statements of the Corporation as of and for the year ended December 31, 2017.
Share of profit from Veresen Inc.’s equity accounted investees were $116 million from the date of the acquisition. Our
audit of internal control over financial reporting of the Corporation also excluded an evaluation of the internal control over
financial reporting of Veresen Inc.
Report on the Consolidated Financial Statements
We also have audited, in accordance with Canadian generally accepted auditing standards and the standards of the Public
Company Accounting Oversight Board (United States) ("PCAOB"), the consolidated financial statements of the
Corporation, which comprise the consolidated statements of financial position as at December 31, 2017 and December
31, 2016, the consolidated statements of earnings and comprehensive income, changes in equity and cash flows for the
years then ended, and notes comprising a summary of significant accounting policies and other explanatory information
(collectively referred to as the "consolidated financial statements") and our report dated February 22, 2018 expressed an
unmodified (unqualified) opinion on those consolidated financial statements.
Basis for Opinion
The Corporation's management is responsible for maintaining effective internal control over financial reporting and for its
assessment of the effectiveness of internal control over financial reporting, included in the accompanying Management's
Annual Report on Internal Control over Financial Reporting. Our responsibility is to express an opinion on the
Corporation’s internal control over financial reporting based on our audit.
We are a public accounting firm registered with the PCAOB and are required to be independent with respect to the
Corporation in accordance with the U.S. federal securities laws and the applicable rules and regulations of the Securities

56
and Exchange Commission and the PCAOB and in accordance with the ethical requirements that are relevant to our audit
of the financial statements in Canada.
We conducted our audit in accordance with the standards of the PCAOB. Those standards require that we plan and
perform the audit to obtain reasonable assurance about whether effective internal control over financial reporting was
maintained in all material respects. Our audit of internal control over financial reporting included obtaining an
understanding of internal control over financial reporting, assessing the risk that a material weakness exists, and testing
and evaluating the design and operating effectiveness of internal control based on the assessed risk. Our audit also
included performing such other procedures as we considered necessary in the circumstances. We believe that our audit
provides a reasonable basis for our opinion.
Definition and Limitations of Internal Control over Financial Reporting
A company’s internal control over financial reporting is a process designed to provide reasonable assurance regarding the
reliability of financial reporting and the preparation of financial statements for external purposes in accordance with
generally accepted accounting principles. A company’s internal control over financial reporting includes those policies and
procedures that (1) pertain to the maintenance of records that, in reasonable detail, accurately and fairly reflect the
transactions and dispositions of the assets of the company; (2) provide reasonable assurance that transactions are
recorded as necessary to permit preparation of financial statements in accordance with generally accepted accounting
principles, and that receipts and expenditures of the company are being made only in accordance with authorizations of
management and directors of the company; and (3) provide reasonable assurance regarding prevention or timely
detection of unauthorized acquisition, use, or disposition of the company’s assets that could have a material effect on the
financial statements.
Because of its inherent limitations, internal control over financial reporting may not prevent or detect misstatements.
Also, projections of any evaluation of effectiveness to future periods are subject to the risk that controls may become
inadequate because of changes in conditions, or that the degree of compliance with the policies or procedures may
deteriorate.
Chartered Professional Accountants
February 22, 2018
Calgary, Canada
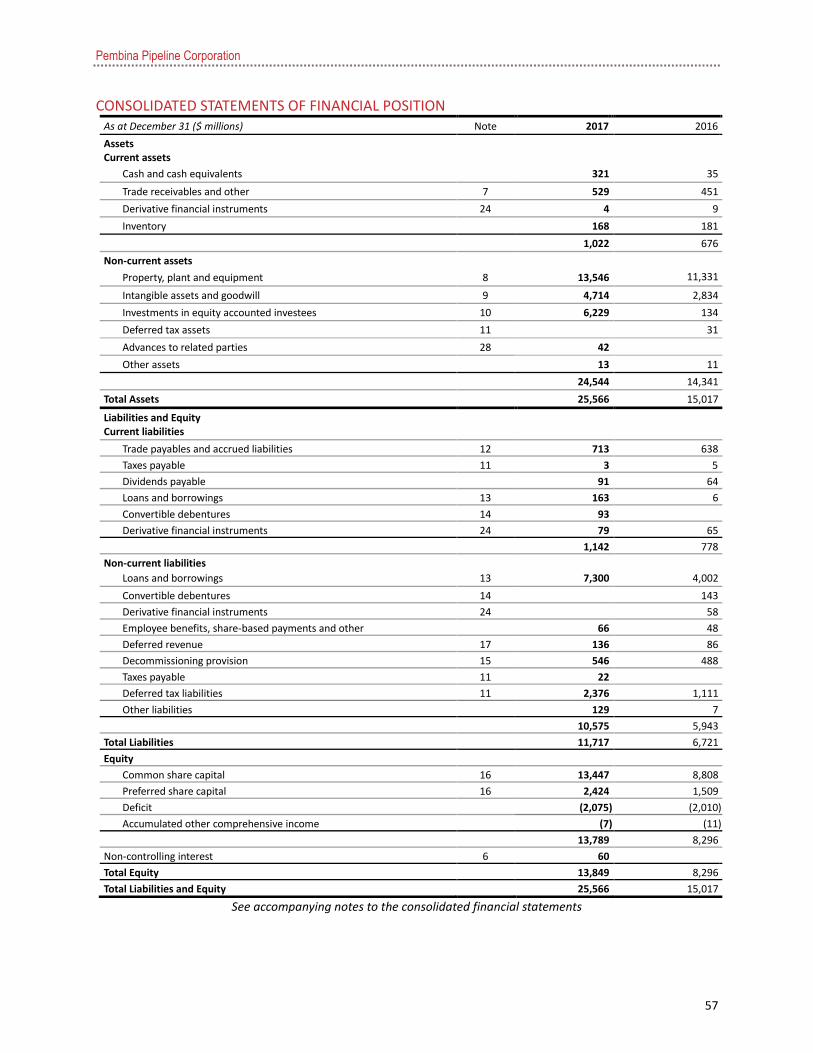
Pembina Pipeline Corporation
57
CONSOLIDATED STATEMENTS OF FINANCIAL POSITION As at December 31 ($ millions) Note 2017 2016
Assets Current assets
Cash and cash equivalents 321 35
Trade receivables and other 7 529 451
Derivative financial instruments 24 4 9
Inventory 168 181
1,022 676
Non-current assets
Property, plant and equipment 8 13,546 11,331
Intangible assets and goodwill 9 4,714 2,834
Investments in equity accounted investees 10 6,229 134
Deferred tax assets 11 31
Advances to related parties 28 42
Other assets 13 11
24,544 14,341
Total Assets 25,566 15,017
Liabilities and Equity Current liabilities
Trade payables and accrued liabilities 12 713 638
Taxes payable 11 3 5
Dividends payable 91 64
Loans and borrowings 13 163 6
Convertible debentures 14 93
Derivative financial instruments 24 79 65
1,142 778
Non-current liabilities
Loans and borrowings 13 7,300 4,002
Convertible debentures 14 143
Derivative financial instruments 24 58
Employee benefits, share-based payments and other 66 48
Deferred revenue 17 136 86
Decommissioning provision 15 546 488
Taxes payable 11 22
Deferred tax liabilities 11 2,376 1,111
Other liabilities 129 7
10,575 5,943
Total Liabilities 11,717 6,721
Equity
Common share capital 16 13,447 8,808
Preferred share capital 16 2,424 1,509
Deficit (2,075 ) (2,010 )
Accumulated other comprehensive income (7 ) (11 )
13,789 8,296
Non-controlling interest 6 60
Total Equity
13,849 8,296
Total Liabilities and Equity 25,566 15,017
See accompanying notes to the consolidated financial statements
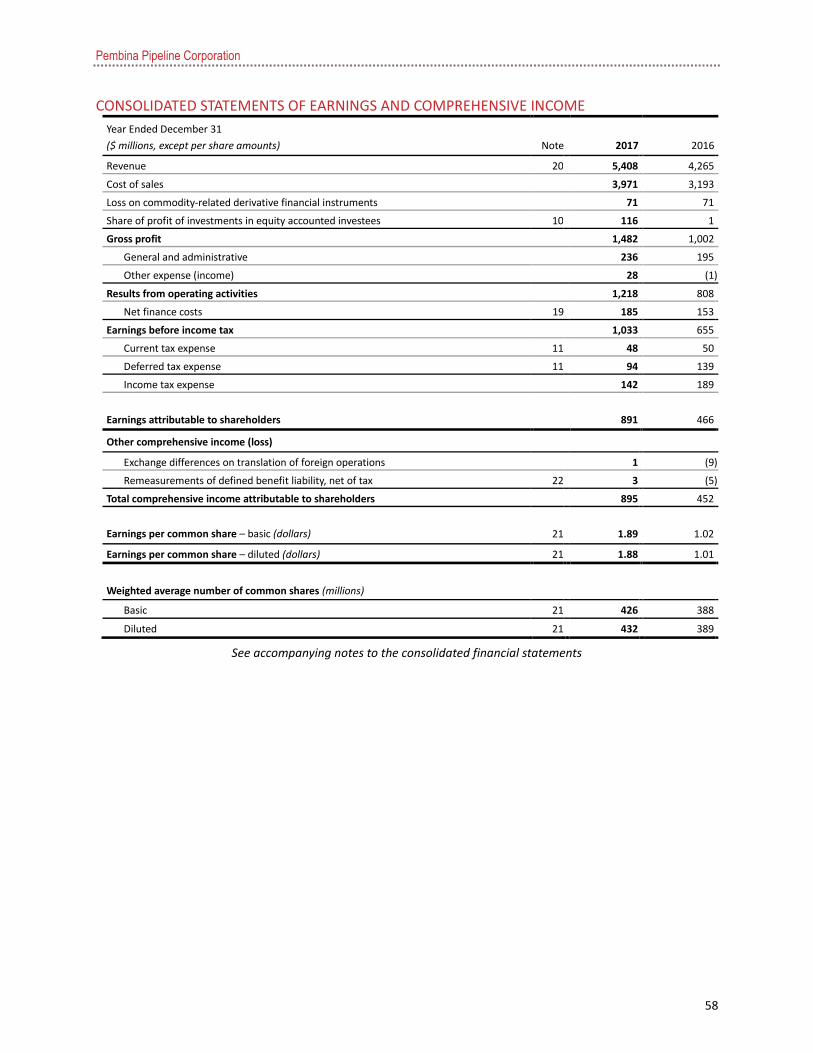
Pembina Pipeline Corporation
58
CONSOLIDATED STATEMENTS OF EARNINGS AND COMPREHENSIVE INCOME
Year Ended December 31
($ millions, except per share amounts) Note 2017 2016
Revenue 20 5,408 4,265
Cost of sales 3,971 3,193
Loss on commodity-related derivative financial instruments 71 71
Share of profit of investments in equity accounted investees 10 116 1
Gross profit 1,482 1,002
General and administrative 236 195
Other expense (income) 28 (1 )
Results from operating activities 1,218 808
Net finance costs 19 185 153
Earnings before income tax 1,033 655
Current tax expense 11 48 50
Deferred tax expense 11 94 139
Income tax expense 142 189
Earnings attributable to shareholders 891 466
Other comprehensive income (loss)
Exchange differences on translation of foreign operations 1 (9 )
Remeasurements of defined benefit liability, net of tax 22 3 (5 )
Total comprehensive income attributable to shareholders 895 452
Earnings per common share – basic (dollars) 21
1.89
1.02
Earnings per common share – diluted (dollars) 21 1.88 1.01
Weighted average number of common shares (millions)
Basic 21 426 388
Diluted 21 432 389
See accompanying notes to the consolidated financial statements

Pembina Pipeline Corporation
59
CONSOLIDATED STATEMENTS OF CHANGES IN EQUITY Attributable to Shareholders of the Company
($ millions) Note Common
share capital Preferred
share capital Deficit
Accumulated other
comprehensive income Total
Non-controlling
interest Total
Equity
December 31, 2016 8,808 1,509 (2,010 ) (11 ) 8,296 8,296
Total comprehensive income
Earnings 891 891 891
Other comprehensive income
Exchange differences on translation of foreign operations 1 1 1
Remeasurements of defined benefit liability, net of tax 3 3 3
Total comprehensive income 891 4 895 895
Transactions with shareholders of the Company
Common shares issued, net of issue costs 4,356 4,356 4,356
Preferred shares issued, net of issue costs 915 915 915
Dividend reinvestment plan 16 148 148 148
Debenture conversions 16 73 73 73
Share-based payment transactions 16 62 62 62
Dividends declared – common 16 (873 ) (873 ) (873 )
Dividends declared – preferred 16 (83 ) (83 ) (83 )
Total transactions with shareholders of the Company 4,639 915 (956 ) 4,598 4,598
Non-controlling interest recognized on Acquisition 6 60 60
December 31, 2017 13,447 2,424 (2,075 ) (7 ) 13,789 60 13,849
December 31, 2015 7,991 1,100 (1,670 ) 3 7,424 7,424
Total comprehensive income
Earnings 466 466 466
Other comprehensive income
Exchange differences on translation of foreign operations (9 ) (9 ) (9 )
Remeasurements of defined benefit liability, net of tax (5 ) (5 ) (5 )
Total comprehensive income 466 (14 ) 452 452
Transactions with shareholders of the Company
Common shares issued, net of issue costs 335 335 335
Preferred shares issued, net of issue costs 409 409 409
Dividend reinvestment plan 449 449 449
Debenture conversions 2 2 2
Share-based payment transactions 31 31 31
Dividends declared – common (737 ) (737 ) (737 )
Dividends declared – preferred (69 ) (69 ) (69 )

Pembina Pipeline Corporation
60
Attributable to Shareholders of the Company
($ millions) Note Common
share capital Preferred
share capital Deficit
Accumulated other
comprehensive income Total
Non-controlling
interest Total
Equity
Total transactions with shareholders of the Company 817 409 (806 ) 420 420
December 31, 2016 8,808 1,509 (2,010 ) (11 ) 8,296 8,296
See accompanying notes to the consolidated financial statements
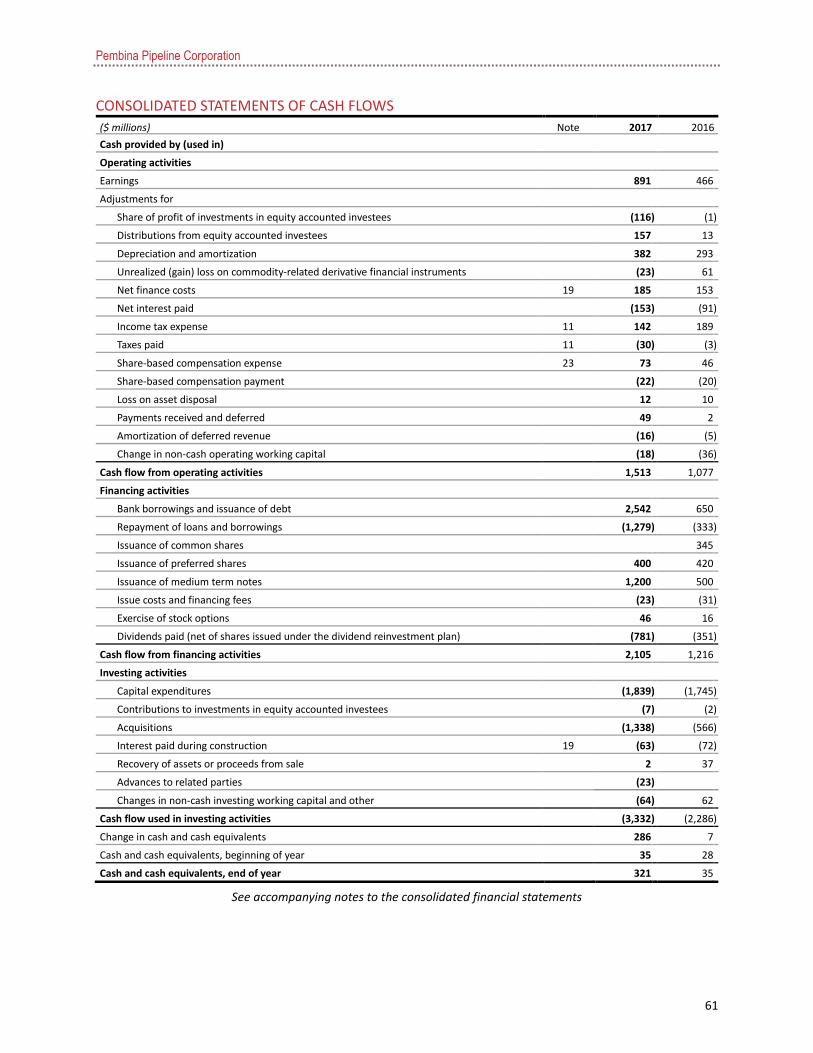
Pembina Pipeline Corporation
61
CONSOLIDATED STATEMENTS OF CASH FLOWS
($ millions) Note 2017 2016
Cash provided by (used in)
Operating activities
Earnings 891 466
Adjustments for
Share of profit of investments in equity accounted investees (116 ) (1 )
Distributions from equity accounted investees 157 13
Depreciation and amortization 382 293
Unrealized (gain) loss on commodity-related derivative financial instruments (23 ) 61
Net finance costs 19 185 153
Net interest paid (153 ) (91 )
Income tax expense 11 142 189
Taxes paid 11 (30 ) (3 )
Share-based compensation expense 23 73 46
Share-based compensation payment (22 ) (20 )
Loss on asset disposal 12 10
Payments received and deferred 49 2
Amortization of deferred revenue (16 ) (5 )
Change in non-cash operating working capital (18 ) (36 )
Cash flow from operating activities 1,513 1,077
Financing activities
Bank borrowings and issuance of debt 2,542 650
Repayment of loans and borrowings (1,279 ) (333 )
Issuance of common shares 345
Issuance of preferred shares 400 420
Issuance of medium term notes 1,200 500
Issue costs and financing fees (23 ) (31 )
Exercise of stock options 46 16
Dividends paid (net of shares issued under the dividend reinvestment plan) (781 ) (351 )
Cash flow from financing activities 2,105 1,216
Investing activities
Capital expenditures (1,839 ) (1,745 )
Contributions to investments in equity accounted investees (7 ) (2 )
Acquisitions (1,338 ) (566 )
Interest paid during construction 19 (63 ) (72 )
Recovery of assets or proceeds from sale 2 37
Advances to related parties (23 )
Changes in non-cash investing working capital and other (64 ) 62
Cash flow used in investing activities (3,332 ) (2,286 )
Change in cash and cash equivalents 286 7
Cash and cash equivalents, beginning of year 35 28
Cash and cash equivalents, end of year 321 35
See accompanying notes to the consolidated financial statements

Pembina Pipeline Corporation
62
NOTES TO THE CONSOLIDATED FINANCIAL STATEMENTS
1. REPORTING ENTITY .................................................................................................................................................. 63
2. BASIS OF PREPARATION ........................................................................................................................................... 63
3. CHANGES IN ACCOUNTING POLICIES ....................................................................................................................... 65
4. SIGNIFICANT ACCOUNTING POLICIES ...................................................................................................................... 65
5. DETERMINATION OF FAIR VALUES ........................................................................................................................... 79
6. ACQUISITION............................................................................................................................................................ 81
7. TRADE RECEIVABLES AND OTHER ............................................................................................................................ 82
8. PROPERTY, PLANT AND EQUIPMENT ....................................................................................................................... 83
9. INTANGIBLE ASSETS AND GOODWILL ...................................................................................................................... 84
10. INVESTMENTS IN EQUITY ACCOUNTED INVESTEES ............................................................................................... 86
11. INCOME TAXES ....................................................................................................................................................... 87
12. TRADE PAYABLES AND ACCRUED LIABILITIES ......................................................................................................... 89
13. LOANS AND BORROWINGS .................................................................................................................................... 90
14. CONVERTIBLE DEBENTURES .................................................................................................................................. 91
15. DECOMMISSIONING PROVISION ........................................................................................................................... 91
16. SHARE CAPITAL ...................................................................................................................................................... 92
17. DEFERRED REVENUE .............................................................................................................................................. 96
18. PERSONNEL EXPENSES ........................................................................................................................................... 96
19. NET FINANCE COSTS .............................................................................................................................................. 96
20. OPERATING SEGMENTS.......................................................................................................................................... 96
21. EARNINGS PER COMMON SHARE ........................................................................................................................ 100
22. PENSION PLAN ..................................................................................................................................................... 101
23. SHARE-BASED PAYMENTS .................................................................................................................................... 103
24. FINANCIAL INSTRUMENTS ................................................................................................................................... 106
25. OPERATING LEASES .............................................................................................................................................. 112
26. CAPITAL MANAGEMENT ...................................................................................................................................... 112
27. GROUP ENTITIES .................................................................................................................................................. 113
28. RELATED PARTIES ................................................................................................................................................. 113
Pembina Pipeline Corporation
63
1. REPORTING ENTITY
Pembina Pipeline Corporation ("Pembina" or the "Company") is an energy transportation and service provider
domiciled in Canada. The consolidated financial statements ("Financial Statements") include the accounts of the
Company, its subsidiary companies, partnerships and any investments in associates and joint arrangements as at
and for the year ended December 31, 2017. These Financial Statements present fairly the financial position,
financial performance, and cash flows of the Company.
Pembina owns or has interests in conventional crude oil, condensate, natural gas and natural gas liquids ("NGL")
pipelines, oil sands and heavy oil pipelines, gas gathering and processing facilities, an NGL infrastructure and
logistics business and midstream services that span across its operations. The Company's assets are located in
Canada and in the United States.
2. BASIS OF PREPARATION
a. Basis of measurement and statement of compliance
The Financial Statements have been prepared on a historical cost basis with some exceptions, as detailed the
accounting policies set out below in accordance with International Financial Reporting Standards ("IFRS"), as issued
by the International Accounting Standards Board ("IASB"). These accounting policies have been applied consistently
for all periods presented in these financial statements.
Certain insignificant comparative amounts have been reclassified to conform to the presentation adopted in the
current year.
The Financial Statements were authorized for issue by Pembina's Board of Directors on February 22, 2018.
b. Functional and presentation currency
The Financial Statements are presented in Canadian dollars. All financial information presented in Canadian dollars
has been disclosed in millions, except where noted. The assets and liabilities of subsidiaries, and investments in
equity accounted investees, whose functional currencies are other than Canadian dollars are translated into
Canadian dollars at the foreign exchange rate at the balance sheet date, while revenues and expenses of such
subsidiaries are translated using average monthly foreign exchange rates, which approximate the foreign exchange
rates on the dates of the transactions. Foreign exchange differences arising on translation of subsidiaries and
investments in equity accounted investees with a functional currency other than the Canadian dollar are included
in Other Comprehensive Income.
c. Use of estimates and judgments
The preparation of the Financial Statements in conformity with IFRS requires management to make judgments,
estimates and assumptions that are based on the circumstances and estimates at the date of the financial
statements and affect the application of accounting policies and the reported amounts of assets, liabilities, income
and expenses. Actual results may differ from these estimates.
Judgments, estimates and underlying assumptions are reviewed on an ongoing basis. Revisions to accounting
estimates are recognized in the period in which the estimates are revised and in any future periods affected.
The following judgment and estimation uncertainties are those management considers material to the Company's
financial statements:
Pembina Pipeline Corporation
64
Judgments
(i) Business combinations
Business combinations are accounted for using the acquisition method of accounting. The determination of
fair value often requires management to make judgments about future possible events. The assumptions with
respect to determining the fair value of property, plant and equipment, intangible assets and liabilities
acquired, as well as the determination of deferred taxes, generally require the most judgment.
(ii) Depreciation and amortization
Depreciation and amortization of property, plant and equipment and intangible assets are based on
management's judgment of the most appropriate method to reflect the pattern of an asset's future economic
benefit expected to be consumed by the Company. Among other factors, these judgments are based on
industry standards and historical experience.
(iii) Impairment
Assessment of impairment is based on management's judgment of whether there are sufficient internal and
external factors that would indicate that an asset, investment or cash generating unit ("CGU"), or group of
CGU's are impaired. The determination of a CGU is also based on management's judgment and is an
assessment of the smallest group of assets that generate cash inflows independently of other assets. The asset
composition of a CGU can directly impact the recoverability of the assets included therein. In assessing the
recoverability, each CGU's carrying value is compared to its recoverable amount, defined as the greater of fair
value less costs to sell and value in use.
(iv) Assessment of joint control over joint arrangements
Jointly controlled arrangements which entitle the Company to the rights of the net assets to the arrangement
are accounted for using the equity method. The determination of joint control requires judgment about the
influence the Company has over the financial and operating decisions of the arrangement and the extent of
the benefits it obtains based on the facts and circumstances of the arrangement during the reporting period.
Joint control exists when decisions about the relevant activities require the unanimous consent of the parties
that control the arrangement collectively. Ownership percentage alone may not be a determinant of joint
control.
Estimates
(i) Business combinations
Estimates of future cash flows, forecast prices, interest rates, discount rates, cost, market values and useful
lives are made in determining the fair value of assets acquired and liabilities assumed. Changes in any of the
assumptions or estimates used in determining the fair value of acquired assets and liabilities could impact the
amounts assigned to assets, liabilities, intangible assets, goodwill and deferred taxes in the purchase price
equation. Future earnings can be affected as a result of changes in future depreciation and amortization, asset
or goodwill impairment.
Pembina Pipeline Corporation
65
(ii) Provisions and contingencies
Provisions recognized are based on management's judgment about timing, scope and amount of assets and
liabilities. Management uses judgment in determining the likelihood of realization of contingent assets and
liabilities to determine the outcome of contingencies.
Based on the long-term nature of the decommissioning provision, the most significant uncertainties in
estimating the provision are the discount and inflation rates used, the costs that will be incurred and the
timing of when these costs will occur.
(iii) Deferred taxes
The calculation of the deferred tax asset or liability is based on assumptions about the timing of many taxable
events and the enacted or substantively enacted rates anticipated to be applicable to income in the years in
which temporary differences are expected to be realized or reversed.
(iv) Depreciation and amortization
Estimated useful lives of property, plant and equipment and intangible assets are based on management's
assumptions and estimates of the physical useful lives of the assets, the economic lives, which may be
associated with the reserve lives and commodity type of the production area, in addition to the estimated
residual value.
(v) Impairment tests
Impairment tests include management's best estimates of future cash flows and discount rates.
3. CHANGES IN ACCOUNTING POLICIES
The Company adopted IFRS 9 Financial Instruments (2014) effective January 1, 2017 in advance of the mandatory
effective date of January 1, 2018. The new standard addresses the classification and measurement of financial
assets and financial liabilities, impairment and hedge accounting.
IFRS 9 introduces new requirements for the measurement and classification of financial assets, replacing the
previous multiple classification and measurement models. IFRS 9 requires the classification of financial assets in
three main categories: fair value through profit or loss, fair value through other comprehensive income, and
amortized cost. All of the Company's financial assets have been reclassified from loans and receivables at
amortized cost to financial assets at amortized cost. There was no change in the carrying value of the Company's
financial assets.
4. SIGNIFICANT ACCOUNTING POLICIES
The accounting policies as set out below have been applied consistently to all periods presented in these Financial
Statements.
a. Basis of consolidation
i) Business combinations
The Company measures goodwill as the fair value of the consideration transferred including the recognized
amount of any non-controlling interest in the acquiree, less the fair value of the identifiable assets acquired
Pembina Pipeline Corporation
66
and liabilities assumed, all measured as of the acquisition date. When the excess is negative, a bargain
purchase gain is recognized immediately in earnings.
The Company elects on a transaction-by-transaction basis whether to measure non-controlling interest at its
fair value, or at its proportionate share of the recognized amount of the identifiable net assets, at the
acquisition date.
Non-controlling interests represent equity interests in subsidiaries owned by outside parties. The share of net
assets of subsidiaries attributable to non-controlling interests is presented as a separate component of equity.
Their share of net income and other comprehensive income is also recognized in this separate component of
equity. Changes in the Company's ownership interest in subsidiaries that do not result in a loss of control are
accounted for as equity transactions. Adjustments to non-controlling interests are based on a proportionate
amount of the net assets of the subsidiary. No adjustments are made to goodwill and no gain or loss is
recognized in earnings.
Transaction costs, other than those associated with the issue of debt or equity securities, that the Company
incurs in connection with a business combination are expensed as incurred.
ii) Subsidiaries
Subsidiaries are entities, including unincorporated entities such as partnerships, controlled by the Company.
The financial results of subsidiaries are included in the Financial Statements from the date that control
commences until the date that control ceases. The accounting policies of subsidiaries are aligned with the
policies adopted by the Company.
iii) Investments in associates
Associates are those entities in which the Company has significant influence and thereby has the power to
participate in the financial and operational decisions, but does not control or jointly control the investee.
Significant influence is presumed to exist when the Company holds between 20 and 50 percent of the voting
power of another entity.
The Financial Statements include the Company's share of the earnings and other comprehensive income, after
adjustments to align the accounting policies with those of the Company, from the date that significant
influence commences until the date that significant influence ceases. The Company's investments in associates
are accounted for using the equity method and are recognized initially at cost, including transaction costs.
When the Company's share of losses exceeds its interest in an equity accounted investee, the carrying amount
of that interest, including any long-term investments, is reduced to nil, and the recognition of further losses is
discontinued except to the extent that the Company has an obligation or has made payments on behalf of the
investee.
iv) Joint arrangements
Joint arrangements represent activities where the Company has joint control established by a contractual
agreement. Joint control requires unanimous consent for the relevant financial and operational decisions. A
joint arrangement is either a joint operation, whereby the parties have rights to the assets and obligations for
the liabilities, or a joint venture, whereby the parties have rights to the net assets.
Pembina Pipeline Corporation
67
For a joint operation, the consolidated financial statements include the Company's proportionate share of the
assets, liabilities, revenues, expenses and cash flows of the arrangement with items of a similar nature on a
line-by-line basis, from the date that joint control commences until the date that joint control ceases.
Joint ventures are accounted for using the equity method of accounting and are initially recognized at cost, or
fair value if acquired as part of a business combination. Joint ventures are adjusted thereafter for the post-
acquisition change in the Company's share of the equity accounted investment's net assets. The Company's
consolidated financial statements include its share of the equity accounted investment's profit or loss and
other comprehensive income, until the date that joint control ceases. Distributions from Investments in Equity
Accounted Investees are recognized when received.
Acquisition of an incremental ownership in a joint arrangement where the Company maintains joint control is
recorded at cost or fair value if acquired as part of a business combination. Where the Company has a partial
disposal, including a deemed disposal, of a joint arrangement and maintains joint control, the resulting gains or
losses are recorded in earnings at the time of disposal.
Determining the type of joint arrangement as either joint operation or joint venture is based on management's
judgement of whether it has rights to the net assets, or rights to the assets and obligations for the liabilities of
the jointly controlled entity. The considerations include, but are not limited to, whether the legal form and
contractual arrangements give the entity direct rights to the assets and obligations for the liabilities within the
normal course of business. Other facts and circumstances are also assessed by management, including the
entity's rights to the economic benefits of assets and its involvement and responsibility for settling liabilities
associated with the arrangement.
v) Transactions eliminated on consolidation
Balances and transactions, and any unrealized revenue and expenses arising from intersegment transactions,
are eliminated in preparing the consolidated financial statements. Unrealized gains arising from transactions
with investments in equity accounted investees are eliminated against the investment to the extent of the
Company's interest in the investee. Unrealized losses are eliminated in the same way as unrealized gains, but
only to the extent that there is no evidence of impairment.
vi) Foreign currency
Transactions in foreign currencies are translated to the Company's functional currency at exchange rates at the
dates of the transactions. Monetary assets and liabilities denominated in foreign currencies at the reporting
date are retranslated to the Company's functional currency at the exchange rate at that date. The foreign
currency gain or loss on monetary items is the difference between amortized cost in the functional currency at
the beginning of the period, adjusted for effective interest and payments during the period, and the amortized
cost in foreign currency translated at the exchange rate at the end of the reporting period.
Non-monetary assets and liabilities denominated in foreign currencies that are measured at fair value are
retranslated to the functional currency at the exchange rate at the date that the fair value was determined.
Non-monetary items that are measured in terms of historical cost in a foreign currency are translated using the
exchange rate at the date of the transaction.
Pembina Pipeline Corporation
68
Foreign currency differences arising on retranslation are recognized in earnings, with the exception of foreign
exchange differences arising on translation of subsidiaries or investments in equity accounted investees whose
functional currencies are other than the Canadian dollar which are included in Other Comprehensive Income.
b. Cash and cash equivalents
Cash and cash equivalents comprise cash balances, call deposits and short-term investments with original
maturities of ninety days or less that are subject to an insignificant risk of changes in their fair value, and are used
by the Company in the management of its short-term commitments.
c. Trade and other receivables
Trade and other receivables are financial assets with fixed or determinable payments that are not quoted in an
active market.
Such assets are recognized initially at fair value plus any directly attributable transaction costs. Subsequent to initial
recognition, loans and receivables are measured at amortized cost using the effective interest method less any
impairment losses.
d. Inventories
Inventories are measured at the lower of cost and net realizable value and consist primarily of crude oil, NGL and
spare parts. The cost of inventories is determined using the weighted average costing method and includes direct
purchase costs and when applicable, costs of production, extraction, fractionation, and transportation. Net
realizable value is the estimated selling price in the ordinary course of business less the estimated selling costs. All
changes in the value of the inventories are reflected in inventories and cost of sales.
e. Financial instruments
Financial assets and liabilities are offset and the net amount presented in the statement of financial position when,
and only when, the Company has a legal right to offset the amounts and intends either to settle on a net basis or to
realize the asset and settle the liability simultaneously.
i) Non-derivative financial assets
The Company initially recognizes loans, receivables and deposits on the date that they are originated. All other
financial assets are recognized on the trade date at which the Company becomes a party to the contractual
provisions of the instrument.
The Company derecognizes a financial asset when the contractual rights to the cash flows from the asset
expire, or it transfers the rights to receive the contractual cash flows on the financial asset in a transaction in
which substantially all the risks and rewards of ownership of the financial asset are transferred. Any interest in
transferred financial assets that is created or retained by the Company is recognized as a separate asset or
liability. On derecognition, the difference between the carrying amount of the financial asset and the
consideration received is recognized in earnings.
Pembina Pipeline Corporation
69
The Company classifies non-derivative financial assets into the following categories:
Financial assets at amortized cost
A financial asset is classified in this category if the asset is held within a business model whose objective is to
collect contractual cash flows and on specified dates that are solely payments of principal and interest. At
initial recognition, financial assets at amortized costs are recognized at fair value plus directly attributable
transaction costs. Subsequent to initial recognition, these financial assets are recorded at amortized cost using
the effective interest method less any impairment losses.
Financial assets at fair value through other comprehensive income
A financial asset is classified in this category if the asset is held within a business model whose objective is met
by both collecting contractual cash flows and selling financial assets. The Company did not have any financial
assets classified as fair value through other comprehensive income during the years covered in these financial
statements.
Financial assets at fair value through profit or loss
A financial asset is classified in this category if it is not classified as a financial asset at amortized cost or a
financial asset at fair value through other comprehensive income, or it is an equity instrument designated as
such on initial recognition. The Company did not have any non-derivative financial assets classified as fair value
through profit or loss during the years covered in these financial statements.
ii) Non-derivative financial liabilities
The Company initially recognizes financial liabilities on the trade date at which the Company becomes a party
to the contractual provisions of the instrument.
The Company derecognizes a financial liability when its contractual obligations are discharged, cancelled or
expire. On derecognition, the difference between the carrying value of the liability and the consideration paid,
including any non-cash assets transferred or liabilities assumes, is recognized in earnings.
The Company records a modification or exchange of an existing liability as a derecognition of the financial
liability if the terms are substantially different, resulting in a difference of more than 10 percent when
comparing the present value of the remaining cash flows of the existing liability to the present value of the
discounted cash flow under the new terms using the original effective interest rate.
If a modification to an existing liability causes a revision to the estimated payments of the liability but is not
treated as a derecognition, the Company adjusts the gross carrying amount of the liability to the present value
of the estimated contractual cash flows using the instrument's original effective interest rate, with the
difference recorded in earnings.
The Company's non-derivative financial liabilities are comprised of the following: bank overdrafts, trade
payables and accrued liabilities, taxes payable, dividends payable, loans and borrowings including finance lease
obligations, other liabilities and the liability component of convertible debentures.
Such financial liabilities are recognized initially at fair value plus any directly attributable transaction costs.
Subsequent to initial recognition these financial liabilities are measured at amortized cost using the effective
interest method.

Pembina Pipeline Corporation
70
Bank overdrafts that are repayable on demand and form an integral part of the Company's cash management
are included as a component of cash and cash equivalents for the purpose of the statement of cash flows.
iii) Common share capital
Common shares are classified as equity. Incremental costs directly attributable to the issue of common shares
and share options are recognized as a deduction from equity, net of any tax effects.
iv) Preferred share capital
Preferred shares are classified as equity because they bear discretionary dividends and do not contain any
obligations to deliver cash or other financial assets. Discretionary dividends are recognized as equity
distributions on approval by the Company's Board of Directors. Incremental costs directly attributable to the
issue of preferred shares are recognized as a deduction from equity, net of any tax effects.
v) Compound financial instruments
The Company's convertible debentures are compound financial instruments consisting of a financial liability
and an embedded conversion feature. In accordance with IAS 39, the embedded derivatives are required to be
separated from the host contracts and accounted for as stand-alone instruments.
Debentures containing a cash conversion option allow Pembina to pay cash to the converting holder of the
debentures, at the option of the Company. As such, the conversion feature is presented as a financial
derivative liability within long-term derivative financial instruments. Debentures without a cash conversion
option are settled in shares on conversion, and therefore the conversion feature is presented within equity, in
accordance with its contractual substance.
On initial recognition and at each reporting date, the embedded conversion feature is measured at fair value
using an option pricing model. Subsequent to initial recognition, any unrealized gains or losses arising from fair
value changes are recognized through earnings in the statement of earnings and comprehensive income at
each reporting date. If the conversion feature is included in equity, it is not remeasured subsequent to initial
recognition. On initial recognition, the debt component, net of issue costs, is recorded as a financial liability
and accounted for at amortized cost. Subsequent to initial recognition, the debt component is accreted to the
face value of the debentures using the effective interest rate method. Upon conversion, the corresponding
portions of the debt and equity are removed from those captions and transferred to share capital.
vi) Derivative financial instruments
The Company holds derivative financial instruments to manage its interest rate, commodity, power costs and
foreign exchange risk exposures as well as a cash conversion features on convertible debentures and a
redemption liability. Embedded derivatives are separated from the host contract and accounted for separately
if the economic characteristics and risks of the host contract and the embedded derivative meet the definition
of a derivative, and the combined instrument is not measured at fair value through earnings. Derivatives are
recognized initially at fair value with attributable transaction costs recognized in earnings as incurred.
Subsequent to initial recognition, derivatives are measured at fair value and changes in non-commodity-
related derivatives are recognized immediately in earnings as part of net finance costs and changes in
commodity-related derivatives are recognized immediately in earnings.

Pembina Pipeline Corporation
71
f. Property, plant and equipment
i) Recognition and measurement
Items of property, plant and equipment are measured initially at cost, unless they are acquired as part of a
business combination in which case they are initially measured at fair value. Thereafter, property, plant and
equipment are recorded net of accumulated depreciation and accumulated impairment losses.
Cost includes expenditures that are directly attributable to the acquisition of the asset. The cost of self-
constructed assets includes the cost of materials and direct labour, any other costs directly attributable to
bringing the assets to a working condition for their intended use, estimated decommissioning provisions and
borrowing costs on qualifying assets.
Cost may also include any gain or loss realized on foreign currency transactions directly attributable to the
purchase or construction of property, plant and equipment. Purchased software that is integral to the
functionality of the related equipment is capitalized as part of that equipment.
When parts of an item of property, plant and equipment have different useful lives, they are accounted for as
separate components of property, plant and equipment.
The gain or loss on disposal of an item of property, plant and equipment is determined by comparing the
proceeds from disposal with the carrying amount of property, plant and equipment, and are recognized within
other expense or income in earnings.
ii) Subsequent costs
The cost of replacing a part of an item of property, plant and equipment is recognized in the carrying amount
of the item if it is probable that the future economic benefits embodied within the part will flow to the
Company, and its cost can be measured reliably. The carrying amount of the replaced part is derecognized and
recorded as depreciation expense. The cost of maintenance and repair expenses of the property, plant and
equipment are recognized in earnings as incurred.
iii) Depreciation
Depreciation is based on the cost of an asset less its residual value. Significant components of individual assets
are assessed and if a component has a useful life that is different from the remainder of the asset, that
component is depreciated separately. Land and linefill are not depreciated.
Depreciation is recognized in earnings on a straight line or declining balance basis, which most closely reflects
the expected pattern of consumption of the future economic benefits embodied in the asset.
Leased assets are depreciated over the shorter of the lease term and their useful lives unless it is reasonably
certain that the Company will obtain ownership by the end of the lease term.
Depreciation methods, useful lives, economic lives and residual values are reviewed annually and adjusted if
appropriate.

Pembina Pipeline Corporation
72
g. Intangible assets
i) Goodwill
Goodwill that arises upon acquisitions is included in intangible assets and goodwill. See Note 4(a)(i) for the
policy on measurement of goodwill at initial recognition.
Subsequent measurement
Goodwill is measured at cost less accumulated impairment losses.
In respect of investments in equity accounted investees, goodwill is included in the carrying amount of the
investment, and an impairment loss on such an investment is allocated to the investment and not to any asset,
including goodwill, that forms the carrying amount of the investment in equity accounted investee.
ii) Other intangible assets
Other intangible assets acquired individually by the Company are initially recognized and measured at cost,
unless they are acquired as part of a business combination in which case they are initially measured at fair
value. Thereafter, intangible assets with finite useful lives are recorded net of accumulated amortization and
accumulated impairment losses.
iii) Subsequent expenditures
Subsequent expenditures are capitalized only when it increases the future economic benefits embodied in the
specific asset to which it relates. All other expenditures are recognized in earnings as incurred.
iv) Amortization
Amortization is based on the cost of an asset less its residual value.
Amortization is recognized in earnings over the estimated useful lives of intangible assets, other than goodwill,
from the date that they are available for use.
Amortization methods, useful lives and residual values are reviewed annually and adjusted if appropriate.
h. Leased assets
Leases which the Company assumes substantially all the risks and rewards of ownership are classified as finance
leases. The leased asset is initially recognized at an amount equal to the lower of its fair value and the present
value of the minimum lease payments. Subsequent to initial recognition, the asset is accounted for in accordance
with the accounting policy applicable to that asset.
Other leases are operating leases and are not recognized in the Company's statement of financial position.
i. Lease payments
Payments made under operating leases are recognized in earnings on a straight-line basis over the term of the
lease. Lease incentives received are deferred and recognized over the term of the lease.
Minimum lease payments made under finance leases are apportioned between the finance cost and the reduction
of the outstanding liability. The finance cost is allocated to each period during the lease term so as to produce a
constant periodic rate of interest on the remaining balance of the liability. Contingent lease payments are
accounted for by revising the minimum lease payments over the remaining life.
Pembina Pipeline Corporation
73
i) Determining whether an arrangement contains a lease
At inception of an arrangement, the Company determines whether such an arrangement is or contains a lease.
A specific asset is the subject of a lease if fulfilment of the arrangement is dependent on the use of that
specified asset. An arrangement conveys the right to use the asset if the arrangement conveys to a lessee the
right to control the use of the underlying asset.
At inception or upon reassessment of the arrangement, the Company separates payments and other
consideration required by such an arrangement into those for the lease and those for other elements on the
basis of their relative fair values. If the Company concludes, for a finance lease, that it is impracticable to
separate the payments reliably, an asset and liability are recognized at an amount equal to the fair value of the
underlying asset. Subsequently, the liability is reduced as payments are made and an imputed finance cost on
the liability is recognized using the Company's incremental borrowing rate.
j. Impairment
i) Non-derivative financial assets
Impairment of financial assets carried at amortized cost is assessed using the lifetime expected credit loss of
the financial asset at initial recognition and throughout the life of the financial asset.
The Company uses a loss allowance matrix determine the impairment loss allowance for trade receivables. In
determining the loss allowance matrix, the Company uses historical trends of the probability of default, timing
of recoveries and the amount of loss incurred, adjusted for management's judgment as to whether current
economic and credit conditions are such that the actual losses are likely to be greater or less than suggested by
historical trends.
Impairment losses are recognized in earnings and reflected as a reduction in the related receivable.
ii) Non-financial assets
The carrying amounts of the Company's non-financial assets, other than inventory, assets arising from
employee benefits and deferred tax assets, are reviewed at each reporting date to determine whether there is
any indication of impairment. If any such indication exists, the asset's recoverable amount is estimated.
For goodwill and intangible assets that have indefinite useful lives or that are not yet available for use, the
recoverable amount is estimated annually in connection with the annual goodwill impairment test. An
impairment loss is recognized if the carrying amount of an asset or its related CGU exceeds its estimated
recoverable amount.
The recoverable amount of an asset or CGU is the greater of its value in use and its fair value less costs to sell.
In assessing value in use, the estimated future cash flows are discounted to their present value using a pre-tax
discount rate that reflects current market assessments of the time value of money and the risks specific to the
asset or CGU. For the purpose of impairment testing, assets that cannot be tested individually are grouped
together into the smallest group of assets that generates cash inflows from continuing use that are largely
independent of the cash inflows of other assets or CGUs. CGUs may incorporate integrated assets from
multiple operating segments. For the purpose of goodwill impairment testing, CGUs are aggregated so that the
level at which impairment testing is performed reflects the lowest level at which goodwill is monitored for
Pembina Pipeline Corporation
74
internal purposes. Goodwill acquired in a business combination is allocated to CGUs or groups of CGUs that are
expected to benefit from the synergies of the combination.
The Company's corporate assets do not generate separate cash inflows and are utilized by more than one CGU.
Corporate assets are allocated to CGUs on a reasonable and consistent basis and tested for impairment as part
of the testing of the CGU to which the corporate asset is allocated. If there is an indication that a corporate
asset may be impaired, then the recoverable amount is determined for the CGU to which the corporate asset
belongs.
Impairment losses are recognized in earnings. An impairment loss is recognized if the carrying amount of an
asset or its CGU exceeds its estimated recoverable amount. Impairment losses recognized in respect of CGUs
are allocated first to reduce the carrying amount of any goodwill allocated to the CGU (group of CGUs), and
then to reduce the carrying amounts of the other assets in the CGU (group of CGUs) on a pro rata basis.
An impairment loss in respect of goodwill is not reversed. In respect of other assets, impairment losses
recognized in prior periods are assessed at each reporting date for any indications that the loss has decreased
or no longer exists. An impairment loss is reversed if there has been a change in the estimates used to
determine the recoverable amount. An impairment loss is reversed only to the extent that the asset's carrying
amount does not exceed the carrying amount that would have been determined, net of depreciation or
amortization, if no impairment loss had been recognized.
Goodwill that forms part of the carrying amount of an investment in equity accounted investee is not
recognized separately, and therefore is not tested for impairment separately. Instead, the entire amount of the
investment is tested for impairment as a single asset when there is objective evidence that the equity
accounted investee may be impaired, unless the equity accounted investee does not generate cash flows that
are largely independent of those from other assets of the entity in which case it is combined in a CGU with the
related assets.
k. Employee benefits
i) Defined contribution plans
A defined contribution plan is a post-employment benefit plan under which an entity pays fixed contributions
into a separate entity and will have no legal or constructive obligation to pay further amounts. Obligations for
contributions to defined contribution pension plans are recognized as an employee benefit expense in
earnings in the periods during which services are rendered by employees. Prepaid contributions are recognized
as an asset to the extent that a cash refund or a reduction in future payments is available. Contributions to a
defined contribution plan due more than twelve months after the end of the period in which the employees
render the service are discounted to their present value.
ii) Defined benefit pension plans
A defined benefit pension plan is a post-employment benefit plan other than a defined contribution plan. The
Company's net obligation in respect of defined benefit pension plans is calculated separately for each plan by
estimating the amount of future benefit that employees have earned in return for their service in the current
and prior periods, discounted to determine its present value, less the fair value of any plan assets. The
discount rate used to determine the present value is established by referencing market yields on high-quality
Pembina Pipeline Corporation
75
corporate bonds on the measurement date with cash flows that match the timing and amount of expected
benefits.
The calculation is performed, at a minimum, every three years by a qualified actuary using the actuarial cost
method. When the calculation results in a benefit to the Company, the recognized asset is limited to the
present value of economic benefits available in the form of future expenses payable from the plan, any future
refunds from the plan or reductions in future contributions to the plan. In order to calculate the present value
of economic benefits, consideration is given to any minimum funding requirements that apply to any plan in
the Company. An economic benefit is available to the Company if it is realizable during the life of the plan or on
settlement of the plan liabilities.
When the benefits of a plan are improved, the portion of the increased benefit relating to past service by
employees is recognized in earnings immediately.
The Company recognizes all actuarial gains and losses arising from defined benefit plans in other
comprehensive income and expenses related to defined benefit plans in personnel expenses in earnings.
The Company recognizes gains or losses on the curtailment or settlement of a defined benefit plan when the
curtailment or settlement occurs. The gain or loss on curtailment comprises any resulting change in the fair
value of plan assets, change in the present value of defined benefit obligation and any related actuarial gains
or losses and past service cost that had not previously been recognized.
iii) Short-term employee benefits
Short-term employee benefit obligations are measured on an undiscounted basis and are expensed as the
related service is provided.
A liability is recognized for the amount expected to be paid under short-term cash bonus if the Company has a
present legal or constructive obligation to pay this amount as a result of past service provided by the
employee, and the obligation can be estimated reliably.
iv) Share-based payment transactions
For equity settled share-based payment plans, the fair value of the share-based payment at grant date is
recognized as an expense, with a corresponding increase in equity, over the period that the employees
unconditionally become entitled to the awards. The amount recognized as an expense is adjusted to reflect the
number of awards for which the related service and non-market vesting conditions are expected to be met,
such that the amount ultimately recognized as an expense is based on the number of awards that meet the
related service conditions at the vesting date.
For cash settled share-based payment plans, the fair value of the amount payable to employees is recognized
as an expense with a corresponding increase in liabilities, over the period that the employees unconditionally
become entitled to payment. The liability is remeasured at each reporting date and at settlement date. Any
changes in the fair value of the liability are recognized as an expense in earnings.
l. Provisions
A provision is recognized if, as a result of a past event, the Company has a present legal or constructive obligation
that can be estimated reliably, and it is probable that an outflow of economic benefits will be required to settle the
Pembina Pipeline Corporation
76
obligation. Provisions are determined by discounting the expected future cash flows at a pre-tax rate that reflects
current market assessments of the time value of money and the risks specific to the liability. Provisions are
remeasured at each reporting date based on the best estimate of the settlement amount. The unwinding of the
discount rate is recognized as accretion in finance costs.
i) Decommissioning obligation
The Company's activities give rise to dismantling, decommissioning and site disturbance remediation activities.
A provision is made for the estimated cost of site restoration and capitalized in the relevant asset category.
Decommissioning obligations are measured at the present value, based on a risk-free rate, of management's
best estimate of expenditure required to settle the obligation at the balance sheet date. Subsequent to the
initial measurement, the obligation is adjusted at the end of each period to reflect the passage of time,
changes in the risk-free rate and changes in the estimated future cash flows underlying the obligation. The
increase in the provision due to the passage of time is recognized as accretion in finance costs whereas
increases or decreases due to changes in the estimated future cash flows or risk-free rate are added to or
deducted from the cost of the related asset.
m. Revenue
Revenue in the course of ordinary activities is measured at the fair value of the consideration received or
receivable. Revenue is recognized when persuasive evidence exists that the significant risks and rewards of
ownership have been transferred to the customer or the service has been provided, recovery of the consideration
is probable, the associated costs can be estimated reliably, there is no continuing management involvement with
the goods, and the amount of revenue can be measured reliably.
The timing of the transfer of significant risks and rewards varies depending on the individual terms of the sales or
service agreement. For product sales, transfer of significant risks and rewards usually occurs when the product is
delivered to a customer. For pipeline transportation revenues, storage revenues and processing revenues, transfer
of significant risks and rewards usually occurs when the service is provided as per the contract with the customer.
For rate or contractually regulated pipeline operations, revenue is recognized in a manner that is consistent with
the underlying rate design as mandated by agreement or regulatory authority.
Certain commodity buy/sell arrangements where the risks and rewards of ownership have not transferred are
recognized on a net basis in earnings.
n. Finance income and finance costs
Finance income comprises interest income on funds deposited and invested, gains on non-commodity-related
derivatives measured at fair value through earnings and foreign exchange gains. Interest income is recognized as it
accrues in earnings, using the effective interest rate method.
Finance costs comprise interest expense on loans and borrowings and convertible debentures, accretion on
provisions, losses on disposal of available for sale financial assets, losses on non-commodity-related derivatives,
impairment losses recognized on financial assets (other than trade and other receivables) and foreign exchange
losses.
Borrowing costs that are not directly attributable to the acquisition or construction of a qualifying asset are
recognized in earnings using the effective interest rate method.

Pembina Pipeline Corporation
77
o. Income tax
Income tax expense comprises current and deferred tax. Current and deferred taxes are recognized in earnings
except to the extent that it relates to a business combination, or items are recognized directly in equity or in other
comprehensive income.
Current tax is the expected tax payable or receivable on the taxable income or loss for the period, using tax rates
enacted or substantively enacted at the reporting date, and any adjustment to tax payable in respect of previous
years.
Deferred tax is recognized in respect of temporary differences between the carrying amounts of assets and
liabilities for financial reporting purposes and the amounts used for taxation purposes. Deferred tax is not
recognized for:
• temporary differences on the initial recognition of assets or liabilities in a transaction that is not a business
combination and that affects neither accounting nor taxable earnings;
• temporary differences relating to investments in subsidiaries and joint arrangements to the extent that it is
probable that they will not reverse in the foreseeable future; and
• taxable temporary differences arising on the initial recognition of goodwill.
The measurement of deferred tax reflects the tax consequences that would follow the manner in which the
Company expects, at the end of the reporting period, to recover or settle the carrying amount of its assets and
liabilities.
Deferred tax is measured at the tax rates that are expected to be applied to temporary differences when they
reverse, based on the laws that have been enacted or substantively enacted by the reporting date.
Deferred tax assets and liabilities are offset if there is a legally enforceable right to offset, and they relate to income
taxes levied by the same tax authority on the same taxable entity, or on different tax entities, but they intend to
settle current tax liabilities and assets on a net basis or their tax assets and liabilities will be realized
simultaneously.
A deferred tax asset is recognized for unused tax losses, tax credits and deductible temporary differences, to the
extent that it is probable that future taxable profits will be available against which they can be utilized. Deferred tax
assets are reviewed at each reporting date and are reduced to the extent that it is no longer probable that the
related tax benefit will be realized.
In determining the amount of current and deferred tax, the Company takes into account income tax exposures and
whether additional taxes and interest may be due. This assessment relies on estimates and assumptions and may
involve a series of judgments about future events. New information may become available that causes the
Company to change its judgment regarding the adequacy of existing tax liabilities, such changes to tax liabilities will
impact tax expense in the period that such a determination is made.
p. Earnings per common share
The Company presents basic and diluted earnings per common share ("EPS") data for its common shares. Basic EPS
is calculated by dividing the earnings attributable to common shareholders of the Company by the weighted
average number of common shares outstanding during the period. To calculate earnings attributable to common
Pembina Pipeline Corporation
78
shareholders, earnings are adjusted for accumulated preferred dividends. Diluted EPS is determined by adjusting
the earnings attributable to common shareholders and the weighted average number of common shares
outstanding, for the effects of all potentially dilutive common shares, which comprise convertible debentures and
share options granted to employees ("Convertible Instruments"). Only outstanding and Convertible Instruments
that will have a dilutive effect are included in fully diluted calculations.
The dilutive effect of Convertible Instruments is determined whereby outstanding Convertible Instruments at the
end of the period are assumed to have been converted at the beginning of the period or at the time issued if issued
during the year. Amounts charged to earnings relating to the outstanding Convertible Instruments are added back
to earnings for the diluted calculations. The shares issued upon conversion are included in the denominator of per
share basic calculations for the date of issue.
q. Segment reporting
An operating segment is a component of the Company that engages in business activities from which it may earn
revenues and incur expenses, including revenues and expenses that relate to transactions with any of the
Company's other components. All operating segments' operating results are reviewed regularly by the Company's
Chief Executive Officer ("CEO"), Chief Financial Officer ("CFO") and other Senior Vice Presidents ("SVPs") to make
decisions about resources to be allocated to the segment and assess its performance, and for which discrete
financial information is available.
Segment results that are reported to the CEO, CFO and other SVPs include items directly attributable to a segment
as well as those that can be allocated on a reasonable basis. Unallocated items comprise mainly corporate assets,
corporate general and administrative expenses, finance income and costs, and income tax assets and liabilities.
r. New standards and interpretations not yet adopted
Certain new standards, interpretations, amendments and improvements to existing standards were issued by the
IASB or IFRIC and are effective for accounting periods beginning after January 1, 2017. These standards have not
been applied in preparing these Financial Statements. Those which may be relevant to Pembina are described
below:
IFRS 15 Revenue from Contracts with Customers
In May 2014, the International Accounting Standards Board issued IFRS 15 Revenue from contracts with customers,
which supersedes existing revenue guidance, effective for periods beginning on or after January 1, 2018. IFRS 15
contains a single model that applies to contracts with customers and two approaches to recognizing revenue: at a
point in time or over time. The model outlines a five step analysis to assess contracts which involves identifying the
contract, identifying the performance obligations, determining the transaction price, allocating the transaction
price to the performance obligations and recognizing revenue when or as the entity satisfies a performance
obligation. Detailed guidance is also provided on a number of areas for which there was no previous guidance,
including contract costs and contract modifications. In April 2016, the IASB issued Clarifications to IFRS 15, Revenue
from Contracts with Customers, which is effective at the same time as IFRS 15, and provides additional guidance on
the five step analysis and transition.
The Company is on track to adopt IFRS 15 and the clarifications on the January 1, 2018 effective date. On transition,
the standard permits either a full retrospective approach with restatement of all prior periods presented or a
modified retrospective approach where the cumulative effect of initially applying the new standard is recognized as

Pembina Pipeline Corporation
79
an adjustment to opening retained earnings in the period of adoption. The Company has tentatively decided to
adopt IFRS 15 using the full retrospective approach.
The Company has completed a detailed implementation plan, identified revenue streams and major contract types.
Within each identified revenue stream, the Company has substantively reviewed and analyzed the revenue
contracts in accordance with the five steps. The Company has also assessed the impact of the new standard on its
systems and processes.
Based on the assessments completed to date, the Company has determined that the application of the new
standard will result in a change to the timing and pattern of revenue recognition, specifically with respect to certain
long term Take or Pay ("ToP)" revenue contracts with make-up rights in our Conventional Pipelines and Gas Services
businesses. The change in timing of revenue recognition for ToP revenue contracts will be a result of revenues
being recognized based on the volumes flowed or processed rather than when the service capacity is provided for
long term ToP contracts with make-up rights. Under long term ToP contracts, customers are committed to meet
minimum volume or revenue commitments. Make-up rights arise when a customer does not meet its minimum
ToP volume or revenue commitment in a certain period, but is contractually permitted to use future volumes or
revenues to meet past ToP commitments. These make-up rights are subject to expiry and have varying conditions
associated with them. Depending on the specific conditions and terms of the make-up rights, revenue recognition
may be deferred early in a contract year when certain make-up rights are outstanding and recognized later in the
contract year once these make-up rights are used, expire, or it is determined to be remote that a customer will use
them. While this change is not expected to have a material impact on annual revenue, it is expected to result in a
change in timing for quarterly revenue recognition (i.e. potentially lower revenue in the first and second quarters
with higher revenue in the third and fourth quarters). There will be no impact on the timing of cash flow.
In addition, IFRS 15 will result in significant changes to disclosures based on the additional requirements outlined in
the standard. These disclosures include the identification of significant judgments that have been made in applying
the standard, information on changes to contract assets and liabilities, and details regarding how the Company
recognizes revenue including performance obligations identified, determination of transaction price, and how the
transaction price has been allocated to performance obligations. IFRS 15 also requires the disclosure of the amount
of the transaction price that has been allocated to remaining unsatisfied performance obligations. This disclosure
will primarily impact long-term contracts with ToP contract terms.
The Company has determined that there will be no material impact on existing systems on implementation of IFRS
15, however, new processes and controls are being designed and will be implemented as needed with respect to
revenue recognition for impacted ToP contracts and to meet disclosure requirements.
IFRS 16 Leases
IFRS 16 Leases is effective for annual periods beginning on or after January 1, 2019. The new standard results
in substantially all lessee leases being recorded on the statement of financial position.
The Company intends to adopt IFRS 16 for the annual period beginning on January 1, 2019. The Company is
currently evaluating the impact that the standard will have on its results of operations and financial position.
5. DETERMINATION OF FAIR VALUES
A number of the Company's accounting policies and disclosures require the determination of fair value, for both
financial and non-financial assets and liabilities. Fair values have been determined for measurement and/or

Pembina Pipeline Corporation
80
disclosure purposes based on the following methods. When applicable, further information about the assumptions
made in determining fair values is disclosed in the notes specific to that asset or liability.
i) Property, plant and equipment
The fair value of property, plant and equipment recognized as a result of a business combination or transferred
from a customer is based on market values when available, income approach and depreciated replacement cost
when appropriate. Depreciated replacement cost reflects adjustments for physical deterioration as well as
functional and economic obsolescence.
ii) Intangible assets
The fair value of intangible assets acquired in a business combination is determined by an active market value or
using the multi-period excess earnings method, whereby the subject asset is valued after deducting a fair return on
all other assets that are part of creating the related cash flows.
The fair value of other intangible assets is based on the discounted cash flows expected to be derived from the use
and eventual sale of the assets.
iii) Derivatives
Fair value of derivatives are estimated by reference to independent monthly forward prices, interest rate yield
curves, currency rates and quoted market prices per share at the period ends.
Fair values reflect the credit risk of the instrument and include adjustments to take account of the credit risk of the
company, entity and counterparty when appropriate.
iv) Non-derivative financial assets and liabilities
Fair value, which is determined for disclosure purposes, is calculated based on the present value of estimated
future principal and interest cash flows, discounted at the market rate of interest at the reporting date. In respect
of the convertible debentures, the fair value is determined by the market price of the convertible debenture on the
reporting date. For finance leases, the market rate of interest is determined by reference to similar lease
agreements. For other financial liabilities where market rates are not readily available, a risk adjusted market rate is
used which incorporates the nature of the instrument as well as the risk associated with the underlying cash
payments.
v) Share-based compensation transactions
The fair value of employee share options is measured using the Black-Scholes formula on grant date. Measurement
inputs include share price on measurement date, exercise price of the instrument, expected volatility (based on
weighted average historic volatility adjusted for changes expected due to publicly available information), weighted
average expected life of the instruments (based on historical experience and general option holder behaviour),
expected dividends, expected forfeitures and the risk-free interest rate (based on government bonds). Service and
non-market performance conditions attached to the transactions are not taken into account in determining fair
value.
The fair value of the long-term share unit award incentive plan and associated distribution units are measured
based on the volume-weighted average price for 20 days ending at the reporting date of the Company's shares.
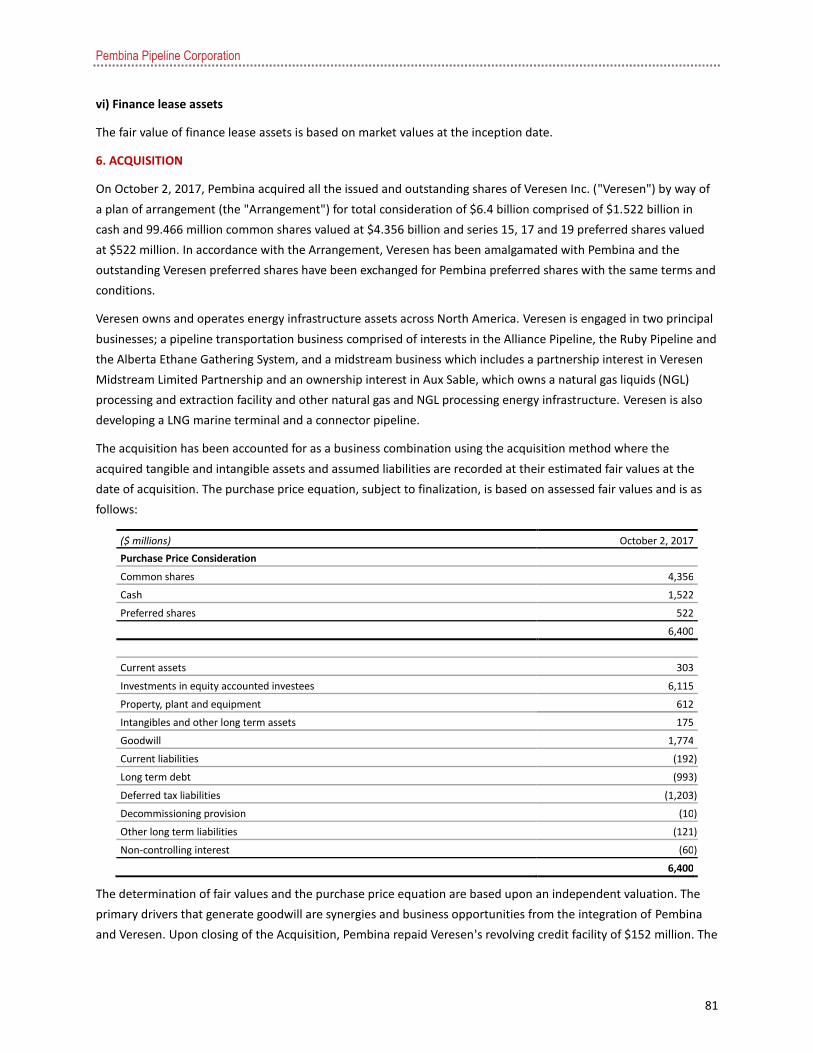
Pembina Pipeline Corporation
81
vi) Finance lease assets
The fair value of finance lease assets is based on market values at the inception date.
6. ACQUISITION
On October 2, 2017, Pembina acquired all the issued and outstanding shares of Veresen Inc. ("Veresen") by way of
a plan of arrangement (the "Arrangement") for total consideration of $6.4 billion comprised of $1.522 billion in
cash and 99.466 million common shares valued at $4.356 billion and series 15, 17 and 19 preferred shares valued
at $522 million. In accordance with the Arrangement, Veresen has been amalgamated with Pembina and the
outstanding Veresen preferred shares have been exchanged for Pembina preferred shares with the same terms and
conditions.
Veresen owns and operates energy infrastructure assets across North America. Veresen is engaged in two principal
businesses; a pipeline transportation business comprised of interests in the Alliance Pipeline, the Ruby Pipeline and
the Alberta Ethane Gathering System, and a midstream business which includes a partnership interest in Veresen
Midstream Limited Partnership and an ownership interest in Aux Sable, which owns a natural gas liquids (NGL)
processing and extraction facility and other natural gas and NGL processing energy infrastructure. Veresen is also
developing a LNG marine terminal and a connector pipeline.
The acquisition has been accounted for as a business combination using the acquisition method where the
acquired tangible and intangible assets and assumed liabilities are recorded at their estimated fair values at the
date of acquisition. The purchase price equation, subject to finalization, is based on assessed fair values and is as
follows:
($ millions) October 2, 2017
Purchase Price Consideration
Common shares 4,356
Cash 1,522
Preferred shares 522
6,400
Current assets 303
Investments in equity accounted investees 6,115
Property, plant and equipment 612
Intangibles and other long term assets 175
Goodwill 1,774
Current liabilities (192 )
Long term debt (993 )
Deferred tax liabilities (1,203 )
Decommissioning provision (10 )
Other long term liabilities (121 )
Non-controlling interest (60 )
6,400
The determination of fair values and the purchase price equation are based upon an independent valuation. The
primary drivers that generate goodwill are synergies and business opportunities from the integration of Pembina
and Veresen. Upon closing of the Acquisition, Pembina repaid Veresen's revolving credit facility of $152 million. The

Pembina Pipeline Corporation
82
recognition of goodwill is not expected to be deductible for tax purposes. The Company has recognized $25 million
in acquisition-related expenses. All acquisition-related expenses have been expensed as incurred and are included
in other expenses in the Statement of Earnings and Comprehensive Income.
Revenue generated by the Veresen business for the period from the Acquisition date of October 2, 2017 to
December 31, 2017 was $15 million. Net earnings for the same period were $111 million. If the acquisition had
occurred on January 1, 2017, management estimates that consolidated revenue would have increased an
additional $44 million and consolidated gross profit for the year would have increased an additional $247 million.
In determining these amounts, management has assumed that the fair value adjustments that arose on the date of
acquisition would have been the same if the acquisition had occurred on January 1, 2017.
The accounting for the acquisition will be further revised as the Company finalizes interpretations of contracts, long
term liabilities and commitments outstanding on the date of acquisition.
7. TRADE RECEIVABLES AND OTHER
As at December 31 ($ millions) 2017 2016
Trade receivables from customers 178 162
Other receivables 335 274
Prepayments 17 16
Allowance for doubtful accounts (1 ) (1 )
Total trade receivables and other 529 451
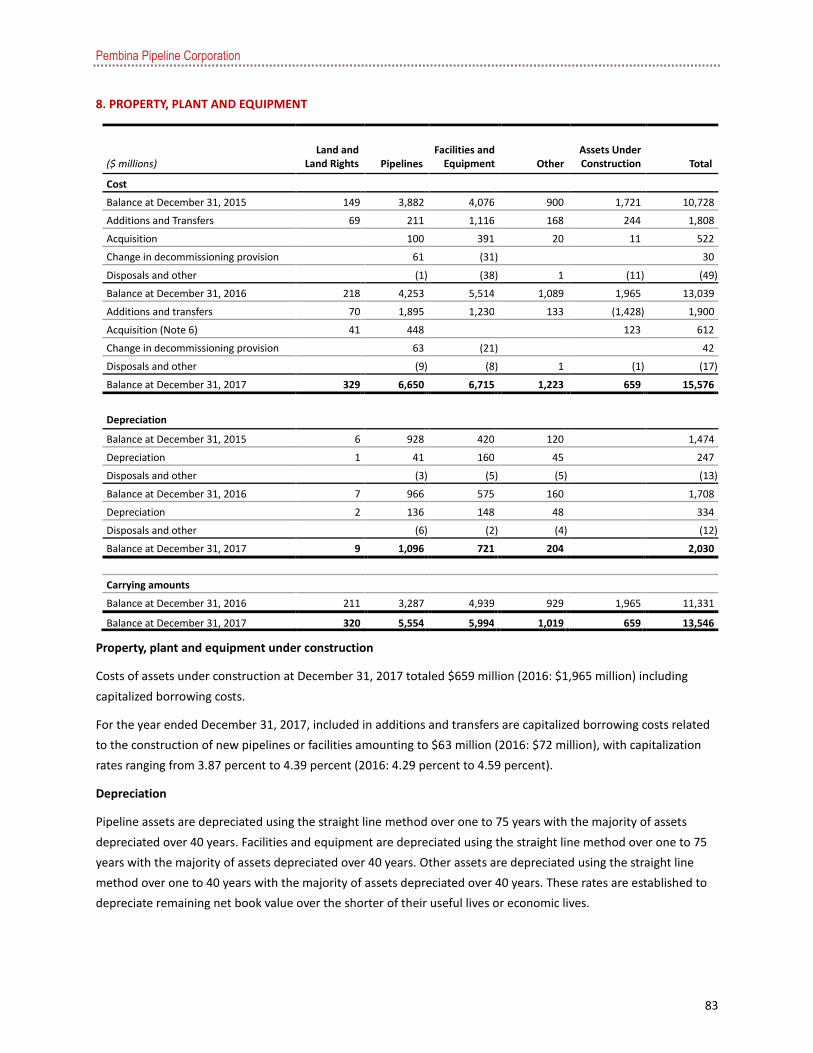
Pembina Pipeline Corporation
83
8. PROPERTY, PLANT AND EQUIPMENT
($ millions) Land and
Land Rights Pipelines Facilities and
Equipment Other Assets Under Construction Total
Cost
Balance at December 31, 2015 149 3,882 4,076 900 1,721 10,728
Additions and Transfers 69 211 1,116 168 244 1,808
Acquisition 100 391 20 11 522
Change in decommissioning provision 61 (31 ) 30
Disposals and other (1 ) (38 ) 1 (11 ) (49 )
Balance at December 31, 2016 218 4,253 5,514 1,089 1,965 13,039
Additions and transfers 70 1,895 1,230 133 (1,428 ) 1,900
Acquisition (Note 6) 41 448 123 612
Change in decommissioning provision 63 (21 ) 42
Disposals and other (9 ) (8 ) 1 (1 ) (17 )
Balance at December 31, 2017 329 6,650 6,715 1,223 659 15,576
Depreciation
Balance at December 31, 2015 6 928 420 120 1,474
Depreciation 1 41 160 45 247
Disposals and other (3 ) (5 ) (5 ) (13 )
Balance at December 31, 2016 7 966 575 160 1,708
Depreciation 2 136 148 48 334
Disposals and other (6 ) (2 ) (4 ) (12 )
Balance at December 31, 2017 9 1,096 721 204 2,030
Carrying amounts
Balance at December 31, 2016 211 3,287 4,939 929 1,965 11,331
Balance at December 31, 2017 320 5,554 5,994 1,019 659 13,546
Property, plant and equipment under construction
Costs of assets under construction at December 31, 2017 totaled $659 million (2016: $1,965 million) including
capitalized borrowing costs.
For the year ended December 31, 2017, included in additions and transfers are capitalized borrowing costs related
to the construction of new pipelines or facilities amounting to $63 million (2016: $72 million), with capitalization
rates ranging from 3.87 percent to 4.39 percent (2016: 4.29 percent to 4.59 percent).
Depreciation
Pipeline assets are depreciated using the straight line method over one to 75 years with the majority of assets
depreciated over 40 years. Facilities and equipment are depreciated using the straight line method over one to 75
years with the majority of assets depreciated over 40 years. Other assets are depreciated using the straight line
method over one to 40 years with the majority of assets depreciated over 40 years. These rates are established to
depreciate remaining net book value over the shorter of their useful lives or economic lives.
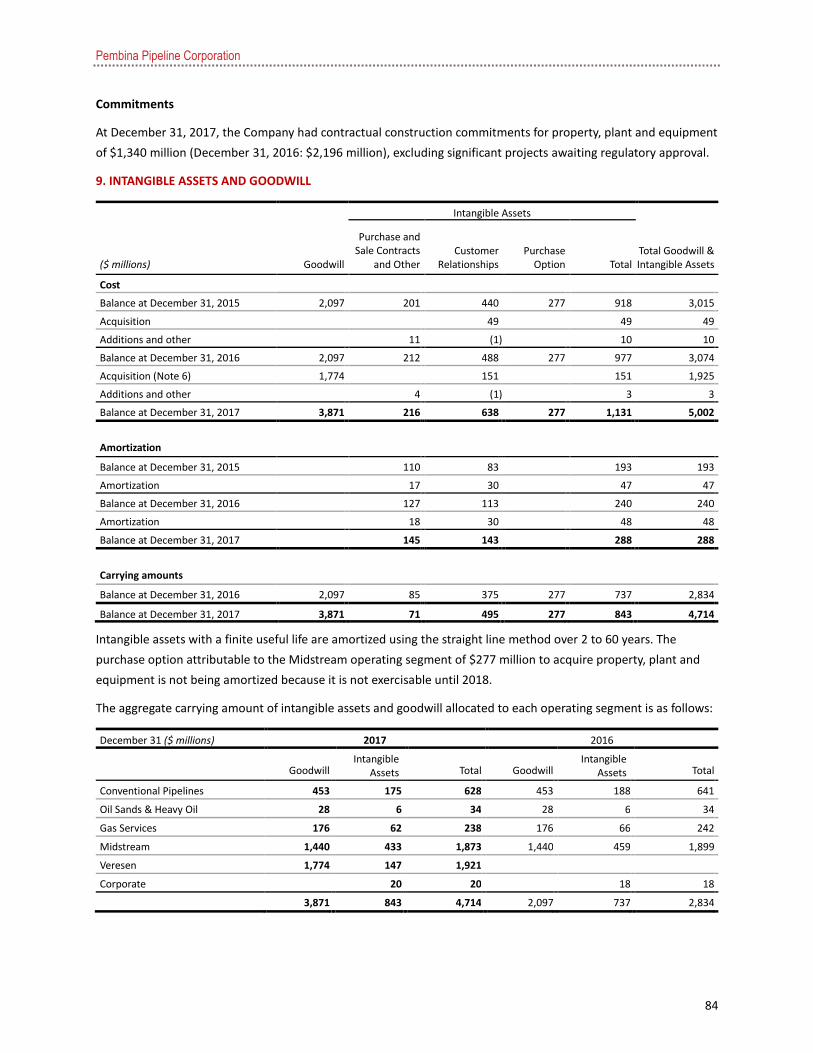
Pembina Pipeline Corporation
84
Commitments
At December 31, 2017, the Company had contractual construction commitments for property, plant and equipment
of $1,340 million (December 31, 2016: $2,196 million), excluding significant projects awaiting regulatory approval.
9. INTANGIBLE ASSETS AND GOODWILL
Intangible Assets
($ millions) Goodwill
Purchase and Sale Contracts
and Other Customer
Relationships Purchase
Option Total Total Goodwill & Intangible Assets
Cost
Balance at December 31, 2015 2,097 201 440 277 918 3,015
Acquisition 49 49 49
Additions and other 11 (1 ) 10 10
Balance at December 31, 2016 2,097 212 488 277 977 3,074
Acquisition (Note 6) 1,774 151 151 1,925
Additions and other 4 (1 ) 3 3
Balance at December 31, 2017 3,871 216 638 277 1,131 5,002
Amortization
Balance at December 31, 2015 110 83 193 193
Amortization 17 30 47 47
Balance at December 31, 2016 127 113 240 240
Amortization 18 30 48 48
Balance at December 31, 2017 145 143 288 288
Carrying amounts
Balance at December 31, 2016 2,097 85 375 277 737 2,834
Balance at December 31, 2017 3,871 71 495 277 843 4,714
Intangible assets with a finite useful life are amortized using the straight line method over 2 to 60 years. The
purchase option attributable to the Midstream operating segment of $277 million to acquire property, plant and
equipment is not being amortized because it is not exercisable until 2018.
The aggregate carrying amount of intangible assets and goodwill allocated to each operating segment is as follows:
December 31 ($ millions) 2017 2016
Goodwill Intangible
Assets Total Goodwill Intangible
Assets Total
Conventional Pipelines 453 175 628 453 188 641
Oil Sands & Heavy Oil 28 6 34 28 6 34
Gas Services 176 62 238 176 66 242
Midstream 1,440 433 1,873 1,440 459 1,899
Veresen 1,774 147 1,921
Corporate 20 20 18 18
3,871 843 4,714 2,097 737 2,834

Pembina Pipeline Corporation
85
Goodwill Impairment Testing
For the purpose of impairment testing, goodwill is allocated to the Company's operating segments which
represents the lowest level within the Company at which the goodwill is monitored for management purposes.
During the fourth quarter, impairment testing for goodwill was performed as at October 1, 2017, other than in
respect of goodwill acquired in the Acquisition (Note 6) on October 2, 2017 given its recent proximity to our annual
testing date. The recoverable amounts were based on their value in use and were determined to be higher than
their carrying amounts.
The recoverable amount was determined using the value-in-use model by discounting the future cash flows
generated from the continuing use of each operating segment. The calculation of the value in use is based on the
following key assumptions:
• Cash flows are projected based on past experience, actual operating results and four years (2016: four
years) of the business plan approved by management;
• Long-term growth: cash flows for periods up to 75 years (2016: 75 years) were extrapolated using a
constant medium-term inflation rate, except where contracted, long-term cash flows indicated that no
inflation should be applied or a specific reduction in cash flows was more appropriate; and
• Pre-tax discount rates were applied in determining the recoverable amount of operating segments.
Discount rates were estimated based on past experience, the risk free rate and average cost of debt,
targeted debt to equity ratio, in addition to estimates of the specific operating segment's equity risk
premium, size premium, small capitalization premium, projection risk, betas and tax rate.
The following summarizes the key assumptions used in the impairment test:
Operating Segments
2017 (percent) Conventional
Pipelines Oil Sands &
Heavy Oil Gas
Services Midstream
Pre-tax discount rate 7.68 7.81 7.17 8.20
Adjusted inflation rate 1.48 0.81 1.25 1.80
Incremental increase in discount rate that would result in carrying value equal to recoverable amount
Increase in pre-tax discount rate 8.39 2.09 3.94 2.30
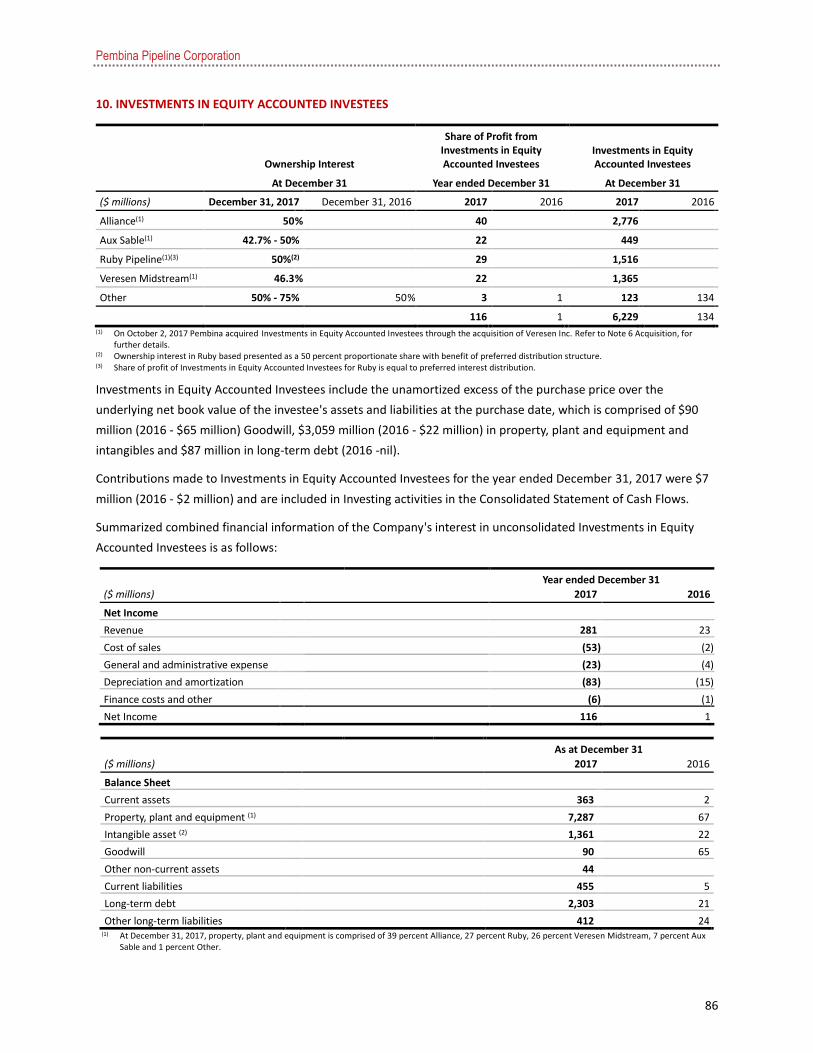
Pembina Pipeline Corporation
86
10. INVESTMENTS IN EQUITY ACCOUNTED INVESTEES
Ownership Interest
Share of Profit from Investments in Equity Accounted Investees
Investments in Equity Accounted Investees
At December 31 Year ended December 31 At December 31
($ millions) December 31, 2017 December 31, 2016 2017 2016 2017 2016
Alliance(1) 50 % 40 2,776
Aux Sable(1) 42.7% - 50% 22 449
Ruby Pipeline(1)(3) 50%(2) 29 1,516
Veresen Midstream(1) 46.3 % 22 1,365
Other 50% - 75% 50 % 3 1 123 134
116 1 6,229 134 (1) On October 2, 2017 Pembina acquired Investments in Equity Accounted Investees through the acquisition of Veresen Inc. Refer to Note 6 Acquisition, for
further details.
(2) Ownership interest in Ruby based presented as a 50 percent proportionate share with benefit of preferred distribution structure.
(3) Share of profit of Investments in Equity Accounted Investees for Ruby is equal to preferred interest distribution.
Investments in Equity Accounted Investees include the unamortized excess of the purchase price over the
underlying net book value of the investee's assets and liabilities at the purchase date, which is comprised of $90
million (2016 - $65 million) Goodwill, $3,059 million (2016 - $22 million) in property, plant and equipment and
intangibles and $87 million in long-term debt (2016 -nil).
Contributions made to Investments in Equity Accounted Investees for the year ended December 31, 2017 were $7
million (2016 - $2 million) and are included in Investing activities in the Consolidated Statement of Cash Flows.
Summarized combined financial information of the Company's interest in unconsolidated Investments in Equity
Accounted Investees is as follows:
Year ended December 31
($ millions) 2017 2016
Net Income
Revenue 281 23
Cost of sales (53 ) (2 )
General and administrative expense (23 ) (4 )
Depreciation and amortization (83 ) (15 )
Finance costs and other (6 ) (1 )
Net Income 116 1
As at December 31
($ millions) 2017 2016
Balance Sheet
Current assets 363 2
Property, plant and equipment (1) 7,287 67
Intangible asset (2) 1,361 22
Goodwill 90 65
Other non-current assets 44
Current liabilities 455 5
Long-term debt 2,303 21
Other long-term liabilities 412 24 (1) At December 31, 2017, property, plant and equipment is comprised of 39 percent Alliance, 27 percent Ruby, 26 percent Veresen Midstream, 7 percent Aux
Sable and 1 percent Other.

Pembina Pipeline Corporation
87
(2) At December 31, 2017, intangible assets is comprised of 53 percent Alliance and 45 percent Veresen Midstream, 1 percent Aux Sable and 1 percent Other.
Commitments
The Company has a contractual commitment to advance $127 million (US$102 million) to Ruby Pipeline Holding
Company L.L.C. by March 31, 2018.
11. INCOME TAXES
The movements of the components of the deferred tax assets and deferred tax liabilities are as follows:
($ millions)
Balance at December 31,
2016 Recognized in
Earnings
Recognized in Other Comprehensive
Income Acquisition Equity Other
Balance at December 31,
2017
Deferred income tax assets
Derivative financial instruments 20
(9 ) 11
Employee benefits 8 (1) 7
Share-based payments 12
9
21
Provisions 133 12 8 153
Benefit of loss carryforwards 90
(57 ) 137 10 180
Other deductible temporary differences
41
12 11 (3 ) (5 ) 56
Deferred income tax liabilities
Property, plant and equipment (1,193 ) (243 ) 75
(1,361 )
Intangible assets (150 ) (6 ) (42 ) (198 )
Investments in equity accounted investees (6 ) 190
(1,357 ) (1,173 )
Taxable limited partnership income deferral (25 ) 4
(35) (56 )
Other taxable temporary differences (10 ) (6 ) (16 )
Total deferred tax liabilities (1,080 ) (94 ) (1 ) (1,203 ) (3 ) 5
(2,376 )
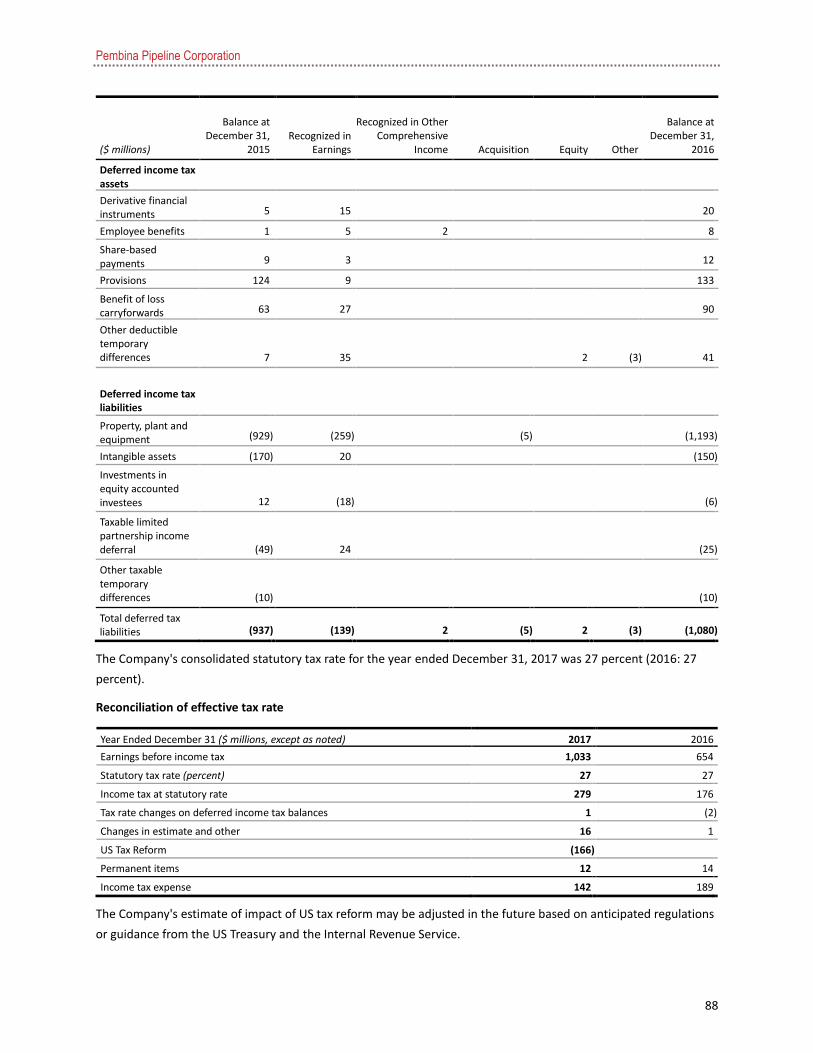
Pembina Pipeline Corporation
88
($ millions)
Balance at December 31,
2015 Recognized in
Earnings
Recognized in Other Comprehensive
Income Acquisition Equity Other
Balance at December 31,
2016
Deferred income tax assets
Derivative financial instruments 5
15
20
Employee benefits 1 5 2 8
Share-based payments 9
3
12
Provisions 124 9 133
Benefit of loss carryforwards 63
27
90
Other deductible temporary differences 7
35
2
(3 ) 41
Deferred income tax liabilities
Property, plant and equipment (929 ) (259 ) (5 ) (1,193 )
Intangible assets (170 ) 20 (150 )
Investments in equity accounted investees 12
(18 ) (6 )
Taxable limited partnership income deferral (49 ) 24
(25 )
Other taxable temporary differences (10 ) (10 )
Total deferred tax liabilities (937 ) (139 ) 2
(5 ) 2
(3 ) (1,080 )
The Company's consolidated statutory tax rate for the year ended December 31, 2017 was 27 percent (2016: 27
percent).
Reconciliation of effective tax rate
Year Ended December 31 ($ millions, except as noted) 2017 2016
Earnings before income tax 1,033 654
Statutory tax rate (percent) 27 27
Income tax at statutory rate 279 176
Tax rate changes on deferred income tax balances 1 (2 )
Changes in estimate and other 16 1
US Tax Reform (166 )
Permanent items 12 14
Income tax expense 142 189
The Company's estimate of impact of US tax reform may be adjusted in the future based on anticipated regulations
or guidance from the US Treasury and the Internal Revenue Service.

Pembina Pipeline Corporation
89
Income tax expense
Year Ended December 31 ($ millions) 2017 2016
Current tax expense 48 50
Deferred tax expense
Origination and reversal of temporary differences 286 168
Tax rate changes on deferred tax balances (191 ) (2 )
(Increase) / Decrease in tax loss carry forward (1 ) (27 )
Total deferred tax expense 94 139
Total income tax expense 142 189
Deferred tax items recovered directly in equity
Year Ended December 31 ($ millions) 2017 2016
Share issue costs (3 ) 2
Other comprehensive income/ (loss) (1 ) 2
Deferred tax items recovered directly in equity (4 ) 4
The Company has temporary differences associated with its investments in subsidiaries and interests in joint
arrangements. At December 31, 2017, the Company has not recorded a deferred tax asset or liability for these
temporary differences (December 31, 2016: nil) as the Company controls the timing of the reversal and it is not
probable that the temporary differences will reverse in the foreseeable future.
At December 31, 2017, the Company had US$261 million (December 31, 2016: US$68 million) of U.S. tax losses
that will expire after 2030, and $394 million (December 31, 2016: $205 million) of Canadian tax losses that will
expire after 2035. The Company has determined that it is probable that future taxable profits will be sufficient to
utilize these losses.
12. TRADE PAYABLES AND ACCRUED LIABILITIES
As at December 31 ($ millions) 2017 2016
Trade payables 465 475
Other payables & accrued liabilities 248 163
Total current trade and accrued liabilities 713 638

Pembina Pipeline Corporation
90
13. LOANS AND BORROWINGS
This note provides information about the contractual terms of the Company's interest-bearing loans and
borrowings, which are measured at amortized cost.
Carrying value, terms and conditions, and debt maturity schedule
Carrying value
($ millions)
Authorized at December 31,
2017
Nominal interest rate
Year of maturity
December 31, 2017
December 31, 2016
Operating facility(1) 20
prime + 0.45 or BA(2) / LIBOR
+ 1.45 2018(3)
Revolving unsecured credit facility(1) 2,500
prime + 0.45 or BA(2) / LIBOR
+ 1.45 2020 1,778 353
Senior unsecured notes – series C 200 5.58 2021 199 199
Senior unsecured notes – series D 267 5.91 2019 266 266
Alberta Ethane Gathering System LP senior notes 73 5.565 2020 77
Senior unsecured medium-term notes series 1 250 4.89 2021 249 249
Senior unsecured medium-term notes series 2 450 3.77 2022 449 449
Senior unsecured medium-term notes series 3 450 4.75 2043 446 446
Senior unsecured medium-term notes series 4 600 4.81 2044 596 596
Senior unsecured medium-term notes series 5 450 3.54 2025 448 448
Senior unsecured medium-term notes series 6 500 4.24 2027 498 497
Senior unsecured medium-term notes series 7 500 3.71 2026 497 497
Senior unsecured medium-term notes series 8 650 2.99 2024 645
Senior unsecured medium-term notes series 9 550 4.74 2047 541
Senior unsecured medium-term notes 1A 150 4.00 2018 152
Senior unsecured medium-term notes 3A 50 5.05 2022 52
Senior unsecured medium-term notes 4A 200 3.06 2019 207
Senior unsecured medium-term notes 5A 350 3.43 2021 354
Finance lease liabilities and other 9 8
Total interest bearing liabilities 8,210 7,463 4,008
Less current portion (163) (6)
Total non-current 7,300 4,002 (1) The nominal interest rate is based on the Company's credit rating at December 31, 2017.
(2) Bankers' Acceptance.
(3) Operating facility expected to be renewed on an annual basis.
On January 20, 2017, Pembina closed an offering of $300 million of senior unsecured Series 8 medium-term notes
(the "Series 8 Notes"). The Series 8 Notes have a fixed coupon of 2.99 percent per annum, paid semi-annually, and
mature on January 22, 2024. Simultaneously, Pembina closed an offering of $300 million of senior unsecured Series
9 medium-term notes (the "Series 9 Notes"). The Series 9 Notes have a fixed coupon of 4.74 percent per annum,
paid semi-annually, and mature on January 21, 2047.
On August 16, 2017, Pembina closed an offering of $600 million of senior unsecured medium-term notes. The
offering was conducted in two tranches consisting of $350 million principal amount through the re-opening of
Pembina's Series 8 Notes and $250 million through the re-opening of Pembina's Series 9 Notes.

Pembina Pipeline Corporation
91
In conjunction with the closing of the Acquisition on October 2, 2017, Pembina and Veresen undertook an
amalgamation under the Alberta Business Corporations Act. As a result, Pembina assumed all obligations related to
the senior unsecured medium-term notes 1A, 3A, 4A and 5A, and, indirectly, the Alberta Ethane Gathering System
L.P. senior notes.
All facilities are governed by specific debt covenants which Pembina was in compliance with at December 31, 2017
(December 31, 2016: in compliance).
For more information about the Company's exposure to interest rate, foreign currency and liquidity risk, see
financial instruments and financial risk management Note 24.
14. CONVERTIBLE DEBENTURES
($ millions, except as noted) Series F – 5.75%
Conversion price (dollars per share) $ 29.53
Interest payable semi-annually in arrears on: June 30 and December 31
Maturity Date December 31, 2018
Balance at December 31, 2015 143
Conversions and redemptions (2 )
Unwinding of discount rate 1
Deferred financing fee (net of amortization) 1
Balance at December 31, 2016 143
Conversions (52 )
Unwinding of discount rate 1
Deferred financing fee (net of amortization) 1
Balance at December 31, 2017 93
The Series F debentures may be converted at the option of the holder at a conversion price of $29.53 per common
share at any time prior to maturity and may be in whole or in part at the option of the Company at a price equal to
their principal amount plus accrued and unpaid interest. Any accrued unpaid interest will be paid in cash.
The Company retains a cash conversion option on the Series F convertible debentures, allowing the Company to
pay cash to the converting holder of the debentures, at the option of the Company. The cash conversion feature is
recognized as an embedded derivative and accounted for as a derivative financial instrument, measured at fair
value using an option pricing model.
15. DECOMMISSIONING PROVISION
($ millions) 2017 2016
Balance as at January 1 496 462
Unwinding of discount rate 12 10
Change in rates 43 (73)
Acquisition 10 Additions 33 55
Change in estimates and other (43 ) 42 Total 551 496
Less current portion (included in accrued liabilities) (5 ) (8 )
Balance as at December 31 546 488
Pembina Pipeline Corporation
92
The decommissioning provision reflects the discounted cash flows expected to be incurred to decommission the
Company's pipeline systems, gas processing and fractionation plants, and storage and terminalling hubs. The
estimated economic lives of assets covered by the decommissioning provision range from 1 to 75 years, with the
majority of assets having an economic life of 40 years. The estimated economic lives of the underlying assets are
used to determine the undiscounted cash flows at the time of decommissioning and are also reflective of the
expected timing of economic outflows relating to the provision.
The Company applied a 1.8 percent inflation rate per annum (December 31, 2016: 1.8 percent) and a risk-free rate
of 2.3 percent (December 31, 2016: 2.3 percent) to calculate the present value of the decommissioning provision.
The change in rates of $43 million is the result of the recalculation of the Veresen decommissioning provision using
the above risk free rate compared to the valuation of the provision at acquisition using a risk adjusted rate.
Changes in the measurement of the decommissioning provision are added to, or deducted from, the cost of the
related asset in property, plant and equipment. When a re-measurement reduction of the decommissioning
provision is in excess of the carrying amount of the related asset, the amount is credited to depreciation expense.
For the year ended December 31, 2017, $4 million was credited to depreciation expense (December 31, 2016 - nil).
16. SHARE CAPITAL
Pembina is authorized to issue an unlimited number of common shares, a number of a class of Class A Preferred
Shares, issuable in series, not to exceed twenty percent of the number of issued and outstanding Common Shares
at the time of issuance of any Class A Preferred Shares and an unlimited number of Class B Preferred Shares. The
holders of the common shares are entitled to receive notice of, attend and vote at any meeting of the shareholders
of the Company, receive dividends declared and share in the remaining property of the Company upon distribution
of the assets of the Company among its shareholders for the purpose of winding-up its affairs.
Pembina has adopted a shareholder rights plan ("Plan") as a mechanism designed to assist the board in ensuring
the fair and equal treatment of all shareholders in the face of an actual or contemplated unsolicited bid to take
control of the Company. Take-over bids may be structured in such a way as to be coercive or discriminatory in
effect, or may be initiated at a time when it will be difficult for the board to prepare an adequate response. Such
offers may result in shareholders receiving unequal or unfair treatment, or not realizing the full or maximum value
of their investment in Pembina. The Plan discourages the making of any such offers by creating the potential of
significant dilution to any offeror who does so. The Plan was reconfirmed at Pembina's 2016 meeting of
Shareholders and must be reconfirmed at every third annual meeting thereafter. Accordingly, the Plan, with such
amendments as the Board of Directors determines to be necessary or advisable, and as may otherwise be required
by law, is expected to be placed before Shareholders for approval at Pembina's 2019 annual meeting. A copy of the
agreement relating to the current Plan has been filed on Pembina's SEDAR and EDGAR profiles.
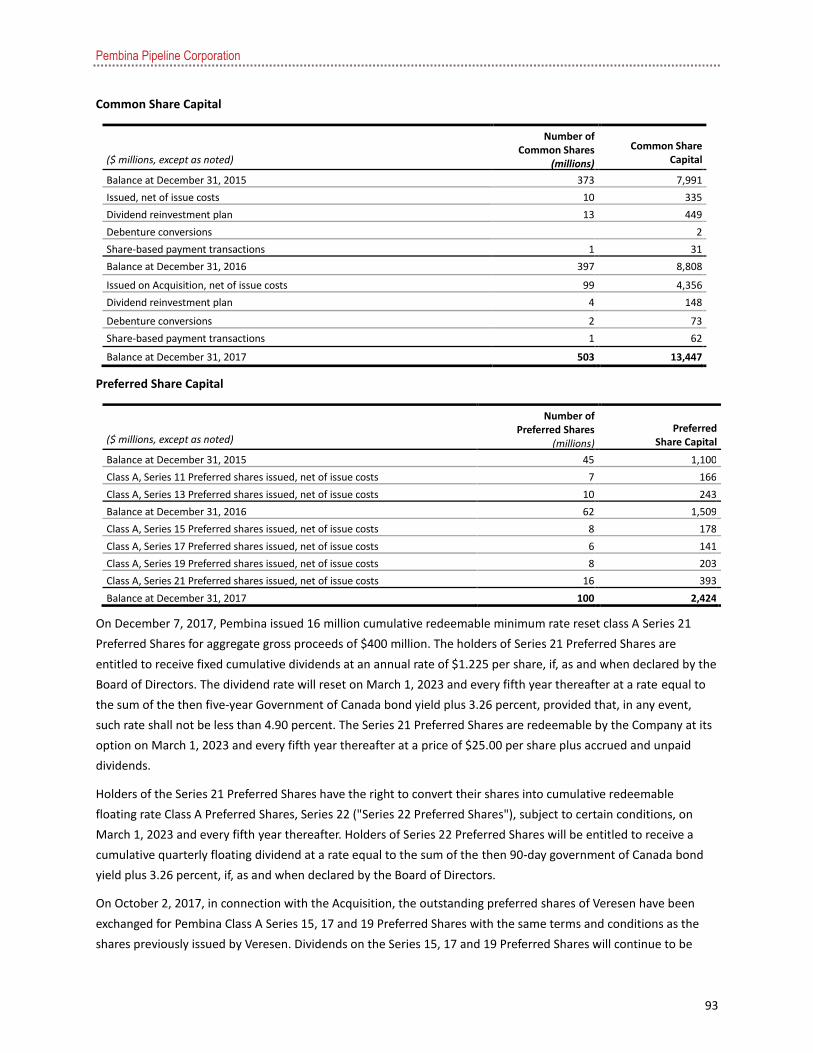
Pembina Pipeline Corporation
93
Common Share Capital
($ millions, except as noted)
Number of Common Shares
(millions)
Common Share Capital
Balance at December 31, 2015 373 7,991
Issued, net of issue costs 10 335
Dividend reinvestment plan 13 449
Debenture conversions 2
Share-based payment transactions 1 31
Balance at December 31, 2016 397 8,808
Issued on Acquisition, net of issue costs 99 4,356
Dividend reinvestment plan 4 148
Debenture conversions 2 73
Share-based payment transactions 1 62
Balance at December 31, 2017 503 13,447
Preferred Share Capital
($ millions, except as noted)
Number of Preferred Shares
(millions)
Preferred Share Capital
Balance at December 31, 2015 45 1,100
Class A, Series 11 Preferred shares issued, net of issue costs 7 166
Class A, Series 13 Preferred shares issued, net of issue costs 10 243
Balance at December 31, 2016 62 1,509
Class A, Series 15 Preferred shares issued, net of issue costs 8 178
Class A, Series 17 Preferred shares issued, net of issue costs 6 141
Class A, Series 19 Preferred shares issued, net of issue costs 8 203
Class A, Series 21 Preferred shares issued, net of issue costs 16 393
Balance at December 31, 2017 100 2,424
On December 7, 2017, Pembina issued 16 million cumulative redeemable minimum rate reset class A Series 21
Preferred Shares for aggregate gross proceeds of $400 million. The holders of Series 21 Preferred Shares are
entitled to receive fixed cumulative dividends at an annual rate of $1.225 per share, if, as and when declared by the
Board of Directors. The dividend rate will reset on March 1, 2023 and every fifth year thereafter at a rate equal to
the sum of the then five-year Government of Canada bond yield plus 3.26 percent, provided that, in any event,
such rate shall not be less than 4.90 percent. The Series 21 Preferred Shares are redeemable by the Company at its
option on March 1, 2023 and every fifth year thereafter at a price of $25.00 per share plus accrued and unpaid
dividends.
Holders of the Series 21 Preferred Shares have the right to convert their shares into cumulative redeemable
floating rate Class A Preferred Shares, Series 22 ("Series 22 Preferred Shares"), subject to certain conditions, on
March 1, 2023 and every fifth year thereafter. Holders of Series 22 Preferred Shares will be entitled to receive a
cumulative quarterly floating dividend at a rate equal to the sum of the then 90-day government of Canada bond
yield plus 3.26 percent, if, as and when declared by the Board of Directors.
On October 2, 2017, in connection with the Acquisition, the outstanding preferred shares of Veresen have been
exchanged for Pembina Class A Series 15, 17 and 19 Preferred Shares with the same terms and conditions as the
shares previously issued by Veresen. Dividends on the Series 15, 17 and 19 Preferred Shares will continue to be
Pembina Pipeline Corporation
94
paid on the last business day of March, June, September and December in each year, if, as and when declared by
the Board of Directors.
On April 27, 2016, Pembina issued 10 million cumulative redeemable minimum rate reset class A Series 13
Preferred Shares for aggregate gross proceeds of $250 million. The holders of Series 13 Preferred Shares are
entitled to receive fixed cumulative dividends at an annual rate of $1.4375 per share, if, as and when declared by
the Board of Directors. The dividend rate will reset on June 1, 2021 and every fifth year thereafter at a rate equal to
the sum of the then five-year Government of Canada bond yield plus 4.96 percent, provided that, in any event,
such rate shall not be less than 5.75 percent. The Series 13 Preferred Shares are redeemable by the Company at its
option on June 1, 2021 and every fifth year thereafter at a price of $25.00 per share plus accrued and unpaid
dividends.
Holders of the Series 13 Preferred Shares have the right to convert their shares into cumulative redeemable
floating rate Class A Preferred Shares, Series 14 ("Series 14 Preferred Shares"), subject to certain conditions, on
June 1, 2021 and every fifth year thereafter. Holders of Series 14 Preferred Shares will be entitled to receive a
cumulative quarterly floating dividend at a rate equal to the sum of the then 90-day government of Canada bond
yield plus 4.96 percent, if, as and when declared by the Board of Directors.
On January 15, 2016, Pembina issued 6.8 million cumulative redeemable minimum rate reset class A Series 11
Preferred Shares for aggregate gross proceeds of $170 million. The holders of Series 11 Preferred Shares are
entitled to receive fixed cumulative dividends at an annual rate of $1.4375 per share, if, as and when declared by
the Board of Directors. The dividend rate will reset on March 1, 2021 and every five years thereafter at a rate equal
to the sum of the then five-year Government of Canada bond yield plus 5.00 percent, provided that, in any event,
such rate shall not be less than 5.75 percent. The Series 11 Preferred Shares are redeemable by the Company at its
option on March 1, 2021 and every fifth year thereafter at a price of $25.00 per share plus accrued and unpaid
dividends.
Holders of the Series 11 Preferred Shares have the right to convert their shares into cumulative redeemable
floating rate Class A Preferred Shares, Series 12 ("Series 12 Preferred Shares"), subject to certain conditions, on
March 1, 2021 and every fifth year thereafter. Holders of Series 12 Preferred Shares will be entitled to receive a
cumulative quarterly floating dividend at a rate equal to the sum of the then 90-day government of Canada bond
yield plus 5.00 percent, if, as and when declared by the Board of Directors.

Pembina Pipeline Corporation
95
Dividends
The following dividends were declared by the Company:
Year Ended December 31 ($ millions) 2017 2016
Common shares
Common shares $2.04000 per qualifying share (2016: $1.89750) 873 737
Preferred shares
$1.062500 per qualifying Series 1 preferred share (2016: $1.062500) 11 11
$1.175000 per qualifying Series 3 preferred share (2016: $1.175000) 7 7
$1.250000 per qualifying Series 5 preferred share (2016: $1.250000) 12 12
$1.125000 per qualifying Series 7 preferred share (2016: $1.125000) 11 11
$1.187500 per qualifying Series 9 preferred share (2016: $1.187500) 11 11
$1.437500 per qualifying Series 11 preferred share (2016: $1.259325) 10 8
$1.437500 per qualifying Series 13 preferred share (2016: $0.859575) 14 9
$0.279000 per qualifying Series 15 preferred share (2016: nil) 2
$0.312500 per qualifying Series 17 preferred share (2016: nil) 2
$0.312500 per qualifying Series 19 preferred share (2016: nil) 3
83 69
Pembina's Board of Directors approved a 6.25 percent increase in its monthly common share dividend rate (from
$0.16 per common share to $0.17 per common share), effective for the dividend paid on May 15, 2017. In
connection with the Acquisition, Pembina increased its monthly dividend by an additional 5.88 percent to $0.18
per common share, effective for the dividend paid on November 15, 2017.
On January 8, 2018, Pembina announced that its Board of Directors had declared a dividend of $0.18 per qualifying
common share ($2.16 annually) in the total amount of $91 million, payable on February 15, 2018 to shareholders
of record on January 25, 2018. Pembina's Board of Directors also declared quarterly dividends for the Company's
preferred shares, Series 1, 3, 5, 7, 9, 11, 13 and 21 in the total amount of $24 million payable on March 1, 2018 to
shareholders of record on February 1, 2018 and Series 15, 17, and 19 in the total amount of $6 million payable on
March 31, 2018 to shareholders of record on March 15, 2018.
Series Dividend Amount
Series 1 $ 0.265625
Series 3 $ 0.293750
Series 5 $ 0.312500
Series 7 $ 0.281250
Series 9 $ 0.296875
Series 11 $ 0.359375
Series 13 $ 0.359375
Series 15 $ 0.279000
Series 17 $ 0.312500
Series 19 $ 0.312500
Series 21 $ 0.281900
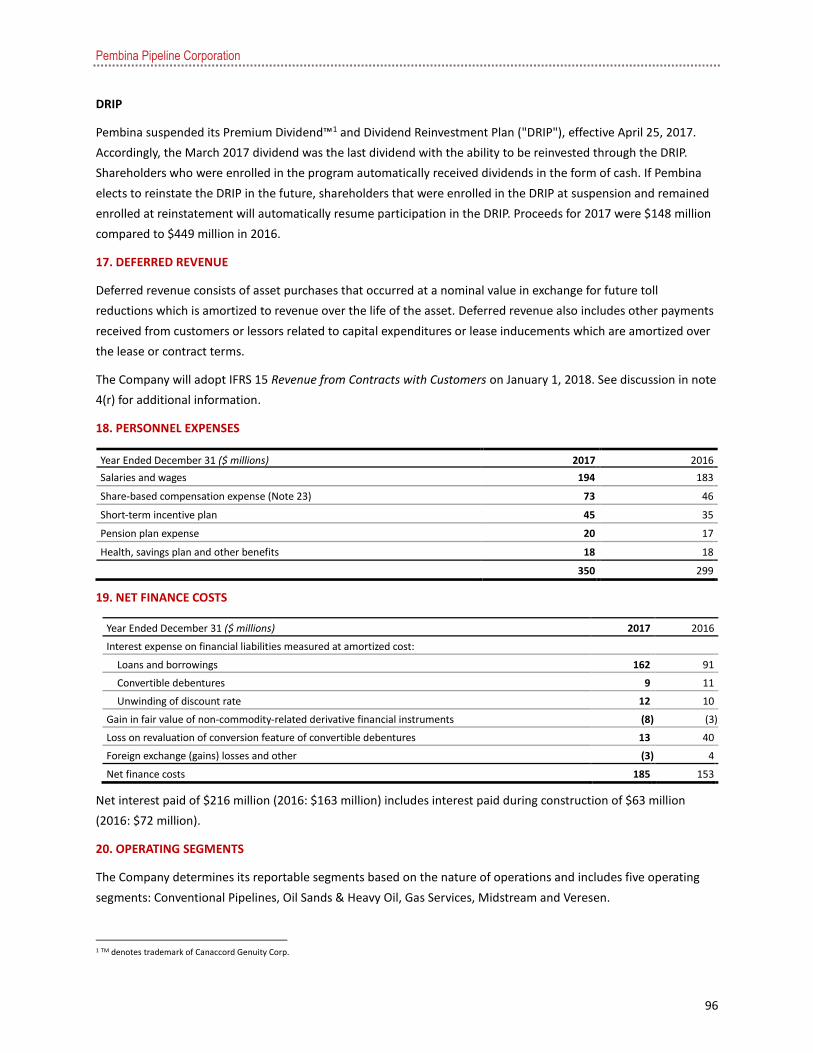
Pembina Pipeline Corporation
96
DRIP
Pembina suspended its Premium Dividend™1 and Dividend Reinvestment Plan ("DRIP"), effective April 25, 2017.
Accordingly, the March 2017 dividend was the last dividend with the ability to be reinvested through the DRIP.
Shareholders who were enrolled in the program automatically received dividends in the form of cash. If Pembina
elects to reinstate the DRIP in the future, shareholders that were enrolled in the DRIP at suspension and remained
enrolled at reinstatement will automatically resume participation in the DRIP. Proceeds for 2017 were $148 million
compared to $449 million in 2016.
17. DEFERRED REVENUE
Deferred revenue consists of asset purchases that occurred at a nominal value in exchange for future toll
reductions which is amortized to revenue over the life of the asset. Deferred revenue also includes other payments
received from customers or lessors related to capital expenditures or lease inducements which are amortized over
the lease or contract terms.
The Company will adopt IFRS 15 Revenue from Contracts with Customers on January 1, 2018. See discussion in note
4(r) for additional information.
18. PERSONNEL EXPENSES
Year Ended December 31 ($ millions) 2017 2016
Salaries and wages 194 183
Share-based compensation expense (Note 23) 73 46
Short-term incentive plan 45 35
Pension plan expense 20 17
Health, savings plan and other benefits 18 18
350 299
19. NET FINANCE COSTS
Year Ended December 31 ($ millions) 2017 2016
Interest expense on financial liabilities measured at amortized cost: Loans and borrowings 162 91 Convertible debentures 9 11 Unwinding of discount rate 12 10
Gain in fair value of non-commodity-related derivative financial instruments (8 ) (3 )
Loss on revaluation of conversion feature of convertible debentures 13 40 Foreign exchange (gains) losses and other (3 ) 4 Net finance costs 185 153
Net interest paid of $216 million (2016: $163 million) includes interest paid during construction of $63 million
(2016: $72 million).
20. OPERATING SEGMENTS
The Company determines its reportable segments based on the nature of operations and includes five operating
segments: Conventional Pipelines, Oil Sands & Heavy Oil, Gas Services, Midstream and Veresen.
1 TM denotes trademark of Canaccord Genuity Corp.

Pembina Pipeline Corporation
97
Conventional Pipelines consists of the tariff-based operations of pipelines and related facilities to deliver crude oil,
condensate and NGL in Alberta, British Columbia, Saskatchewan, and North Dakota, United States.
Oil Sands & Heavy Oil consists of the Syncrude, Horizon, Nipisi and Mitsue Pipelines, and the Cheecham Lateral.
These pipelines and related facilities deliver synthetic crude oil produced from oil sands under long-term cost-of-
service arrangements.
Gas Services consists of natural gas gathering and processing facilities, including shallow and deep cut sweet and
sour gas processing plants and gathering systems.
Midstream consists of the Company's interests in extraction and fractionation facilities, terminalling and storage
hub services under a mixture of short, medium and long-term contractual arrangements.
Veresen consists of: tariff-based operations of pipelines and related facilities to deliver natural gas and NGL in
Alberta, British Columbia and the United States; gas services which consists of natural gas gathering and processing
facilities; and an interest in assets which include a NGL extraction facility near Chicago, Illinois and other natural gas
and NGL processing facilities, logistics and distribution assets in the U.S. and Canada.
The financial results of the business segments are included below. Performance is measured based on results from
operating activities, net of depreciation and amortization, as included in the internal management reports that are
reviewed by the Company's Chief Executive Officer, Chief Financial Officer and other Senior Vice Presidents. These
results are used to measure performance as management believes that such information is the most relevant in
evaluating results of certain segments relative to other entities that operate within these industries. Intersegment
transactions are recorded at market value and eliminated under corporate and intersegment eliminations.

Pembina Pipeline Corporation
98
12 Months Ended December 31, 2017 ($ millions)
Conventional Pipelines(1)
Oil Sands & Heavy Oil
Gas Services Midstream(2)(3) Veresen
Corporate & Intersegment Eliminations Total
External revenue:
Pipeline transportation 780 207 15 1,002
Terminalling, storage and hub services 4,034 4,034
Gas services 372 372
Total external revenue 780 207 372 4,034 15 5,408
Inter-segment revenue:
Pipeline transportation 104 3 (107 )
Gas services 6 (6 )
Total inter-segment revenue 104 3 6 (113 )
Total revenue(4) 884 210 378 4,034 15 (113 ) 5,408
Operating expenses 227 66 89 69 8 (9 ) 450
Cost of goods sold, including product purchases 13 3,262 (113 ) 3,162
Realized loss on commodity-related derivative financial instruments 1 93 94
Share of profit of investments in equity accounted investees 116 116
Depreciation and amortization included in operations 157 18 59 116 9 359
Unrealized gain on commodity-related derivative financial instruments (1 ) (22 ) (23 )
Gross profit 500 126 217 516 114 9 1,482
Depreciation included in general and administrative 1 22 23
Other general and administrative 14 5 11 27 5 151 213
Other (income) expense (6 ) (1 ) 1 11 23 28
Reportable segment results from operating activities 492 122 205 478 108 (187 ) 1,218
Net finance costs (income) 8 1 1 18 (3 ) 160 185
Reportable segment earnings (loss) before tax 484 121 204 460 111 (347 ) 1,033
Capital expenditures 1,150 15 243 395 24 12 1,839
Contributions to equity accounted investees 1 6 7
Acquisition 6,400 6,400 (1) Conventional Pipelines revenue includes $22 million associated with U.S. pipeline sales.
(2) NGL product and services, terminalling, storage and hub services revenue includes $215 million associated with U.S. midstream sales.
(3) Pembina aggregates its NGL and crude oil midstream activities based on shared economic risk characteristics.
(4) No customer accounted for 10 percent or more of total revenue.

Pembina Pipeline Corporation
99
12 Months Ended December 31, 2016 ($ millions)
Conventional Pipelines(1)
Oil Sands & Heavy Oil
Gas Services Midstream(2)(3) Veresen
Corporate & Intersegment Eliminations Total
External revenue:
Pipeline transportation 606 199 805
Terminalling, storage and hub services 3,183
3,183
Gas services 277 277
Total external revenue 606 199 277 3,183 4,265
Inter-segment revenue:
Pipeline transportation 113 3 (116 )
Gas services 6 (6 )
Total inter-segment revenue 113 3 6 (122 )
Total revenue (4) 719 202 283 3,183 (122 ) 4,265
Share of profit of investments in equity accounted investees 1
1
Operating expenses 222 62 76 69 (10 ) 419
Cost of goods sold, including product purchases 12
2,611
(122 ) 2,501
Realized loss on commodity-related derivative financial instruments 3
7
10
Depreciation and amortization included in operations 103
17
52
101
273
Unrealized (gain) loss on commodity-related derivative financial instruments (2 ) 63
61
Gross profit 393 123 143 333 10 1,002
Depreciation included in general and administrative 20
20
Other general and administrative 10
5
8
24
128
175
Other (income) expense (11 ) 1 1 8 (1 )
Reportable segment results from operating activities 394
117
134
301
(138 ) 808
Net finance costs 5 1 2 8 137 153
Reportable segment earnings (loss) before tax 389
116
132
293
(275 ) 655
Capital expenditures 957 124 146 504 14 1,745
Contributions to equity accounted investees 2
2
Acquisition 566 566 (1) Conventional Pipelines revenue includes $13 million associated with U.S. pipeline sales.
(2) NGL product and services, terminalling, storage and hub services revenue includes $139 million associated with U.S. midstream sales.
(3) Pembina aggregates its NGL and crude oil midstream activities based on shared economic risk characteristics.
(4) One customer accounted for 10 percent of total revenue.

Pembina Pipeline Corporation
100
21. EARNINGS PER COMMON SHARE
Basic earnings per common share
The calculation of basic earnings per common share at December 31, 2017 was based on the earnings attributable
to common shareholders of $805 million (2016: $394 million) and a weighted average number of common shares
outstanding of 426 million (2016: 388 million).
Diluted earnings per common share
The calculation of diluted earnings per common share at December 31, 2017 was based on earnings attributable to
common shareholders of $811 million (December 31, 2016: $394 million), and weighted average number of
common shares outstanding after adjustment for the effects of all dilutive potential common shares of 432 million
(2016: 389 million).
Earnings attributable to common shareholders
Year Ended December 31 ($ millions) 2017 2016
Earnings 891 466
Dividends on preferred shares (83 ) (69 )
Cumulative dividends on preferred shares, not yet declared (3 ) (3 )
Earnings attributable to common shareholders (basic) 805 394
Effect of after-tax interest on debentures to earnings 6
Earnings attributable to common shareholders (diluted) 811 394
Weighted average number of common shares
(In millions of shares, except as noted) 2017 2016
Issued common shares at January 1 397 373
Effect of shares issued on Acquisition 25 8
Effect of conversion of convertible debentures 1
Effect of shares issued under dividend reinvestment plan 3 7
Weighted average number of common shares at December 31 (basic) 426 388
Dilutive effect of debentures converted 4
Dilutive effect of share options on issue 2 1
Weighted average number of common shares at December 31 (diluted) 432 389
Basic earnings per common share (dollars) 1.89 1.02
Diluted earnings per common share (dollars) 1.88 1.01
At December 31, 2016, the effect of the conversion of the convertible debentures was excluded from the diluted
earnings per common share calculation as the impact was anti-dilutive. If the convertible debentures were
included, an additional 5 million common shares would be added to the weighted average number of common
shares and $8 million would be added to earnings, representing after-tax interest expense of the convertible
debentures.
The average market value of the Company's shares for purposes of calculating the dilutive effect of share options
was based on quoted market prices for the period during which the options were outstanding.
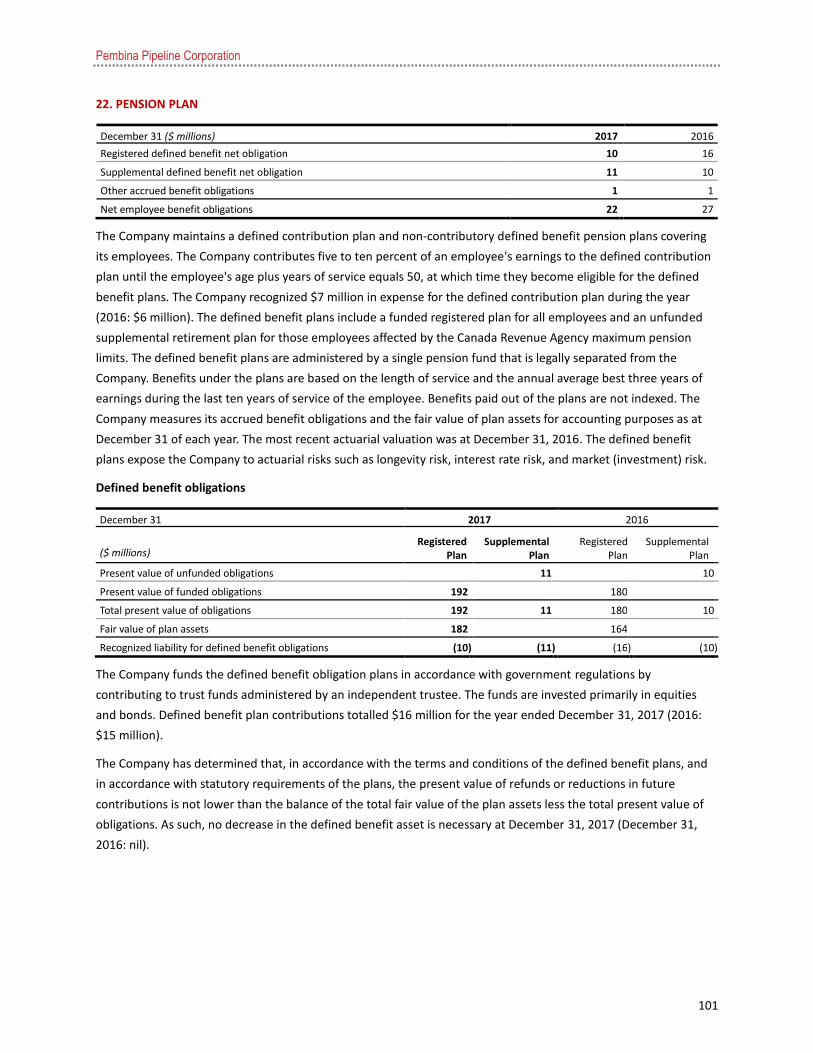
Pembina Pipeline Corporation
101
22. PENSION PLAN
December 31 ($ millions) 2017 2016
Registered defined benefit net obligation 10 16
Supplemental defined benefit net obligation 11 10
Other accrued benefit obligations 1 1
Net employee benefit obligations 22 27
The Company maintains a defined contribution plan and non-contributory defined benefit pension plans covering
its employees. The Company contributes five to ten percent of an employee's earnings to the defined contribution
plan until the employee's age plus years of service equals 50, at which time they become eligible for the defined
benefit plans. The Company recognized $7 million in expense for the defined contribution plan during the year
(2016: $6 million). The defined benefit plans include a funded registered plan for all employees and an unfunded
supplemental retirement plan for those employees affected by the Canada Revenue Agency maximum pension
limits. The defined benefit plans are administered by a single pension fund that is legally separated from the
Company. Benefits under the plans are based on the length of service and the annual average best three years of
earnings during the last ten years of service of the employee. Benefits paid out of the plans are not indexed. The
Company measures its accrued benefit obligations and the fair value of plan assets for accounting purposes as at
December 31 of each year. The most recent actuarial valuation was at December 31, 2016. The defined benefit
plans expose the Company to actuarial risks such as longevity risk, interest rate risk, and market (investment) risk.
Defined benefit obligations
December 31 2017 2016
($ millions) Registered
Plan Supplemental
Plan Registered
Plan Supplemental
Plan
Present value of unfunded obligations 11 10
Present value of funded obligations 192 180
Total present value of obligations 192 11 180 10
Fair value of plan assets 182 164
Recognized liability for defined benefit obligations (10 ) (11 ) (16 ) (10 )
The Company funds the defined benefit obligation plans in accordance with government regulations by
contributing to trust funds administered by an independent trustee. The funds are invested primarily in equities
and bonds. Defined benefit plan contributions totalled $16 million for the year ended December 31, 2017 (2016:
$15 million).
The Company has determined that, in accordance with the terms and conditions of the defined benefit plans, and
in accordance with statutory requirements of the plans, the present value of refunds or reductions in future
contributions is not lower than the balance of the total fair value of the plan assets less the total present value of
obligations. As such, no decrease in the defined benefit asset is necessary at December 31, 2017 (December 31,
2016: nil).

Pembina Pipeline Corporation
102
Registered defined benefit pension plan assets comprise
December 31 (percentages) 2017 2016
Equity securities 65 % 61 %
Debt 35 % 38 %
Other 1 %
100 % 100 %
Movement in the present value of the defined benefit pension obligation
2017 2016
($ millions) Registered
Plan Supplemental
Plan Registered
Plan Supplemental
Plan
Defined benefits obligations at January 1 180 10 160 8
Benefits paid by the plan (13 ) (8 )
Current service costs 14 11
Interest expense 7 6
Actuarial losses in other comprehensive income 4 1 11 2
Defined benefit obligations at December 31 192 11 180 10
Movement in the present value of registered defined benefit pension plan assets
($ millions) 2017 2016
Fair value of plan assets at January 1 164 146
Contributions paid into the plan 16 15
Benefits paid by the plan (13 ) (8 )
Return on plan assets 8 5
Interest income 7 6
Fair value of registered plan assets at December 31 182 164
Expense recognition in earnings
Registered Plan Year Ended December 31 ($ millions) 2017 2016
Current service costs 14 11
Interest on obligation 7 6
Expected return on plan assets (7 ) (6 )
14 11
The expense is recognized in the following line items in the statement of comprehensive income:
Year Ended December 31 ($ millions) 2017 2016
Registered Plan
Operating expenses 7 5
General and administrative expense 7 6
14 11
Expense recognized for the Supplemental Plan was less than one million for each of the years ended December 31,
2017 and 2016.

Pembina Pipeline Corporation
103
Actuarial gains and losses recognized in other comprehensive income
2017 2016
($ millions) Registered
Plan Supplemental
Plan Total Registered
Plan Supplemental
Plan Total
Balance at January 1 (25 ) (1 ) (26 ) (20 ) (1 ) (21 )
Remeasurements gain:
Actuarial gain (loss) arising from
Demographic assumptions (1 ) (1 )
Financial assumptions (4 ) (4 ) (5 ) (5 )
Experience adjustments 1 1 (3 ) (3 )
Return on plan assets excluding interest income 6 6 4 4
Recognized during the period after tax 3 3 (5 ) (5 )
Balance at December 31 (22 ) (1 ) (23 ) (25 ) (1 ) (26 )
Principal actuarial assumptions used:
December 31 (weighted average percent) 2017 2016
Discount rate 3.6 % 3.9 %
Future pension earning increases 4.0 % 4.0 %
Assumptions regarding future mortality are based on published statistics and mortality tables. The current
longevities underlying the values of the liabilities in the defined plans are as follows:
December 31 (years) 2017 2016
Longevity at age 65 for current pensioners
Males 21.7 21.6
Females 24.1 24.0
Longevity at age 65 for current member aged 45
Males 22.8 22.7
Females 25.1 25.0
The calculation of the defined benefit obligation is sensitive to the discount rate, compensation increases,
retirements and termination rates as set out above. An increase or decrease of the estimated discount rate of 3.6
percent by 100 basis points at December 31, 2017 is considered reasonably possible in the next financial year but
would not have a material impact on the obligation.
The Company expects to contribute $17 million to the defined benefit plans in 2018.
23. SHARE-BASED PAYMENTS
At December 31, 2017, the Company has the following share-based payment arrangements:
Share option plan (equity settled)
The Company has a share option plan under which employees are eligible to receive options to purchase shares in
the Company.
Long-term share unit award incentive plan (cash-settled)
In 2005, the Company established a long-term share unit award incentive plan. Under the share-based
compensation plan, awards of restricted (RSU) and performance (PSU) share units are made to officers, non-
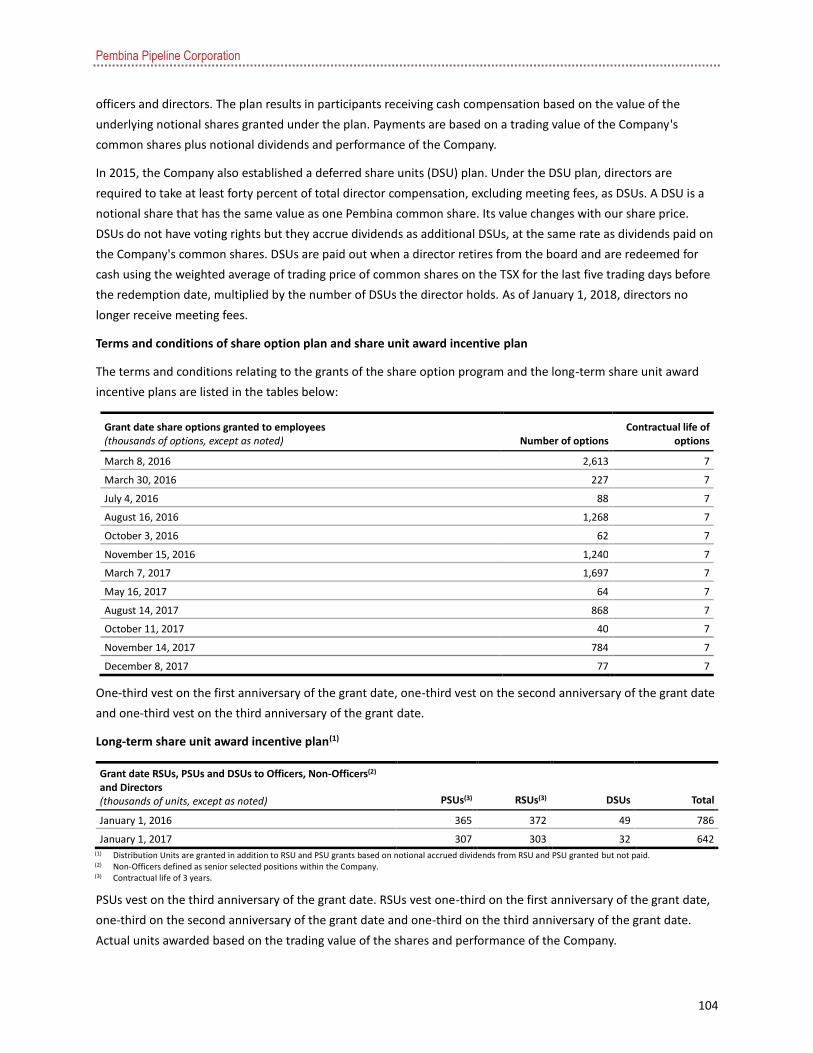
Pembina Pipeline Corporation
104
officers and directors. The plan results in participants receiving cash compensation based on the value of the
underlying notional shares granted under the plan. Payments are based on a trading value of the Company's
common shares plus notional dividends and performance of the Company.
In 2015, the Company also established a deferred share units (DSU) plan. Under the DSU plan, directors are
required to take at least forty percent of total director compensation, excluding meeting fees, as DSUs. A DSU is a
notional share that has the same value as one Pembina common share. Its value changes with our share price.
DSUs do not have voting rights but they accrue dividends as additional DSUs, at the same rate as dividends paid on
the Company's common shares. DSUs are paid out when a director retires from the board and are redeemed for
cash using the weighted average of trading price of common shares on the TSX for the last five trading days before
the redemption date, multiplied by the number of DSUs the director holds. As of January 1, 2018, directors no
longer receive meeting fees.
Terms and conditions of share option plan and share unit award incentive plan
The terms and conditions relating to the grants of the share option program and the long-term share unit award
incentive plans are listed in the tables below:
Grant date share options granted to employees (thousands of options, except as noted) Number of options
Contractual life of options
March 8, 2016 2,613 7
March 30, 2016 227 7
July 4, 2016 88 7
August 16, 2016 1,268 7
October 3, 2016 62 7
November 15, 2016 1,240 7
March 7, 2017 1,697 7
May 16, 2017 64 7
August 14, 2017 868 7
October 11, 2017 40 7
November 14, 2017 784 7
December 8, 2017 77 7
One-third vest on the first anniversary of the grant date, one-third vest on the second anniversary of the grant date
and one-third vest on the third anniversary of the grant date.
Long-term share unit award incentive plan(1)
Grant date RSUs, PSUs and DSUs to Officers, Non-Officers(2) and Directors (thousands of units, except as noted) PSUs(3) RSUs(3) DSUs Total
January 1, 2016 365 372 49 786
January 1, 2017 307 303 32 642 (1) Distribution Units are granted in addition to RSU and PSU grants based on notional accrued dividends from RSU and PSU granted but not paid.
(2) Non-Officers defined as senior selected positions within the Company.
(3) Contractual life of 3 years.
PSUs vest on the third anniversary of the grant date. RSUs vest one-third on the first anniversary of the grant date,
one-third on the second anniversary of the grant date and one-third on the third anniversary of the grant date.
Actual units awarded based on the trading value of the shares and performance of the Company.
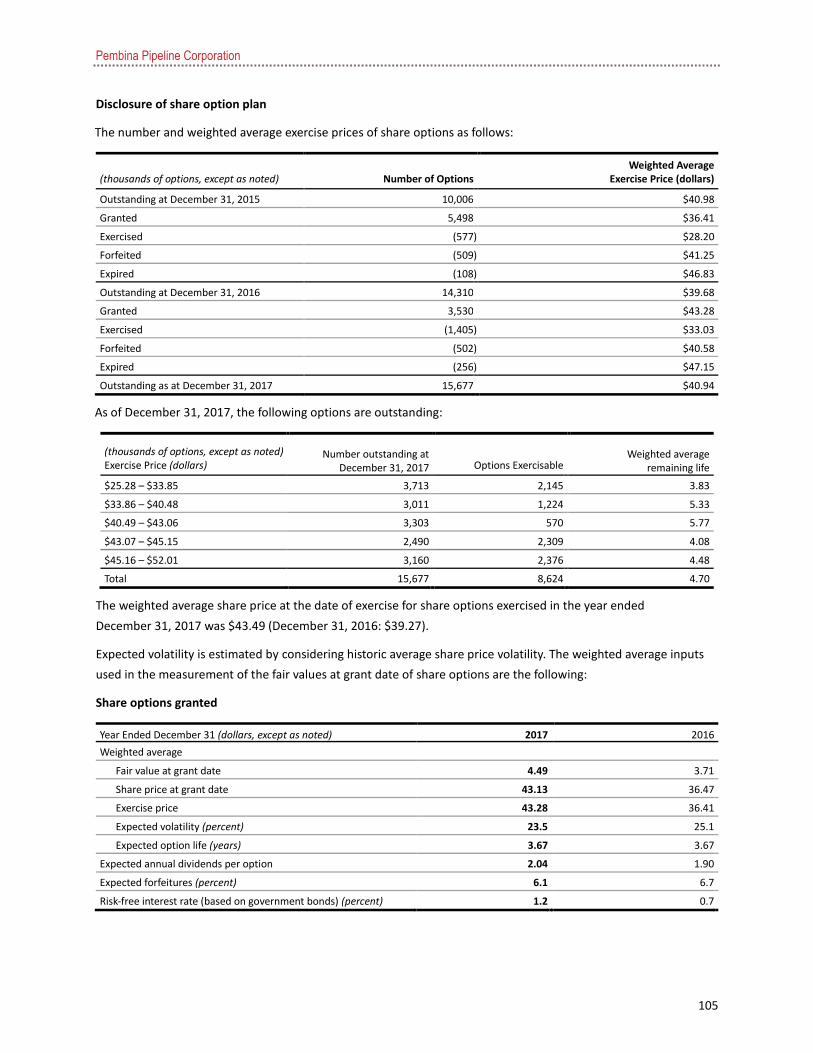
Pembina Pipeline Corporation
105
Disclosure of share option plan
The number and weighted average exercise prices of share options as follows:
(thousands of options, except as noted) Number of Options Weighted Average
Exercise Price (dollars)
Outstanding at December 31, 2015 10,006 $40.98
Granted 5,498 $36.41
Exercised (577 ) $28.20
Forfeited (509 ) $41.25
Expired (108 ) $46.83
Outstanding at December 31, 2016 14,310 $39.68
Granted 3,530 $43.28
Exercised (1,405 ) $33.03
Forfeited (502 ) $40.58
Expired (256 ) $47.15
Outstanding as at December 31, 2017 15,677 $40.94
As of December 31, 2017, the following options are outstanding:
(thousands of options, except as noted) Exercise Price (dollars)
Number outstanding at December 31, 2017 Options Exercisable
Weighted average remaining life
$25.28 – $33.85 3,713 2,145 3.83
$33.86 – $40.48 3,011 1,224 5.33
$40.49 – $43.06 3,303 570 5.77
$43.07 – $45.15 2,490 2,309 4.08
$45.16 – $52.01 3,160 2,376 4.48
Total 15,677 8,624 4.70
The weighted average share price at the date of exercise for share options exercised in the year ended
December 31, 2017 was $43.49 (December 31, 2016: $39.27).
Expected volatility is estimated by considering historic average share price volatility. The weighted average inputs
used in the measurement of the fair values at grant date of share options are the following:
Share options granted
Year Ended December 31 (dollars, except as noted) 2017 2016
Weighted average
Fair value at grant date 4.49 3.71
Share price at grant date 43.13 36.47
Exercise price 43.28 36.41
Expected volatility (percent) 23.5 25.1
Expected option life (years) 3.67 3.67
Expected annual dividends per option 2.04 1.90
Expected forfeitures (percent) 6.1 6.7
Risk-free interest rate (based on government bonds) (percent) 1.2 0.7

Pembina Pipeline Corporation
106
Disclosure of long-term share unit award incentive plan
The long-term share unit award incentive plans was valued using the volume weighted average price for 20 days
ending December 31, 2017 of $44.94 (December 31, 2016: $41.18). Actual payment may differ from amount valued
based on market price and company performance.
Employee expenses
Year Ended December 31 ($ millions) 2017 2016
Share option plan, equity settled 16 15
Long-term share unit award incentive plan 57 31
Share-based compensation expense 73 46
Total carrying amount of liabilities for cash settled arrangements 79 44
Total intrinsic value of liability for vested benefits 36 24
24. FINANCIAL INSTRUMENTS
Financial Risk Management
Pembina has exposure to counterparty credit risk, liquidity risk and market risk. Pembina recognizes that effective
management of these risks is a critical success factor in managing organization and shareholder value.
Risk management strategies, policies and limits ensure risks and exposures are aligned to Pembina's business
strategy and risk tolerance. The Company's Board of Directors is responsible for providing risk management
oversight at Pembina. The Company's Audit Committee oversees how management monitors compliance with the
Company's risk management policies and procedures and reviews the adequacy of this risk framework in relation
to the risks faced by the Company. Internal audit personnel assist the Audit Committee in its oversight role by
monitoring and evaluating the effectiveness of the organization's risk management system.
Counterparty credit risk
Counterparty credit risk represents the financial loss the Company would experience if a counterparty to a financial
instrument failed to meet its contractual obligations in accordance with the terms and conditions of the financial
instruments with the Company. Counterparty credit risk arises primarily from the Company's cash and cash
equivalents, trade and other receivables, and from counterparties to its derivative financial instruments. The
carrying amount of the Company's cash and cash equivalents, trade and other receivables, advances to related
parties and derivative financial instruments represents the maximum counterparty credit exposure, without taking
into account security held.
The Company manages counterparty credit risk through established credit management techniques, including
conducting comprehensive financial and other assessments for all new counterparties and regular reviews of
existing counterparties to establish and monitor a counterparty's creditworthiness, setting exposure limits,
monitoring exposures against these limits and obtaining financial assurances where warranted. The Company
utilizes various sources of financial, credit and business information in assessing the creditworthiness of a
counterparty including external credit ratings, where available, and in other cases, detailed financial statement
analysis in order to generate an internal credit rating based on quantitative and qualitative factors. The
establishment of counterparty exposure limits is governed by a Board of Directors designated counterparty
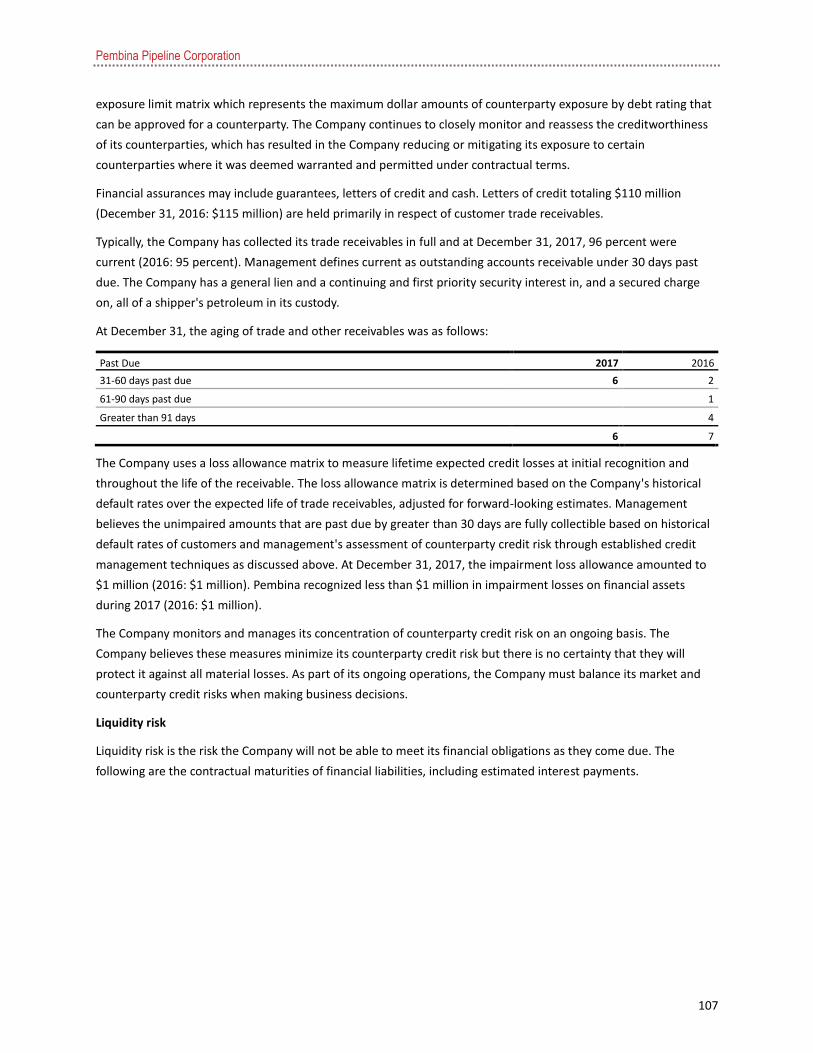
Pembina Pipeline Corporation
107
exposure limit matrix which represents the maximum dollar amounts of counterparty exposure by debt rating that
can be approved for a counterparty. The Company continues to closely monitor and reassess the creditworthiness
of its counterparties, which has resulted in the Company reducing or mitigating its exposure to certain
counterparties where it was deemed warranted and permitted under contractual terms.
Financial assurances may include guarantees, letters of credit and cash. Letters of credit totaling $110 million
(December 31, 2016: $115 million) are held primarily in respect of customer trade receivables.
Typically, the Company has collected its trade receivables in full and at December 31, 2017, 96 percent were
current (2016: 95 percent). Management defines current as outstanding accounts receivable under 30 days past
due. The Company has a general lien and a continuing and first priority security interest in, and a secured charge
on, all of a shipper's petroleum in its custody.
At December 31, the aging of trade and other receivables was as follows:
Past Due 2017 2016
31-60 days past due 6 2
61-90 days past due 1
Greater than 91 days 4
6 7
The Company uses a loss allowance matrix to measure lifetime expected credit losses at initial recognition and
throughout the life of the receivable. The loss allowance matrix is determined based on the Company's historical
default rates over the expected life of trade receivables, adjusted for forward-looking estimates. Management
believes the unimpaired amounts that are past due by greater than 30 days are fully collectible based on historical
default rates of customers and management's assessment of counterparty credit risk through established credit
management techniques as discussed above. At December 31, 2017, the impairment loss allowance amounted to
$1 million (2016: $1 million). Pembina recognized less than $1 million in impairment losses on financial assets
during 2017 (2016: $1 million).
The Company monitors and manages its concentration of counterparty credit risk on an ongoing basis. The
Company believes these measures minimize its counterparty credit risk but there is no certainty that they will
protect it against all material losses. As part of its ongoing operations, the Company must balance its market and
counterparty credit risks when making business decisions.
Liquidity risk
Liquidity risk is the risk the Company will not be able to meet its financial obligations as they come due. The
following are the contractual maturities of financial liabilities, including estimated interest payments.
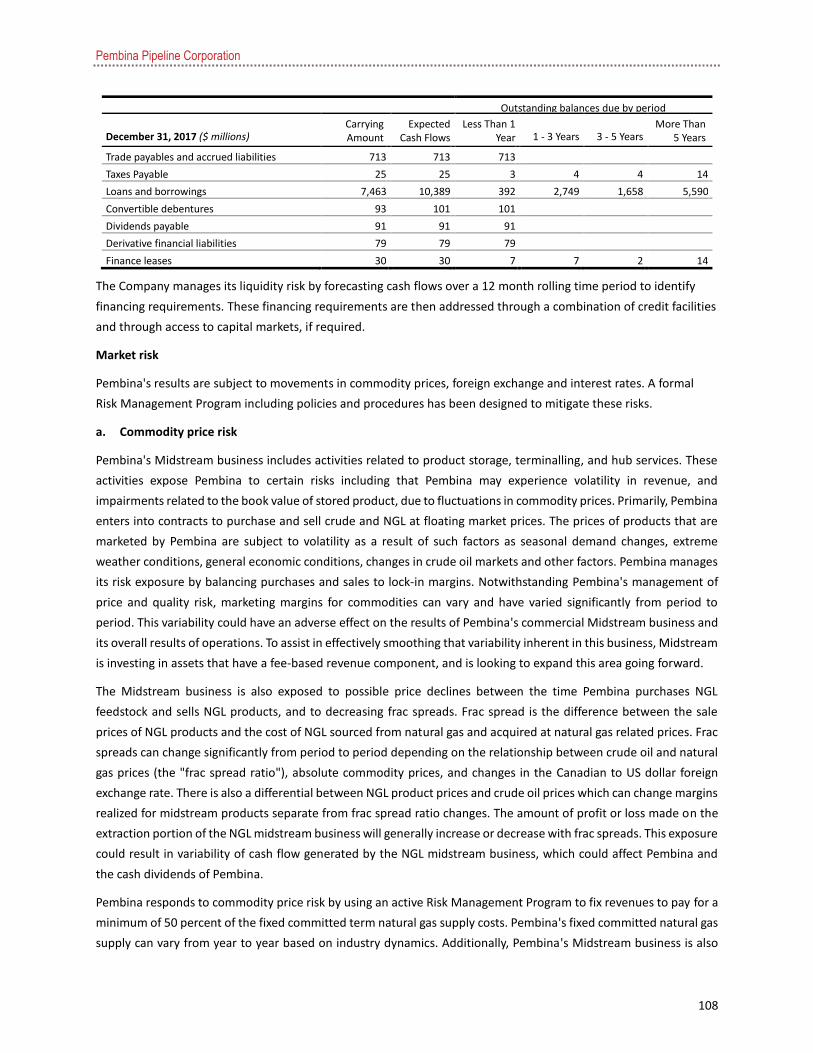
Pembina Pipeline Corporation
108
Outstanding balances due by period
December 31, 2017 ($ millions) Carrying Amount
Expected Cash Flows
Less Than 1 Year 1 - 3 Years 3 - 5 Years
More Than 5 Years
Trade payables and accrued liabilities 713 713 713
Taxes Payable 25 25 3 4 4 14
Loans and borrowings 7,463 10,389 392 2,749 1,658 5,590
Convertible debentures 93 101 101
Dividends payable 91 91 91
Derivative financial liabilities 79 79 79
Finance leases 30 30 7 7 2 14
The Company manages its liquidity risk by forecasting cash flows over a 12 month rolling time period to identify
financing requirements. These financing requirements are then addressed through a combination of credit facilities
and through access to capital markets, if required.
Market risk
Pembina's results are subject to movements in commodity prices, foreign exchange and interest rates. A formal
Risk Management Program including policies and procedures has been designed to mitigate these risks.
a. Commodity price risk
Pembina's Midstream business includes activities related to product storage, terminalling, and hub services. These
activities expose Pembina to certain risks including that Pembina may experience volatility in revenue, and
impairments related to the book value of stored product, due to fluctuations in commodity prices. Primarily, Pembina
enters into contracts to purchase and sell crude and NGL at floating market prices. The prices of products that are
marketed by Pembina are subject to volatility as a result of such factors as seasonal demand changes, extreme
weather conditions, general economic conditions, changes in crude oil markets and other factors. Pembina manages
its risk exposure by balancing purchases and sales to lock-in margins. Notwithstanding Pembina's management of
price and quality risk, marketing margins for commodities can vary and have varied significantly from period to
period. This variability could have an adverse effect on the results of Pembina's commercial Midstream business and
its overall results of operations. To assist in effectively smoothing that variability inherent in this business, Midstream
is investing in assets that have a fee-based revenue component, and is looking to expand this area going forward.
The Midstream business is also exposed to possible price declines between the time Pembina purchases NGL
feedstock and sells NGL products, and to decreasing frac spreads. Frac spread is the difference between the sale
prices of NGL products and the cost of NGL sourced from natural gas and acquired at natural gas related prices. Frac
spreads can change significantly from period to period depending on the relationship between crude oil and natural
gas prices (the "frac spread ratio"), absolute commodity prices, and changes in the Canadian to US dollar foreign
exchange rate. There is also a differential between NGL product prices and crude oil prices which can change margins
realized for midstream products separate from frac spread ratio changes. The amount of profit or loss made on the
extraction portion of the NGL midstream business will generally increase or decrease with frac spreads. This exposure
could result in variability of cash flow generated by the NGL midstream business, which could affect Pembina and
the cash dividends of Pembina.
Pembina responds to commodity price risk by using an active Risk Management Program to fix revenues to pay for a
minimum of 50 percent of the fixed committed term natural gas supply costs. Pembina's fixed committed natural gas
supply can vary from year to year based on industry dynamics. Additionally, Pembina's Midstream business is also

Pembina Pipeline Corporation
109
exposed to variability in quality, time and location differentials and the Company may also utilize financial derivative
instruments as part of its overall risk management strategy to assist in managing the exposure to commodity price
risk as a result of these activities. The Company does not trade financial instruments for speculative purposes.
b. Foreign exchange risk
Certain of Pembina's cash flows, namely a portion of its commodity-related cash flows, certain cash flows from U.S.-
based infrastructure assets, and distributions from U.S.-based Investments in Equity Accounted Investees, are subject
to currency risk, arising from the denomination of specific cash flows in U.S. dollars. Additionally, a portion of
Pembina's capital expenditures, and contributions or loans to Pembina's U.S.-based Investments in Equity Accounted
Investees, may be denominated in U.S. dollars. Pembina monitors, assesses, and responds to these foreign currency
risks using an active Risk Management Program, which may include the exchange of foreign currency for domestic
currency at a fixed rate.
c. Interest rate risk
Pembina has floating interest rate debt which subjects the Company to interest rate risk. Pembina responds to this
risk under the active Risk Management Program to enter into financial derivative contracts to fix interest rates.
At the reporting date, the interest rate profile of the Company's interest-bearing financial instruments was:
Carrying Amounts of Financial Liability
December 31 ($ millions) 2017 2016
Fixed rate instruments 5,685 3,655
Variable rate instruments (1) 1,778 353
7,463 4,008
(1) At December 31, 2017, the Company held positions in financial derivative contracts to fix interest rates on $100 million of the underlying variable rate instruments (December 31, 2016 - $100 million).
Cash flow sensitivity analysis for variable rate instruments
A change of 100 basis points in interest rates at the reporting date would have (increased) decreased earnings by
the amounts shown below. This analysis assumes that all other variables remain constant.
December 31 ($ millions) 2017 2016
± 100 bp ± 100 bp
Variable rate instruments ±18 ±4
Interest rate swap ±1 ±1
Earnings sensitivity (net) ±17 ±3

Pembina Pipeline Corporation
110
Fair values
The fair values of financial assets and liabilities, together with the carrying amounts shown in the Consolidated
Statements of Financial Position, are as follows:
December 31, 2017 December 31, 2016
Fair Value(3) Fair Value(3)
($ millions) Carrying
Value Level 1 Level 2 Carrying
value Level 1 Level 2
Financial assets carried at fair value
Derivative financial instruments 4 4 9 9
Financial assets carried at amortized cost
Cash and cash equivalents 321 321 35 35
Trade receivables and other 529 529 451 451
Advances to related parties 42 42
Other assets 13 13 11 11
905 892 13 497 486 11
Financial liabilities carried at fair value
Derivative financial instruments(1) 79 79 123 123
Financial liabilities carried at amortized cost
Trade payables and accrued liabilities 713
713
638
638
Taxes Payable(1) 25 25 5 5
Dividends payable 91 91 64 64
Loans and borrowings(1) 7,463 7,686 4,008 4,234
Convertible debentures(2) 93 145 143 210
8,385 974 7,686 4,858 917 4,234 (1) Carrying value of current and non-current balances.
(2) Carrying value excludes conversion feature of convertible debentures. (3) The basis for determining fair value is disclosed in Note 5.
Interest rates used for determining fair value
The interest rates used to discount estimated cash flows, when applicable, are based on the government yield
curve at the reporting date plus and adequate credit spread, and were as follows:
December 31 (percents) 2017 2016
Derivatives 1.4 - 1.8 0.9 - 1.1
Loans and borrowings 2.0 - 4.7 1.9 - 4.8
Fair value of power derivatives are based on market rates reflecting forward curves.
Fair value hierarchy
The fair value of financial instruments carried at fair value is classified according to the following hierarchy based
on the amount of observable inputs used to value the instruments.

Pembina Pipeline Corporation
111
Level 1: Unadjusted quoted prices are available in active markets for identical assets or liabilities as the reporting
date. Pembina does not use Level 1 inputs for any of its fair value measurements.
Level 2: Inputs other than quoted prices included within Level 1 that are observable for the asset or liability, either
directly (i.e. as prices) or indirectly (i.e. derived from prices). Level 2 valuations are based on inputs, including
quoted forward prices for commodities, time value and volatility factors, which can be substantially observed or
corroborated in the marketplace. Instruments in this category include non-exchange traded derivatives such as
over-the-counter physical forwards and options, including those that have prices similar to quoted market prices.
Pembina obtains quoted market prices for its inputs from information sources including banks, Bloomberg
Terminals and Natural Gas Exchange. All of Pembina's significant financial instruments carried at fair value are
valued using Level 2 inputs.
The following table is a summary of the net derivative financial instruments, which is consistent with the gross
balances:
2017 2016
December 31 ($ millions) Current
Asset
Non-Current
Asset
Current Liability
Non-Current Liability Total
Current Asset
Non-Current
Asset
Current Liability
Non-Current Liability Total
Commodity, power, storage and rail financial instruments 4
(31 ) (27 ) 9
(61 ) (1 ) (53 )
Interest rate (2 ) (2 ) (3 ) (3 ) (6 )
Foreign exchange (1 ) (1 )
Conversion feature of convertible debentures (Note 14) (46 ) (46 ) (54 ) (54 )
Net derivative financial instruments 4
(79 )
(75 ) 9
(65 ) (58 ) (114 )
Sensitivity analysis
The following table shows the impact on earnings if the underlying risk variables of the derivative financial
instruments changed by a specified amount, with other variables held constant.
As at December 31, 2017 ($ millions) + Change - Change
Frac spread related
Natural gas (AECO +/- $0.25 per GJ) 4 (4 )
NGL (includes propane, butane and condensate) (Belvieu/Conway +/- U.S. $0.10 per gal) (18 ) 18
Foreign exchange (U.S.$ vs. Cdn$) (FX rate +/- $0.20) (25 ) 25
Product margin
Crude oil (WTI +/- $2.50 per bbl) (2 ) 2
NGL (includes condensate) (Belvieu/Conway +/- U.S. $0.10 per gal) N/A N/A
Corporate
Interest rate (Rate +/- 50 basis points) 0.4 (0.4 )
Power(1) (AESO +/- $5.00 per MW/h)
Conversion feature of convertible debentures (Pembina share price +/- $0.50 per common share) (1 ) 1
(1) As at December 31, 2017, there were no outstanding financial derivative contracts related to power.
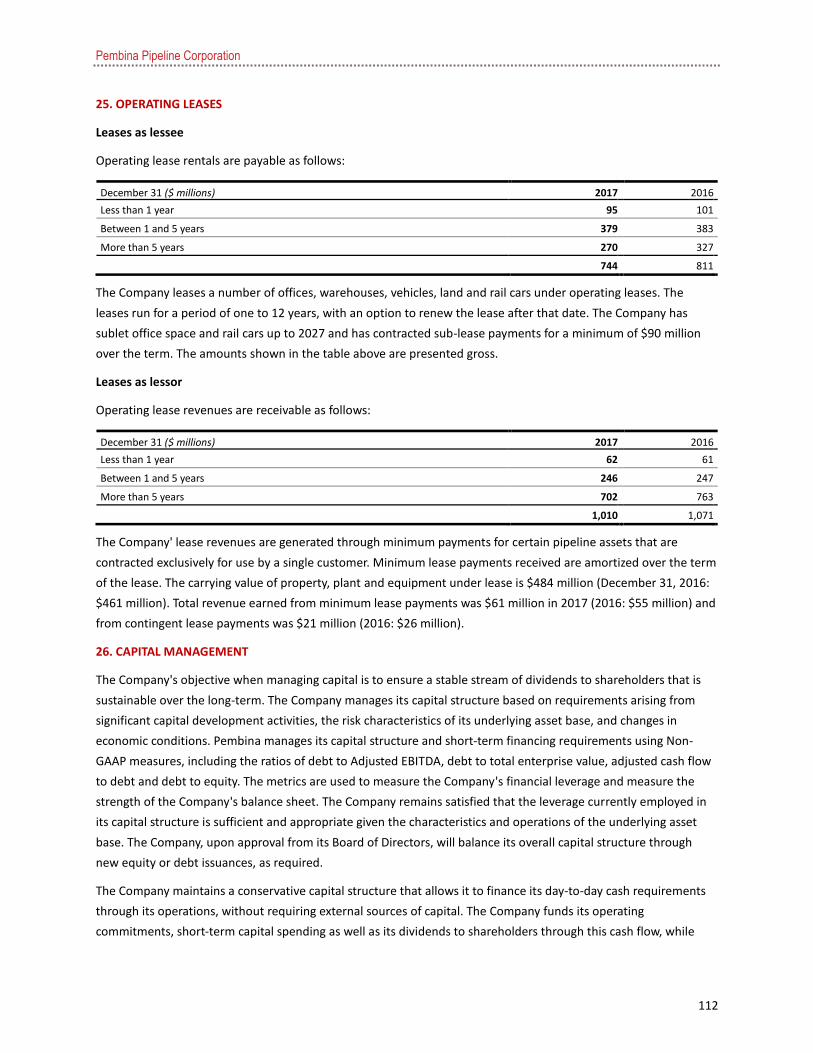
Pembina Pipeline Corporation
112
25. OPERATING LEASES
Leases as lessee
Operating lease rentals are payable as follows:
December 31 ($ millions) 2017 2016
Less than 1 year 95 101
Between 1 and 5 years 379 383
More than 5 years 270 327
744 811
The Company leases a number of offices, warehouses, vehicles, land and rail cars under operating leases. The
leases run for a period of one to 12 years, with an option to renew the lease after that date. The Company has
sublet office space and rail cars up to 2027 and has contracted sub-lease payments for a minimum of $90 million
over the term. The amounts shown in the table above are presented gross.
Leases as lessor
Operating lease revenues are receivable as follows:
December 31 ($ millions) 2017 2016
Less than 1 year 62 61
Between 1 and 5 years 246 247
More than 5 years 702 763
1,010 1,071
The Company' lease revenues are generated through minimum payments for certain pipeline assets that are
contracted exclusively for use by a single customer. Minimum lease payments received are amortized over the term
of the lease. The carrying value of property, plant and equipment under lease is $484 million (December 31, 2016:
$461 million). Total revenue earned from minimum lease payments was $61 million in 2017 (2016: $55 million) and
from contingent lease payments was $21 million (2016: $26 million).
26. CAPITAL MANAGEMENT
The Company's objective when managing capital is to ensure a stable stream of dividends to shareholders that is
sustainable over the long-term. The Company manages its capital structure based on requirements arising from
significant capital development activities, the risk characteristics of its underlying asset base, and changes in
economic conditions. Pembina manages its capital structure and short-term financing requirements using Non-
GAAP measures, including the ratios of debt to Adjusted EBITDA, debt to total enterprise value, adjusted cash flow
to debt and debt to equity. The metrics are used to measure the Company's financial leverage and measure the
strength of the Company's balance sheet. The Company remains satisfied that the leverage currently employed in
its capital structure is sufficient and appropriate given the characteristics and operations of the underlying asset
base. The Company, upon approval from its Board of Directors, will balance its overall capital structure through
new equity or debt issuances, as required.
The Company maintains a conservative capital structure that allows it to finance its day-to-day cash requirements
through its operations, without requiring external sources of capital. The Company funds its operating
commitments, short-term capital spending as well as its dividends to shareholders through this cash flow, while
Pembina Pipeline Corporation
113
new borrowing and equity issuances are primarily reserved for the support of specific significant development
activities. The capital structure of the Company consists of shareholder's equity, comprised of common and
preferred equity, plus long-term debt. Long-term debt is comprised of bank credit facilities, unsecured notes,
finance lease obligations and convertible debentures.
Pembina is subject to certain financial covenants in its credit facility agreements and is in compliance with all
financial covenants as of December 31, 2017.
Note 16 of these financial statements shows the change in Share Capital for the year ended December 31, 2017.
27. GROUP ENTITIES
Significant subsidiaries
Ownership Interest
December 31 (percentages) 2017 2016
Pembina Pipeline 100 100
Pembina West Limited Partnership 100 100
Pembina Gas Services Limited Partnership 100 100
Pembina Oil Sands Pipeline LP 100 100
Pembina Midstream Limited Partnership 100 100
Pembina Infrastructure and Logistics LP 100 100
Pembina Empress NGL Partnership 100 100
Pembina Resource Services Canada 100 100
Pembina Prairie Facilities Ltd. 100 100
Fort Chicago Pipeline II US LP 100 100
Fort Chicago Holdings II US LLC 100 100
Veresen U.S. Infrastructure Inc. 100 100
Veresen Energy Infrastructure No. 2 Inc. 100 100
28. RELATED PARTIES
All transactions with related parties were made on terms equivalent to those that prevail in arm's length
transactions.
Investments in equity accounted investees
During the fourth quarter and twelve months ended December 31, 2017, Pembina advanced $7 million and $13
million, respectively, in funds to its 50 percent owned joint venture, Canada Kuwait Petrochemical Corporation
("CKPC"). In addition, during the fourth quarter and twelve months ended December 31, 2017, Pembina advanced
US$10 million in addition to the US$13 million balance assumed on Acquisition for a total of US$23 million
advanced to its jointly controlled investment in Ruby Pipeline Holding Company L.L.C., and has additional
commitments to advance US$102 million to the same related party by March 31, 2018.
Key management personnel and director compensation
Key management consists of the Company's directors and certain key officers.
Pembina Pipeline Corporation
114
Compensation
In addition to short-term employee benefits - including salaries, director fees and short term incentives - the
Company also provides key management personnel with share-based compensation, contributes to post
employment pension plans and provides car allowances, parking and business club memberships.
Key management personnel compensation comprised:
Year Ended December 31 ($ millions) 2017 2016
Short-term employee benefits 8 5
Share-based compensation and other 7 3
Total compensation of key management 15 8
Transactions
Key management personnel and directors of the Company control less than one percent of the voting common
shares of the Company (consistent with the prior year). Certain directors and key management personnel also hold
Pembina convertible debentures and preferred shares. Dividend and interest payments received for the common
shares and debentures held are commensurate with other non-related holders of those instruments.
Certain officers are subject to employment agreements in the event of termination without just cause or change of
control.
Post-employment benefit plans
Pembina has significant influence over the pension plans for the benefit of their respective employees. No balance
payable is outstanding at December 31, 2017 (December 31, 2016: nil).
Transactions
($ millions) Transaction Value
Year Ended December 31
Post-employment benefit plan Transaction 2017 2016
Defined benefit plan Funding 16 15

HEAD OFFICEPembina Pipeline CorporationSuite 4000, 585 – 8th Avenue SWCalgary, Alberta T2P 1G1
AUDITORSKPMG LLPChartered AccountantsCalgary, Alberta
TRUSTEE, REGISTRAR & TRANSFER AGENTComputershare Trust Company of CanadaSuite 600, 530 – 8th Avenue SWCalgary, Alberta T2P 3S81.800.564.6253
STOCK EXCHANGEPembina Pipeline Corporation
Toronto Stock Exchange listing symbols for:COMMON SHARES PPLCONVERTIBLE DEBENTURES PPL.DB.FPREFERRED SHARES PPL.PR.A, PPL.PR.C, PPL.PR.E, PPL.PR.G, PPL.PR.I, PPL.PR.K, PPL.PR.M, PPL.PR.O, PPL.PR.Q, PPL.PR.S and PPL.PF.A.
New York Stock Exchange listing symbol for:COMMON SHARES PBA
INVESTOR INQUIRIESPHONE 403.231.3156FAX 403.237.0254TOLL FREE 1.855.880.7404EMAIL [email protected] www.pembina.com
Pembina Pipeline Corporationwww.pembina .com