Pelvic girdle pain and disability during and after pregnancy A cohort study
160
Pelvic girdle pain and disability during and after pregnancy A cohort study Hilde Stendal Robinson Doctoral Thesis The Faculty of Medicine Institute of Health and Society Department of Nursing and Health Sciences University of Oslo, Norway 2010
Transcript of Pelvic girdle pain and disability during and after pregnancy A cohort study
1
Pelvic girdle pain and disability during and after
pregnancy
A cohort study
Hilde Stendal Robinson
Doctoral Thesis
The Faculty of Medicine Institute of Health and Society
Department of Nursing and Health Sciences University of Oslo, Norway
2010

2

3

4
5
Contents
PAPERS I – III ........................................................................................................................ 6
1 ACKNOWLEDGEMENTS ................................................................................................. 7
2 SUMMARY ......................................................................................................................... 9
3 LIST OF PAPERS .............................................................................................................. 11
4 ABBREVIATIONS ............................................................................................................ 12
5 DEFINITIONS and TERMINOLOGY .............................................................................. 13
5.1 Pelvic Girdle Pain (PGP) ............................................................................................. 13
5.2 Low Back Pain (LBP) ................................................................................................. 13
5.3 Lumbopelvic pain ........................................................................................................ 13
5.4 Disability ..................................................................................................................... 14
6 BACKGROUND ................................................................................................................ 15
7 INTRODUCTION .............................................................................................................. 17
7.1 Prevalence of PGP ....................................................................................................... 17
7.2 Affliction ..................................................................................................................... 18
7.3 Potential causes of PGP ............................................................................................... 18
7.4 Pain distribution .......................................................................................................... 19
7.5 Clinical examinations and tests ................................................................................... 20
7.6 Risk factors for development of PGP .......................................................................... 22
7.7 Risk factors for sustained PGP postpartum ................................................................. 26
8 AIMS .................................................................................................................................. 30
9 MATERIALS AND METHODS ....................................................................................... 30
9.1 Designs ........................................................................................................................ 30
9.2 Participants and study samples .................................................................................... 35
9.3 Measurements of affliction .......................................................................................... 38
9.3.1 Disability (DRI) .................................................................................................... 38
9.3.2 Pain intensity ........................................................................................................ 39
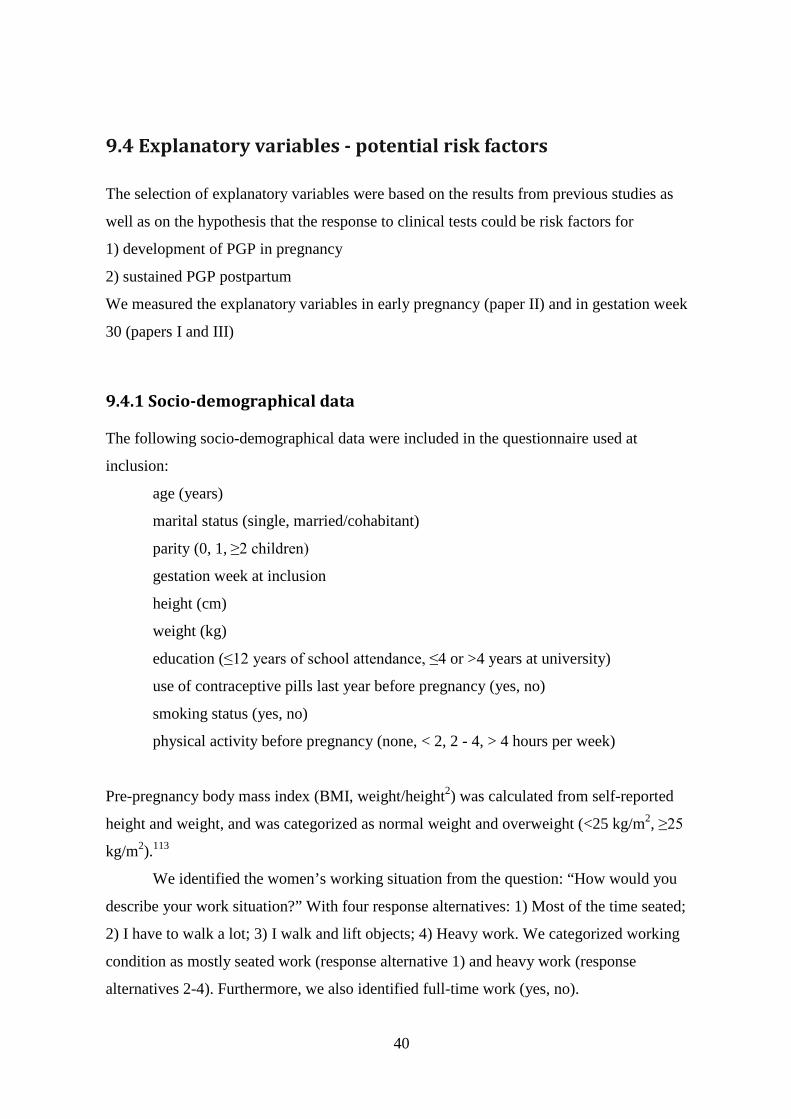
9.4 Explanatory variables - potential risk factors .............................................................. 40
9.4.1 Socio-demographical data .................................................................................... 40
9.4.2 Psychological data ................................................................................................ 41
9.4.3 Pain history and pain locations ............................................................................. 41
9.4.5 Clinical examination ............................................................................................. 43
9.5 Ethics ........................................................................................................................... 48
9.6 Sample size and power estimates ................................................................................ 48

6
9.7 Statistical analyses ....................................................................................................... 49
9.7.1 Paper I ................................................................................................................... 49
9.7.2 Paper II ................................................................................................................. 49
9.7.3 Paper III ................................................................................................................ 50
10 MAIN RESULTS ............................................................................................................. 51
10.1 Prevalence of self-reported PGP ............................................................................... 51
10.2 Disability at gestation week 30 (paper I) ................................................................... 51
10.3 Risk factors for disability and pain at gestation week 30 (paper II) .......................... 53
10.4 Risk factors for disability and pain 12 weeks postpartum (paper III) ....................... 55
11 GENERAL DISCUSSION ............................................................................................... 58
11.1 Discussion of methodological aspects ....................................................................... 58
11.1.1 Participants and study samples ........................................................................... 58
11.1.2 Design ................................................................................................................. 59
11.1.3 PGP and measures of affliction .......................................................................... 61
11.1.4 Clinical examinations and tests .......................................................................... 63
11.2 Discussion of results .................................................................................................. 65
11.2.1 Prevalence of PGP .............................................................................................. 65
11.2.2 Disability in pregnancy – a normal or pathological response?........................... 65
11.2.3 Risk factors for development of PGP and sustained PGP postpartum (papers II-III) .................................................................................................................................. 70
11.2.4 Measurement scales used in different ways ....................................................... 72
12 CONCLUSIONS .............................................................................................................. 75
13 CLINICAL IMPLICATIONS AND FURTHER RESEARCH ....................................... 76
14 EPILOG ............................................................................................................................ 77
Reference list ......................................................................................................................... 78
PAPERS I – III
APPENDIX

7
1 ACKNOWLEDGEMENTS
The work presented in this thesis was carried out at the Section for Health Science, UiO. The project was financed with the aid of the “EXTRA” funds from the Norwegian Foundation for Health and Rehabilitation, through the Norwegian Women's Public Health Association (N. K. S.), and with contributions from The Norwegian Fund for Post-Graduate Training in Physiotherapy and the University of Oslo. The completion of this thesis would not have been possible without the invaluable support of many people to whom I am deeply indebted:
I am extremely grateful to my main supervisor Professor Nina K Vøllestad. You have always provided me with highly competent advice as well as being continuously supportive and encouraging. I admire your knowledge and your work capacity! You have been of invaluable importance to my development and work. I also appreciate your friendship, generosity and genuineness throughout the years!
I also owe special thanks to Professor Anne Marit Mengshoel, who invited me to join the exciting world of research. By being my co-supervisor you have provided me with highly competent advice and support during this work. Thank you for our pleasant and valuable working periods in La Napoule.
I have really appreciated the statistical supervisions with Associated Professor Marit B Veierød, as well as enjoying our discussions and good laughs. Your skilful advice in statistical and methodological issues has been invaluable! I am impressed and very grateful about the way you involved yourself in my project.
I am very happy to be able to continue working with all three of you. My very warm thanks also go to my colleague Elisabeth K Bjelland, physiotherapist specialized in manual therapy. The way you participated in the data collection in my project was unbelievable and more than I could ever have dreamt about. Altogether, we have carried out more than 900 clinical examinations of pregnant women in this project. Thank you for your encouraging support, and for promoting the project among colleagues! I would like to express my gratitude to the maternity care units; Kolbotn, Tårnåsen and Greverud helsestasjoner (MCUs) in Oppegård municipality as well as Grønland helsestasjon (MCU) in Oslo, and all of the nice, cooperative people who work there. I really appreciated the way you all welcomed me and included me in your professional fellowship. Else Karin Myhrene and Ann-Louise Gustafsson gave me permission to recruit pregnant women from the MCUs. Heidi Arnesen, Grete Kristiansen, Tove Mols and Wenche Sjøberg helped me in the recruitment process. Wenche Mannerud kindly shared her office with me. The midwives Sigrunn Anmarkrud, Anne Karine Bergva, Eva Marie Flaathen, Hege Kaspersen and Astrid Stormoen supported me and helped me with practical tasks. Anne Karine, you always had time for me, either to give some advice or just to have a friendly conversation over a cup of tea or a glass of beer! Hege and Astrid thank you for your nice friendship and support.

8
I am very grateful to my good friend and English-speaking colleague physiotherapist Eileen Strand, who has been much helpful with the English revision of my manuscripts, and to my good friend Marit Hundseid for the excellent drawings in this thesis.
Most of my years at the Section of Health Sciences I have shared an office with Marit Helene Hem. We had different professional backgrounds, our research projects were different and in many ways our interests differed. However, we were able to find common interests, supported each other's work and had pleasurable, interesting discussions. We became good friends through our PhD periods and your friendship means a lot to me! Thank you for morning coffee, glasses of wine in the afternoons and for lots of laughter.
I would also like to thank my colleague and friend Hanne Dagfinrud, PhD physiotherapist, specialized in manual therapy; you have really been an inspiration to me! You showed me that there was a road that led from clinical work to scientific research. Working together with you has been meaningful, and we've had lots of fun during the years. Thank you for being there for me, with both your care and your valuable advice. Your support has really meant a lot!
My colleagues Britt Stuge and Eva Sigrid Bakke have offered me the interesting discussions, support, chats, and a lot of fun at the Section as well as at conferences around the world. My colleagues and PhD students at the Section, Wenche Bjorbækmo, Truls Juritzen, Gro Rugset, and Harald Vikne in particular, thank you for interesting discussions and much laughter. Professor Inger Holm and Professor Astrid Wahl, thank you for giving me good advice. A special thanks goes to Gerd Svarholt for your care and support, you know it meant a lot to me! Pernille Stendal Robinson, Kjersti Vøllestad, Einar Vøllestad and Tom Cheek, thanks for your help with plotting and proofreading of my data.
My academic career began after nearly 20 years in private physiotherapy practice, and for most of these years I have worked at Hans and Olaf Physiotherapy clinic in Oslo. I would like to express my heartfelt gratitude to all my colleagues there for their support and friendship! I am also grateful that the clinic allowed us to use their offices for the clinical examinations in this project.
During my years as a physiotherapist, and also through this project, I have met a lot
of women suffering from pelvic girdle pain during and after pregnancy that have generously contributed and shared their stories with me. An enormous thanks to all of you!
Last, but not least, I want to express my thankfulness to my friends and my family,
for being been patient with me through my busy work periods. My mum and dad who have always supported me - whatever it is that I have been doing over the years. To Roar and Pernille; your help, care, support, love, and encouragement means the most!

9
2 SUMMARY
Background: Pelvic girdle pain (PGP) is a frequently reported musculoskeletal disorder that impacts the activity level in pregnant women. However, the prevalence and severity of this condition during and after pregnancy is unsure. To gain a better insight into underlying factors potentially influencing PGP, it is of interest to examine how pelvic girdle pain and disability are associated with responses to some frequently used clinical tests.
The reported prevalence of PGP in pregnancy varies considerably in previous studies. Even though most women with PGP in pregnancy seem to recover shortly after delivery, it has been reported that a considerable number of women develop chronic PGP, resulting in pain and functional problems postpartum. Therefore, aiming at limiting negative consequences of PGP during and after pregnancy, it is important to identify risk factors for development of PGP in pregnancy as well as for sustained PGP postpartum. Previous studies have reported that typical risk factors for development of PGP include history of low back pain before pregnancy and PGP in previous pregnancies. However, it would be of interest to also identify more clinically relevant factors that could possibly be targeted by treatment strategies.
A main focus in the clinical examination of women with PGP is to distinguish between pain located in the pelvic area or in the low back area. However, in addition, it is also important to explore the associations between the responses to frequently used pelvic tests and the severity of PGP during and after pregnancy. Aims: The main objective of this thesis was to explore factors related to pelvic girdle pain and disability during and after pregnancy, and to estimate the prevalence of PGP at different times. The specific research objectives were: to examine the associations between the responses to clinical tests and disability in gestation week 30. Furthermore, to identify risk factors for development of PGP and disability during pregnancy as well as for sustained PGP and disability 12 weeks postpartum. Material and methods: A total of 326 women recruited from four maternity care units in the Oslo area gave informed consent for participation in the study. Data were collected by questionnaires and clinical examinations at inclusion (mean gestation week 15), in gestation week 30, and 12 weeks postpartum. Prospective and cross-sectional designs (gestation week 30) were used and the response variables were disability (measured by the disability rating index, DRI) and pain intensity (measured by visual analogue scale, VAS). Variables identified in previous studies (socio-demographical and psychological factors) as well as self-reported pain locations defined from pain drawings and responses to clinical tests were used as explanatory variables (risk factors in paper II and III). The data were analyzed using different statistical approaches, including tests for comparisons of groups and bivariate and multivariable regression analyses for associations. Results: Prevalence of self-reported PGP was 35%, 62% and 31% at inclusion, gestation week 30, and 12 weeks postpartum respectively. Large variation in disability (DRI) was

10
found at all times independently of the presence or absence of PGP. Pregnancy itself resulted in increased disability, and PGP gave an additive effect.
In the cross-sectional study of data from gestation week 30 multivariable analyses resulted in strong associations between pain locations within the pelvic area, responses to the posterior pelvic pain provocation (P4) test and the active straight leg raise (ASLR) test and disability.
Among the clinical factors assessed in early pregnancy, self-reported pain locations in the pelvic area, response to the P4 test, and sum of positive pain provocation tests were risk factors for disability and pain intensity in gestation week 30. In addition distress was associated to disability.
Among the clinical factors assessed in gestation week 30, the sum of positive pain provocation tests was a risk factor for both disability and pain 12 weeks postpartum. Furthermore, number of pain sites in other areas of the body was a risk factor for pain intensity 12 weeks postpartum and pre-pregnancy low back pain was a risk factor for disability. Pre-pregnancy body mass index was associated with both disability and pain intensity and response to the ASLR test was associated with disability, though none of them significantly. Conclusions: The high prevalence of PGP during and after pregnancy indicates that there is a need for attention by health care providers. The large variation in disability seen among the women at all times regardless of the presence or absence of PGP shows that pregnancy itself impacts function. Furthermore, the results support the common clinical experience that there is a large variation in affliction among women with PGP. The different risk factors identified for development of PGP in pregnancy and for sustained PGP 12 weeks postpartum emphasize a need to distinguish between these phases. The identification of clinical risk factors for PGP is a novel finding and probably of importance in further development of treatment and prevention strategies
11
3 LIST OF PAPERS
I Hilde Stendal Robinson, Anne Marit Mengshoel, Elisabeth K Bjelland, Nina K
Vøllestad.
Pelvic girdle pain, clinical tests and disability in late pregnancy
Manual Therapy, 15 (2010) 280-285
II Hilde Stendal Robinson, Marit B Veierød, Anne Marit Mengshoel, Nina K
Vøllestad. Pelvic girdle pain – associations between risk factors in early
pregnancy and disability or pain intensity in late pregnancy: a prospective
cohort study
BMC Musculoskeletal disorders, 2010
III Hilde Stendal Robinson, Anne Marit Mengshoel, Marit B Veierød, Nina K
Vøllestad. Pelvic girdle pain; potential risk factors in pregnancy in relation to
disability and pain intensity three months postpartum
Manual Therapy, 2010
12
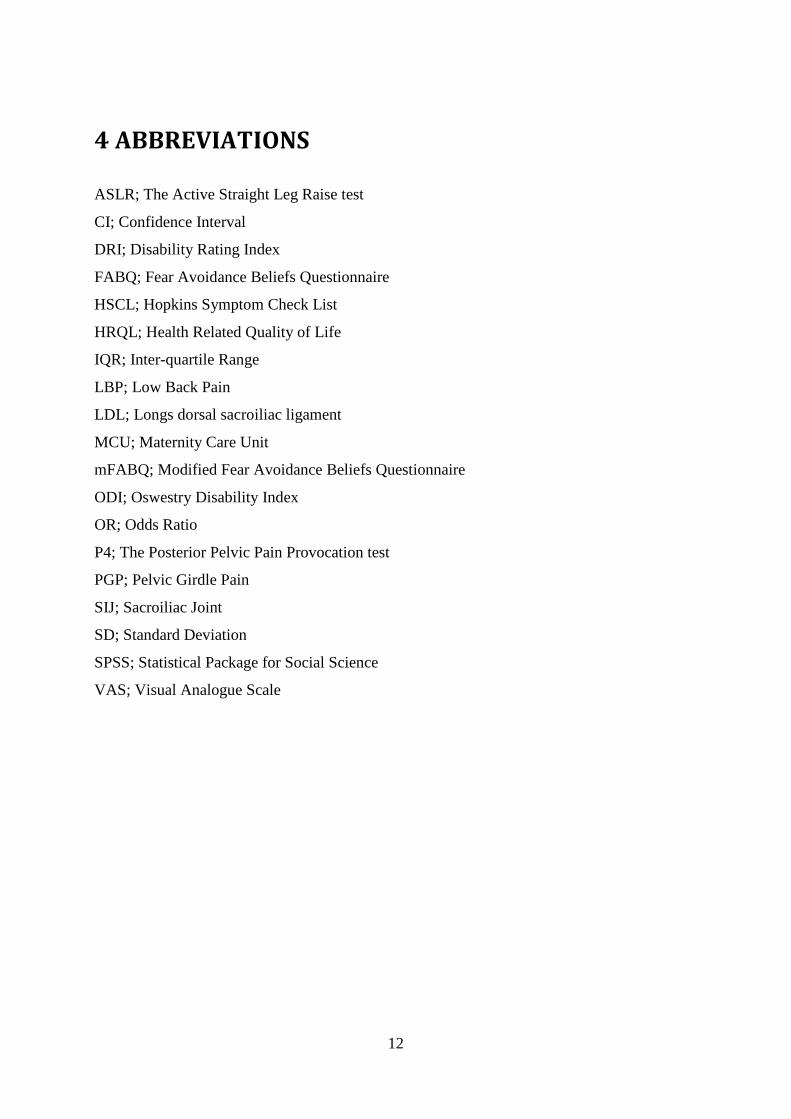
4 ABBREVIATIONS
ASLR; The Active Straight Leg Raise test
CI; Confidence Interval
DRI; Disability Rating Index
FABQ; Fear Avoidance Beliefs Questionnaire
HSCL; Hopkins Symptom Check List
HRQL; Health Related Quality of Life
IQR; Inter-quartile Range
LBP; Low Back Pain
LDL; Longs dorsal sacroiliac ligament
MCU; Maternity Care Unit
mFABQ; Modified Fear Avoidance Beliefs Questionnaire
ODI; Oswestry Disability Index
OR; Odds Ratio
P4; The Posterior Pelvic Pain Provocation test
PGP; Pelvic Girdle Pain
SIJ; Sacroiliac Joint
SD; Standard Deviation
SPSS; Statistical Package for Social Science
VAS; Visual Analogue Scale

13
5 DEFINITIONS and TERMINOLOGY
5.1 Pelvic Girdle Pain (PGP)
In this thesis PGP is understood as musculoskeletal pain located within the pelvic area (i.e.
below the lumbosacral junction and above the gluteal folds) that develops in relation to
pregnancy. The participants were asked if they had pain in the pelvic area, and eventually
where the pain was located. No Norwegian terms synonymous with PGP were used either in
the questionnaires or in the examinations. Nevertheless our understanding of PGP is in
accordance with the definition from the European guideline group of 2008:
“Pelvic girdle pain (PGP) generally arises in relation to pregnancy, trauma, arthritis
and osteoarthritis. Pain is experienced between the posterior iliac crest and the gluteal
fold, particularly in the vicinity of the sacroiliac joints. The pain may radiate in the
posterior thigh and can also occur in conjunction with/or separately in the pubic
symphysis.’’ 106
5.2 Low Back Pain (LBP)
In this thesis LBP is understood as pain in the lower back, located above the lumbo-sacral
junction with or without radiation in the leg(s). Hence our understanding of LBP is narrower
than definitions being used by others,100;109 but in accordance with a previous study of PGP.69
5.3 Lumbopelvic pain
When no specific distinction is made between LBP and PGP, the condition is referred to as
lumbopelvic pain in keeping with several studies,87;114 i.e. this definition includes both PGP
and LBP. To our understanding, this definition is in accordance with the definition of low
back pain used in the European guidelines from 2006:
“Low back pain is defined as pain and discomfort, localized below the costal margin
and above the inferior gluteal folds, with or without leg pain.” 100

14
5.4 Disability
In this thesis the term disability is used in the meaning of reduced physical function (e.g.
difficulties doing activities like outdoor walks, climbing stairs, running, carrying a bag, etc.)
15
6 BACKGROUND
Before I started my academic career, I had about 20 years of experience as a physiotherapist
and manual therapist in clinical practice, treating patients mainly with musculoskeletal
disorders. During these years, I have met many women suffering from pain in the pelvic area
during pregnancy and after delivery. The complexities in their stories as well as in their
clinical pictures gave me a number of questions to bring along into this field of research.
The main goal for treatment using physiotherapy and manual therapy is to relieve pain
and to restore or maintain the patients’ physical function.111 When treating the women with
pregnancy related pain in the pelvic area, I experienced that my treatment often fell short,
without understanding why and also that several women did not recover as expected after
delivery. Their ability to take part in daily activities and to earn a living could be reduced. My
question was: Why did some women develop chronic problems, while others recovered?
My clinical experience indicated that musculoskeletal pain in the pelvic area seemed
to have a very different influence on the women’s lives and that the condition was complex to
understand and difficult to treat. I ended up being curious about the course of pain in the
pelvic area during and after pregnancy, and I wanted to know more about risk factors for
developing such pain as well as for non-recovery after delivery. Most of all I lacked and
wanted more knowledge about risk factors that we really could manage - or treat - in clinical
practice, risk factors that could be helpful in decision making to determine who needs
treatment and who does not. I also questioned the increase in prevalence for pelvic girdle pain
(PGP) in pregnancy, which has been reported during the last 20 years. Furthermore, I
wondered whether any of my clinical tests actually could help me identify the tissue causing
the pain and tell me something about prognosis.
Before I started my work as a PhD student, I cooperated with researchers at the
Norwegian Institute of Public Health, analyzing data from a population study including
questions about PGP.80 The main result was that prevalence of PGP in pregnancy was 46% in
this cross-sectional study. Work on this paper inspired me to enroll as a doctoral student, and
to plan the cohort study together with my supervisors.
Hence, this thesis is based on my persistent curiosity about pregnant women and pain
in the pelvic area. I believe that by improving our understanding of risk factors for
development of PGP we can provide a basis for new approaches to both the prevention and
treatment of the condition. I assumed that in a prospective design not influenced by recall

16
bias, the prevalence of PGP in pregnancy would be lower than 46%.80 When introducing
clinical examinations we would also acquire more information about pain locations, the tissue
involved, and also the degree of affliction. It seemed important to find out if the clinical
examination could provide information about the development of PGP during pregnancy and
the risk for sustained problems after delivery. I thought that if we studied PGP in a cohort of
pregnant women, it would also be possible to evaluate the effect of pregnancy itself on
function and disability throughout pregnancy and in the postpartum period.

17
7 INTRODUCTION
Pregnancy is supposed to be a happy period of life for women, associated with great
expectations for the immediate future: the pregnancy period, the delivery, the child and
motherhood. Among many women it seems to be an expectation that life continues more or
less normally during pregnancy. Nevertheless, previous studies have shown that a large
number of pregnant women report PGP.35;37;48;80 This condition impacts negatively on many
of the daily activities, especially weight bearing activities such as walking and standing and
several women have problems moving around.33;37;48;80 Hence, PGP affects both the activities
of daily life and the quality of life during pregnancy.67 It has been an accepted understanding
that PGP is most frequently experienced late in pregnancy, and that it disappears after
delivery. However, studies have shown that several women do not recover as expected during
the postpartum period, but instead develop chronic pain and report significantly lower health
related quality of life than healthy women.88;89 It has also been reported that PGP is the major
cause for sick-leave among pregnant Scandinavian women,32;92;93 and the costs to society may
be great.
A better understanding of the development of PGP as well as an identification of risk
factors would be important for treatment and prevention purposes.
7.1 Prevalence of PGP
Several studies have examined the prevalence of PGP during and after pregnancy, and large
variations in the estimates have been reported (ranging from 4 % to 90 % in pregnancy).114
Furthermore, the condition has been looked upon almost as a “normal consequence of
pregnancy that the woman must endure”.33 Recently published guidelines reveal that several
studies suffer from methodological limitations such as lack of definitions of pain and
diagnostic criteria for PGP. 106 Moreover, comparison of the results between studies may be
problematic since the study designs and selection of the study population often differ. In some
studies, women with PGP may also have been overrepresented due to the procedures. The
European guideline group suggested that the prevalence of PGP in pregnancy is about
20%,106 based on four studies,5;8;48;71 and that the evidence from this estimation is strong.
However, this prevalence estimation can be questioned; since recently published studies have
reported that the prevalence of PGP late in pregnancy may be more than 50%.35;61;67
18
It has been an understanding and also a persistent assumption that pregnant women in
Scandinavia report PGP more frequently than women in other countries. Even though the
majority of studies of PGP have been carried out in this area, there are studies from several
other countries as well,9;59;63;81;99 indicating that PGP could be a more universal problem than
a purely Scandinavian one.7
Most of the women with PGP in pregnancy recover shortly after delivery, but studies
over a longer follow-up period have reported that between 5 % - 7 % of the women suffer
from sustained PGP for two years and longer after delivery.2;65 Again it is difficult to compare
results across studies, since they differ in several methodological aspects.
7.2 Affliction
PGP has an impact on the pregnant women’s function and is exacerbated due to weight
bearing activities (like walking and standing).74;106 In clinical examinations of
musculoskeletal disorders in general, the assessment of function is an important factor for
providing effective management of patients.111 Hence, it seems important also to study how,
and to what degree, PGP afflicts pregnant women. Apart from a few recently published
studies,35;67;80 previous studies have been more concerned with the prevalence of PGP than the
consequences of having PGP. In clinical practice a large amount of information is collected in
order to be able to provide patients with optimal treatment, to set relevant goals and also to
evaluate the effect of treatment.111 It is now common to view health and health related quality
of life no longer as dependent only on the individual, but rather as complex results of
biological, psychological and social factors in accordance with the International Classification
of Functioning, Disability and Health (ICF).112
When evaluating affliction from PGP it seems incomplete to only obtain data about
presence and absence of PGP, the intensity of pain as well as disability is also important.
Hence, graded scales are necessary.
7.3 Potential causes of PGP
The causes of PGP in pregnancy are not well understood, and both mechanical and hormonal
factors are suggested.3;27;46;54;72 The pelvis can be regarded as a main bony platform,
connected to the spine and legs, which have to be stabilized during weight bearing activities

19
and movement. Relaxation of the pelvic joints is seen as a normal physiological response to
pregnancy. The relation between relaxation and pain is not established, although one
empirical suggestion is that relaxation of the ligaments leads to instability of the pelvic joints
(sacroiliac joints (SIJ) and pubic symphysis), which then again leads to pain. Hence the
increased mobility in the SIJ has been understood as a cause of PGP.
There have been discussions and disagreement over the years concerning the degree of
mobility in the SIJ and the association between mobility and pain. The mobility of the SIJ is
slight and according to the work by Sturesson and co-workers, no differences in mobility
were found between symptomatic and asymptomatic SIJ when using roentgen stereo
photogrammetric analysis.90 Furthermore, they concluded that the increased mobility could
not be the cause of the pain. Later on, Damen and co-workers used Doppler imaging of
vibrations in their studies, and examined the mobility in the SIJ.19 Their results showed that
asymmetric mobility in the SIJ was associated with PGP. Nevertheless the relationship
between mobility in the pelvic joints and PGP is still unclear.
7.4 Pain distribution
The associations between pain locations and the structures possibly responsible for the pain
are not well documented or understood. Based on the understanding that relaxation of the SIJ
might be the cause of PGP, efforts have been made to explore the pain referral patterns (pain
distributions) from the SIJ.25;26 Different types of injections into the joints and adjacent areas
in combination with clinical tests and procedures have been used to examine the correlation
between pain location and clinical tests.49;51;52 The criticisms against the published pain
referral patterns from the SIJ are founded on the contention that they identify pain coming
from within the joints, rather than considering that pain might also come from extra-articular
structures close to the joints. The latter might explain why the pain distribution described in
the definition of PGP from the European Guideline group is broader than the referral map of
SIJ pain presented in previous studies.25;26;106 Based on the results from several studies
combining injections and clinical tests, Laslett and co-workers suggested that the symptoms
and signs of PGP and the SIJ are concurrent and that the results from clinical tests are
identical for the two conditions.49 Furthermore, that PGP and SIJ pain could represent the
same entity when pain in the pubic symphysis is excluded from PGP.

20
7.5 Clinical examinations and tests
The use of different criteria makes it difficult to compare diagnoses and classifications of PGP
in both research and clinical work.5;48 Usually the clinical diagnosis is made on the basis of
two sets of information: i) self reports of pain and functioning and ii) clinical findings.
Information for example on pain location, pain-provoking actions, history of low back and
pelvic girdle pain, limitations in daily activities and demographic variables are usually
collected in clinical practice as well as by interviews or questionnaires in epidemiological
studies. It has been an understanding that pain located to the area of the SIJ and/or pubic
symphysis is characteristic symptoms for PGP.106 Difficulties in walking have been reported
as a typical symptom in several studies,43;91 and have also been mentioned as diagnostic
criteria.48
The clinical examination of patients with musculoskeletal pain in general, focuses on
identifying the underlying mechanisms of the pain (pathophysiology) and the functional
status. This information is used as a guide to provide adequate treatment.16 Clinical tests are
most often used to confirm a symptom (pain) or presence of a sign (for example instability).
The underlying empirical premises are that the tests reveal information about involved
structures and mechanisms and that specific signs and symptoms need specific therapeutic
Figure 1 Front view of the pelvis. The right SIJ is shown without ligaments.
Figure 2 Back view of the pelvis. The long dorsal sacroiliac ligament (LDL) is shown on the right side.
The Coccyx The pubic symphysis
The left hip joint
The SIJ The SIJ
The LDL

21
actions. Although pain may be referred, it is commonly assumed that identification of the
structures or mechanisms involved may be a helpful method by which to identify more
homogeneous subgroups. Clinical examinations include functional tests and pain provocation
tests. The clinical examinations of women with PGP aim at obtaining further information on
pain location, pain-inducing situations, (in)stability and mobility of joints, side differences in
mobility or muscle activation and the ability of the neuromuscular system to stabilize the
pelvic joints. A number of different tests are applied both in research and in clinical practice
when examining women with PGP. The posterior pelvic pain provocation (P4) test and the
functional Active Straight Leg Raise (ASLR) test are of particular interest due to their
theoretical and empirical relevance for PGP.57;58;74
Previous studies have emphasized the importance of discriminating between pain from
the lower back and pain from the pelvic area,35;42;44;75;91 and it has been suggested that the
diagnosis of PGP can only be reached after exclusion of lumbar cause of pain, and functional
disturbances must be reproduced by specific clinical tests.106 Several tests intend to meet
these requirements. For example, the (passive) straight leg raise test, related to suspected
nerve root pain and possible involvement of the intervertebral discus, are one test used for
differential diagnostic purposes.100 The McKenzie system also has elements in their
examination procedures that are assumed to identify possible discogenic pain.21 However,
these procedures are often used in combination with pain provocation tests for the pelvic
joints,35;51;115 tests that have shown variable degree of reliability.50;79;97 The extent to which a
golden standard for validity exists may also be questioned.98 Furthermore, few of the actual
tests have been examined for their ability to discriminate between PGP and LBP, but rather
between no pain and PGP.
In general, a clinical evaluation of low back pain should be sufficient to identify red
flag conditions and to decide whether nerve root pain is present.100 Even though previous
studies have reported that the presence of sciatica in pregnancy is uncommon,47;71 this could
be important to keep in mind also when examining pregnant women.
The evidence that supports the association between the different classifications of pain
location and clinical tests as well as their association to disability in pregnant women is still
lacking. Consequently, there is a need to study these associations further.

22
7.6 Risk factors for development of PGP
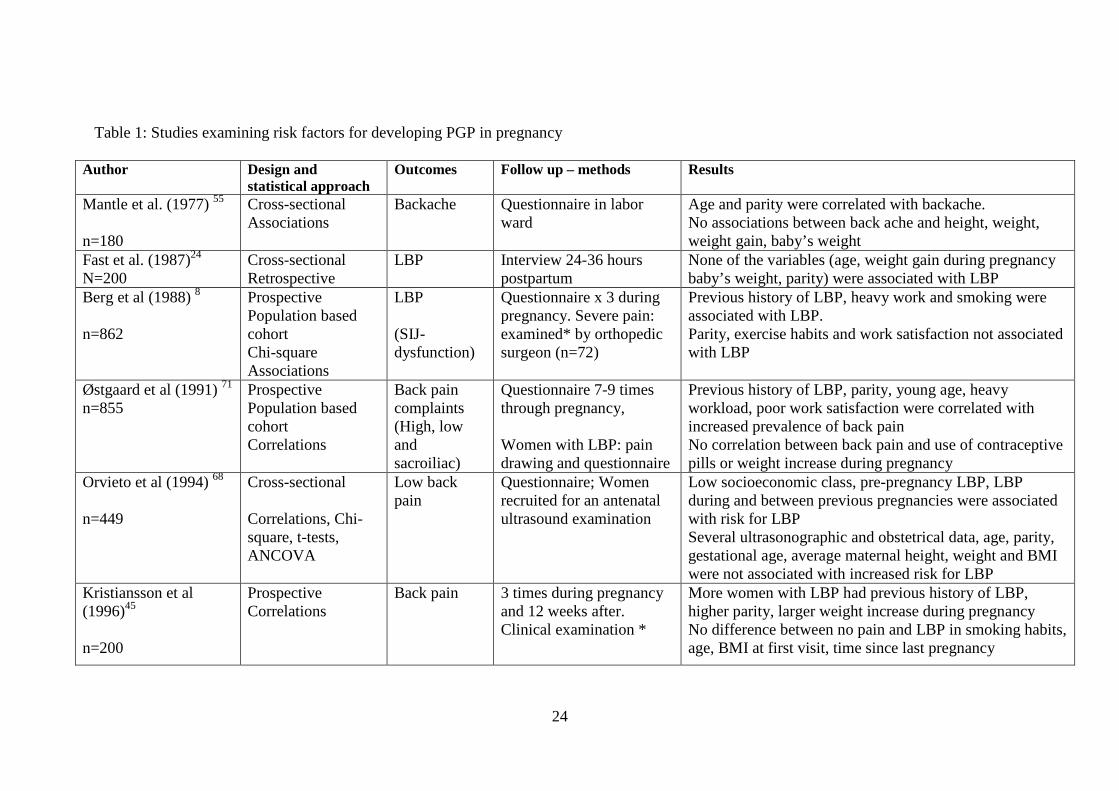
Several possible risk factors for development of PGP in pregnancy have been examined, and a
recent review reported a total of 15 possible risk factors for lumbopelvic pain (combination of
LBP and PGP) in pregnancy.114 Strong evidence was reported for strenuous work, previous
LBP, and previous PGP as risk factors. However, several of the included studies were cross-
sectional and used only bivariate statistical methods. Hence they are not methodologically
sufficient to provide information on risk factors for development of PGP, but only on
associations and correlations (table 1).
The European guideline group concluded that the risk factors for development of PGP
most probably are a history of LBP prior to pregnancy and previous trauma to the pelvis.106
Furthermore, the group stated that contraceptive pills, time interval since last pregnancy,
height, weight, smoking and most probably age were not risk factors. Again, these
conclusions must be interpreted with caution because inappropriate statistics were used in
some of the original studies (table 1).
Over the past 15 years, firm evidence has been established for the importance of fear-
avoidance beliefs and psychological distress as contributors to low back pain.15;102;110 Due to
the similarities between LBP and PGP one may hypothesize that these factors are also
important for the development of PGP. Furthermore, since PGP reportedly influences weight
bearing activities, fear of increased pain due to activity may be an important risk factor. For LBP
the effect of fear avoidance beliefs is seen even at very early stages of the clinical course,14;31
suggesting that it may be important to investigate whether these factors are present in early
pregnancy and represents risk for development of PGP. It has been suggested that low back
disability is causally related more to fear avoidance than to pain or physical pathology,109 but
similarly, this has not been examined for PGP. Grotle and co-workers compared the level of
fear- avoidance beliefs and distress in acute and chronic LBP.31 The level of fear-avoidance
beliefs and distress were lower in patients with acute LBP for the first time compared with
patients with chronic LBP. Furthermore, fear-avoidance beliefs and distress were associated
with disability in both acute and chronic LBP. According to the European Guideline group,
the role of “yellow flags” has not been investigated among PGP patients, but, “based on the
present limited knowledge, the impression is that yellow flags are less common among
patients with PGP than with LBP”.106 One recently published study reported that in early
pregnancy women with lumbopelvic pain reported higher levels of exaggerated negative
thoughts and fear-avoidance beliefs than women without pain.66 To our knowledge, fear
23
avoidance and distress have not been examined as risk factor for either the development of
PGP in pregnancy or for sustained PGP postpartum.
Information from the patient’s history and the clinical examination form the basis for
diagnosis and management strategies in clinical work with patients, but there has been little
focus on responses to clinical tests as potential risk factors for development of PGP.
Nevertheless, risk factors could be more useful in the clinical work if they were helpful in
development of priority strategies for prevention and treatment. Hence, most of the suggested
risk factors from previous studies would be of little help.
24
Table 1: Studies examining risk factors for developing PGP in pregnancy
Author Design and statistical approach
Outcomes Follow up – methods Results
Mantle et al. (1977) 55 n=180
Cross-sectional Associations
Backache Questionnaire in labor ward
Age and parity were correlated with backache. No associations between back ache and height, weight, weight gain, baby’s weight
Fast et al. (1987)24 N=200
Cross-sectional Retrospective
LBP Interview 24-36 hours postpartum
None of the variables (age, weight gain during pregnancy baby’s weight, parity) were associated with LBP
Berg et al (1988) 8 n=862
Prospective Population based cohort Chi-square Associations
LBP (SIJ- dysfunction)
Questionnaire x 3 during pregnancy. Severe pain: examined* by orthopedic surgeon (n=72)
Previous history of LBP, heavy work and smoking were associated with LBP. Parity, exercise habits and work satisfaction not associated with LBP
Østgaard et al (1991) 71 n=855
Prospective Population based cohort Correlations
Back pain complaints (High, low and sacroiliac)
Questionnaire 7-9 times through pregnancy, Women with LBP: pain drawing and questionnaire
Previous history of LBP, parity, young age, heavy workload, poor work satisfaction were correlated with increased prevalence of back pain No correlation between back pain and use of contraceptive pills or weight increase during pregnancy
Orvieto et al (1994) 68 n=449
Cross-sectional Correlations, Chi-square, t-tests, ANCOVA
Low back pain
Questionnaire; Women recruited for an antenatal ultrasound examination
Low socioeconomic class, pre-pregnancy LBP, LBP during and between previous pregnancies were associated with risk for LBP Several ultrasonographic and obstetrical data, age, parity, gestational age, average maternal height, weight and BMI were not associated with increased risk for LBP
Kristiansson et al (1996)45 n=200
Prospective Correlations
Back pain 3 times during pregnancy and 12 weeks after. Clinical examination *
More women with LBP had previous history of LBP, higher parity, larger weight increase during pregnancy No difference between no pain and LBP in smoking habits, age, BMI at first visit, time since last pregnancy

25
Larsen et al (1999) 48 n=1600 (followed afflicted women, n=227)
Prospective Logistic regression
Symptom giving pelvic girdle relaxation
Questionnaires, repeatedly: 227 of 1600 fulfilled criteria of pelvic pain and were examined* by rheumatologist
Risk factors: Previous history of LBP, pelvic pain in previous pregnancy, previous low abdominal pain, lack of exercise, bad working conditions No risk: Age, weight, carrying heavy loads at work, parity, smoking
Mogren and Pohjanen (2005) 62 n=891
Cross-sectional Logistic regression
Low back and pelvic pain (LBPP)
Questionnaire after delivery
Increasing parity, history of hypermobility, BMI and amenorrhea were associated with LBBP
Age at menarche, use of oral contraceptive were not associated with LBPP
Albert et al (2006) 4 n=2269
Cross-sectional Retrospective Logistic regression
PGP (subgroups based on pain locations)
Questionnaire and clinical examination* in gestation week 33
Previous history of LBP, previous trauma of back/pelvis, parity, higher level of stress, low job satisfaction were associated with development of PGP Age, marital status, full-time work, contraceptive pills, previous stillbirth, interval between pregnancies, hormonal induced pregnancy, urinary tract infection, less desire to become pregnant, BMI>30 were not associated with PGP
* The women were examined, but results of clinical examinations were not used as potential risk factor for PGP/LBP in the analyses

26
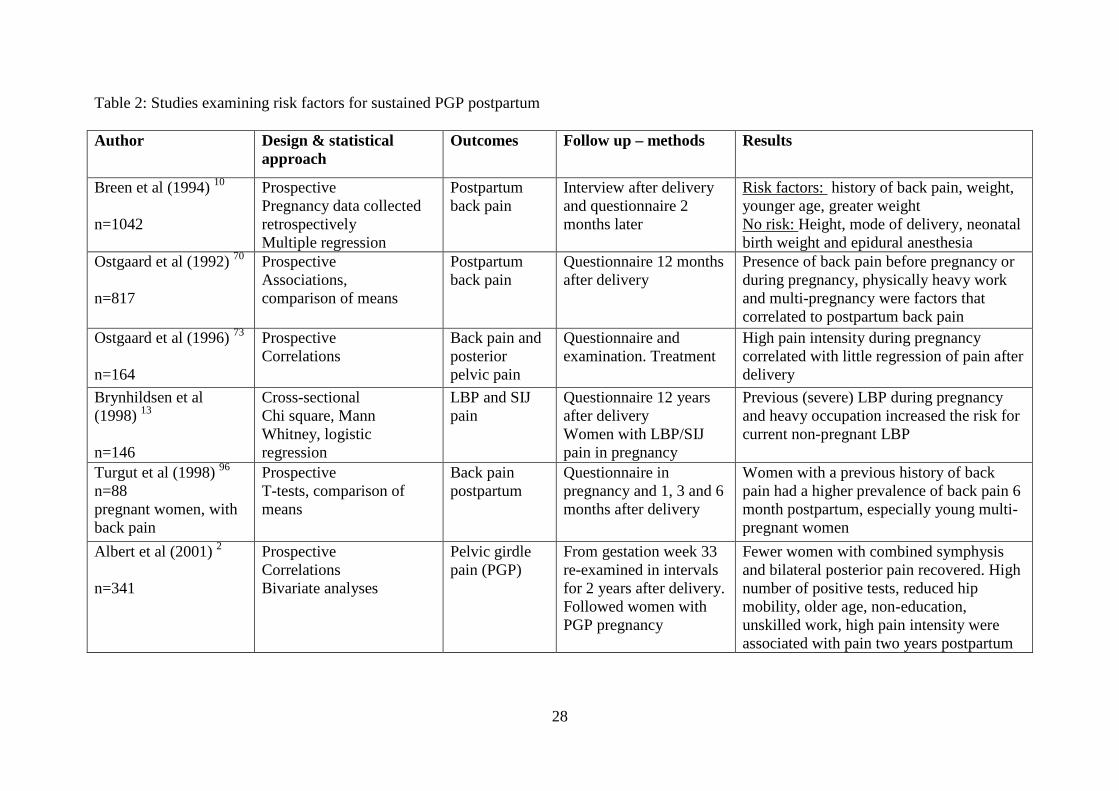
7.7 Risk factors for sustained PGP postpartum
The European Guideline group concluded that the prevalence of PGP is about 20% in
pregnancy and rapidly declines to about 7% three months postpartum.106 This leaves a rather
high number of women suffering from PGP after delivery, and thus underscores the
importance of identifying risk factors for non-recovery. One of the main reasons for
identifying risk factors for development of chronic pain conditions is to be able to develop
prevention strategies. PGP represents large costs for society; hence, a reduction in the
number of women with chronic pain would be beneficial both for the women themselves
and for the society as a whole. Studies of risk factors for sustained PGP postpartum have
identified some of the same risk factors as for development of PGP during pregnancy.106;114
History of back pain before pregnancy or during a previous pregnancy, high pain scores in
pregnancy, reduced mobility in the hip joints and low social status are all identified as risk
factors for sustained PGP after delivery (table 2). However, these studies are impaired by
the use of different terminology and different definitions of pain locations, making it
difficult to compare the results. Furthermore, methodological weaknesses and inappropriate
statistics in several of the studies, render their conclusions on risk factors for sustained PGP
postpartum insufficient.
It seems that little effort has been made to try to identify clinical risk factors for
sustained PGP postpartum, and only a few studies have been found. Albert and co-workers
divided PGP in pregnancy into sub-groups according to pain locations within the pelvic area.2
Having pain in all three pelvic joints late in pregnancy was associated with a markedly worse
prognosis after delivery than for other pain locations. Furthermore, a large number of positive
clinical tests in late pregnancy gave high relative risk for persistent pain at two-year follow-up.
Gutke and co-workers have identified combined LBP and PGP in pregnancy as a risk factor
for sustained pain postpartum.36 Vøllestad and Stuge identified high scores on the ASLR
test and low score on beliefs in improvement three months postpartum as risk factors for
non-recovery one year after delivery.108
It is of importance to examine if there are clinical factors present in pregnancy that
are associated with sustained PGP postpartum. This information could be used to develop
strategies that can prevent further development of chronic conditions. This is important for
the women themselves as well as for health personnel concerned about women’s health after
pregnancy. Hence, it is a need for further studies that also include responses to clinical tests

27
as potential risk factors for sustained PGP postpartum. These should be prospective-design
studies including appropriate statistics.
28
Table 2: Studies examining risk factors for sustained PGP postpartum Author Design & statistical
approach Outcomes Follow up – methods Results
Breen et al (1994) 10 n=1042
Prospective Pregnancy data collected retrospectively Multiple regression
Postpartum back pain
Interview after delivery and questionnaire 2 months later
Risk factors: history of back pain, weight, younger age, greater weight No risk: Height, mode of delivery, neonatal birth weight and epidural anesthesia
Ostgaard et al (1992) 70 n=817
Prospective Associations, comparison of means
Postpartum back pain
Questionnaire 12 months after delivery
Presence of back pain before pregnancy or during pregnancy, physically heavy work and multi-pregnancy were factors that correlated to postpartum back pain
Ostgaard et al (1996) 73 n=164
Prospective Correlations
Back pain and posterior pelvic pain
Questionnaire and examination. Treatment
High pain intensity during pregnancy correlated with little regression of pain after delivery
Brynhildsen et al (1998) 13 n=146
Cross-sectional Chi square, Mann Whitney, logistic regression
LBP and SIJ pain
Questionnaire 12 years after delivery Women with LBP/SIJ pain in pregnancy
Previous (severe) LBP during pregnancy and heavy occupation increased the risk for current non-pregnant LBP
Turgut et al (1998) 96 n=88 pregnant women, with back pain
Prospective T-tests, comparison of means
Back pain postpartum
Questionnaire in pregnancy and 1, 3 and 6 months after delivery
Women with a previous history of back pain had a higher prevalence of back pain 6 month postpartum, especially young multi-pregnant women
Albert et al (2001) 2 n=341
Prospective Correlations Bivariate analyses
Pelvic girdle pain (PGP)
From gestation week 33 re-examined in intervals for 2 years after delivery. Followed women with PGP pregnancy
Fewer women with combined symphysis and bilateral posterior pain recovered. High number of positive tests, reduced hip mobility, older age, non-education, unskilled work, high pain intensity were associated with pain two years postpartum

29
To and Wong (2003)95 n=326 women, singleton pregnancies
Prospective, observational cohort Associations Chi-square, t-tests, Mann-Whitney
Back pain (BP) Questionnaire in early postpartum (surveyed LBP in pregnancy retrospectively) and 24 months after delivery
Previous episodes of BP before or during pregnancy were associated with BP in pregnancy. Severe pain in early gestation and inability to reach pre-pregnancy weight were associated with BP 2 years postpartum
Mogren (2006) 61 n=639 women
Follow-up women with LBPP T-tests and Chi-square, logistic regression
LBPP (low back and pelvic pain)
Questionnaire just after delivery, and 6 months postpartum
BMI, hyper mobility, level and onset of pain during pregnancy were risk factors for persistent LBPP postpartum. Parity, gestational age, birth weight were not associated with persistent LBPP
Rost et al (2006) 82 n=430 pelvic pain patients
Follow up study Logistic regression
Pelvic pain Questionnaire to women who delivered less that 42 months prior to follow-up (mean 18 months)
Pre-pregnancy back pain, severity of complaints, number of walking deficiencies as primary referral, duration of labor showed significant relation with symptoms in bivariate analyses. Only duration of labor in multivariable analysis
Vollestad & Stuge* (2008) 108 n=95, women with PGP
Prospective Multivariable regression analyses
PGP Pain and disability
Examined when included into the study (postpartum) and one year after treatment
ASLR test* and low score on beliefs in improvement were risk factors for non-recovery
Gutke et al (2008) 36 n=308
Prospective cohort study Multiple logistic regression methods
No pain, LBP, PGP, combined LBP/PGP
Examined in gestation week 12-18, sub grouped according to pain location and clinical examination**
Women with combined LBP/PGP had lower degree of recovery. Low endurance of back flexors, older age, LBP/PGP in early pregnancy, work dissatisfaction were risk factors for persistent PGP or LBP/PGP postpartum
*The only study identifying response to a clinical test as risk factor ** Response of clinical tests were not examined as possible risk factors for sustained PGP, LBP PGP/LBP, however pain locations were used.

30
8 AIMS
The main objective of the research presented in this thesis was to explore factors related to
pelvic girdle pain and disability during and after pregnancy and to estimate the prevalence of
PGP at different time points. The specific research objectives of the three papers were:
1. To examine the associations between pain locations, responses to the posterior pelvic
pain provocation (P4) test and the functional active straight leg raise (ASLR) test as
well as their associations with disability in gestation week 30 (paper I).
2. To identify socio-demographical, psychological and clinical risk factors in early
pregnancy for disability and pain in gestation week 30 (paper II)
3. To identify risk factors in late pregnancy among women with PGP, for sustained
disability and pain 12 weeks postpartum (paper III)
9 MATERIALS AND METHODS
9.1 Designs
The present thesis reports data from a large longitudinal study following a cohort of women
from their first visit at the maternity care units (MCU), through their pregnancy period and up
until one year postpartum. Data were collected at inclusion (mean gestation week 15), in
gestation week 30 and 36, 6 and 12 weeks postpartum and one year postpartum. The present
thesis includes three papers. In paper I a cross-sectional design was used analyzing data from
gestation week 30. In paper II we used a prospective longitudinal design with one follow-up
in pregnancy, analyzing data from inclusion and gestation week 30. In paper III we used a
prospective longitudinal design with one follow-up postpartum, analyzing data from gestation
week 30 and 12 weeks postpartum.
Figure 3 and 4 show flow charts of the entire study and the participants studied in the
present thesis.

31
Figure 3: Flow chart over the time points for data collection of the entire study, and for the data included in the present thesis and the three papers. * Data from gestation week 28 was used for selection of women for examination in gestation week 30. **Data from gestation week 36, 6 weeks, and 1 year postpartum were not used in the papers in the present thesis.
Paper I PGP; clinical tests and disability in late pregnancy Cross-sectional design
Paper II PGP; associations between risk factors in early pregnancy and disability or pain intensity in late pregnancy Longitudinal design; one follow-up in pregnancy
Paper III PGP; potential risk factors in pregnancy in relation to disability and pain intensity three months postpartum Longitudinal design – one follow-up 12 weeks postpartum
Gestation week 5 – 24 first visit at MCU (mean gestation week 15)
Questionnaire Clinical examination
Gestation week 28*
Screening questionnaire; concerning pain location and symptoms
Gestation week 30
Questionnaire Clinical examination
Gestation week 36**
Questionnaire
6 weeks post partum** Questionnaire
12 weeks post partum
Questionnaire Clinical examination
Coho
rt s
tudy
, inc
ludi
ng 3
26 p
regn
ant
wom
en
1 year postpartum**
Questionnaire

32
385 eligible pregnant women from 4 Maternity Care Units
59 declined participation
326 women Questionnaire and clinical
examination
314 women
9 miscarriages 3 drop-outs
283 women Questionnaire and clinical
examination
31 women Questionnaire
only Ges
tati
on w
eek
30
4 miscarriages 11 drop-outs
12 w
eeks
po
stpa
rtum
26 women Questionnaire
only
273 women Questionnaire and clinical
examination
Incl
usio
n
(Mea
n ge
stat
ion
wee
k 15
)
Figure 4: Flow chart showing the participants in the cohort study from inclusion to 12 weeks postpartum

33
Prior to the data collection, we composed the questionnaires for the study and included
standardized questionnaires on health, health status, health locus of control, distress, fear-
avoidance beliefs, and disability used in previous studies. In addition we included questions
about socio-demographics, about pain and the locations of the pain. The contents of the
questionnaires were discussed with experts on PGP, and tested out by letting 4 pregnant
women fill them in, as a control for validity and feasibility. The questionnaires used at
inclusion, in gestation week 30, and 12 weeks postpartum contained almost the same
elements, expect for the socio-demographical variables (table 3).
The clinical examinations included six pain provocation tests for the pelvic joints as
well as the functional active straight leg raise (ASLR) test. It also included Beighton score for
hypermobility (only at inclusion), as well as general functional, mobility and stability tests.
The clinical examinations in gestation week 30 and 12 weeks postpartum were identical,
except for the examination of hypermobility (table 4).
Table 3: Contents of the questionnaires
Inclusion Gestation week 30 12 weeks postpartum
Socio-demographical data X
Modified FABQ X X X
SF-36* X X X
NHP* X X X
Health Locus of control scale* X
HSCL-25 X X X
DRI X X X
Physical activity X X X
Questions about PGP and LBP X X X
Complaints X X X
* Data not used in the papers of this thesis.
FABQ, fear avoidance beliefs; SF-36, Short form - 36; NHP, Nottingham Health Profile; HSCL-25, Hopkins symptom check list; DRI, disability rating index; PGP, pelvic girdle pain; LBP, low back pain.

34
Table 4: Overview of the clinical tests included in the examinations Inclusion Gestation
week 30
12 weeks
postpartum
Beighton score for hypermobility X
Fingertip-to-floor distance* X X X
Schober’s test* X X X
Modified Trendelenburg’s test#* X X X
ASLR test# X X X
P4 test# X X X
Patrick Faber test# X X X
Compression test# X X X
Distraction test X X X
Palpation of LDL# X X X
Palpation of pubic symphysis X X X
Joint play of SIJ#* X X X
* data not used in the papers in this thesis # performed on both sides
ASLR, active straight leg raise; P4, posterior pelvic pain provocation; LDL, long dorsal sacroiliac ligament; SIJ, sacroiliac joints
Used as sum of pain provocation tests (0-8) in the analyses

35
9.2 Participants and study samples
The Norwegian public health service offers all women free health service during pregnancy
and most women visit special maternity care units (MCUs) for this purpose. We collaborated
with four MCUs in the Oslo area; one was located in central Oslo (the capital city, about
580 000 inhabitants) whereas the other three covered one entire community just outside Oslo
(about 24 000 inhabitants).
All Norwegian-speaking women signing in at these four MCUs between January 2006
and June 2007 were consecutively invited to participate by the personnel at the MCU. Women
not expected to have a normal pregnancy (as determined by the midwives) as well as women
presenting at high gestational age were excluded. Out of 385 eligible women, 326 gave their
informed consent for participation after getting oral and written information about the study.
At inclusion all women answered a comprehensive questionnaire and were clinically
examined by one out of two physiotherapists with post-graduate education in manual therapy.
The examinations were performed at the respective MCU or at Hans and Olaf Physiotherapy
clinic, located in the center of Oslo. To reduce bias, the examiner was not given access to any
questionnaire data.76
The next examination of the women was carried out in gestation week 30. We
examined women with symptoms from the low back or pelvic area, as well as women without
PGP. The selection of women was based on a short questionnaire, including three questions
about low back and pelvic pain, distributed by the midwives and answered by the women in
gestation week 28. To be selected for a new examination in gestation week 30, the women
had to report pain located in the pelvic area or low back area once a week or more, and the
pain had to be provoked by sitting, standing or walking. Healthy women without these
symptoms were also selected. This resulted in the exclusion of 31 women (9 %) who were not
examined in gestation week 30, but questionnaire data were obtained and they continued in
the cohort. Several of these women had minor symptoms from the area in question, but did
not meet the entire set of criteria. This group ended up smaller than expected, because more
women than expected had symptoms of PGP. In retrospect we found that examining all
women at all times would have been possible. The handling of the selection was done by an
external person, and the therapists carrying out the examinations were not given access to this
information. Following this procedure, we called 290 of the 326 women for a new clinical
examination in gestation week 30. Of these, 283 met and constituted the study sample in
paper I.

36
Out of the 326 women in the cohort, 280 had been included before they reached
gestation week 20 and were thus defined as being in early pregnancy. Nine of them had a
miscarriage and three were drop-outs before gestation week 30. Since paper II aimed at
identifying risk factors for development of disability and pain, the 268 remaining women
constituted the study sample in paper II.
In paper III we aimed at identifying risk factors for non-recovery 12 weeks postpartum
among women with PGP in late pregnancy. Hence, we needed criteria for constituting this
group, and we decided to use self-reported pain combined with a level of disability. The 283
women who met for a new clinical examination in gestation week 30 were defined as afflicted
if: 1) they reported to have PGP (yes, no) and/or had marked in the pelvic area on the pain
drawing, and 2) they had a DRI score above the 25 percentile for the 283 women being
examined in gestation week 30 (DRI>22). Both criteria were required, and resulted in 179
women afflicted with PGP and these women constituted the study sample in paper III.
Table 5 shows the characteristics of the total number of women in the cohort, the
samples used for the different papers, as well as for the women that declined participation.
There were only marginal differences between the groups.

37
Table 5: Characteristics of participants in the cohort and the different study samples used in the papers, and of those that declined participation
Whole cohort
n=326
Paper I
n=283
Paper II
n=268
Paper III
n=179
Non-participants,
n=59
Mean
(SD)
n (%) Mean
(SD)
n (%) Mean
(SD)
n (%) Mean
(SD)
n (%) Mean
(SD)
n (%)
Gestation age
(weeks)
15 (5) 15 (5) 14 (3) 15 (4) 16 (5)
Age (years) 31.5 (4.2) 31.3 (4.2) 31.3 (4.1) 31.3 (4.4) 30.7 (4.7)
Weight (kg) 67 (11) 67 (11) 67 (11) 67 (11) -
BMI (kg/cm2) 23.4 (3.5) 23.4 (3.5) 23.3 (3.5) 23.6 (3.7) -
Education
(years)
16 (2) 16 (3) 16 (3) 16 (3) -
Employed 303 (93) 240 (85) 228 (85) 164 (92) 54 (92)
On sick leave at
inclusion
62 (19) 54 (19) 49 (18) 43 (24) -
Smoker 15 (5) 12 (4) 11 (4) 9 (5) -
Parity 0 196 (60) 167 (59) 157 (59) 98 (55) 26 (44)
1 103 (32) 92 (33) 86 (32) 64 (36) 30 (51)
≥2 27 (8) 24 (8) 25 (9) 17 (9) 3 (5)
BMI, body mass index

38
9.3 Measurements of affliction
In paper I we used disability as a response variable, assessed by the Disability Rating Index
(DRI) in gestation week 30. In paper II we used two graded scales as response variables,
DRI and pain intensity (worst evening pain) assessed in gestation week 30. In paper III we
used the same two graded scales; DRI and pain intensity (worst evening pain), measured 12
weeks postpartum, as response variables. In addition we also used a dichotomous response
variable in paper III based on a combination of pain in the pelvic area and DRI. Salèn and
co-workers reported that in a population of healthy persons with minor ailments the median
value of DRI was 8.7 points (IQR 15.4).83 Based on this, a cut-off of ten was chosen as a
reasonable distinction between recovered and non-recovered women 12 weeks postpartum.
The women in the present cohort were defined as non-recovered if 1) self-reported PGP
and/or markings in the pelvic area on the pain drawing were present and 2) DRI was above
10.83 This variable was assumed to distinguish those with affliction to a certain level from
the others. The use of response variables are shown in table 6 and described below.
Table 6: Overview of the response variables used in the different papers Paper I Paper II Paper III
DRI, gestation week 30 X X
Pain intensity (VAS), gestation week 30 X
DRI, 12 weeks postpartum X
Pain intensity (VAS), 12 weeks postpartum X
Recovered (yes/no)* X
*Non-recovered was defined as pain in the pelvic area combined with DRI>10 points
DRI, disability rating index; VAS, visual analogue scale.
9.3.1 Disability (DRI)
To our knowledge, none of the existing questionnaires for measuring disability have been
made especially for PGP. Previous studies of PGP have used different disability
questionnaires, most often designed for use on patients with LBP. The Oswestry Disability
Index (ODI) is widely used in back pain populations,23 and it has also been used in studies
of women with PGP.35;88;89;108 However, all the questions included in the ODI are associated
39
with pain, and we considered it difficult for the women to give meaningful information if
pain was not present. The latter would be the case for several of the women in the cohort.
In order to allow assessment of disability in women with and without PGP, we chose
to use the DRI in the present cohort study.83 DRI measures disability by assessing
limitations in daily activities independent of pain. As for ODI, it was also primarily
designed for patients with back pain. Although DRI has been less frequently used than the
ODI, it has been used in studies of pregnant women before.45;67;88 We evaluated the items as
suitable for pregnant women with PGP or LBP as well as for pregnant women without pain.
DRI consists of 12 items scoring the ability to perform activities of daily living (dressing
without help, outdoor walks, climbing stairs, sitting for a longer time, standing bent over a
sink, carrying a bag, making a bed, running, doing light work, doing heavy work, lifting
heavy objects, participating in exercise/sport). The items were scored on visual analogue
scales (VAS) ranging from 0 – 100 mm, with end points “ability to perform activity without
restriction” and “inability to perform the activity”. We calculated DRI as the mean of the
twelve scales. Some of the criticism against using DRI in pregnancy is founded on the
objection that it includes activities that pregnant women tend to stop doing (running for
example); hence, a high score on DRI could be the result of pregnancy and not necessarily
of PGP.45;66;67 By including women independent of the presence or absence of PGP, our
intention was to measure the possible effect of pregnancy on function as well as the
additional effect of PGP. Furthermore, our clinical experience told us that women of today
are increasingly likely to continue with their usual physical activities during pregnancy, and
we expected that DRI could also be suitable to mirror this.
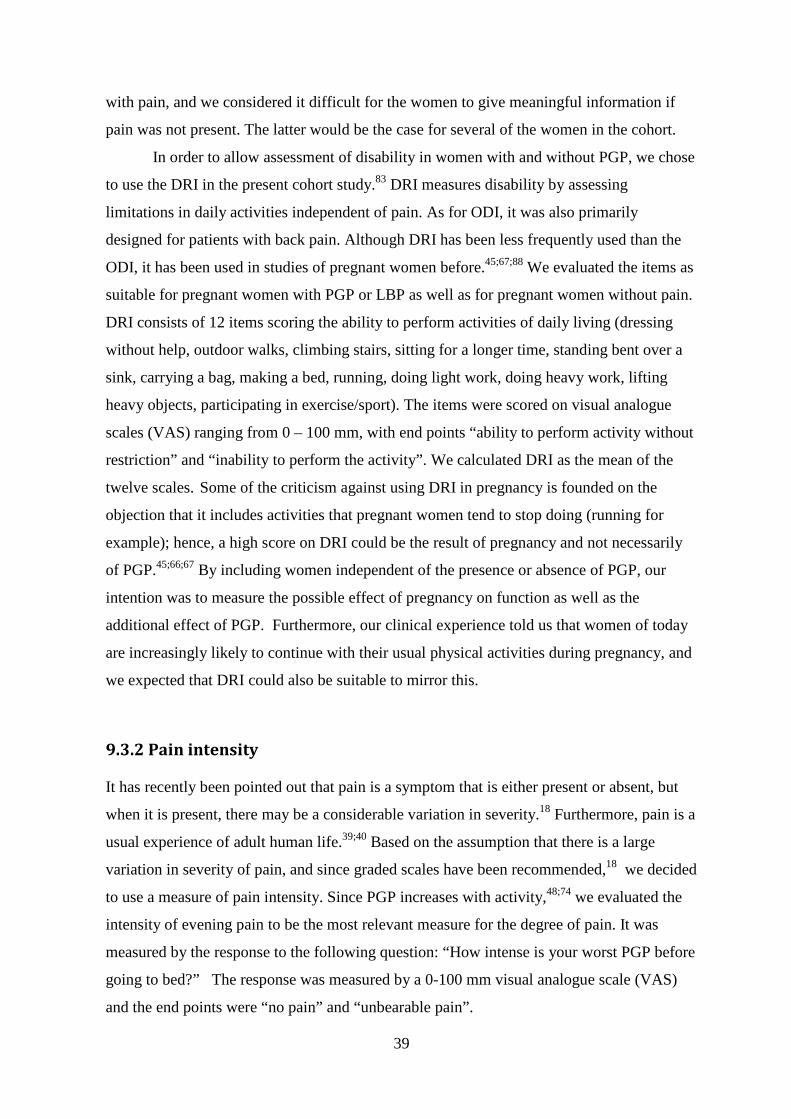
9.3.2 Pain intensity
It has recently been pointed out that pain is a symptom that is either present or absent, but
when it is present, there may be a considerable variation in severity.18 Furthermore, pain is a
usual experience of adult human life.39;40 Based on the assumption that there is a large
variation in severity of pain, and since graded scales have been recommended,18 we decided
to use a measure of pain intensity. Since PGP increases with activity,48;74 we evaluated the
intensity of evening pain to be the most relevant measure for the degree of pain. It was
measured by the response to the following question: “How intense is your worst PGP before
going to bed?” The response was measured by a 0-100 mm visual analogue scale (VAS)
and the end points were “no pain” and “unbearable pain”.
40
9.4 Explanatory variables - potential risk factors
The selection of explanatory variables were based on the results from previous studies as
well as on the hypothesis that the response to clinical tests could be risk factors for
1) development of PGP in pregnancy
2) sustained PGP postpartum
We measured the explanatory variables in early pregnancy (paper II) and in gestation week
30 (papers I and III)
9.4.1 Socio-demographical data
The following socio-demographical data were included in the questionnaire used at
inclusion:
age (years)
marital status (single, married/cohabitant)
parity (0, 1, ≥2 children)
gestation week at inclusion
height (cm)
weight (kg)
education (≤12 years of school attendance, ≤4 or >4 years at university)
use of contraceptive pills last year before pregnancy (yes, no)
smoking status (yes, no)
physical activity before pregnancy (none, < 2, 2 - 4, > 4 hours per week)
Pre-pregnancy body mass index (BMI, weight/height2) was calculated from self-reported
height and weight, and was categorized as normal weight and overweight (<25 kg/m2, ≥25
kg/m2).113
We identified the women’s working situation from the question: “How would you
describe your work situation?” With four response alternatives: 1) Most of the time seated;
2) I have to walk a lot; 3) I walk and lift objects; 4) Heavy work. We categorized working
condition as mostly seated work (response alternative 1) and heavy work (response
alternatives 2-4). Furthermore, we also identified full-time work (yes, no).

41
9.4.2 Psychological data
The Hopkins Symptom Check List (HSCL-25) was used to measure distress (self-reported
symptoms of anxiety, depression and somatization).78 Twenty-five symptoms were recorded
on a scale from 1 (not bothered) to 4 (extremely bothered). We calculated the average value
to obtain the HSCL-25 score and used a cut-off value of 1.75 as established for women by
Sandanger and co-workers (1998).84 The cut-off value reflected non-specific distress, rather
than a psychiatric diagnosis.
Fear avoidance beliefs were measured by the modified Fear Avoidance Beliefs
Questionnaire (mFABQ).53 This includes four of the items from the part concerning activity
in the original Fear avoidance beliefs questionnaire.53;110 We chose the modified version
because it could also be answered by women without pain. In line with the work by Linton
and co-workers,53 we included the following introductory text in the questionnaire: “Some
women will be afflicted by pain in the back and pelvic area during pregnancy. For research
purposes, we would like to know if you believe that there is a relationship between such
afflictions and activities. Please circle the number on the scale that best corresponds to your
belief for each of the following statements.” The scale ranged from 0 (total disagreement) to
6 (total agreement) and the total score on mFABQ ranged from 0-24.
9.4.3 Pain history and pain locations
Pre-pregnancy history of LBP was identified from the question: “Have you suffered from
LBP before pregnancy (yes, no)?”
We calculated the number of pain sites from the questions asking the women if they
had pain (yes, no) in the neck, shoulder and arms, between the shoulder blades, in the knees.
The sum score (0-4) was used as a categorical variable in the analyses.
Pain located in the pelvic area and the low back area, were used as separate
variables, determined from a pain drawing filled in by the women before each clinical
examination. After the examination, the women were asked to point out the pain sites on
their body and, if necessary, the examiner corrected the pain drawing to reflect the areas
pointed out.
42
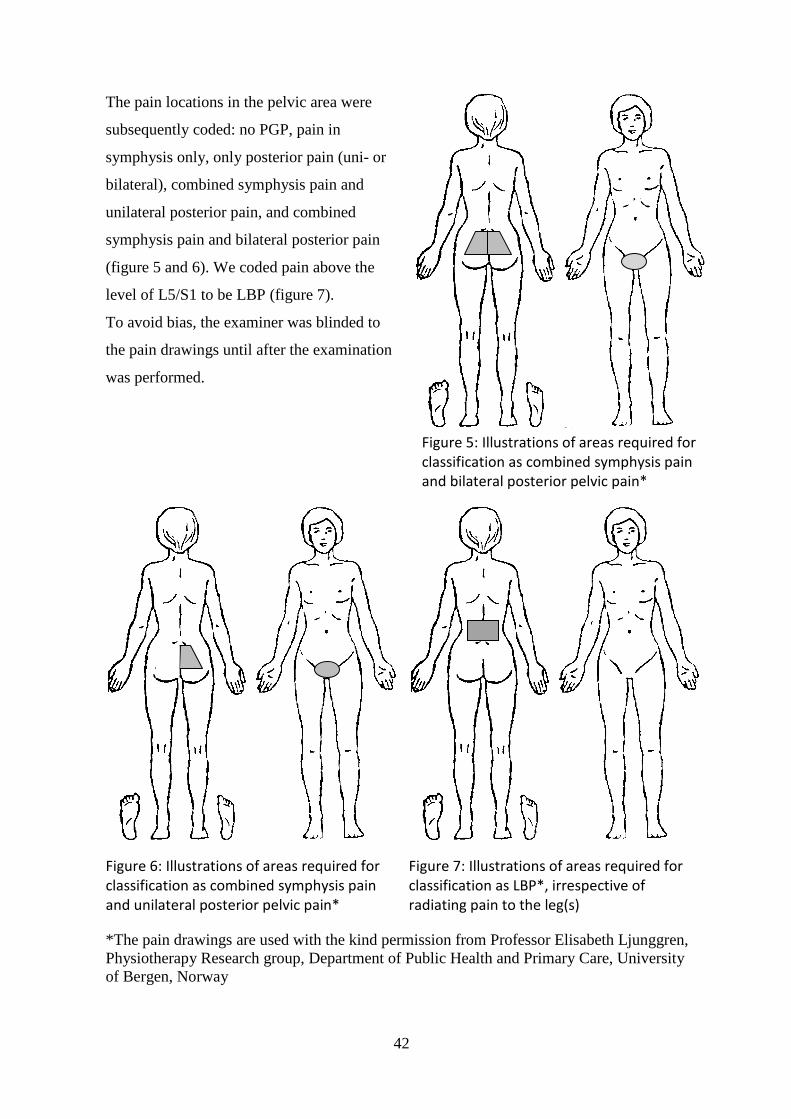
The pain locations in the pelvic area were
subsequently coded: no PGP, pain in
symphysis only, only posterior pain (uni- or
bilateral), combined symphysis pain and
unilateral posterior pain, and combined
symphysis pain and bilateral posterior pain
(figure 5 and 6). We coded pain above the
level of L5/S1 to be LBP (figure 7).
To avoid bias, the examiner was blinded to
the pain drawings until after the examination
was performed.
Figure 6: Illustrations of areas required for classification as combined symphysis pain and unilateral posterior pelvic pain*
Figure 7: Illustrations of areas required for classification as LBP*, irrespective of radiating pain to the leg(s)
*The pain drawings are used with the kind permission from Professor Elisabeth Ljunggren, Physiotherapy Research group, Department of Public Health and Primary Care, University of Bergen, Norway
Figure 5: Illustrations of areas required for classification as combined symphysis pain and bilateral posterior pelvic pain*
43
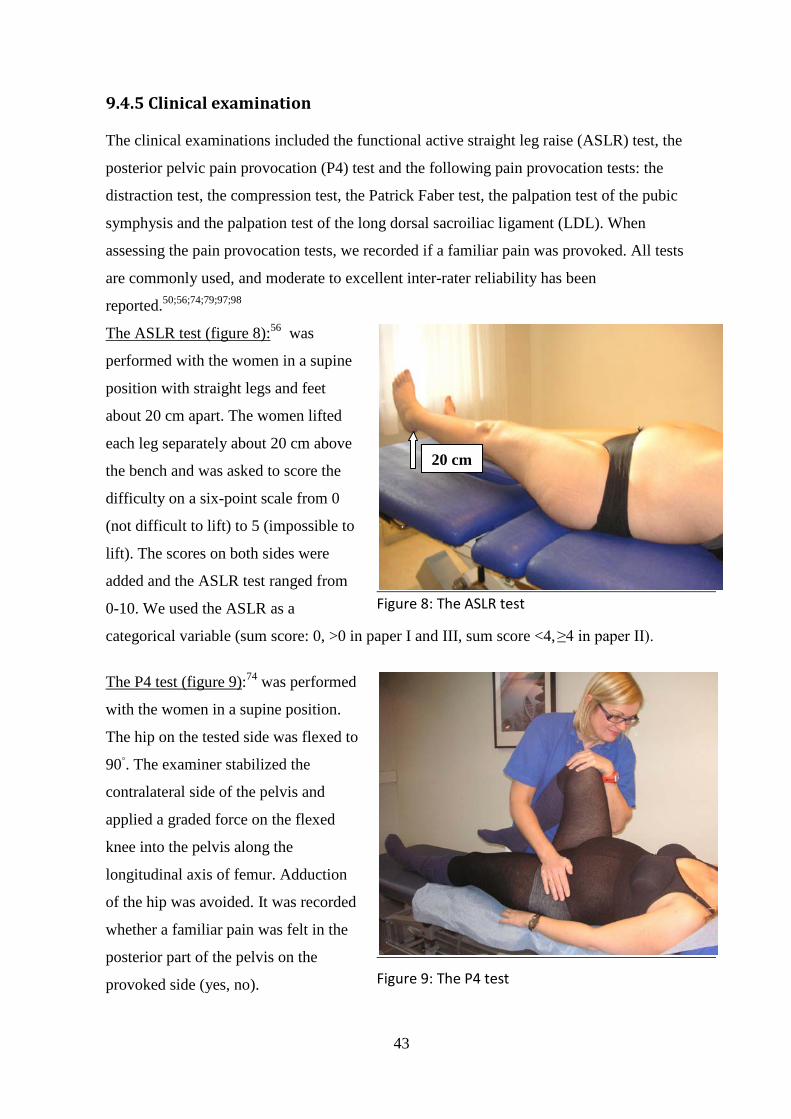
9.4.5 Clinical examination
The clinical examinations included the functional active straight leg raise (ASLR) test, the
posterior pelvic pain provocation (P4) test and the following pain provocation tests: the
distraction test, the compression test, the Patrick Faber test, the palpation test of the pubic
symphysis and the palpation test of the long dorsal sacroiliac ligament (LDL). When
assessing the pain provocation tests, we recorded if a familiar pain was provoked. All tests
are commonly used, and moderate to excellent inter-rater reliability has been
reported.50;56;74;79;97;98
The ASLR test (figure 8):56 was
performed with the women in a supine
position with straight legs and feet
about 20 cm apart. The women lifted
each leg separately about 20 cm above
the bench and was asked to score the
difficulty on a six-point scale from 0
(not difficult to lift) to 5 (impossible to
lift). The scores on both sides were
added and the ASLR test ranged from
0-10. We used the ASLR as a
Figure 8: The ASLR test
categorical variable (sum score: 0, >0 in paper I and III, sum score <4, ≥4 in paper II).
The P4 test (figure 9):74 was performed
with the women in a supine position.
The hip on the tested side was flexed to
90◦. The examiner stabilized the
contralateral side of the pelvis and
applied a graded force on the flexed
knee into the pelvis along the
longitudinal axis of femur. Adduction
of the hip was avoided. It was recorded
whether a familiar pain was felt in the
posterior part of the pelvis on the
provoked side (yes, no).
Figure 9: The P4 test
20 cm

44
The scores were added and used as a categorical variable (sum score: 0, 1, 2). According to
Østgaard and co-workers, the anatomical origin of the provoked pain is unknown and several
anatomical structures may be involved and responsible for the pain reaction.74
The distraction test (figure 10):52 the
women were examined in supine
position. The examiner applied cross-
armed pressure to the anterior superior
iliac spines directed laterally. This
procedure was assumed to stretch the
anterior sacroiliac joint ligaments and
give compression in the dorsal part of
the sacroiliac joints. It was recorded
whether pain was felt in the posterior
or anterior part of the pelvis. The pain
response was recorded (yes, no).
Figure 10: The distraction test
The compression test (figure 11):79
the women were examined in side-
lying position, knees and hips slightly
flexed. Pressure was applied vertically
into the pelvis when the examiner
leaned her chest against the
uppermost iliac crest. The test is
assumed to stretch the posterior
sacroiliac joint ligaments and
compress the anterior part of the
sacroiliac joints. Both sides were
Figure 11: The compression test
tested and scored separately. The pain response was recorded (yes, no).
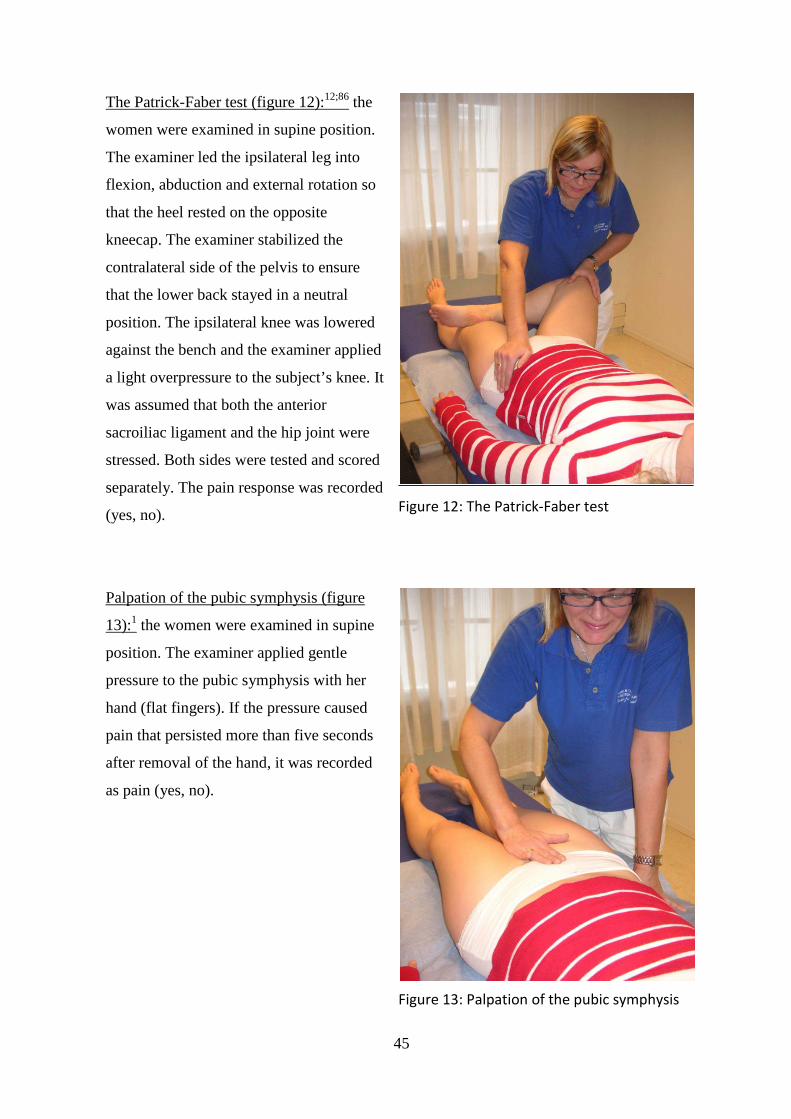
45
The Patrick-Faber test (figure 12):12;86 the
women were examined in supine position.
The examiner led the ipsilateral leg into
flexion, abduction and external rotation so
that the heel rested on the opposite
kneecap. The examiner stabilized the
contralateral side of the pelvis to ensure
that the lower back stayed in a neutral
position. The ipsilateral knee was lowered
against the bench and the examiner applied
a light overpressure to the subject’s knee. It
was assumed that both the anterior
sacroiliac ligament and the hip joint were
stressed. Both sides were tested and scored
separately. The pain response was recorded
(yes, no).
Figure 12: The Patrick-Faber test
Palpation of the pubic symphysis (figure
13):1 the women were examined in supine
position. The examiner applied gentle
pressure to the pubic symphysis with her
hand (flat fingers). If the pressure caused
pain that persisted more than five seconds
after removal of the hand, it was recorded
as pain (yes, no).
Figure 13: Palpation of the pubic symphysis

46
Palpation of the long dorsal sacroiliac
ligament, LDL (figure 14):107 the women
were examined in side-lying position and
the examiner palpated the LDL at the
uppermost side, caudal of the posterior-
superior iliac spine. The test was positive if
the palpation provoked a familiar pain and
was recorded (yes, no). Both sides were
examined and scored separately.
Figure 14: Palpation of the LDL
In paper I we used the responses to the ASLR test and the P4 test from the examination at
inclusion. In paper II we used responses to all the clinical tests presented above, performed
at inclusion. In paper III we used the responses to all the tests presented above, performed in
gestation week 30. For paper II and III we added all positive responses to the above
described pain provocation tests, apart from the P4 test, ranging from 0 (all negative) to 8
(all positive). We used this sum score as a continuous variable in the analyses for paper II,
and as a categorical variable with four levels in the analyses (0-1, 2-3, 4-5 and 6-8 positive
tests) for paper III. Based on the P4 test’s specific relevance for PGP reported in previous
studies,34;74 we decided to use the P4 as a single response and not as part of the sum score of
positive pain provocation tests. ASLR test was also used as a single response (table 7).
The Beighton score99 was used as a measure for joint hypermobility. It consists of 9
tests: hyperextension of the knees (yes, no), hyperextension (>10▫) of the elbows (yes, no),
passive apposition of the thumbs to the flexor aspect of the forearm with straight elbow
(yes, no), passive hyperextension of the 5th metacarpophalangeal joints ≥ 90▫ (yes, no) ,
forward flexion of the trunk, with knees straight, so that the palms of the hands rest easily
on the floor (yes, no). We measured all angles with a goniometer. A sum score (0-9) was
made of the results of all the tests and hypermobility was defined when the sum score was
four or higher.99;101

47
Table 7: Overview of explanatory variables used in the different papers
Paper I Paper II Paper III
Socio-demographics Age X X X
Marital status X X X
Parity X X X
Height X X X
Weight X X X
Pre-pregnancy BMI X X X
Education X X X
Smoking status X X X
Pre- pregnancy physical activity X X
Working condition X X
Full time work X
Gestation week at inclusion X
Use of contraceptive pills year before
pregnancy
X
X
Psychological
variables
mFABQ
X
X
HSCL-25 X X
Pain history and
pain locations
History of pre pregnancy LBP
X
X
Pain locations (pain drawings) X X X
Number of pain sites (0-4) X X
Clinical examination P4 test X X X
ASLR test X X X
Sum of pain provocation tests (0-8) X X
Beighton score for hypermobility
(≥4)
X
Sum of pain provocation tests included the distraction and compression tests, Patrick Faber test, palpation of the pubic symphysis and LDL (sum 0-8). Pain locations were pain in the low back area and/or the pelvic area (symphysis pain only, posterior pain only, combined symphysis pain and unilateral posterior pain, combined symphysis and bilateral posterior pain). Number of pain sites included pain in: the neck, shoulder and arms, between the shoulder blades, and the knees (sum score 0-4). BMI, body mass index; mFABQ, modified fear avoidance beliefs questionnaire; HSCL-25, Hopkins symptom check list; P4, posterior pelvic pain provocation; ASLR, active straight leg raise.

48
9.5 Ethics
The Regional Committee for Medical Research Ethics and the Norwegian Social Science
Data Services gave formal approval of the study. All participants received written and oral
information about the study. The women signed an informed consent before they were
included in the study.
This cohort study was an observational study, and we did not offer any treatment for
the women with PGP. If the women asked for advice concerning pain, activities, and
treatment we answered their questions. Concerning further questions on treatment, we
followed the usual procedures at the MCUs and left it to the midwives to refer women to
physical therapy clinics in the local neighborhood.
9.6 Sample size and power estimates
We estimated power in several ways due to the different analyses used in the three papers in
this thesis. The estimate of sample size for the study was primarily based on the expected
prevalence of PGP. We calculated the sample size (n) from the following equation:
n=1.962p(1-p)/a2
where “p” was the estimated prevalence (given as a fraction) and “a” was the chosen
significance level. After reviewing the literature, we found that using a prevalence of PGP
of about 20 % in late pregnancy was reasonable. This was also in accordance with the later
published estimation of prevalence from the European Guideline group.104-106 Hence, we
used p=0.20 and a=0.05 when calculating power. This resulted in n=246. However we
needed to include more than 246 pregnant women in the cohort because the use of different
subsets of the study sample might be necessary in the different analyses. Hence, we
included a total of 326 pregnant women in the cohort.
Continuous variables were the main responses in the studies in this thesis and were
also used in the power calculations for the correlation and regression analyses. The level of
significance was set at 5 % (two-sided) and the power at 80 %. Assuming a correlation of
medium size, 0.3, in the population, a sample size of 85 is required for assessing
significance of a correlation coefficient in the sample.17 In a multiple regression analysis
with five independent variables, the required sample size is 91 to detect a medium effect
size of 0.15 (R2/(1-R2)).17 If we increased the number of independent variables to 8, the

49
required sample size is 107,17 thus the power should be sufficient since the study samples
was 283, 268 and 179 women in papers I, II and III respectively.
For the logistic regression analyses, the “rule of 10” says that the sample size is large
enough if the size of the least frequent outcome group is greater than 10 times the number of
variables in the model. 38
9.7 Statistical analyses
Several types of statistical analyses were used depending on the research questions and the
variables used. Details regarding analyses are presented below. We used a 5 % level of
significance in all papers. Statistical analyses were conducted using the statistical software
program SPSS (version 15 for paper I and version 16 for papers II and III).
9.7.1 Paper I
Chi-square statistics were used to explore the strength of associations between the results of
the clinical tests and the different pain locations. A one-way between-groups analysis of
variance was conducted to explore the association between the pain locations and DRI. Due
to the large number of comparisons involved, the Bonferroni post hoc adjustment was used
to reduce the risk for Type 1 errors.6 Multiple linear regressions were used to explore the
relationship between DRI (response variable) and the P4 test, the ASLR test and pain
locations (explanatory variables). Interaction effects between the variables were tested, and
the residuals were examined to check model assumptions.
9.7.2 Paper II
Multiple linear regression analyses were used to study the associations between potential
risk factors measured in early pregnancy and DRI or pain intensity (worst evening pain) in
gestation week 30. Associations between the explanatory variables and each of the response
variables as well as between the explanatory variables were studied by Pearson correlation
coefficients. The explanatory variables showing a significant relationship with the response
variable or found important in previous studies were entered into a multiple linear
regression model. The best subsets of explanatory variables were selected through exclusion
of the variables with the smallest contribution to the model (the largest p-values). Two
50
adjusted models were presented for each of the response variables, without (model 1) and
with (model 2) adjustment for DRI or pain intensity at inclusion in early pregnancy. Model
2 was also included to examine the risk factors for the change in DRI or pain intensity from
early to late pregnancy. The residuals were examined to check model assumptions.
Interaction effects between the variables in the models were also tested.
9.7.3 Paper III
Multiple linear regression analyses were used to study the associations between potential
risk factors measured in pregnancy and DRI or pain intensity (worst evening pain) measured
12 weeks postpartum. Associations between the explanatory variables and each of the
response variables as well as between the explanatory variables were studied by Spearman
rank correlation coefficients.
Explanatory variables significantly associated with the response variable or found
important in previous studies were entered into a multiple linear regression model. The best
subsets of explanatory variables were selected through exclusion of the variables with the
smallest contribution to the model (the largest p-values). The residuals were examined to
check model assumptions. Interaction effects were tested, but real interactions may go
undetected since this test may lack power. 41
Since a large number of the women reported low pain intensity and low DRI, 12
weeks postpartum, we also repeated the multiple linear regression analyses after
transformation (natural logarithms) of both pain intensity and DRI.
In order to estimate the odds ratios for sustained PGP, we categorized the women as
recovered or non-recovered 12 weeks postpartum based on a combination of pain and
disability. Women were defined as non-recovered if self-reported PGP and/or markings in
the pelvic area on the pain drawing were present and if the DRI was above ten points.83 A
logistic regression model was used to study the associations between non-recovery and the
same explanatory variables as used in the multiple linear regression analyses. We also used
an alternative definition of non-recovery based on the definition described above, but in
addition the pain intensity should be above ten on the VAS. The results from the logistic
regression model were similar applying the two response variables.

51
10 MAIN RESULTS
The results are described in detail in each of the papers, hence only a summary of the main
results is given here.
10.1 Prevalence of self-reported PGP
The prevalence of self-reported PGP was high at all time points in this study (table 8).
Within the entire cohort, 35 % of the women reported PGP at inclusion. At gestation week
30 the prevalence had increased to 62 % followed by a decline to 31 % 12 weeks
postpartum. At all three times this was based on the answer on a single question: “Do you
have pain in the pelvic area?”
10.2 Disability at gestation week 30 (paper I)
In the cross-sectional study in late pregnancy (gestation week 30) we explored associations
between pain locations, responses to clinical tests and disability. Self-reported pain locations
were established from pain drawings, in two different ways; distinguishing between PGP
and LBP as well as distinguishing between different pain locations in the pelvic area
(symphysis pain only, posterior pain only, combined symphysis pain and unilateral posterior
pain, combined symphysis pain and bilateral posterior pain). Disability was measured by the
Disability Rating Index (DRI).
Large variations in DRI were constantly seen within each of the subgroups based on
pain locations, and all subgroups had women reporting DRI below 10 and above 50 points.
DRI was significantly associated with pain locations (p<0.001). Women with combined
pain in the symphysis and bilateral posterior pain scored significantly higher on DRI
compared with all other pain locations (p<0.001). PGP was more strongly associated with
disability than was LBP. No difference in DRI was found between women reporting PGP
and women reporting combined PGP and LBP. These results indicate that PGP has a
significant impact on disability in pregnancy and that having LBP in addition does not
increase the disability.
Women with bilateral positive posterior pelvic pain provocation (P4) test scored
significantly higher on DRI than women with unilateral positive P4 and bilateral negative

52
P4 (p<0.001). Furthermore a statistical higher DRI was found in women with active straight
leg raise (ASLR) test score >0 compared with ASLR=0 (p<0.001).
The multivariable linear regression analyses showed that pain locations in the pelvic
area, responses to P4 and ASLR tests, contributed independently and statistically to the
variation in DRI (R2=0.32, p<0.001) (table 8).
Table 8: Final multiple linear regression model for the associations between the response variable DRI at gestation week 30 and the explanatory variables: pain locations in the pelvic area, P4 and ASLR. The model contributed to 32 % of the variability in DRI.
Crude estimates Adjusted estimates3
β1 (95 % CI2) p-value β1 (95 % CI2) p-value Pain locations No PGP Reference <0.001 Reference <0.001 Symphysis pain only 6.3 (-2.4, 15.1) 4.0 (-4.1, 12.1) Posterior pain only 12.1 (6.9, 17.2) 6.8 (1.6, 12.1) Combined symphysis pain and unilateral posterior pain
14.7 (6.5, 22.8)
9.7 (1.8, 17.6)
Combined symphysis pain and bilateral posterior pain
26.5 (20.1, 32.8)
18.0 (11.3, 24.7)
P4 Negative Reference <0.001 Reference <0.001 One-sided positive 2.4 (-3.5, 8.4) -3.2 (-9.0, 2.4) Bilateral positive 16.4 (11.9, 21.0) 6.7 (1.8, 11.6)
ASLR test score = 0 Reference <0.001 Reference <0.001 score > 0 15.4 (11.1, 19.7) 10.9 (6.7, 14.9) 1 Estimated regression coefficients, 2 CI, confidence interval, 3 adjusted for the other variables in the table; DRI, disability rating index; PGP, pelvic girdle pain; P4, posterior pelvic pain provocation test; ASLR, active straight leg raise test

53
10.3 Risk factors for disability and pain at gestation week 30
(paper II)
Paper II is a longitudinal observational study, following women from early to late
pregnancy for the purpose of identifying risk factors for disability and pain in gestation
week 30. Disability was measured by DRI and pain intensity (worst evening pain) by VAS,
self-reported pain locations in the pelvic area, were established from pain drawings. The
clinical examinations included pain provocation tests for PGP as well as the functional
ASLR test. Response to the clinical tests, pain locations within the pelvic area (symphysis
pain only, posterior pain only and combined symphysis pain and posterior pelvic pain) and
previously identified risk factors for PGP were included in the analysis.
Self-reported pain locations in the pelvic area, responses to the P4 test, and sum of
positive pain provocation tests in early pregnancy were identified as risk factors for
disability and pain intensity in gestation week 30 in a multivariable regression model
(p≤0.03) (table 9). In the model with pain intensity as response variable, the adjusted
estimate for bilateral positive P4 test was 15.2 (95 % CI: 5.8, 24.6), thus this CI indicates
that the P4 test is of significance even though p=0.07. In addition, distress was a risk factor
for disability (p=0.006) but not for pain intensity.
To explore the change in DRI from early pregnancy until gestation week 30, we
adjusted for DRI in early pregnancy in the model. This resulted in an increase in the R2 from
0.26 to 0.37 and the sum of positive pain provocation tests and HSCL-25 were no longer
significant (p=0.26 and p=0.49, respectively). To explore the change in pain intensity from
early pregnancy until gestation week 30 we adjusted for pain intensity in early pregnancy in
the model. This resulted in an increase in the R2 from 0.29 to 0.33 and the sum of positive
pain provocation tests in early pregnancy was no longer significant (p=0.23). Further details
are shown in table 4 and 5 in paper II.
Fear avoidance beliefs, a score on the ASLR test of four and above, and number of
pain sites in other parts of the body in early pregnancy were not significantly associated
with either DRI or pain intensity in gestation week 30.

54
Table 9: Final multiple linear regression models showing the associations between disability or pain intensity (worst evening pain) in gestation week 30 and risk factors measured in early pregnancy (n=268)
DRI Pain intensity
Crude estimates
Adjusted estimates3
Crude estimates
Adjusted estimates3
β1 (95 % CI2)
p-value
β1 (95 % CI2)
p-value
β1 (95 % CI2)
p-value
β1 (95 % CI2)
p-value
Pain locations No pain
Reference
<0.001
Reference
0.007
Reference
<0.001
Reference
<0.001 Symphysis pain only 17.7 (6.8, 28.6) 14.0 (3.7, 24.1) 44.2 (27.7, 60.6) 40.4 (24.4, 56.5) Posterior pain only 10.7 (6.2, 15.3) 4.8 (-0.2, 9.6) 23.5 (16.6, 30.3) 15.3 (7.8, 22.8)
Combined symphysis pain and posterior pain
24.5 (15.6, 33.5)
11.8 (2.6, 21.0)
40.5 (26.9, 54.0)
26.0 (11.6, 40.4)
P4 test Negative
Reference
<0.001
Reference
<0.001
Reference
<0.001
Reference
0.07 Unilateral positive 8.0 (2.6, 13.5) 2.2 (-3.4, 7.9) 16.5 (7.7, 25.2) 5.8 (-3.1, 14.8) Bilateral positive 19.8 (14.3, 25.2) 12.0 (6.0, 18.0) 28.6 (19.9, 37.3) 15.2 (5.8, 24.6) Sum of positive pain provocation tests
5.3 (3.9, 6.7)
<0.001
1.7 (0.3, 3.0)
0.02
6.3 (4.5, 37.3)
<0.001
2.3 (0.3, 4.4)
0.03
HSCL-25 <1.75
Reference
<0.001
Reference
0.006
-
-
-
-
≥1.75 14.0 (7.6, 20.3) 8.2 (2.3, 14.0) 1 Estimated regression coefficients, 2 CI, confidence interval, 3 adjusted for the other variables in the table. DRI, Disability Rating Index; P4 test, posterior pelvic pain provocation test; HSCL-25, Hopkins Symptom Check List
55
10.4 Risk factors for disability and pain 12 weeks postpartum
(paper III)
Paper III is a longitudinal observational study following women afflicted by PGP from late
pregnancy (gestation week 30) until 12 weeks postpartum for the purpose of identifying risk
factors for sustained disability and pain 12 weeks postpartum. Disability was measured by
DRI and pain intensity by VAS 12 weeks postpartum. We used the same clinical tests as in
paper II but the data were taken from the tests performed in gestation week 30. Clinical
variables (from gestation week 30) together with previously identified risk factors were
included in the analysis.
Based on multivariable linear regression analyses, sum of positive pain provocation
tests was a risk factor for both disability and pain intensity 12 weeks postpartum
(0.03≤p≤0.04) (table 10). Pre-pregnancy LBP was a risk factor for DRI 12 weeks postpartum
(p=0.03) and number of pain sites in other parts of the body was a risk factor for pain
intensity (p=0.007). Pre-pregnancy BMI was also associated with both disability and pain
intensity and the response to the ASLR test was associated with disability, though none of
them significantly.
In order to estimate odds ratios (OR) for non-recovery from PGP postpartum, we
defined women as recovered or non-recovered based on pain locations in the pelvic area and
disability. Women were non-recovered if self-reported PGP and/or markings in the pelvic
area on the pain drawing were present and if the DRI was above 10. We performed a logistic
regression analysis including the same risk factors as described for the linear regression
analyses (table 11). The number of pain sites in other parts of the body and sum of positive
pain provocation tests were significantly identified as risk factors. The odds increased with
increased number of pain sites and OR was 4.4 (95 % CI (1.3, 14.6)) for women with 3-4 pain
sites as compared to women with no pain sites in the adjusted analyses. Moreover, OR was
3.5 (95 % CI (1.2, 10.3)) for women with 6-8 positive provocation tests as compared to
women with 0-1 positive test. Pre-pregnancy BMI was also associated with non-recovery,
though not significantly.
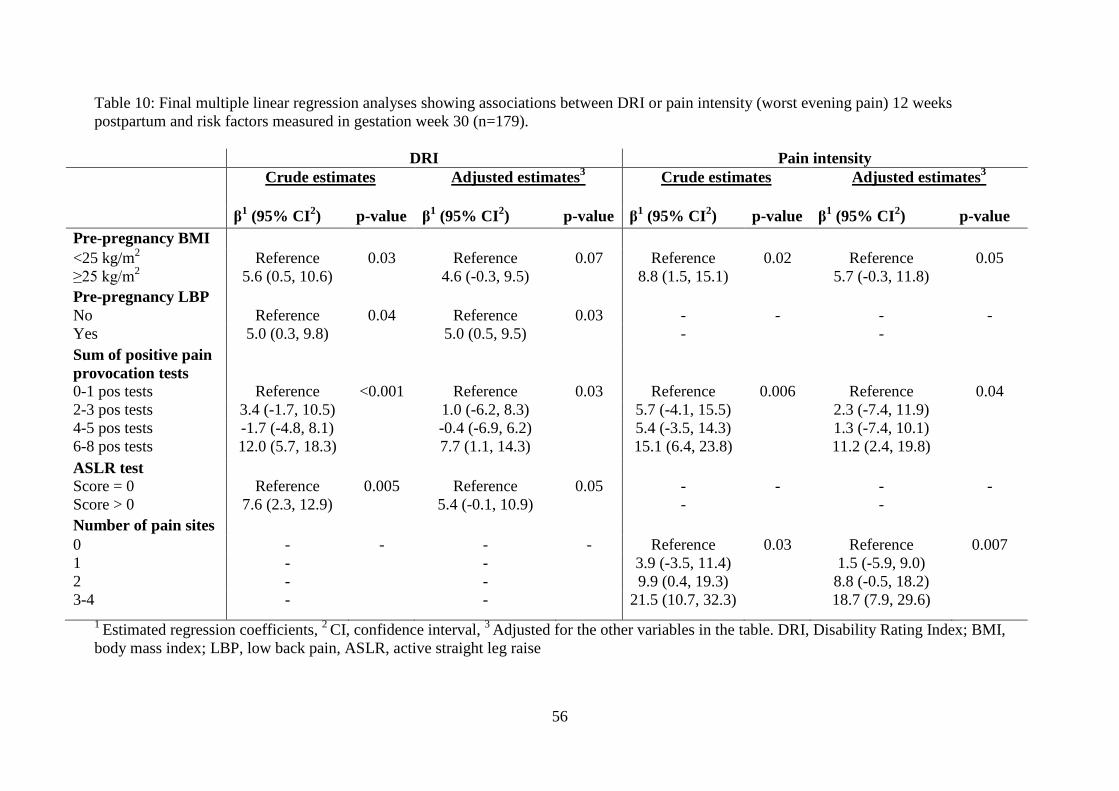
56
Table 10: Final multiple linear regression analyses showing associations between DRI or pain intensity (worst evening pain) 12 weeks postpartum and risk factors measured in gestation week 30 (n=179).
DRI Pain intensity Crude estimates Adjusted estimates3
Crude estimates
Adjusted estimates3
β1 (95% CI2) p-value β1 (95% CI2) p-value β1 (95% CI2) p-value β1 (95% CI2) p-value Pre-pregnancy BMI <25 kg/m2 Reference 0.03 Reference 0.07 Reference 0.02 Reference 0.05 ≥25 kg/m2 5.6 (0.5, 10.6) 4.6 (-0.3, 9.5) 8.8 (1.5, 15.1) 5.7 (-0.3, 11.8) Pre-pregnancy LBP No Reference 0.04 Reference 0.03 - - - - Yes 5.0 (0.3, 9.8) 5.0 (0.5, 9.5) - - Sum of positive pain provocation tests
0-1 pos tests Reference <0.001 Reference 0.03 Reference 0.006 Reference 0.04 2-3 pos tests 3.4 (-1.7, 10.5) 1.0 (-6.2, 8.3) 5.7 (-4.1, 15.5) 2.3 (-7.4, 11.9) 4-5 pos tests -1.7 (-4.8, 8.1) -0.4 (-6.9, 6.2) 5.4 (-3.5, 14.3) 1.3 (-7.4, 10.1) 6-8 pos tests 12.0 (5.7, 18.3) 7.7 (1.1, 14.3) 15.1 (6.4, 23.8) 11.2 (2.4, 19.8) ASLR test Score = 0 Reference 0.005 Reference 0.05 - - - - Score > 0 7.6 (2.3, 12.9) 5.4 (-0.1, 10.9) - - Number of pain sites 0 - - - - Reference 0.03 Reference 0.007 1 - - 3.9 (-3.5, 11.4) 1.5 (-5.9, 9.0) 2 - - 9.9 (0.4, 19.3) 8.8 (-0.5, 18.2) 3-4 - - 21.5 (10.7, 32.3) 18.7 (7.9, 29.6)
1 Estimated regression coefficients, 2 CI, confidence interval, 3 Adjusted for the other variables in the table. DRI, Disability Rating Index; BMI, body mass index; LBP, low back pain, ASLR, active straight leg raise

57
Table 11: Multiple logistic regression analyses showing crude and adjusted odds ratios with 95% confidence intervals for non-recovery 12 weeks postpartum due to pre-pregnancy BMI, number of pain sites and sum of positive pain provocation tests measured in gestation week 30. Crude estimates Adjusted estimates3 β1 (95% CI2) p-value β1 (95% CI2) p-value Pre-pregnancy BMI <25 kg/m2 1.0 1.0 ≥25 kg/m2 2.2 (1.1, 4.4) 0.03 2.1 (1.0, 4.5) 0.05 Number of pain sites 0 1.0 1.0 1 2.8 (1.2, 6.2) 0.01 2.3 (1.0, 5.5) 0.05 2 2.3 (0.8, 6.4) 0.1 2.0 (0.7, 5.7) 0.21 3-4 5.2 (1.7, 15.9) 0.004 4.4 (1.3, 14.6) 0.02 Sum of positive pain provocation tests
0-1 pos tests 1.0 1.0 2-3 pos tests 1.7 (0.5, 5.5) 0.40 1.2 (0.3, 4.0) 0.82 4-5 pos tests 1.5 (0.5, 4.4) 0.51 1.0 (0.3, 3.3) 0.94 6-8 pos tests 5.0 (1.8, 14.0) 0.002 3.5 (1.2, 10.3) 0.02 1 Estimated regression coefficients, 2 CI, confidence interval, 3 Adjusted for the other variables in the table; BMI, body mass index

58
11 GENERAL DISCUSSION
The central aspects in each of the studies have been discussed in the respective papers. The
discussion part of this thesis we will concentrate on some important methodological aspects
as well as on the discussion of some main issues across the studies.
11.1 Discussion of methodological aspects
11.1.1 Participants and study samples
This thesis is based on a cohort study of women recruited consecutively among Norwegian
speaking pregnant women at four MCUs in the Oslo area. Women not expected to have a
normal pregnancy (as determined by the midwives) and women in late gestational age were
excluded, but no further selections were made in the recruitment procedure. Out of 385
eligible women, 326 women aged 18 – 45 years participated (mean 31.4 years). According
to Statistics Norway, the average age for women giving birth in Norway was 30.3 years for
the period 2006 – 2008, and women giving birth in Oslo were a bit older than in the rest of
the country.85 Twelve percent of all Norwegian women who had live births in 2008 were
single.85 These numbers suggest that the participants in the cohort may be representative for
pregnant women living in urban parts of Norway. Only 15 % (59/385) declined participation
in the study, and 8 % (27/326) of the participants dropped out during the study period (13 of
these, 50 %, withdrew due to a miscarriage). We evaluated the characteristics of the women
in the cohort to be similar to the women who declined participation (table 5 page 37).
Furthermore the differences between the groups of women selected and used in the analyses
in the different studies are also slight. The similarities of the samples and the non-
participants suggest that our samples were comparable.
Our intention was to include pregnant women early in pregnancy, before PGP was
present. Based on information from the MCUs we expected most women to register
between gestation week 12 and 18. Although some women registered earlier and others later
than we expected; we decided not to change our protocol. Instead, the women included later
than gestation week 20 were excluded from the analyses in paper II (risk factors for
development of disability and pain). Since we were concerned about the effect of the broad
gestation age interval at inclusion, we also controlled for the effect of gestation week at
59
inclusion in the analyses. As described in the results in paper II, we found that gestation
week at inclusion had no significant effects.
11.1.2 Design
The results presented in this thesis are based upon self-reported (subjective) data and
clinical (objective) data collected two times in pregnancy (at inclusion in early pregnancy
and in gestation week 30) and one time after delivery (12 weeks postpartum). A prospective
design (used in paper II and III) is needed to be able to examine risk factors for development
of a condition (PGP). A cross-sectional design (as used in paper I) has some limitations
concerning the opportunity to draw conclusions.20 Since all data are collected at the same
time, it is not possible to conclude whether exposure or response came first, and no
conclusions about cause-effect relationships can be drawn. However, this design was
satisfactory in paper I since the purpose was to study associations among different factors
measured at the same time.
Multivariable regression analyses were used to explore associations between the
potential risk factors and the response variables and to estimate the explanatory power of the
different risk factors. Using multivariable analyses, as opposed to bivariate analyses, makes
it possible to identify and control for effects from other variables, i.e. confounding effects
and interactions.6 When we compare our results with previous studies, we see that most of
the previously identified risk factors were not significantly associated with the response
variables when using multivariable models (except pre-pregnancy LBP and pre-pregnancy
BMI). This may be because the clinical variables absorb the effect of other variables. Hence,
some of the explanation for the different results compared with previous studies could be
the use of a different design, clinical explanatory variables, different response variables
(discussed further also in chapter 11.1.3), and statistical methods.
Blinding procedures are recommended and important in research to avoid bias from
awareness.76 The physiotherapists performing the examinations in the present cohort study
were not given access to any information about the women until after the examination. The
women were examined independent of the presence or absence of PGP. This design is
different from previous studies which often have examined only the women presenting with
pain.8;33;48 Furthermore, no predefined classifications were used in the clinical examinations
in this thesis. This means that the tests were performed and the responses recorded without
including any clinical rationale, and without any attempts to establish a diagnosis. The

60
examinations were done for research purposes and these procedures increase the quality of
the data gathered from the tests. Hence the examination-procedure differs from ordinary
clinical practice. Nevertheless, this procedure provided opportunities to use the responses to
clinical tests both as single data as well as different independent clusters or sum scores in
the analyses.
We selected women for examination in gestation week 30 based on a simple
questionnaire concerning pain in the pelvic and/or low back area in gestation week 28. A
small group of women (9 %) were not selected for further clinical examinations. However,
all women in the cohort were included in the prevalence estimates based on self-reports at
each time point, but in the analyses using data from clinical examination at gestation week
30 this group of women could not be included since they were examined only once (at
inclusion). The close similarity in the entire sample of 326 participants, and the sample used
for the different analyses and papers (table 5, page 37) suggest that the selection has not
caused a large bias.
A large fraction of the women without PGP, but also several with PGP scored low
on both disability (DRI) and pain intensity 12 weeks post partum; hence the data were
skewed. We controlled for this effect in two ways (paper III): by repeating the multiple
linear regression analyses with pain intensity ln transformed and DRI ln transformed as well
as by using logistic regression analyses and a constructed response variable for non-
recovery based on both pain and DRI. The results were similar for all approaches and this
indicates that the results are robust and trustworthy.
The sum of positive pain provocation tests was identified as a risk factor for
disability and pain in both gestation week 30 and 12 weeks postpartum. The variable was
used differently in the analyses at the two times; in the analyses in paper II, it was used as a
continuous variable, and in paper III it was used as a categorical variable. The results in
paper III showed that the largest effect was when 6-8 tests were positive. In retrospect,
therefore we see that this variable probably should have been used as categorical variable
also in paper II.
The ASLR test was used with different cut-off values in the papers in this thesis.
Initially we intended to use a cut-off in the ASLR score that distinguished between women
with strong affliction and those without or lesser affliction. Hence we evaluated the
previously proposed cut-off value of one to be too low.56 In both paper I and II we therefore
decided to use a cut-off of four and above for the afflicted group, as also used as an
inclusion criterion in the RCT by Stuge and co-workers.88 In the revision process on paper I

61
we were asked by the reviewers to change this cut-off to one, in accordance with the
original work by Mens and co-workers.56 This was done and did not change the initial
results of paper I. The revision process for paper II was ongoing in parallel with paper I, and
the cut-off was not changed in paper II. In retrospect, we see that this probably could have
been done for the consistency of the papers, although a change would implicate a less strict
criterion for the afflicted group. Additional analyses have been performed to enable a
discussion of the implications of using the different cut-off values. The results are presented
and discussed in chapter 11.2.4.
11.1.3 PGP and measures of affliction
Several studies have used self-reported PGP (yes/no) as an outcome
measure.45;62;67;68;80 Two main elements are included in the definition of PGP from the
European Guideline group; the location of pain and the reduced endurance in conjunction
with weight bearing activities.106 Hence both pain and function are evaluated as important
for the condition. These elements are also assessed and evaluated in the clinical examination
of PGP patients. In previous studies PGP has been regarded as both a normal discomfort
during pregnancy,24;68 and a severe and disabling problem.13 Hence the view on affliction
from PGP seems to vary. Since we believe that affliction cannot be described based on a
yes/no question, we included two measures for the degree of affliction in the current papers;
disability (DRI) and pain intensity (worst evening pain, measured by VAS). Both variables
are continuous and are intended to provide more graded information about affliction than
merely presence or absence of PGP. Although the use of graded scales has been
recommended,18 it has not been used in studies examining PGP in pregnancy before.
The response variables used in the present studies are all subjective, however in
different ways. A yes/no response to the question about presence of PGP is highly
dependent on the women’s own evaluation of the pain as well as the location of pain and is
probably also culturally influenced. As for the presence or absence of PGP, also the graded
scales are self-reported and thus subjective. Pain intensity (measured by VAS) is a
subjective phenomenon quantifying the pain. DRI surveys the difficulties in performing
specific activities; hence it is the degree of difficulty that is assessed. The nature of pain
makes objective measurement of intensity impossible,11 but it is possible that disability
could have been measured more directly. To our knowledge, no such specific disability
measurement for use in pregnant women exists. The only functional test specifically aimed

62
at PGP is the ASLR test which has been found to discriminate between PGP patients and
healthy subjects.56 Furthermore difficulties in performing the ASLR has presently shown to
be associated with increased mobility in the pelvic joints as well as disease severity in PGP
patients.57;58 Strong associations between ASLR and DRI were found in the cross-sectional
study in paper I. This finding suggests that the impairments assessed by ASLR are closely
related to limitations in activities as reflected by DRI when measured at the same time.29
Pain is often characterized by the assessment of location, intensity, and temporal
aspects.11 These assessments are used in both research and clinical practice. The women
with PGP in the present cohort study reported large individual variations of pain intensity.
This is in accordance with a recently published review on differences in pain sensitivity by
Nielsen and co-workers,64 saying that “even though some conditions may be more painful
than others, the variation between individuals with the same condition is far greater than the
difference in painfulness across conditions”. Patients may experience pain differently, and
even with the same injury some may not report any pain at all.103 It still seems important to
measure the women’s own perception of pain.
Several instruments have been developed and used to assess pain intensity.11 The
visual analogue scale (VAS), as used in the present thesis, is often used for assessing worst,
least, or average pain over the past 24 hours or during the past week. The measure of pain
intensity can probably be seen as even more subjective and less calibrated than DRI.
Furthermore, disability is said to be one of the most substantial consequences of pain.103 The
latter can explain the strong correlation between pain intensity and DRI seen in both
gestation week 30 and 12 weeks postpartum.
We have argued for the use of graded scales in this thesis, since PGP can be present
with little affliction. Yet, we have also used dichotomous variables and estimated the odds-
ratios for sustained PGP 12 weeks postpartum among women afflicted from PGP in
pregnancy (paper III). We used two dichotomous variables, based on presence of PGP and a
degree of disability to:
1. define women afflicted from PGP in gestation week 30
2. define non-recovered women 12 weeks postpartum.
We used the graded scales to standardize afflicted women in late pregnancy and non-
recovered women postpartum, respectively. Since our data showed that pregnancy
influenced DRI, we used a cut-off value on disability above the effect of pregnancy itself to
estimate a main effect of PGP in gestation week 30. Furthermore, women without affliction

63
postpartum should report disability comparable with healthy women. In the study from
Salèn and co-workers,83 almost none of the healthy individuals scored above ten (median
DRI was 0.8, IQR 4.7 for healthy individuals with no disability, and median DRI was 8.7,
IQR 15.4 for healthy individuals with minor ailments). The described procedure, used in
paper III, differs from what has been done before, since most previous studies have used
presence of PGP as a criterion.2;10;13;61;70;73;82;95;96 It could be discussed to what extent our
definition of non-recovered women is adequate for identification of those with sustained
PGP. This can only be tested by analyses in later follow-ups. However, the mean DRI and
pain intensity of this group were 30 (IQR 25) and 34 (IQR 47) respectively and indicate that
they had a relatively high affliction compared with healthy women and other patient
groups.83
The need for measurement tools specially designed for pregnancy-related PGP has
been discussed and the European Guideline group concluded that: “Future studies should
therefore address the challenge of developing suitable outcome measures to assess the
functional status for PGP.”106 However, the use of established measurement tools seems
important in order to be able to compare results between different studies and also between
different patient groups and healthy individuals. The DRI as a measure of disability, has
been used in different studies, and comparison could be made between this cohort and a
Swedish cohort of pregnant women,67 as well as with healthy women of the same age and
patient groups.83
11.1.4 Clinical examinations and tests
Different studies have used different tests in their assessment, mostly for establishing the
diagnosis of PGP, and have not examined the responses to the tests as potential risk factors.
The ideal clinical test has high levels of reliability, sensitivity and specificity. A common
internal validity concern is connected to the clinimetric properties of the clinical tests. The
reliability and validity for tests used for examining pain in the pelvic area have shown large
variations.50;77;79;86;97;98 We selected mainly pain provocation tests for this thesis. A recently
published study has also shown that reliability and validity for single pain provocation tests
as well as composite of tests were good when injections procedures in the SIJ and adjacent
structures were used.52 As mentioned before, the relationship between SIJ and PGP is
unclear and the validity of the tests used for PGP can still be questioned. In a previous study
we evaluated four of the actual pain provocation tests (distraction test, compression test, P4

64
and Patrick-Faber), and found the reliability to be moderate to good.79 However, when it
comes to validity, there are more uncertainties concerning structures responsive for the pain,
and thus the lack of a diagnostic reference standard is obvious and could be problematic.
Even though there are uncertainties concerning the clinimetric properties of the
clinical tests, we believe that we have selected relevant tests and optimized the performance
and interpretation of the results. Furthermore, the identification of responses to clinical tests
as risk factors for PGP has not been studied previously.

65
11.2 Discussion of results
11.2.1 Prevalence of PGP
Prior to the data collection for the present study, a population based retrospective
questionnaire study was carried out.80 This included 1,817 women from two communities
just outside Oslo, recruited in 1998-99, and the prevalence of PGP was 46%. It was our
hypothesis that this high prevalence could be partly due to recall bias and that lower values
would be found in a prospective design. However, the self-reported prevalence in the
present cohort study was 35% and 62% in early and late pregnancy, respectively. Hence, the
prevalence in the retrospective study was probably not an overestimation caused by the
study design. On the opposite, our data seems to indicate even higher prevalence. Several
factors may have contributed to this fact. Like in several other studies, the estimates of the
prevalence are based on self-reported presence or absence of the condition.22;45;55;62;67;68 For
the prevalence estimates we used the answer from a simple question in the present thesis:
“Do you have pain in the pelvic area?” (Yes/no). Hence, the response depends on the
women’s individual understanding of the concept and the influence of the cultural
environment. The high prevalence could be due to the fact that the social and medical
acceptances of PGP have increased in Norway during the last 15 – 20 years, and that the
focus on PGP has increased.22;43 The prevalence is, however, in accordance with recently
published studies in other countries.35;62;63;67 The large prevalence numbers could also
indicate that the threshold for reporting PGP was low. It could also be a risk for over
reporting PGP due to the focus of being participants in a study. We have tried to limit the
over-reporting by reducing the focus on PGP both in the questionnaires and in the
information (oral and written) given to the women.
11.2.2 Disability in pregnancy – a normal or pathological response?
In clinical practice, it is a common belief that in pregnant women with PGP the physical
disability during pregnancy is caused by PGP. However, it seems reasonable that pregnancy
in itself might also cause disability, since pregnancy induces great bodily changes in the
women. The increase in body weight and change of body posture may impact on physical
function. A comparison of DRI scores for women with and without PGP in this study could
give a picture of the pregnancy effect on disability (figure 15). The DRI values of the
women without PGP 12 weeks postpartum (the only non-pregnant data-set) are low and

66
exhibit a rather narrow range. These scores are comparable with DRI from healthy women
of approximately the same age,83 and this suggests that most of the women are not afflicted
by disability 12 weeks postpartum. Comparing these values with the DRI scores at inclusion
for women without PGP can possibly show the pregnancy effect on disability, already
present in early pregnancy. The increase in disability in women with PGP at inclusion,
compared with women without PGP, is the additive effect from PGP in early pregnancy,
also shown previously.67 Furthermore, an increase in disability is seen from inclusion until
gestation week 30 in women with and without PGP. However, the women with PGP have
more disability than women without PGP.
The median DRI score in gestation week 30 among women with PGP in the present
cohort was 44 (IQR 26.7), and thus comparable (but with somewhat larger variation) with
scores from patients with other musculoskeletal disorders classified with mild-to-moderate
disability. In the study from Salèn and co-workers a combined group of patients with neck,
shoulder, or LBP (all classified with mild-to-moderate disability) scored 39 (IQR 19.5)
points on DRI.83
There is a possibility that the multiple linear regression models could have identified
risk factors within a small range of the continuous response variables. The response variable
used in the logistic regression model distinguished between women with negligible
disability and women with a certain level of disability. Since the clinical risk factors were
identified also in the logistic regression model this strengthens our results.
In the present cohort the range of DRI is higher among women with PGP at all three
times compared with women without pain. This finding indicates a wide variation in
affliction when PGP is present. Mean DRI 12 weeks postpartum among women with PGP
was low (20) in this cohort, indicating low functional impairment postpartum even when
pain is present. Corresponding value of DRI among the women included in the RCT three
months postpartum from Stuge and co-workers was 54.87 Only about 7 % of the women in
the present cohort sought treatment postpartum, and this might explain the low DRI
compared with the women included in the RCT.
The mean pain intensity due to PGP 12 weeks postpartum was also low, and lower
than reported at inclusion. This shows that women with PGP in this cohort have more pain
in early pregnancy than 12 weeks postpartum.
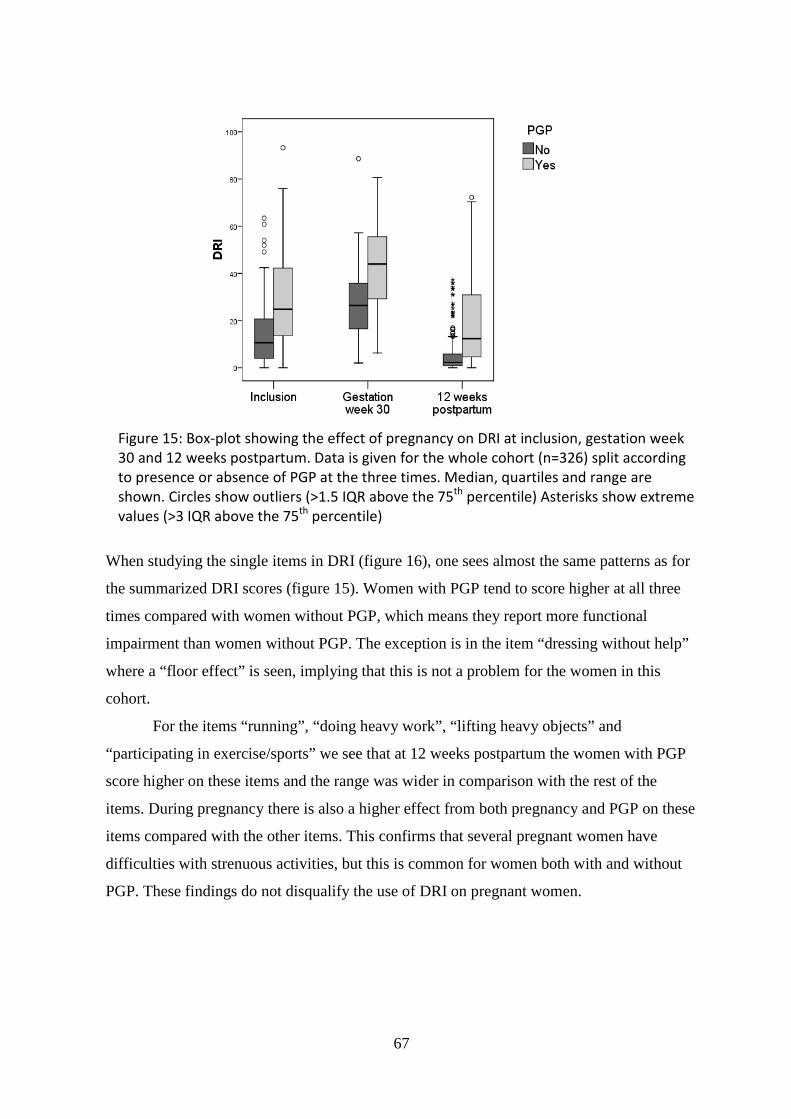
67
When studying the single items in DRI (figure 16), one sees almost the same patterns as for
the summarized DRI scores (figure 15). Women with PGP tend to score higher at all three
times compared with women without PGP, which means they report more functional
impairment than women without PGP. The exception is in the item “dressing without help”
where a “floor effect” is seen, implying that this is not a problem for the women in this
cohort.
For the items “running”, “doing heavy work”, “lifting heavy objects” and
“participating in exercise/sports” we see that at 12 weeks postpartum the women with PGP
score higher on these items and the range was wider in comparison with the rest of the
items. During pregnancy there is also a higher effect from both pregnancy and PGP on these
items compared with the other items. This confirms that several pregnant women have
difficulties with strenuous activities, but this is common for women both with and without
PGP. These findings do not disqualify the use of DRI on pregnant women.
Figure 15: Box-plot showing the effect of pregnancy on DRI at inclusion, gestation week 30 and 12 weeks postpartum. Data is given for the whole cohort (n=326) split according to presence or absence of PGP at the three times. Median, quartiles and range are shown. Circles show outliers (>1.5 IQR above the 75th percentile) Asterisks show extreme values (>3 IQR above the 75th percentile)

68
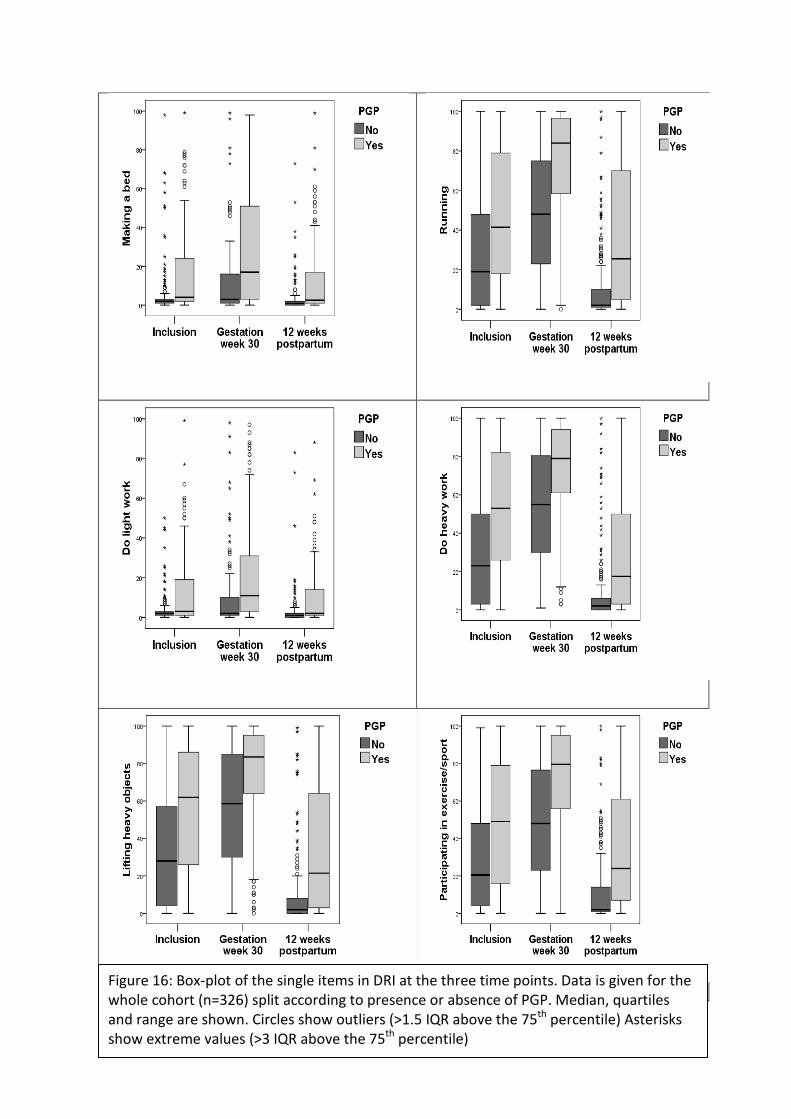
69
Pain intensity UT????
Figure 16: Box-plot of the single items in DRI at the three time points. Data is given for the whole cohort (n=326) split according to presence or absence of PGP. Median, quartiles and range are shown. Circles show outliers (>1.5 IQR above the 75th percentile) Asterisks show extreme values (>3 IQR above the 75th percentile)
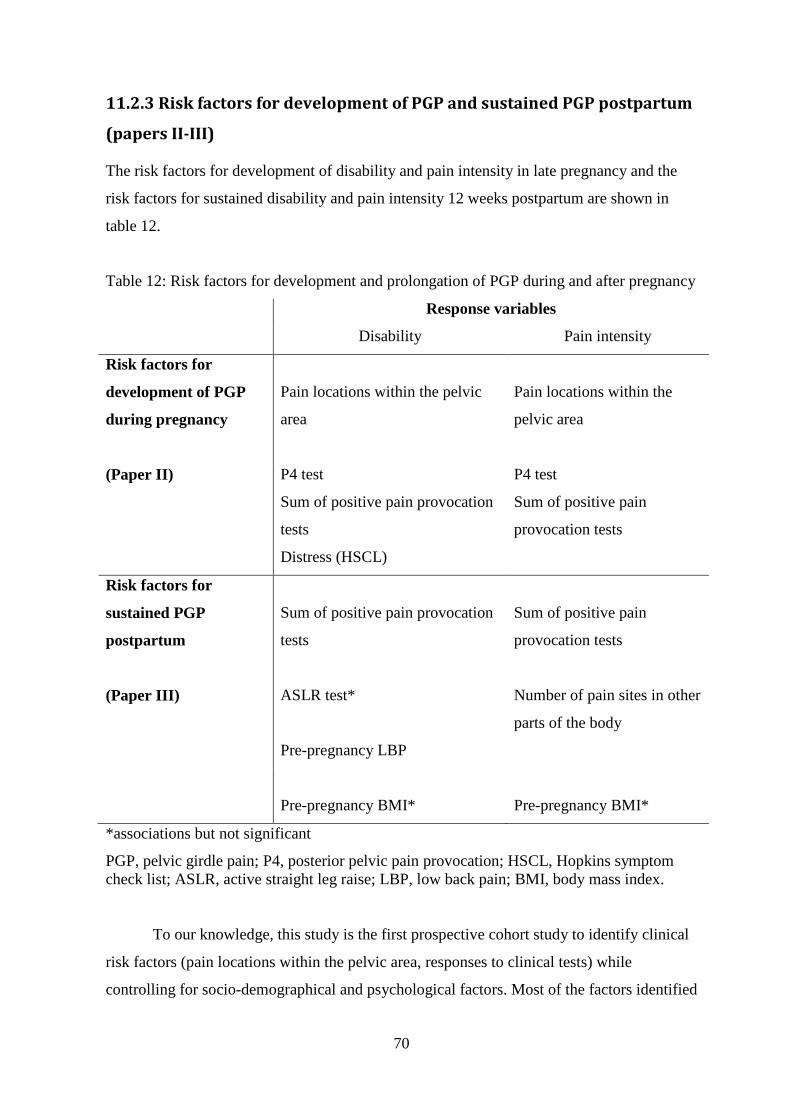
70
11.2.3 Risk factors for development of PGP and sustained PGP postpartum
(papers II-III)
The risk factors for development of disability and pain intensity in late pregnancy and the
risk factors for sustained disability and pain intensity 12 weeks postpartum are shown in
table 12.
Table 12: Risk factors for development and prolongation of PGP during and after pregnancy
Response variables
Disability Pain intensity
Risk factors for
development of PGP
during pregnancy
Pain locations within the pelvic
area
Pain locations within the
pelvic area
(Paper II) P4 test
Sum of positive pain provocation
tests
Distress (HSCL)
P4 test
Sum of positive pain
provocation tests
Risk factors for
sustained PGP
postpartum
(Paper III)
Sum of positive pain provocation
tests
ASLR test*
Pre-pregnancy LBP
Sum of positive pain
provocation tests
Number of pain sites in other
parts of the body
Pre-pregnancy BMI*
Pre-pregnancy BMI*
*associations but not significant
PGP, pelvic girdle pain; P4, posterior pelvic pain provocation; HSCL, Hopkins symptom check list; ASLR, active straight leg raise; LBP, low back pain; BMI, body mass index.
To our knowledge, this study is the first prospective cohort study to identify clinical
risk factors (pain locations within the pelvic area, responses to clinical tests) while
controlling for socio-demographical and psychological factors. Most of the factors identified

71
as risk factors in previous studies (e.g. age, parity, and strenuous work conditions) were not
associated with the response variables when using multivariable analyses. This may indicate
that the clinical factors are stronger and absorb the effect of most of the socio-
demographical and psychological variables. Furthermore, previous studies have often
recorded risk factors retrospectively in late pregnancy after the onset of symptoms of
PGP.4;62 These factors could be biased by the presence of pain.60 The use of a prospective
design and recording of possible risk factors early in pregnancy (paper II) before onset of
symptoms or before the symptoms were defined as a problem, reduced this bias.
The effect estimates are large for the clinical risk factors, and in both gestation week
30 and also 12 weeks postpartum the estimates for pain intensity seems to be higher than for
DRI (table 9, page 54 and table 10, page 56). For instance our data (gestation week 30)
shows that pain intensity in late pregnancy is 40.4 points higher (95 % CI: 24.4, 56.6) when
pain was present in the symphysis only, compared with having no pain in early pregnancy
and adjusted for positive response to the P4 test and the sum of positive pain provocation
tests. Even though the confidence intervals are large, the associations between clinical risk
factors and effects of PGP seem to be strong. These results could be of importance in
clinical practice, since the same information is collected and used for decision making and
selection of treatment modalities.
Interestingly, we identified different risk factors for disability and pain in gestation
week 30 than 12 weeks postpartum (table 12). However, the sum of positive pain
provocation tests is consistent for both response variables at both times (gestation week 30
and 12 weeks postpartum).
Pain locations in the pelvic area reported in early pregnancy were risk factors for
both disability and pain in gestation week 30 but pain locations in gestation week 30 were
not risk factors for any of the responses 12 weeks postpartum. This is surprising, and also in
contrast to what has been reported earlier.2;36 Albert and co-workers reported that combined
pain in symphysis and bilateral posterior pain in late pregnancy was a risk factor for non-
recovery 2 years postpartum.2 However, only bivariate associations were examined. Gutke
and co-workers reported that combined PGP/LBP in pregnancy was a risk factor for pain 3
months postpartum.36 It could be that the responses to the clinical tests identified as risk
factors in the present studies absorbed some of the effect from pain locations. The results
from paper I, where the P4 and ASLR tests were associated with pain locations in gestation
week 30 could support this assumption.

72
Most of the clinical risk factors can be seen as condition specific, while pre-
pregnancy LBP, distress and pre-pregnancy BMI are more general and also reported in
relation to both PGP and LBP before.10;28;61;70;82;94-96
Surprisingly none of the psychological factors, except for distress, were identified as
risk factors for either disability or pain in late pregnancy or postpartum. This is in contrast to
studies where psychological factors and emotional distress have been shown as important
factors for non-recovery of acute LBP.28;30;31 Fear avoidance beliefs were not identified as
risk factor for either disability or pain intensity in the present study. This finding is in
contrast to what has previously been reported for acute LBP and could support the need for
differentiating between LBP and PGP. 35;42;75 In a recent study, Olsson and co-workers
found that women with pain in early pregnancy reported significantly higher levels of fear
avoidance beliefs than women without pain.66 However, the study was cross-sectional and
did not examine risk factors for PGP. The present study reports recovered /non-recovered
three months postpartum. It is possible that a longer follow-up period may reveal effects of
psychological factors.
The number of pain sites in other parts of the body in gestation week 30 was a risk
factor for pain intensity 12 weeks postpartum and pain intensity was almost 19 mm higher
(95 % CI: 7.9, 29.6) when 3-4 pain sites in other parts of the body were present compared
with having no pain sites and adjusted for the sum of positive pain provocation tests and
pre-pregnancy BMI (table 10, page 56). This is in accordance with a prospective study on
LBP showing that widespread pain was a risk factor for persisting LBP,94 even though the
variables are not completely comparable.
11.2.4 Measurement scales used in different ways
The response to the ASLR test was associated with both disability and pain in the cross-
sectional study (paper I), but it was not a risk factor for development of PGP (paper II). As
explained in chapter 11.1.2, different cut-off values were used in the paper in this thesis. We
repeated the analyses in paper II with a cut-off value of one (instead of four) for the ASLR
score, and the results show that ASLR with the low cut off has a significant effect for both
DRI and pain intensity as response variables (Tab 13). The effects remain for the risk
factors identified in paper II. The only exception is for the sum of positive pain provocation
tests which is no longer a significant risk factor for pain intensity. Hence, when used with a
cut-off on one, the response to ASLR test in early pregnancy is identified as a risk factor for
both disability and pain intensity in gestation week 30. When the ASLR test is used with a
73
distinction between women with a strong affliction and those with less or no affliction, as
shown in paper II, the ASLR was not a risk factor for either disability or pain intensity
(0.53≤p≤0.71). One possible explanation for the difference in results might be due to a
smaller number of women with a positive ASLR test when using the higher cut off value
(n=28 vs. n=110), and thus a lower power. Alternatively, there might be fundamental
differences between the phenomena studied when using different score levels of the ASLR.
We also repeated the analyses in paper II with sum of positive pain provocation tests
as a categorical variable (0-1, 2-3, 4-5 and 6-8 positive tests) as done in paper III. This
analysis resulted in a significant effect of only 4-5 positive tests. Since there was only 12
women with 6-8 positive tests, the power of the test for this group was low and possibly of
importance for the non-significant result.
The differences of results when using the scales in different ways show that there is a
need for more research on these clinical measures.

74
Table 13 Adjusted estimates for DRI and Pain intensity with two different levels of cut-off on the score of the ASLR test. DRI Pain intensity Adjusted estimates3 Adjusted estimates3
With ASLR score on four and above *
With ASLR score on one
and above
With ASLR score on
four and above*
With ASLR score on one and
above β1 (95 % CI2) p-value β1 (95 % CI2) p-value β1 (95 % CI2) p-value β1 (95 % CI2) p-value
Pain locations No pain
Reference
0.007
Reference
0.01
Reference
<0.001
Reference
<0.001 Symphysis pain only 14.0 (3.7, 24.1) 12.4 (2.1, 22.6) 40.4 (24.4, 56.5) 37.2 (21.1, 53.3) Posterior pain only 4.8 (-0.2, 9.6) 4.4 (-0.4, 9.2) 15.3 (7.8, 22.8) 14.7 (7.2, 22.1)
Combined symphysis pain and posterior pain
11.8 (2.6, 21.0)
11.7 (2.6, 20.8)
26.0 (11.6, 40.4)
25.1 (10.9, 39.4)
P4 test Negative
Reference
<0.001
Reference
0.001
Reference
0.07
Reference
0.02 Unilateral positive 2.2 (-3.4, 7.9) 2.4 (-3.3, 8.0) 5.8 (-3.1, 14.8) 6.1 (-2.8, 15.0) Bilateral positive 12.0 (6.0, 18.0) 11.2 (5.1, 17.2) 15.2 (5.8, 24.6) 13.6 (4.2, 23.0) Sum of positive pain provocation tests
1.7 (0.3, 3.0)
0.02
1.4 (0.04, 2.7)
0.04
2.3 (0.3, 4.4)
0.03
1.7 (-0.4, 3.8)
0.1
HSCL-25 <1.75 Reference 0.006 Reference 0.04 - - - - ≥1.75 8.2 (2.3, 14.0) 6.4 (0.4, 12.5) - - - - ASLR 0 - Reference 0.04 - - Reference 0.01 >0 - 4.7 (0.1, 9.3) - - 8.7 (1.8, 15.6)
* As presented in paper II 1 Estimated regression coefficients, 2 CI, confidence interval, 3 Adjusted for the other variables in the table. DRI, Disability Rating Index; P4, posterior pain provocation; HSCL, Hopkins symptom check list; ASLR, active straight leg raise.

75
12 CONCLUSIONS
The following conclusions can be drawn from the work in this thesis:
• There is a high prevalence of PGP during and after pregnancy
• Disability is increased in late pregnancy but a large variation is seen among both the
women with and without PGP
• PGP has an additive effect on disability in pregnancy
• In late pregnancy there is an association between pain locations in the pelvic area,
responses to the posterior pelvic pain provocation test, P4, and the functional ASLR
tests and disability (DRI)
• Pain locations in the pelvic area and responses to the P4 test measured in early
pregnancy were risk factors for increased disability (DRI) and pain intensity reported
in gestation week 30 (in addition, distress was a risk factor for DRI)
• Sum of positive pain provocation tests (measured in gestation week 30) and pre-
pregnancy LBP were risk factors for sustained disability (DRI) 12 weeks postpartum
• Sum of positive pain provocation tests and number of pain sites in other parts of the
body (measured in gestation week 30) were risk factors for sustained pain intensity
12 weeks postpartum
The high prevalence of PGP during and after pregnancy indicates that there is a need for
attention by health care providers. The large variation in disability at all times regardless of
presence or absence of PGP shows that pregnancy itself has an impact on function.
Furthermore the results confirm the clinical experience that women with PGP report large
variation in affliction. The identification of clinical risk factors for PGP is a novel finding
and probably of importance for further development of treatment and prevention strategies.
76
13 CLINICAL IMPLICATIONS AND FURTHER
RESEARCH
The novel finding and main importance of this thesis is the identification of clinical risk
factors for PGP. These clinical risk factors may provide a basis for developing targeted
prevention and treatment strategies for PGP and thereby potentially reduce the numbers of
women with PGP during and after pregnancy. About ⅓ of the women in the present cohort
reported to have PGP 12 weeks postpartum, although several with low disability. From the
studies in this thesis we do not know how many of these will recover over the subsequent
months. It will be of interest to examine whether the clinical factors also represent a risk for
pain and disability one year postpartum.
We have identified new clinical risk factors, responses to clinical tests and pain
locations within the pelvic area. The next step would be to perform a prediction study,
where the effect of the identified risk factors is studied, to confirm their suitability as
predictors for PGP.

77
14 EPILOG
This thesis began with initial questions concerning PGP, previous research and certain
unanswered issues. Through the work done in conjunction to the present thesis, it does
appear that some of these issues have been partially answered and new knowledge has been
acquired.
The results from the studies confirm that the prevalence of PGP is high, even when
examined in a prospective design. Since more than 60 % of the pregnant women reported
having pain in the pelvic area, this probably indicates that some pain and discomfort in this
area during pregnancy is normal. The broad variation in affliction implies that the effect of
the pain also varies to a great extent. We have documented that pregnancy itself has an
effect on disability and that PGP gives an additive effect. Furthermore, we see that the use
of graded scales as outcome measures has been valuable because it provides information
about affliction. The results indicate that the degree of affliction should be focused upon in
addition to the presence of PGP, in research as well as in clinical work. Focus on affliction
may be helpful in developing priority strategies. Identification of clinical predictors may
offer possibilities for developing new treatment strategies. The latter implies further
research on treatment for PGP.

78
Reference list
Reference List
1. Albert H, Godskesen M, Westergaard J. Evaluation of clinical tests used in classification procedures in pregnancy-related pelvic joint pain. Eur.Spine J. 2000;9:161-6.
2. Albert H, Godskesen M, Westergaard J. Prognosis in four syndromes of pregnancy-related pelvic pain. Acta Obstet.Gynecol.Scand 2001;80:505-10.
3. Albert H, Godskesen M, Westergaard JG, Chard T, Gunn L. Circulating levels of relaxin are normal in pregnant women with pelvic pain. Eur.J Obstet.Gynecol.Reprod.Biol. 1997;74:19-22.
4. Albert HB, Godskesen M, Korsholm L, Westergaard JG. Risk factors in developing pregnancy-related pelvic girdle pain. Acta Obstet.Gynecol.Scand. 2006;85:539-44.
5. Albert HB, Godskesen M, Westergaard JG. Incidence of four syndromes of pregnancy-related pelvic joint pain. Spine 2002;27:2831-4.
6. Altman DG. Practical Statistics for Medical Research. London: Chapman & Hall, 1991.
7. Bastiaanssen JM, de Bie RA, Bastiaenen CH, Essed GG, van den Brandt PA. A historical perspective on pregnancy-related low back and/or pelvic girdle pain. Eur.J.Obstet.Gynecol.Reprod.Biol. 2005;120:3-14.
8. Berg G, Hammar M, Moller-Nielsen J, Linden U, Thorblad J. Low back pain during pregnancy. Obstet.Gynecol. 1988;71:71-5.
9. Bjorklund K, Bergstrom S. Is pelvic pain in pregnancy a welfare complaint? Acta Obstet.Gynecol.Scand. 2000;79:24-30.
10. Breen TW, Ransil BJ, Groves PA, Oriol NE. Factors associated with back pain after childbirth. Anesthesiology 1994;81:29-34.
11. Breivik H, Borchgrevink PC, Allen SM, Rosseland LA, Romundstad L, Hals EK, Kvarstein G et al. Assessment of pain. Br.J.Anaesth. 2008;101:17-24.
12. Broadhurst NA, Bond MJ. Pain provocation tests for the assessment of sacroiliac joint dysfunction [see comments]. J.Spinal Disord. 1998;11:341-5.
13. Brynhildsen J, Hansson A, Persson A, Hammar M. Follow-up of patients with low back pain during pregnancy. Obstet.Gynecol. 1998;91:182-6.
14. Buer N, Linton SJ. Fear-avoidance beliefs and catastrophizing: occurrence and risk factor in back pain and ADL in the general population. Pain 2002;99:485-91.
15. Burton AK, Tillotson KM, Main CJ, Hollis S. Psychosocial predictors of outcome in acute and subchronic low back trouble. Spine 1995;20:722-8.
79
16. Coffin-Zadai CA. Disabling our diagnostic dilemmas. Phys.Ther. 2007;87:641-53.
17. Cohen J. A power primer. Psychol.Bull. 1992;112:155-9.
18. Croft P. The question is not "have you got it"? But "how much of it have you got"? Pain 2009;141:6-7.
19. Damen L, Buyruk HM, Guler-Uysal F, Lotgering FK, Snijders CJ, Stam HJ. Pelvic pain during pregnancy is associated with asymmetric laxity of the sacroiliac joints. Acta Obstet.Gynecol.Scand 2001;80:1019-24.
20. Domholdt E. Rehabilitation Research. Principles and Applications. 3 ed. Philadelphia, Pennsylvania: Elsevier Saunders, 2005.
21. Donelson R, Aprill C, Medcalf R, Grant WE. A Prospective Study of Centralization of Lumbar and Referred Pain: A Predictor of Symptomatic Discs and Anular Competence. Spine 1997;22:1115-22.
22. Endresen EH. Pelvic pain and low back pain in pregnant women--an epidemiological study. Scand.J.Rheumatol. 1995;24:135-41.
23. Fairbank JC, Pynsent PB. The Oswestry Disability Index. Spine 2000;25:2940-52.
24. Fast A, Shapiro D, Ducommun EJ, Friedmann LW, Bouklas T, Floman Y. Low-Back-Pain in Pregnancy. Spine 1987;12:368-71.
25. Fortin JD, Aprill CN, Ponthieux B, Pier J. Sacroiliac joint: pain referral maps upon applying a new injection/arthrography technique. Part II: Clinical evaluation. Spine 1994;19:1483-9.
26. Fortin JD, Dwyer AP, West S, Pier J. Sacroiliac joint: pain referral maps upon applying a new injection/arthrography technique. Part I: Asymptomatic volunteers. Spine 1994;19:1475-82.
27. Foti T, Davids JR, Bagley A. A biomechanical analysis of gait during pregnancy. J.Bone Joint Surg.Am. 2000;82:625-32.
28. Grotle M, Brox JI, Veierod MB, Glomsrod B, Lonn JH, Vollestad NK. Clinical course and prognostic factors in acute low back pain: patients consulting primary care for the first time. Spine 2005;30:976-82.
29. Grotle M, Brox JI, Vollestad NK. Functional status and disability questionnaires: what do they assess? A systematic review of back-specific outcome questionnaires. Spine (Phila Pa 1976.) 2005;30:130-40.
30. Grotle M, Vollestad NK, Brox JI. Clinical course and impact of fear-avoidance beliefs in low back pain: prospective cohort study of acute and chronic low back pain: II. Spine 2006;31:1038-46.
31. Grotle M, Vollestad NK, Veierod MB, Brox JI. Fear-avoidance beliefs and distress in relation to disability in acute and chronic low back pain. Pain 2004;112:343-52.
80
32. Grunfeld B, Qvigstad E. [Disease during pregnancy. Sick-listing among pregnant women in Oslo]. Tidsskr.Nor Laegeforen. 1991;111:1269-72.
33. Gutke A. Pelvic Girdle Pain and Lumbar Pain in relation to pregnancy. 2007. Linkøping University.
Ref Type: Thesis/Dissertation
34. Gutke A, Hansson ER, Zetherstrom G, Ostgaard HC. Posterior pelvic pain provocation test is negative in patients with lumbar herniated discs. Eur.Spine J. 2009;18:1008-12.
35. Gutke A, Ostgaard HC, Oberg B. Pelvic girdle pain and lumbar pain in pregnancy: a cohort study of the consequences in terms of health and functioning. Spine 2006;31:E149-E155.
36. Gutke A, Ostgaard HC, Oberg B. Predicting persistent pregnancy-related low back pain. Spine 2008;33:E386-E393.
37. Hansen A, Jensen DV, Wormslev M, Minck H, Johansen S, Larsen EC, Wilken-Jensen C et al. Symptom-giving pelvic girdle relaxation in pregnancy. II: Symptoms and clinical signs. Acta Obstet.Gynecol.Scand 1999;78:111-5.
38. Hosmer D, Lemesoh S. Applied logistic regression. Second edition ed. USA: John Wiley & Sons, Inc, 2000.
39. Kamaleri Y, Natvig B, Ihlebaek CM, Benth JS, Bruusgaard D. Change in the number of musculoskeletal pain sites: A 14-year prospective study. Pain 2009;141:25-30.
40. Kamaleri Y, Natvig B, Ihlebaek CM, Bruusgaard D. Localized or widespread musculoskeletal pain: does it matter? Pain 2008;138:41-6.
41. Kirkwood BR, Sterne JAC. Essential Medical Statistics. Second ed. Massachusetts, USA: Blackwell Science Ltd, 2003.
42. Kogstad O. [Pelvic instability. A controversial diagnosis]. Tidsskr.Nor Laegeforen. 1988;108:1115-9.
43. Kogstad O, Biornstad N. [Pelvic girdle relaxation. Pathogenesis, etiology, definition, epidemiology]. Tidsskr.Nor Laegeforen. 1990;110:2209-11.
44. Kristiansson P, Svardsudd K. Discriminatory power of tests applied in back pain during pregnancy. Spine 1996;21:2337-43.
45. Kristiansson P, Svardsudd K, von Schoultz B. Back pain during pregnancy: a prospective study. Spine 1996;21:702-9.
46. Kristiansson P, Svardsudd K, von Schoultz B. Serum relaxin, symphyseal pain, and back pain during pregnancy. Am.J.Obstet.Gynecol. 1996;175:1342-7.
47. LaBan MM, Perrin JC, Latimer FR. Pregnancy and the herniated lumbar disc. Arch.Phys.Med.Rehabil. 1983;64:319-21.

81
48. Larsen EC, Wilken-Jensen C, Hansen A, Jensen DV, Johansen S, Minck H, Wormslev M et al. Symptom-giving pelvic girdle relaxation in pregnancy. I: Prevalence and risk factors. Acta Obstet.Gynecol.Scand. 1999;78:105-10.
49. Laslett M. Diagnostic accuracy of the Clinical Examination Compared to Available Reference Standards in Chronic Low Back Pain Patients. 2005. Linköpings Universitet, Linköping Sweden.
Ref Type: Thesis/Dissertation
50. Laslett M, Williams M. The reliability of selected pain provocation tests for sacroiliac joint pathology. Spine 1994;19:1243-9.
51. Laslett M, Young SB, Aprill CN, McDonald B. Diagnosing painful sacroiliac joints: A validity study of a McKenzie evaluation and sacroiliac provocation tests. Aust.J.Physiother. 2003;49:89-97.
52. Laslett M, Aprill CN, McDonald B, Young SB. Diagnosis of Sacroiliac Joint Pain: Validity of individual provocation tests and composites of tests. Manual Therapy 2005;10:207-18.
53. Linton SJ, Buer N, Vlaeyen JW, Hellsing AL. Are Fear -Avoidance Beliefs Related to the Inception of an Apisode of Back Pain? A Prospective Study. Psychology and Health 2000;14:1051-9.
54. MacLennan AH, Nicolson R, Green RC, Bath M. Serum relaxin and pelvic pain of pregnancy. Lancet 1986;2:243-5.
55. Mantle MJ, Greenwood RM, Currey HL. Backache in pregnancy. Rheumatol.Rehabil. 1977;16:95-101.
56. Mens JM, Vleeming A, Snijders CJ, Koes BW, Stam HJ. Reliability and validity of the active straight leg raise test in posterior pelvic pain since pregnancy. Spine 2001;26:1167-71.
57. Mens JM, Vleeming A, Snijders CJ, Koes BW, Stam HJ. Validity of the active straight leg raise test for measuring disease severity in patients with posterior pelvic pain after pregnancy. Spine 2002;27:196-200.
58. Mens JM, Vleeming A, Snijders CJ, Stam HJ, Ginai AZ. The active straight leg raising test and mobility of the pelvic joints. Eur.Spine J. 1999;8:468-74.
59. Mens JM, Vleeming A, Stoeckart R, Stam HJ, Snijders CJ. Understanding peripartum pelvic pain. Implications of a patient survey. Spine 1996;21:1363-9.
60. Miranda H, Gold JE, Gore R, Punnett L. Recall of prior musculoskeletal pain. Scand.J.Work Environ.Health 2006;32:294-9.
61. Mogren IM. BMI, pain and hyper-mobility are determinants of long-term outcome for women with low back pain and pelvic pain during pregnancy. Eur.Spine J. 2006;15:1093-102.

82
62. Mogren IM, Pohjanen AI. Low back pain and pelvic pain during pregnancy: prevalence and risk factors. Spine 2005;30:983-91.
63. Mousavi SJ, Parnianpour M, Vleeming A. Pregnancy related pelvic girdle pain and low back pain in an Iranian population. Spine 2007;32:E100-E104.
64. Nielsen CS, Staud R, Price DD. Individual differences in pain sensitivity: measurement, causation, and consequences. J.Pain 2009;10:231-7.
65. Noren L, Ostgaard S, Johansson G, Ostgaard HC. Lumbar back and posterior pelvic pain during pregnancy: a 3-year follow-up. Eur.Spine J. 2002;11:267-71.
66. Olsson C, Buer N, Holm K, Nilsson-Wikmar L. Lumbopelvic pain associated with catastrophizing and fear-avoidance beliefs in early pregnancy. Acta Obstet.Gynecol.Scand. 2009;88:378-85.
67. Olsson C, Nilsson-Wikmar L. Health-related quality of life and physical ability among pregnant women with and without back pain in late pregnancy. Acta Obstetricia et Gynecologica Scandinavica 2004;83:351-7.
68. Orvieto R, Achiron A, Ben Rafael Z, Gelernter I, Achiron R. Low-back pain of pregnancy. Acta Obstet.Gynecol.Scand 1994;73:209-14.
69. Ostgaard HC. Assessment and treatment of low back pain in working pregnant women. Semin.Perinatol. 1996;20:61-9.
70. Ostgaard HC, Andersson GB. Postpartum low-back pain. Spine 1992;17:53-5.
71. Ostgaard HC, Andersson GB, Karlsson K. Prevalence of back pain in pregnancy. Spine 1991;16:549-52.
72. Ostgaard HC, Andersson GB, Schultz AB, Miller JA. Influence of some biomechanical factors on low-back pain in pregnancy. Spine 1993;18:61-5.
73. Ostgaard HC, Roos-Hansson E, Zetherstrom G. Regression of back and posterior pelvic pain after pregnancy. Spine 1996;21:2777-80.
74. Ostgaard HC, Zetherstrom G, Roos-Hansson E. The posterior pelvic pain provocation test in pregnant women. Eur.Spine J. 1994;3:258-60.
75. Ostgaard HC, Zetherstrom G, Roos-Hansson E, Svanberg B. Reduction of back and posterior pelvic pain in pregnancy. Spine 1994;19:894-900.
76. Polit DF, Beck CT. Nursing Research Principles and Methods. 8th Edition ed. Philadelphia: Lippincott Williams & Wilkins, 2008.
77. Potter NA, Rothstein JM. Intertester reliability for selected clinical tests of the sacroiliac joint. Phys.Ther. 1985;65:1671-5.
78. Rickels K, Garcia CR, Lipman RS, Derogatis LR, Fisher EL. The Hopkins Symptom Checklist. Assessing emotional distress in obstetric-gynecologic practice. Prim.Care 1976;3:751-64.

83
79. Robinson HS, Brox JI, Robinson R, Bjelland E, Solem S, Telje T. The reliability of selected motion- and pain provocation tests for the sacroiliac joint. Man.Ther. 2007;12:72-9.
80. Robinson HS, Eskild A, Heiberg E, Eberhard-Gran M. Pelvic girdle pain in pregnancy: the impact on function. Acta Obstet.Gynecol.Scand. 2006;85:160-4.
81. Rost CC, Jacqueline J, Kaiser A, Verhagen AP, Koes BW. Pelvic pain during pregnancy: a descriptive study of signs and symptoms of 870 patients in primary care. Spine 2004;29:2567-72.
82. Rost CC, Jacqueline J, Kaiser A, Verhagen AP, Koes BW. Prognosis of women with pelvic pain during pregnancy: a long-term follow-up study. Acta Obstet.Gynecol.Scand. 2006;85:771-7.
83. Salen BA, Spangfortke L, Nordemar R. The disability rating index: An instrument for the assessment of disability in clinical settings. Journal of Clinical Epidemiology 1994;47:1423-35.
84. Sandanger I, Moum T, Ingebrigtsen G, Dalgard OS, Sorensen T, Bruusgaard D. Concordance between symptom screening and diagnostic procedure: the Hopkins Symptom Checklist-25 and the Composite International Diagnostic Interview I. Soc.Psychiatry Psychiatr.Epidemiol. 1998;33:345-54.
85. Statistics Norway. Population statistics. [Statistics Norway]. February 2010; Available at: http://www.ssb.no/english/subjects/02/02/10/fodte_en/.
86. Strender LE, Sjoblom A, Sundell K, Ludwig R, Taube A. Interexaminer reliability in physical examination of patients with low back pain. Spine 1997;22:814-20.
87. Stuge B. Physical therapy for pregnancy-related pelvic girdle pain. Underlying principles and effect of treatment. 2005. Faculty of Medicine, University of Oslo, Oslo, Norway.
Ref Type: Thesis/Dissertation
88. Stuge B, Laerum E, Kirkesola G, Vollestad N. The efficacy of a treatment program focusing on specific stabilizing exercises for pelvic girdle pain after pregnancy: a randomized controlled trial. Spine 2004;29:351-9.
89. Stuge B, Veierod MB, Laerum E, Vollestad N. The efficacy of a treatment program focusing on specific stabilizing exercises for pelvic girdle pain after pregnancy: a two-year follow-up of a randomized clinical trial. Spine 2004;29:E197-E203.
90. Sturesson B, Selvik G, Uden A. Movements of the sacroiliac joints. A roentgen stereophotogrammetric analysis. Spine 1989;14:162-5.
91. Sturesson B, Uden G, Uden A. Pain pattern in pregnancy and "catching" of the leg in pregnant women with posterior pelvic pain. Spine 1997;22:1880-3.
92. Sydsjo A, Sydsjo G, Kjessler B. Sick leave and social benefits during pregnancy--a Swedish-Norwegian comparison. Acta Obstet.Gynecol.Scand. 1997;76:748-54.

84
93. Sydsjo A, Sydsjo G, Wijma B. Increase in sick leave rates caused by back pain among pregnant Swedish women after amelioration of social benefits. A paradox. Spine 1998;23:1986-90.
94. Thomas E, Silman AJ, Croft PR, Papageorgiou AC, Jayson MI, Macfarlane GJ. Predicting who develops chronic low back pain in primary care: a prospective study. BMJ 1999;318:1662-7.
95. To WW, Wong MW. Factors associated with back pain symptoms in pregnancy and the persistence of pain 2 years after pregnancy. Acta Obstet.Gynecol.Scand. 2003;82:1086-91.
96. Turgut F, Turgut M, Cetinsahin M. A prospective study of persistent back pain after pregnancy. Eur.J.Obstet.Gynecol.Reprod.Biol. 1998;80:45-8.
97. van der Wurff P., Hagmeijer RH, Meyne W. Clinical tests of the sacroiliac joint. A systemic methodological review. Part 1: reliability. Man.Ther. 2000;5:30-6.
98. van der Wurff P., Meyne W, Hagmeijer RH. Clinical tests of the sacroiliac joint. Man.Ther. 2000;5:89-96.
99. van Dongen PW, de Boer M, Lemmens WA, Theron GB. Hypermobility and peripartum pelvic pain syndrome in pregnant South African women. Eur.J.Obstet.Gynecol.Reprod.Biol. 1999;84:77-82.
100. Van Tulder M, Becker A, Bekkering T, Breen A, del Real MT, Hutchinson A, Koes B et al. Chapter 3. European guidelines for the management of acute nonspecific low back pain in primary care. Eur.Spine J. 2006;15 Suppl 2:S169-S191.
101. Verhoeven JJ, Tuinman M, Van Dongen PWJ. Joint hypermobility in African non-pregnant nulliparous women. European Journal of Obstetrics & Gynecology and Reproductive Biology 1999;82:69-72.
102. Vlaeyen JW, Linton SJ. Fear-avoidance and its consequences in chronic musculoskeletal pain: a state of the art. Pain 2000;85:317-32.
103. Vlaeyen JWS, Crombez G, Goubert L. Science and psychology of pain. In: Breivik H, Shipley M, eds. Pain. Best practice and research compenidun. Philadelphia: Elsevier, 2007:7-15.
104. Vleeming A, Albert H, Ostgaard HC, Stuge B, Sturesson B. European Guidelines on the Diagnosis and Treatment of Pelvic Girdle Pain. In: Vleeming A, Mooney V, Hodges PW et al., eds. 5th Interdisciplinary World Congress on Low Back &Pelvic Pain. Effevtive Diagnosis ant Treatment of Lumbopelvic Pain. Melbourne, Australia: 2004:6-48.
105. Vleeming A, Albert H, Ostgaard HC, Stuge B, Sturesson B. European Guidelines on the Diagnosis and Treatment of Pelvic Girdle Pain. [European Commission, Research Directorate-General, Department of Policy, Coordination and Strategy]. 2005; Available at: www.backpaineurope.org/web/files/WG4Guidelines.pdf.
85
106. Vleeming A, Albert HB, Ostgaard HC, Sturesson B, Stuge B. European guidelines for the diagnosis and treatment of pelvic girdle pain. Eur.Spine J. 2008;17:794-819.
107. Vleeming A, de Vries HJ, Mens JM, van Wingerden JP. Possible role of the long dorsal sacroiliac ligament in women with peripartum pelvic pain. Acta Obstet.Gynecol.Scand 2002;81:430-6.
108. Vollestad NK, Stuge B. Prognostic factors for recovery from postpartum pelvic girdle pain. Eur.Spine J. 2009.
109. Waddell G. The Back Pain Revolution. Second edition ed. Edinburgh: Churchill Livingstone, 2004.
110. Waddell G, Newton M, Henderson I, Somerville D, Main CJ. A Fear-Avoidance Beliefs Questionnaire (FABQ) and the role of fear-avoidance beliefs in chronic low back pain and disability. Pain 1993;52:157-68.
111. WCPT. Description of Physiotherapy - What is physiotherapy? [World Confederation for Physical Therapy]. 2010; Available at: http://www.wcpt.org/node/29599.
112. WHO. The International Classification of Functioning Disability and Health. Geneva: 2001.
113. WHO. Obesity and overweight. [WHO]. 2010; Available at: http://www.who.int/mediacentre/factsheets/fs311/en/index.html. Accessed January 25, 2010.
114. Wu WH, Meijer OG, Uegaki K, Mens JMA, van Dieen JH, Wuisman PIJM, Ostgaard HC. Pregnancy-related pelvic girdle pain (PPP), I: Terminology, clinical presentation, and prevalence. European Spine Journal 2004;13:575-89.
115. Young S, Aprill C, Laslett M. Correlation of clinical examination characteristics with three sources of chronic low back pain. Spine J. 2003;3:460-5.

86

87
PAPER I Hilde Stendal Robinson, Anne Marit Mengshoel, Elisabeth K Bjelland, Nina K Vøllestad.
Pelvic girdle pain, clinical tests and disability in late pregnancy
Manual Therapy, 15 (2010) 280-285


Article 1 is removed.

PAPER II Hilde Stendal Robinson, Marit B Veierød, Anne Marit Mengshoel, Nina K Vøllestad.
Pelvic girdle pain – associations between risk factors in early pregnancy and
disability or pain intensity in late pregnancy: a prospective cohort study
BMC Musculoskeletal disorders, 2010


1
Pelvic girdle pain – associations between risk factors in early pregnancy and disability
or pain intensity in late pregnancy: a prospective cohort study
Hilde Stendal Robinson1§
, Marit B Veierød2, Anne Marit Mengshoel
1, Nina K Vøllestad
1
1 Department of Nursing and Health Sciences, Institute of Health and Society, University of
Oslo, P.O.Box 1153 Blindern, NO- 0318 Oslo, Norway
2Department of Biostatistics, Institute of Basic Medical Sciences, University of Oslo, NO-
0317 Oslo, Norway
All authors contributed equally to this work.
§
Corresponding author
Email addresses:
HSR: [email protected]
MBV: [email protected]
AMM: [email protected]
NKV: [email protected]

2
Abstract
Background
Recent studies have shown high prevalence rates for pelvic girdle pain (PGP) in pregnancy.
Some risk factors for developing PGP have been suggested, but the evidence is weak.
Furthermore there is almost no data on how findings from clinical examinations are related to
subsequent PGP. The main purpose for this study was to study the associations between
socio-demographical, psychological and clinical factors measured at inclusion in early
pregnancy and disability or pain intensity in gestation week 30.
Methods
This is a prospective cohort study following women from early to late pregnancy. Eligible
women were recruited at their first attendance at the maternity care unit. 268 pregnant women
answered questionnaires and underwent clinical examinations in early pregnancy and in
gestation week 30. We used scores on disability and pain intensity in gestation week 30 as
outcome measures to capture the affliction level of PGP. Multiple linear regression analysis
was used to study the associations between potential risk factors measured in early pregnancy
and disability or pain intensity in gestation week 30.
Results
Self-reported pain locations in the pelvis, positive posterior pelvic pain provocation (P4) test
and a sum of pain provocation tests in early pregnancy were significantly associated with
disability and pain intensity in gestation week 30 in a multivariable statistic model. In
addition, distress was significantly associated with disability. The functional active straight
leg raise (ASLR) test, fear avoidance beliefs and the number of pain sites were not
significantly associated with either disability or pain intensity.
3
Conclusions
The results suggest that a clinical examination, including a few tests, performed in early
pregnancy may identify women at risk of a more severe PGP late in pregnancy. The
identification of clinical risk factors may provide a foundation for development of targeted
prevention strategies.

4
Pelvic girdle pain – associations between risk factors in early pregnancy and disability
or pain intensity in late pregnancy: a prospective cohort study
Background
Pelvic girdle pain (PGP) is common in pregnancy. Recent studies have shown that about 33-
50% of pregnant women report PGP before 20 weeks of gestation, and that the prevalence
may reach 60-70% in late pregnancy [1-3]. Despite these high prevalence estimates, we have
little knowledge about the risk factors for PGP in pregnancy. Previous studies have reported
that strenuous work, a pre-pregnancy history of low back pain (LBP), previous PGP, and
multipara are associated with PGP in pregnancy [4-9]. Associations between PGP and
psychological variables such as catastrophizing, fear-avoidance beliefs and distress have also
been reported [8,10]. However, the number of studies are limited and often hampered by
either being retrospective or cross-sectional [7,8], or by lack of multivariable analyses in the
prospective studies [4-6].
Moreover, the response variables used in previous studies have most often been
dichotomous, such as presence of PGP or not, and did not necessarily reflect the severity of
the condition. The importance of also using graded scales has recently been pointed out by
Croft [11]. In a recent cross-sectional study we used graded scales and showed that women
with combined symphysis pain and bilateral posterior pelvic pain in late pregnancy reported
more disability than women with fewer pain sites in the pelvis [3]. Others have shown that
women with this combination of pain locations were also less likely to recover postpartum
than those with more limited pain distribution [12,13].
Clinical management would probably benefit from an early identification of women
at risk for developing disabling symptoms later in pregnancy. A number of tests for pain
provocation of different tissues and locations in the pelvis are commonly used and

5
recommended [14]. Although both pain provocation tests and functional tests have most often
been used for diagnostic purposes [13,15-17], they might also detect processes at an early
stage. Previous studies of PGP during and after pregnancy have reported that positive scores
on the posterior pelvic pain provocation (P4) test and the functional Active Straight Leg Raise
(ASLR) test were associated with disability [3,18,19] and pain [16,18,19]. Furthermore, when
blinded assessors were used, relative high frequencies of positive responses to the tests were
also reported for pregnant women without pain in the pelvic area [3] . These results could
either indicate low specificity or alternatively that the tests could detect subclinical afflictions
and thus be valuable in early identification of those at risk for more severe afflictions.
We established a cohort of pregnant women to study the associations between socio-
demographical, psychological and clinical factors measured at inclusion in early pregnancy
and disability or pain intensity in gestation week 30.
Methods
This is a prospective cohort study following pregnant women in Norway from early
pregnancy to gestation week 30.
Procedure
The Norwegian public health system offers all women free health services during pregnancy
and most women seek special maternity care units (MCUs) for this purpose. We collaborated
with four public MCUs in this study, one was located in central Oslo (capital, about 580 000
inhabitants), and the other three covered one entire community (about 24 000 inhabitants) just
outside Oslo. Eligible participants were Norwegian-speaking women, who registered at these
four MCUs between January 2006 and June 2007. Women not expected to have a normal
pregnancy (as determined by the midwives) were excluded. Out of 385 eligible women, 326
6
gave their informed consent for participation. Out of these 326 women, 280 were included
before they reached 20 weeks of gestation, and were thus defined as being in early pregnancy
(figure 1). From the time of inclusion to gestation week 30, there were 3 drop-outs and 9
miscarriages among the 280 women included early, thus 268 women participated in gestation
week 30 and these constituted our study sample.
After inclusion all answered a comprehensive questionnaire assessing
sociodemographic variables, pain locations, pain intensity and disability, distress, and fear-
avoidance beliefs. The questionnaire also included questions on general health, health-related
quality of life, health locus of control, use of contraceptives, other complaints, and physical
activities, variables that were not used in this part of the study. The registered gestation week
refers to the week the women were included to the study and completed the questionnaire.
All women were clinically examined in early pregnancy by one of two
physiotherapists with post-gradual education in manual therapy. This examination was
performed as closely to the inclusion date as possible. Mean time difference between
answering the questionnaire and being examined was 1.1 week (SD 1.7 weeks). The clinical
examination included six pain provocation tests for the pelvic joints as well as the functional
ASLR test and Beighton score for hyper mobility. Other clinical tests were also included, but
were not used in this part of the study. The examiner was blinded for all questionnaire data. In
gestation week 30, the women filled in a new questionnaire assessing the same elements as at
inclusion and underwent a corresponding clinical examination. Data from the clinical
examination in gestation week 30 was not used in this part of the study. The Regional
Committee for Medical Research Ethics and the Norwegian Social Science Data Services
gave formal approval for the study.

7
Measurements of response variables
Disability and pain intensity were obtained from questionnaire data collected in gestation
week 30. Disability was measured by the Disability Rating Index (DRI), consisting of twelve
visual analogue scales (VAS) measuring the ability to perform activities of daily living [20].
The scales ranged from 0 – 100 mm, where the end points were “ability to perform activity
without restriction” and “inability to perform the activity”, respectively. The twelve activities
were: dressing without help, outdoor walks, climbing stairs, sitting for a longer time, standing
bent over a sink, carrying a bag, making a bed, running, do light work, do heavy work, lifting
heavy objects, participating in exercise/sport. DRI was calculated as the mean of the twelve
scales. In order to allow the assessment of disability in women with and without PGP, we
chose DRI because it measures disability by limitations in daily activities independent of pain.
DRI has previously been applied in studies of pregnant women [2,10], and we also evaluated
the items to be adequate for this group.
Pain intensity was measured by the response to the following question: “How strong is
your worst evening pain before going to bed?” Since PGP has been suggested to increase
with activity [9,17], we chose the intensity of the worst evening pain as the most relevant
measure for their experienced degree of pain affliction. The response was measured by a 0-
100 mm VAS and the end points were “no pain” and “unbearable pain”.
Measurements at inclusion in early pregnancy
Potential risk factors for PGP were measured by questionnaire and clinical examination at
inclusion in early pregnancy.
Questionnaire data:

8
Socio-demographical data included age (years), parity (0, 1, ≥2 children), marital status
(single, married/cohabitant), education (≤12 years of school attendance, ≤4 years at
university, > 4 years at university), use of contraceptive pills last year before pregnancy (yes,
no), smoking (yes, no), physical activity before pregnancy (none, < 2, 2 - 4, > 4 hours per
week), full time work (yes, no). Pre-pregnancy body mass index (BMI, weight/height2) was
calculated from self-reported height and weight.
The working condition was identified from the question: “How would you describe
your work situation?” With four response alternatives: 1) Most of the time seated; 2) I have to
walk a lot; 3) I walk and lift objects; 4) Heavy work. PGP was assumed to increase with
weight bearing activities like walking and lifting objects [6,9]. Working condition was
categorized as mostly seated work (response alternative 1) and heavy work (response
alternatives 2-4).
The Hopkins Symptom Check List (HCSL-25) was used to measure distress (self-
reported symptoms of anxiety, depression and somatisation) [21]. Twenty-five symptoms
were recorded on a scale from 1 (not bothered) to 4 (extremely bothered). The average value
was calculated to obtain the HSCL-25 score. We used a cut off value of 1.75 as established
for women by Sandanger and co-workers (1998), and the cut-off reflected non-specific
distress, rather than a psychiatric diagnosis [22].
Fear avoidance beliefs was measured by the modified Fear Avoidance Beliefs
Questionnaire (mFABQ) [23]. This includes four of the items from the part concerning
activity in the original Fear Avoidance Beliefs Questionnaire [23,24]. We chose the modified
version because it was possible to answer also by individuals without pain. In accordance with
the work from Linton and co-workers [23], the following instructions were given in the
questionnaire: “Some women are likely to be afflicted by pain in the back and pelvis during
pregnancy. For research purposes, we would like to know if you believe that there is a

9
relationship between such afflictions and activities. Please circle the number on the scale that
best corresponds to your belief for each of the following statements”. The scale ranged from 0
(total disagreement), to 6 (total agreement), and the total score on mFABQ ranged from 0-24
[23].
Pain locations within the pelvic area (PGP) were determined by a pain drawing filled
in by the women before the clinical examination. After the examination, the women were
asked to point out the pain sites on their body and, if necessary, the examiner corrected the
pain drawing to reflect the areas pointed out. The pain locations in the pelvic area were
subsequently coded: no PGP, pain in symphysis only, only posterior pain (uni- or bilateral),
combined symphysis pain and unilateral posterior pain, and combined symphysis pain and
bilateral posterior pain [3,25]. The two latter categories were collapsed in the analyses
(combined symphysis and posterior pain) because of low frequencies.
The number of pain sites was calculated from the questions where the women were
asked if they have pain (yes, no) in the neck, shoulder and arms, between the shoulder blades,
in the knees. The sum score (0-4) was used in the analyses. Pain located in the area of the
lower back and the pelvis was not included in this sum.
Pre-pregnancy history of LBP was identified from the question: “Have you suffered
from LBP before you were pregnant (yes, no)?”
Clinical examination:
Beighton score was used as a measure for joint laxity and consists of 9 tests [26,27]:
hyperextension of the knees (yes, no), hyperextension (>10▫) of the elbows (yes, no), passive
apposition of the thumbs to the flexor aspect of the forearm with straight elbow (yes, no),
passive hyperextension of the 5th metacarpophalangeal joints ≥ 90▫ (yes, no)
, forward flexion
of the trunk, with knees straight, so that the palms of the hands rest easily on the floor (yes,

10
no). The angles were measured with a goniometer. A sum score (0-9) was made of the results
of all the tests and hypermobility was defined as a sum score of four and above [26].
We used one functional test, the ASLR test, and six pain provocation tests: the P4 test,
the distraction test, the compression test, the Patrick Faber test, the palpation test of the
symphysis pubis and the long dorsal sacroiliac ligament (LDL). All the tests have been
commonly used and have shown moderate to excellent inter-rater reliability [17,18,28,29].
The active straight leg (ASLR) test [18]: The ASLR test was performed with the
women in a supine position with straight legs and feet about 20 cm apart. The women lifted
each leg separately about 20 cm above the couch. She was asked to score the difficulty on a
six-point scale from 0 (not difficult to lift) to 5 (impossible to lift). The scores on both sides
were added and the total score ranged from 0-10. In accordance with previous studies, we
considered an ASLR sum score of 4 and above as a positive test [30,31].
The Posterior Pelvic Pain Provocation (P4) test [17]: The P4 test was performed with
the women in a supine position. The hip and knee on the tested side were flexed to 90◦. The
examiner stabilized the contra lateral side of the pelvis while a graded force was applied on
the flexed knee into the pelvis along the longitudinal axis of femur. Adduction of the hip was
avoided. It was recorded whether a familiar pain was felt in the posterior part of the pelvis on
the provoked side (yes, no). Both left and right side were tested and scored separately.
Distraction test: The women were examined in supine position. The examiner applied
cross-armed pressure to the anterior superior iliac spines (ASIS) directed laterally. This
procedure was assumed to stretch the anterior sacroiliac joint ligaments and to give
compression in the dorsal part of the sacroiliac joints. The pain response was recorded (yes,
no).
Compression test: The woman were examined in side lying position, knees and hips
slightly flexed. Pressure was applied vertically into the pelvis when the examiner leaned her

11
chest against the uppermost iliac crest. The test was assumed to stretch the posterior sacroiliac
joint ligaments and compress the anterior part of the sacroiliac joints. The pain response was
recorded (yes, no). Both sides were tested and scored separately.
Patrick-Faber test: The women were examined in supine position. The examiner led
the ipsilateral leg into flexion, abduction and external rotation so that the heel rested on the
opposite kneecap. The examiner stabilized the contralateral side of the pelvis to ensure that
the lower back stayed in a neutral position. The ipsilateral knee was lowered against the table
and the examiner applied a light overpressure to the subject’s knee. It was assumed that both
the anterior sacroiliac ligament and the hip joint were stressed [32,33]. The pain response was
recorded (yes, no). Both sides were tested and scored separately.
Palpation of the pubic symphysis: The women were examined in supine position. The
examiner applied gentle pressure to the pubic symphysis with her hand (flat fingers). If the
pressure caused pain that persisted more than 5 seconds after removal of the hand, it was
recorded as pain (yes, no).
Palpation of the long dorsal sacroiliac ligament test: The women were examined in
side lying position and the examiner palpated the long dorsal sacroiliac ligament at her
uppermost side, caudal of the posterior-superior iliac spine. The test was positive if the
palpation provoked pain and recorded (yes, no). Both sides were examined and scored
separately.
Apart from the P4 test, a sum score was calculated from numbers of positive responses
to pain of all the above described pain provocation tests, ranging from 0 (all negative) to 8 (all
positive). We decided to use the responses on the P4 test as a single response and not as part
of a sum; based on the tests relevance for PGP reported in previous studies [17,34].
12
Statistics
Descriptive data are given as frequencies, percentages, means and standard deviations (SDs)
or medians and ranges. Multiple linear regression analysis was used to study the associations
between potential risk factors measured in early pregnancy and DRI or pain intensity in
gestation week 30. Associations between the explanatory variables as well as between the
explanatory variables and each of the response variables were studied by Pearson correlation
coefficients. The explanatory variables showing significant relationship with the response
variable were entered into a multiple regression model. The best subsets of explanatory
variables were selected through exclusion of the variables with the smallest contribution to the
model (the largest p-values). Two adjusted models are presented for each of the response
variables, without (model 1) and with (model 2) adjustment for DRI or pain intensity at
inclusion in early pregnancy. The residuals were examined to check model assumptions. The
statistical analyses were conducted in SPSS version 16.0 and a 5% level of significance was
used.
A continuous variable was the main outcome in the power calculations. The level of
significance was set to 5% (two-sided) and the power 80%. Assuming a correlation of
medium size, 0.3, in the population, a sample size of 85 is required for assessing significance
of a correlation coefficient in the sample [35]. In a multiple regression analysis with five
independent variables, the required sample size is 91 to detect a medium effect size of 0.15
(R2/(1-R
2)) [35].
Results
Mean gestation week at inclusion in early pregnancy was 14 weeks (SD 3 weeks) for the 268
women participating in this study. They were 18 to 45 years old and 59% were pregnant with
their first child. Characteristics of the participants are presented in table 1. A total of 59

13
women declined participation in the cohort study. There were no difference between
participants and non participants with regard to age (mean 31 years and SD 4 years in both
groups) and marital status. The non-participants (n=59) were asked about participation in
mean gestational week 15 (SD 6 weeks), and 44% were nulliparous. The women excluded
from analyses (n=46) due to inclusion later than gestation week 20 were a little older (mean
age 32 years, SD 4) and 77% were nulliparous.
Fifty percent of the participants reported pain in the pelvic area in early pregnancy and
most of them reported posterior pain only (39%) (table 2). Pain in the symphysis only and
combined symphysis and posterior pain were reported by 4% and 7% of the women,
respectively. The frequencies of negative responses were high on all the clinical tests (54 –
94%). The sum of pain provocation tests had a median value of 1 (range 0, 6) (table 2). Both
DRI and pain intensity increased from early pregnancy to gestation week 30, and showed
large variation among the women (table 2).
The correlation coefficients between the potential risk factors and DRI ranged from
-0.07 to 0.54 and between potential risk factors and pain intensity ranged from -0.10 to 0.46
(table 3). The correlation coefficients between the potential risk factors ranged from -0.25 to
0.56 and did not suggest collinearity (data not shown). Pain intensity and DRI in gestation
week 30 were significantly correlated (r= 0.63, p<0.001) (table 3).
Pre-pregnancy BMI, smoking, physical activity before pregnancy, full time work and
Beighton score for hypermobility were not significantly associated with DRI in gestation
week 30 in the bivariate analysis (0.16≤p≤0.64). Physical activity before pregnancy, full time
work and Beighton score for hypermobility were not significantly associated with pain
intensity in gestation week 30 in the bivariate analysis (0.38≤p≤0.98). These variables were
not entered in to the respective multivariable models. Age, gestation week, pre-pregnancy
LBP, and work condition were not significantly associated with the response variables
14
(0.11≤p≤0.65), but were entered into the multivariate models based on associations reported
in previous studies [4-9].
In the multivariable model, pain locations, P4 test, sum of pain provocation tests, and
HSCL-25 in early pregnancy were significantly associated with DRI in gestation week 30
(Table 4). Age, parity, marital status, education, use of contraceptive pills, the ASLR test, pre-
pregnancy history of LBP, work condition, number of pain sites and mFABQ in early
pregnancy were not significantly associated with DRI in gestation week 30 in the
multivariable analyses (0.08≤p≤0.98). No significant interactions between the explanatory
variables were found (0.21≤pinteraction≤0.97). When we adjusted for DRI in early pregnancy, R2
increased from 0.26 (model 1) to 0.37 (model 2) and the sum of pain provocation tests and
HSCL-25 were no longer significant (p=0.26 and p=0.49, respectively) (Table 4). Additional
adjustment for gestation week at inclusion did not change the results.
In the multivariable model for pain intensity in gestation week 30 similar results were
found (table 5). The same variables were significant except for HSCL-25. Age, parity, marital
status, education, use of contraceptive pills, pre-pregnancy BMI, smoking, the ASLR test,
pre-pregnancy history of LBP, work condition, number of pain sites, and mFABQ in early
pregnancy were not associated with pain intensity in gestation week 30 in the multivariable
analysis (0.07≤p≤0.80). No significant interactions between the explanatory variables were
found (0.25≤pinteraction≤0.77). Adjustment for pain intensity in early pregnancy increased the
R2 from 0.29 (model 1) to 0.33 (model 2) and the sum of pain provocation tests in early
pregnancy was no longer significant (p=0.23) (table 5). Additional adjustment for gestation
week in early pregnancy did not change the results.
The effect estimates of each response variable were relatively large in both models,
although the 95% confidence intervals were wide. Yet the effect estimates seemed to be
higher for pain intensity compared with DRI. For instance our data shows that pain intensity

15
in late pregnancy is 40.4 (95% CI: 24.4, 56.6) higher when pain was present in the symphysis
only, compared with having no pain in early pregnancy and adjusted for P4 test and sum of
pain provocation tests (table 5, model 1).
Discussion
The main results from this study were that pain locations in the pelvis, positive P4 test and
sum of pain provocation tests in early pregnancy were significantly associated with disability
and pain intensity in late pregnancy. In addition, distress was significantly associated with
disability. The functional test ASLR, fear avoidance beliefs and the number of pain sites were
not significantly associated with neither disability nor pain intensity.
The risk factors identified in this study differ from those that have been reported
before. Strenuous work, pre-pregnancy history of LBP and parity have previously been
identified as risk factors for PGP in studies applying bivariate statistics [4-6] and
multivariable models [9]. In our bivariate correlation analyses, the first two variables were
not significantly associated to neither disability nor pain intensity in gestation week 30, while
parity was. None of the variables were significant in the multivariable analyses. This could be
due to difference in design or to the use of different levels of statistical methods. One possible
explanation for the difference could be that previous studies have often recorded the risk
factors retrospectively, late in pregnancy and after the onset of symptoms. Hence, the
women’s reporting of these factors might be biased by pain [7,8]. The prospective design of
the present study ensured that this possible bias was avoided. At the time of inclusion and
measurement of the risk factors, none of the women had defined their symptoms as a problem
and they were not seeking treatment.
It is also noteworthy that the results of the functional ASLR test measured in early
pregnancy, used with a distinction between those with strong affliction and those with none
16
or lesser affliction, was not significantly associated with disability. This might indicate that
severe impairment of motor control and movement of the legs relative to the pelvis was not
important for the development of PGP. On the other hand, the response to the P4 test was
identified as a risk factor for both pain intensity and disability. Since this test is supposed to
elicit a distinct located pain deep in the gluteal area [17], it seems that affliction in the
posterior pelvis has an impact on the course. This is, however, partly contradicted by the data
from pain locations. Self-reported pain only in the symphysis in early pregnancy had about
the same impact on disability and pain intensity in gestation week 30 as did combined
symphysis pain and posterior pain. Moreover posterior pain (without symphysis pain) in early
pregnancy was not significantly associated with disability and pain intensity in gestation week
30. Since this group was the largest, the lack of effect can hardly be explained by lower test
power than the other pain locations. Although the confidence intervals were wide, our data
indicate that subclinical afflictions in both anterior and posterior part of the pelvis are of
importance for development of pain and disability. Hence, our data suggest that symphysis
pain can be an early indicator or precursor for pain development in other areas of the pelvis.
Interestingly, the association seems to disappear when pain location and disability are
measured simultaneously in late pregnancy [3].
When we included disability or pain intensity assessed in early pregnancy in the
multivariable models, some explanatory variables were no longer significant. This means that
these variables were not risk factors for the change in disability or pain intensity. However,
from a clinical point of view it is more important to identify risk factors for disability and pain
intensity late in pregnancy than the change from early pregnancy. This is supported by the
data showing an increased DRI already in early pregnancy compared with healthy non-
pregnant women [20].

17
Several of the previously identified risk factors for PGP in pregnancy are similar to
those reported for LBP and for other musculoskeletal disorders and are not specific for PGP
[36,37]. These comprise socio-demographical factors, previous history of LBP, strenuous
work and high level of distress. In contrast, positive response to the P4 test has been shown to
be sensitive and specific for PGP [17]. Also the pattern of pain locations within the pelvis is
probably specific for PGP, and one might therefore hypothesize that both the P4 test and pain
locations are “condition specific” risk factors for PGP.
The response variables used in this study were measured as scale values whereas
previous studies have used dichotomous responses for example reporting PGP or not. From
the large variation in responses shown when using scales in the present study, one might
question to what extent the dichotomous response variables actually reflects important
affliction. The dichotomous response variables have resulted in very high prevalence rates for
PGP in pregnancy [1,2,10,25]. We have recently found that the variability in DRI was large
both for women reporting and not reporting PGP [3]. In order to capture associations to this
large range of affliction, the used scales seem to provide additional information than the
dichotomous responses.
Previous studies have shown associations between distress, fear avoidance beliefs and
activity limitations in patients with LBP [38-42], and also that distress contributed to physical
activity and work loss in an acute sample of LBP patients [36]. Our results showed that
distress contributed into the model for disability but not for pain intensity. Interestingly the
effect of HSCL-25 on disability in gestation week 30 disappeared when we controlled for
disability at inclusion. As in the study from Grotle and co-workers of acute LBP [43], fear
avoidance beliefs was not identified as a risk factor for either disability or pain intensity.
Over the years, there has been a growing evidence for predictive effect of widespread
pain on long term changes in work disability [44]. Furthermore, it has also been reported that
18
the risk of long-term work disability was lower for persons with localized LBP compared with
persons with LBP combined with pain in other bodily areas. The risk for long-term work
disability increased with the latter [45,46]. We included number of pain sites (excluding low
back and pelvic area) in the multivariable analyses, and found that it did not contribute in any
of the models. The lack of effects may be due to the small number of possible pain sites.
However, it is also possible that PGP in pregnancy is a specific condition characterized by a
rather short course compared with other musculoskeletal pain conditions. Most of the women
recover shortly after delivery. One might thus speculate that multiple pain sites are not of
importance for development of PGP in pregnancy, but could still be of importance for non-
recovery from PGP postpartum.
The present study has several strengths, including the use of a prospective design,
continuous response variables and multivariable statistics. Furthermore the implementation of
clinical risk factors, use of blinded examiners and the follow-up of all pregnant women in the
cohort independent of having PGP or not also strengthen the study.
A limitation that should be considered when interpreting the results is the limited
numbers of women in some of the groups. However, even though the confidence intervals are
wide, the findings indicate that the risk factors are of importance. On the other hand, lack of
significant results should be interpreted with caution.
Another possible weakness could be the representativeness. The women participating
in the cohort were about the same age and in the same gestation week as women declining
participation. Women who were excluded from analyses due to late inclusion were also about
the same age. The average age of women giving birth in Norway have been 30.3 years (2006
– 2007) [47] i.e., almost similar as in our cohort. There were some differences in the
percentage of nulliparous women in the non-participant group, the excluded group and the
participants (44%, 77% and 59% respectively). The number of nulliparous women in the

19
cohort was also slightly higher than among Norwegian women (59% vs 42%). We cannot
exclude the possibility that another cohort of pregnant women in Norway, would result in
somewhat different results with regard to prevalence of pain locations and positive clinical
tests. However, the associations between them are expected to be similar.
Implications
Even though most women recover from PGP shortly after delivery, it has been shown that a
number of women report pain for longer time periods and that some of them have serious
problems [48-50]. Hence it seems important to identify risk factors for development of PGP in
pregnancy that could contribute to better management and thereby prevent persistent
disability after delivery. Risk factors identified in previous studies, such as parity and
strenuous work can hardly be treated or managed for prevention purposes. The identification
of the clinical risk factors in the present study therefore opens up new possibilities for
management. Prevention and treatment of PGP in pregnancy would have considerable
implications for the women, but also for the society in terms of productivity and health costs.
However, it remains to be seen whether the risk factors identified in the present study are of
clinical value in treatment and prevention of PGP.
Conclusions
In conclusion, we have found that pain locations in the pelvis, bilateral positive P4 test, and
sum of pain provocation tests in early pregnancy were significantly associated with disability
and pain intensity in gestation week 30. The effect estimates were relatively large.
Furthermore distress was significantly associated with disability, but not with pain intensity.
Fear avoidance beliefs were not significantly associated with any of the responses. These
results thus suggest that a clinical examination including a few tests performed in early

20
pregnancy may identify women at risk of a more severe PGP late in pregnancy. The
identification of clinical risk factors may provide a foundation for development of targeted
prevention strategies.
Competing interests
The authors declare that they have no competing interests.

21
Authors’ contributions
All authors contributed to the conception and design of the study. HSR, NKV and AMM
obtained funding. HSR, NKV and MBV did the data analyses. All authors contributed to the
interpretation of the results and critical revision of the manuscript for important intellectual
content and approved the final version of the manuscript.
Authors’ information
HSR (RPT and MSC) is doctoral student and manual therapist, MBV (PhD) is associated
professor in biostatistics, AMM (RPT and PhD) is professor, NKV (PhD) is professor and
Head of institute
Acknowledgements
This project has been financed with the aid of EXTRA funds from the Norwegian Foundation
for Health and Rehabilitation, The Norwegian Fund for Post-Graduate Training in
Physiotherapy and the University of Oslo
The authors would like to thank Hans and Olaf Physiotherapy clinic and the MCUs for kindly
making it possible to collect the data in this study. In particular we want to thank Elisabeth K
Bjelland, MSc, RPT and manual therapist, for valuable help with the clinical examinations of
the pregnant women. Furthermore we want to thank Anne Karine Bergva, Sigrunn
Anmarkrud, Grete Kristiansen, Hege Kaspersen, Astrid Stormoen, Eva Marie Flaathen, Heidi
Arnesen, Tove Mols and Wenche Sjøberg at the MCUs for help with recruiting the pregnant
women, and Eileen Strand RPT for valuable advice on the English language. We also would
like to thank all the women who volunteered to participate in this study.
22
Reference List
1. Gutke A, Ostgaard HC, Oberg B: Pelvic girdle pain and lumbar pain in pregnancy:
a cohort study of the consequences in terms of health and functioning. Spine 2006,
31: E149-E155.
2. Olsson C, Nilsson-Wikmar L: Health-related quality of life and physical ability
among pregnant women with and without back pain in late pregnancy. Acta
Obstetricia et Gynecologica Scandinavica 2004, 83: 351-357.
3. Robinson HS, Mengshoel AM, Bjelland EK, Vollestad NK: Pelvic girdle pain,
clinical tests and disability in late pregnancy. Man Ther 2010, 15: 280-285.
4. Berg G, Hammar M, Moller-Nielsen J, Linden U, Thorblad J: Low back pain during
pregnancy. Obstet Gynecol 1988, 71: 71-75.
5. Ostgaard HC, Andersson GB, Karlsson K: Prevalence of back pain in pregnancy.
Spine 1991, 16: 549-552.
6. Kristiansson P, Svardsudd K, von Schoultz B: Back pain during pregnancy: a
prospective study. Spine 1996, 21: 702-709.
7. Mogren IM, Pohjanen AI: Low back pain and pelvic pain during pregnancy:
prevalence and risk factors. Spine 2005, 30: 983-991.
8. Albert HB, Godskesen M, Korsholm L, Westergaard JG: Risk factors in developing
pregnancy-related pelvic girdle pain. Acta Obstet Gynecol Scand 2006, 85: 539-
544.
9. Larsen EC, Wilken-Jensen C, Hansen A, Jensen DV, Johansen S, Minck H, Wormslev
M, Davidsen M, Hansen TM: Symptom-giving pelvic girdle relaxation in
pregnancy. I: Prevalence and risk factors. Acta Obstet Gynecol Scand 1999, 78:
105-110.
10. Olsson C, Buer N, Holm K, Nilsson-Wikmar L: Lumbopelvic pain associated with
catastrophizing and fear-avoidance beliefs in early pregnancy. Acta Obstet
Gynecol Scand 2009, 88: 378-385.
11. Croft P: The question is not "have you got it"? But "how much of it have you
got"? Pain 2009, 141: 6-7.
12. Vollestad NK, Stuge B: Prognostic factors for recovery from postpartum pelvic
girdle pain. Eur Spine J 2009.
13. Albert H, Godskesen M, Westergaard J: Prognosis in four syndromes of pregnancy-
related pelvic pain. Acta Obstet Gynecol Scand 2001, 80: 505-510.
14. Vleeming A, Albert HB, Ostgaard HC, Sturesson B, Stuge B: European guidelines
for the diagnosis and treatment of pelvic girdle pain. Eur Spine J 2008, 17: 794-
819.
23
15. Gutke A, Ostgaard HC, Oberg B: Predicting persistent pregnancy-related low back
pain. Spine 2008, 33: E386-E393.
16. Albert HB, Godskesen M, Westergaard JG: Incidence of four syndromes of
pregnancy-related pelvic joint pain. Spine 2002, 27: 2831-2834.
17. Ostgaard HC, Zetherstrom G, Roos-Hansson E: The posterior pelvic pain
provocation test in pregnant women. Eur Spine J 1994, 3: 258-260.
18. Mens JM, Vleeming A, Snijders CJ, Koes BW, Stam HJ: Reliability and validity of
the active straight leg raise test in posterior pelvic pain since pregnancy. Spine
2001, 26: 1167-1171.
19. Mens JM, Vleeming A, Snijders CJ, Koes BW, Stam HJ: Validity of the active
straight leg raise test for measuring disease severity in patients with posterior
pelvic pain after pregnancy. Spine 2002, 27: 196-200.
20. Salen BA, Spangfortke L, Nordemar R: The disability rating index: An instrument
for the assessment of disability in clinical settings. Journal of Clinical
Epidemiology 1994, 47: 1423-1435.
21. Rickels K, Garcia CR, Lipman RS, Derogatis LR, Fisher EL: The Hopkins Symptom
Checklist. Assessing emotional distress in obstetric-gynecologic practice. Prim
Care 1976, 3: 751-764.
22. Sandanger I, Moum T, Ingebrigtsen G, Dalgard OS, Sorensen T, Bruusgaard D:
Concordance between symptom screening and diagnostic procedure: the Hopkins
Symptom Checklist-25 and the Composite International Diagnostic Interview I. Soc Psychiatry Psychiatr Epidemiol 1998, 33: 345-354.
23. Linton SJ, Buer N, Vlaeyen JW, Hellsing AL: Are Fear -Avoidance Beliefs Related
to the Inception of an Apisode of Back Pain? A Prospective Study. Psychology and
Health 2000, 14: 1051-1059.
24. Waddell G, Newton M, Henderson I, Somerville D, Main CJ: A Fear-Avoidance
Beliefs Questionnaire (FABQ) and the role of fear-avoidance beliefs in chronic
low back pain and disability. Pain 1993, 52: 157-168.
25. Robinson HS, Eskild A, Heiberg E, Eberhard-Gran M: Pelvic girdle pain in
pregnancy: the impact on function. Acta Obstet Gynecol Scand 2006, 85: 160-164.
26. van Dongen PW, de Boer M, Lemmens WA, Theron GB: Hypermobility and
peripartum pelvic pain syndrome in pregnant South African women. Eur J Obstet
Gynecol Reprod Biol 1999, 84: 77-82.
27. Verhoeven JJ, Tuinman M, Van Dongen PWJ: Joint hypermobility in African non-
pregnant nulliparous women. European Journal of Obstetrics & Gynecology and
Reproductive Biology 1999, 82: 69-72.
28. Laslett M, Williams M: The reliability of selected pain provocation tests for
sacroiliac joint pathology. Spine 1994, 19: 1243-1249.

24
29. Robinson HS, Brox JI, Robinson R, Bjelland E, Solem S, Telje T: The reliability of
selected motion- and pain provocation tests for the sacroiliac joint. Man Ther
2007, 12: 72-79.
30. Stuge B, Laerum E, Kirkesola G, Vollestad N: The efficacy of a treatment program
focusing on specific stabilizing exercises for pelvic girdle pain after pregnancy: a
randomized controlled trial. Spine 2004, 29: 351-359.
31. Stuge B, Morkved S, Dahl HH, Vollestad N: Abdominal and pelvic floor muscle
function in women with and without long lasting pelvic girdle pain. Man Ther
2006, 11: 287-296.
32. Dreyfuss P, Michaelsen M, Pauza K, McLarty J, Bogduk N: The value of medical
history and physical examination in diagnosing sacroiliac joint pain [see
comments]. Spine 1996, 21: 2594-2602.
33. Slipman CW, Sterenfeld EB, Chou LH, Herzog R, Vresilovic E: The predictive value
of provocative sacroiliac joint stress maneuvers in the diagnosis of sacroiliac joint
syndrome. Arch Phys Med Rehabil 1998, 79: 288-292.
34. Gutke A, Hansson ER, Zetherstrom G, Ostgaard HC: Posterior pelvic pain
provocation test is negative in patients with lumbar herniated discs. Eur Spine J
2009, 18: 1008-1012.
35. Cohen J: A power primer. Psychol Bull 1992, 112: 155-159.
36. Grotle M, Brox JI, Veierod MB, Glomsrod B, Lonn JH, Vollestad NK: Clinical
course and prognostic factors in acute low back pain: patients consulting
primary care for the first time. Spine 2005, 30: 976-982.
37. Kamaleri Y, Natvig B, Ihlebaek CM, Benth JS, Bruusgaard D: Change in the
number of musculoskeletal pain sites: A 14-year prospective study. Pain 2009,
141: 25-30.
38. Buer N, Linton SJ: Fear-avoidance beliefs and catastrophizing: occurrence and
risk factor in back pain and ADL in the general population. Pain 2002, 99: 485-
491.
39. Vlaeyen JWS, Crombez G: Fear of movement/(re)injury, avoidance and pain
disability in chronic low back pain patients. Manual Therapy 1999, 4: 187-195.
40. Swinkels-Meewisse IEJ, Roelofs J, Verbeek ALM, Oostendorp RAB, Vlaeyen JWS:
Fear of movement/(re)injury, disability and participation in acute low back pain. Pain 2003, 105: 371-379.
41. Leeuw M, Houben RMA, Severeijns R, Picavet HS, Schouten EGW, Vlaeyen JWS:
Pain-related fear in low back pain: A prospective study in the general population. European Journal of Pain 2007, 11: 256-266.
42. Thomas E, Silman AJ, Croft PR, Papageorgiou AC, Jayson MI, Macfarlane GJ:
Predicting who develops chronic low back pain in primary care: a prospective
study. BMJ 1999, 318: 1662-1667.
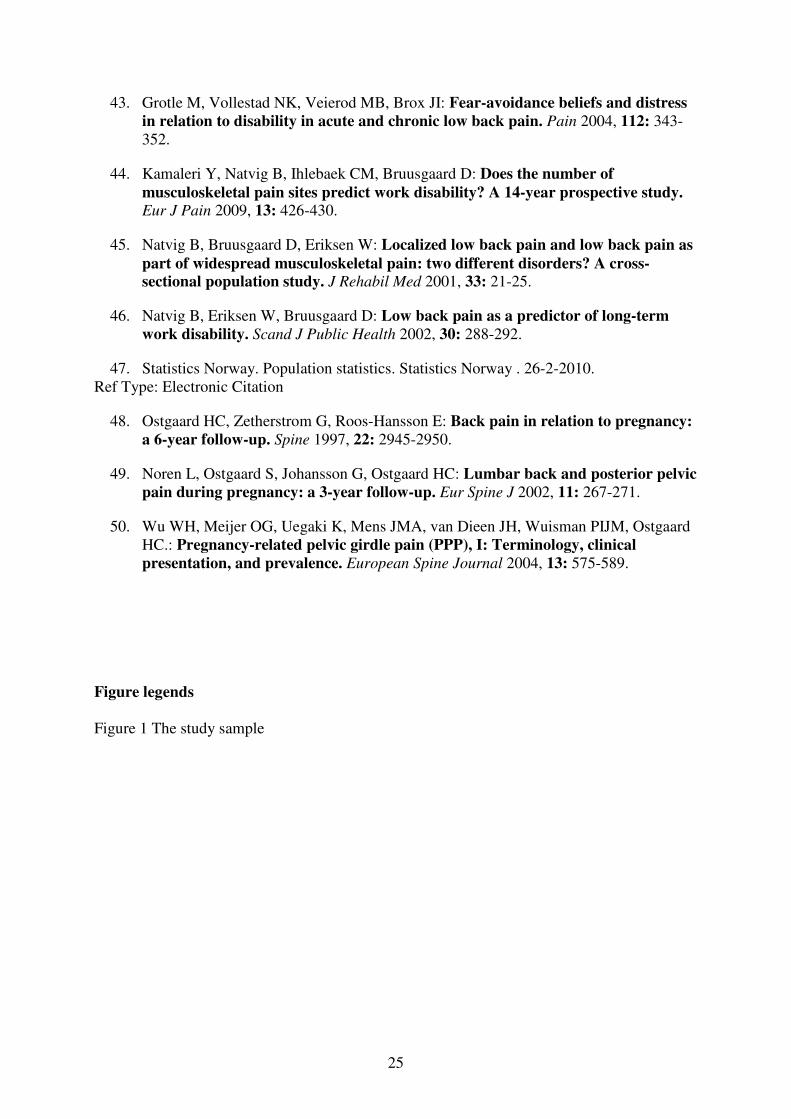
25
43. Grotle M, Vollestad NK, Veierod MB, Brox JI: Fear-avoidance beliefs and distress
in relation to disability in acute and chronic low back pain. Pain 2004, 112: 343-
352.
44. Kamaleri Y, Natvig B, Ihlebaek CM, Bruusgaard D: Does the number of
musculoskeletal pain sites predict work disability? A 14-year prospective study. Eur J Pain 2009, 13: 426-430.
45. Natvig B, Bruusgaard D, Eriksen W: Localized low back pain and low back pain as
part of widespread musculoskeletal pain: two different disorders? A cross-
sectional population study. J Rehabil Med 2001, 33: 21-25.
46. Natvig B, Eriksen W, Bruusgaard D: Low back pain as a predictor of long-term
work disability. Scand J Public Health 2002, 30: 288-292.
47. Statistics Norway. Population statistics. Statistics Norway . 26-2-2010.
Ref Type: Electronic Citation
48. Ostgaard HC, Zetherstrom G, Roos-Hansson E: Back pain in relation to pregnancy:
a 6-year follow-up. Spine 1997, 22: 2945-2950.
49. Noren L, Ostgaard S, Johansson G, Ostgaard HC: Lumbar back and posterior pelvic
pain during pregnancy: a 3-year follow-up. Eur Spine J 2002, 11: 267-271.
50. Wu WH, Meijer OG, Uegaki K, Mens JMA, van Dieen JH, Wuisman PIJM, Ostgaard
HC.: Pregnancy-related pelvic girdle pain (PPP), I: Terminology, clinical
presentation, and prevalence. European Spine Journal 2004, 13: 575-589.
Figure legends
Figure 1 The study sample

26
Table 1 Characteristics of the women at inclusion in early pregnancy (n=268)
Frequency (%) Mean (SD)
Age (years) 31 (4)
Parity 0 157 (59)
1 86 (32)
≥2 25 (9)
Gestation week 14 (3)
Marital status (single) 7 (3)
Education ≤ 12 years school attendance 46 (17)
≤4 years university 113 (42)
>4 years university 109 (41)
Contraceptive pills, year before
pregnancy (yes)
103 (38)
Pre-pregnancy BMI (kg/m2) 23.3 (3.5)
Smoking (yes) 11 (4)
Physical activity before pregnancy None 11 (4)
< 2 hours per week 84 (31)
2 - 4 hours per week 138 (52)
> 4 hours per week 34 (13)
Full time worker (yes) 228 (85)
Heavy work (yes) 96 (36)
mFABQ (0-24) 9.3 (3.8)
HSCL-25 (score ≥1.75) 38 (14)
Pre-pregnancy history of LBP (yes) 131 (49)
BMI, Body Mass Index; mFABQ, modified Fear Avoidance Beliefs questionnaire; HSCL-25, Hopkins Symptom
Check List; LBP, Low Back Pain

27
Table 2 Distribution of possible risk factors and outcome variables. (n=268)
Frequency (%) Median (range)
Beighton score Normal (sum<4) 46 (17)
Hypermobile (sum≥4) 222 (83)
Pain locations No pain 135 (50)
Pain in symphysis only 11 (4)
Posterior pain only 105 (39)
Combined symphysis and posterior pain 17 (7)
P4 test Negative 161 (60)
Unilateral positive 53 (20)
Bilateral positive 54 (20)
ASLR test sum<4 240 (90)
sum ≥4 28 (10)
Distraction test Negative 207 (77)
Positive 61 (23)
Compression test Negative 251 (94)
Unilateral positive 15 (5)
Bilateral positive 2 (1)
Patrick-Faber test Negative 191 (72)
Unilateral positive 39 (14)
Bilateral positive 39 (14)
Palpation of pubic
symphysis
Negative 241 (90)
Positive 27 (10)
Palpation of LDL Negative 145 (54)
Unilateral positive 41 (15)
Bilateral positive 79 (30)
Sum of pain provocation
tests
1.0 (0,6)
DRI in early pregnancy 13 (0,93)
DRI in gestation week 30 36 (0,81)
Pain intensity in early
pregnancy (worst evening
pain)
0 (0,82)
Pain intensity in gestation
week 30 (worst evening
pain)
14 (0,99)
P4 test, Posterior Pelvic Pain Provocation test; ASLR test, Active Straight Leg Raise test; LDL, Long Dorsal
Sacroiliac Ligament

28
Table 3. Correlation between outcome variables and possible predictors measured at inclusion
in early pregnancy (n=268)
DRI gestation week 30
Pain intensity gestation week 30
Pain intensity gestation week 30 (worst evening
pain,VAS)
0.63***
Age (years) -0.07 -0.10
Parity (0, 1, 2 or more) 0.15* 0.18**
Gestation week in early pregnancy 0.03 -0.04
Civil status (married, cohabitant; yes, no) 0.14* 0.22***
Education (≤12 years of school attendance , ≤4
years university, >4 years university)
0.19** 0.17**
Contraceptive pills, year before pregnancy (yes, no) -0.13* -0.04
Pre-pregnancy BMI (kg/m2) 0.09 0.12*
Smoking (yes, no) 0.06 0.12
Physical activity before pregnancy (none, <2, 2-4,
≥4 hours per week)
-0.05 -0.001
Full time worker (yes, no) 0.05 0.09
Work condition (mostly seated/heavy work) 0.03 0.06
Beighton score for hypermobility 0.01 -0.06
Pain locations (no pain, symphysis pain, posterior
pain, combined symphysis and posterior pain)
0.36*** 0.44***
P4 test (bilateral negative, uni-/bilateral positive) 0.41*** 0.39***
Sum of pain provocation tests (0-8) 0.40*** 0.40***
ASLR test (<4, ≥4) 0.18** 0.11
HSCL-25 (<1.75, ≥1.75) 0.26*** 0.15*
DRI in early pregnancy (0-100) 0.54*** 0.34***
Pain intensity in early pregnancy (worst evening
pain, VAS)
0.44*** 0.46***
Pre-pregnancy LBP (yes/no) 0.09 0.10
Number of pain sites (0-4) 0.19** 0.14*
mFABQ (0-24) 0.18** 0.10
Pearson’s correlation coefficient; ***p≤0.001, **0.001<p≤0.01 *0.01<p≤0.05
VAS, Visual Analogue Scale; BMI, Body Mass Index; P4 test, Posterior Pelvic Pain Provocation test; ASLR
test, Active Straight Leg Raise test; HSCL-25, Hopkins Symptom Check List; DRI, Disability Rating Index;
LBP, Low Back Pain; mFABQ, modified Fear Avoidance Beliefs Questionnaire
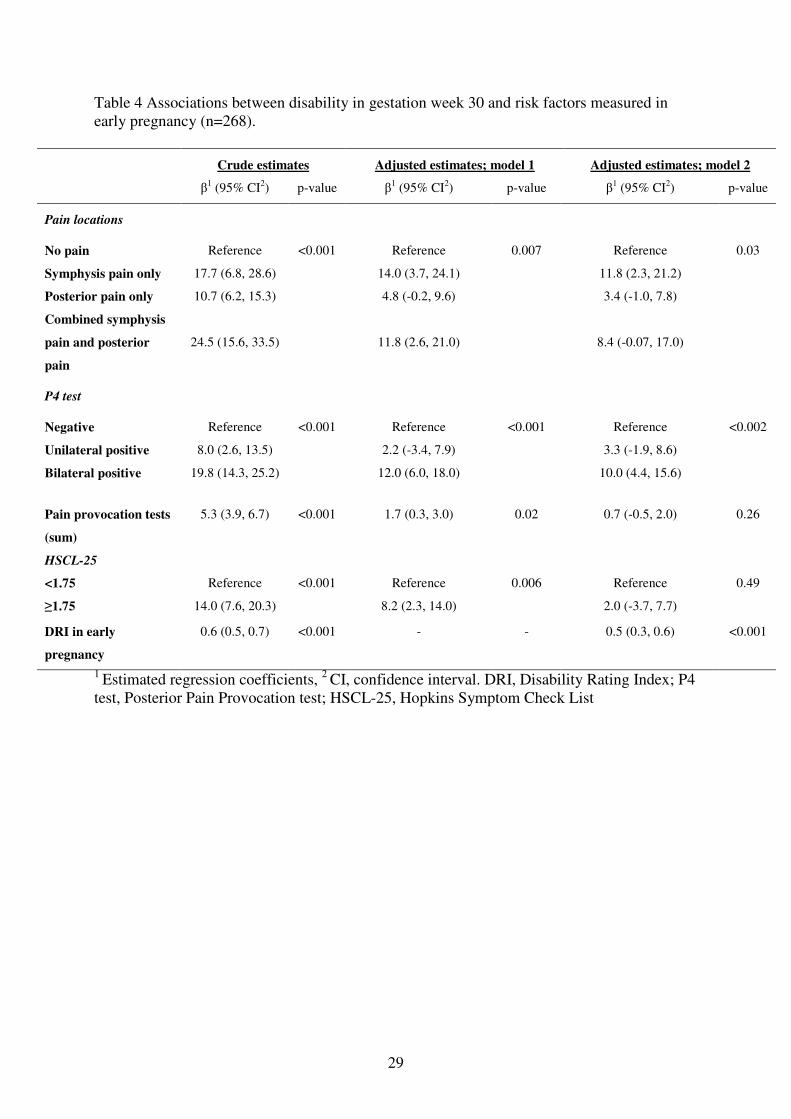
29
Table 4 Associations between disability in gestation week 30 and risk factors measured in
early pregnancy (n=268).
Crude estimates Adjusted estimates; model 1 Adjusted estimates; model 2
β1 (95% CI
2) p-value β
1 (95% CI
2) p-value β
1 (95% CI
2) p-value
Pain locations
No pain
Reference
<0.001
Reference
0.007
Reference
0.03
Symphysis pain only 17.7 (6.8, 28.6) 14.0 (3.7, 24.1) 11.8 (2.3, 21.2)
Posterior pain only 10.7 (6.2, 15.3) 4.8 (-0.2, 9.6) 3.4 (-1.0, 7.8)
Combined symphysis
pain and posterior
pain
24.5 (15.6, 33.5)
11.8 (2.6, 21.0)
8.4 (-0.07, 17.0)
P4 test
Negative
Reference
<0.001
Reference
<0.001
Reference
<0.002
Unilateral positive 8.0 (2.6, 13.5) 2.2 (-3.4, 7.9) 3.3 (-1.9, 8.6)
Bilateral positive 19.8 (14.3, 25.2) 12.0 (6.0, 18.0) 10.0 (4.4, 15.6)
Pain provocation tests
(sum)
5.3 (3.9, 6.7) <0.001 1.7 (0.3, 3.0) 0.02 0.7 (-0.5, 2.0) 0.26
HSCL-25
<1.75
Reference
<0.001
Reference
0.006
Reference
0.49
≥1.75 14.0 (7.6, 20.3) 8.2 (2.3, 14.0) 2.0 (-3.7, 7.7)
DRI in early
pregnancy
0.6 (0.5, 0.7) <0.001 - - 0.5 (0.3, 0.6) <0.001
1 Estimated regression coefficients,
2 CI, confidence interval. DRI, Disability Rating Index; P4
test, Posterior Pain Provocation test; HSCL-25, Hopkins Symptom Check List
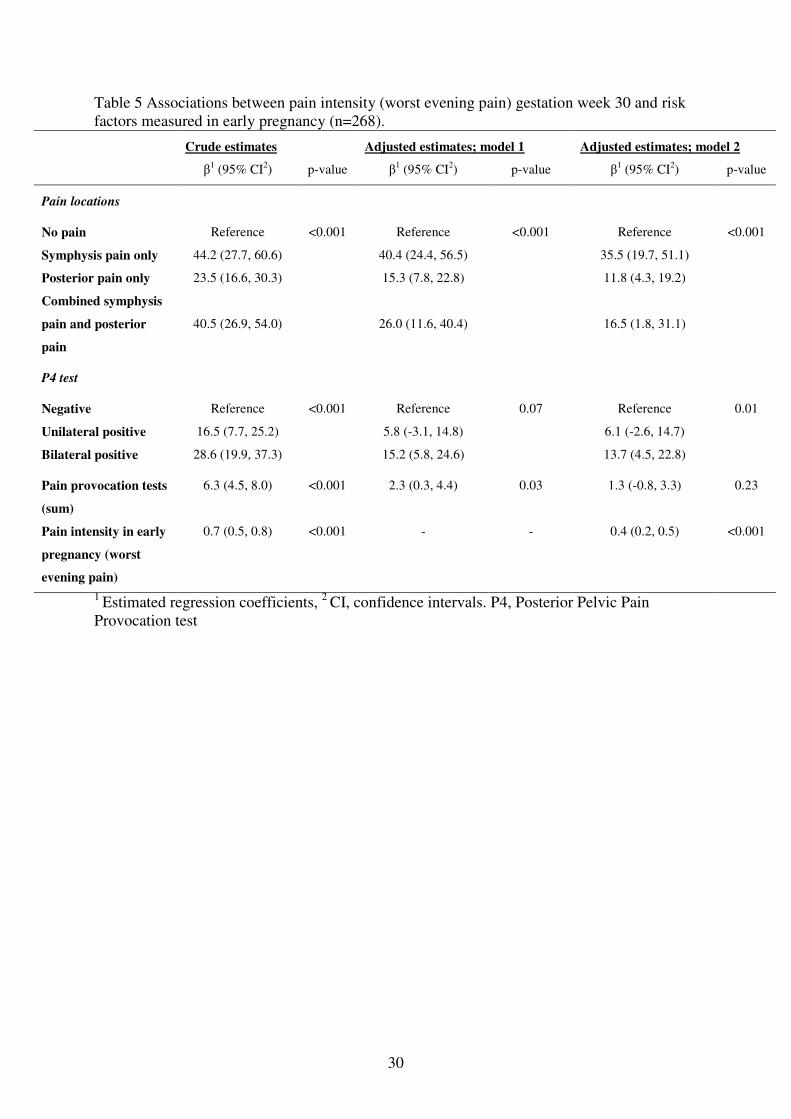
30
Table 5 Associations between pain intensity (worst evening pain) gestation week 30 and risk
factors measured in early pregnancy (n=268).
Crude estimates Adjusted estimates; model 1 Adjusted estimates; model 2
β1 (95% CI
2) p-value β
1 (95% CI
2) p-value β
1 (95% CI
2) p-value
Pain locations
No pain
Reference
<0.001
Reference
<0.001
Reference
<0.001
Symphysis pain only 44.2 (27.7, 60.6) 40.4 (24.4, 56.5) 35.5 (19.7, 51.1)
Posterior pain only 23.5 (16.6, 30.3) 15.3 (7.8, 22.8) 11.8 (4.3, 19.2)
Combined symphysis
pain and posterior
pain
40.5 (26.9, 54.0)
26.0 (11.6, 40.4)
16.5 (1.8, 31.1)
P4 test
Negative
Reference
<0.001
Reference
0.07
Reference
0.01
Unilateral positive 16.5 (7.7, 25.2) 5.8 (-3.1, 14.8) 6.1 (-2.6, 14.7)
Bilateral positive 28.6 (19.9, 37.3) 15.2 (5.8, 24.6) 13.7 (4.5, 22.8)
Pain provocation tests
(sum)
6.3 (4.5, 8.0) <0.001 2.3 (0.3, 4.4) 0.03 1.3 (-0.8, 3.3) 0.23
Pain intensity in early
pregnancy (worst
evening pain)
0.7 (0.5, 0.8) <0.001 - - 0.4 (0.2, 0.5) <0.001
1 Estimated regression coefficients,
2 CI, confidence intervals. P4, Posterior Pelvic Pain
Provocation test
9 miscarriages and 3
drop-out
385 eligible women from 4 Maternity Care Units
59 denied participation
326 women included
46 recruited after
gestation week 20
Early pregnancy: 280 women
Questionnaire and clinical examination
Gestation week 30: 268 women
Questionnaire (and clinical examination)
Figure 1


1
PAPER III Hilde Stendal Robinson, Anne Marit Mengshoel, Marit B Veierød, Nina K Vøllestad.
Pelvic girdle pain; potential risk factors in pregnancy in relation to disability and
pain intensity three months postpartum
Manual Therapy, 2010

1
TITLE
PELVIC GIRDLE PAIN; POTENTIAL RISK FACTORS IN PREGNANCY IN
RELATION TO DISABILITY AND PAIN INTENSITY THREE MONTHS
POSTPARTUM
AUTHORS:
Hilde Stendal Robinson1, MSc, RPT, Anne Marit Mengshoel1, PhD, RPT, Marit B Veierød2,
PhD, Nina Vøllestad1, PhD
1Institute of Health and Society, Department of Nursing and Health Sciences, University of
Oslo, N-0318 Oslo, Norway 2Department of Biostatistics, Institute of Basic Medical Sciences, University of Oslo, N-0317
Oslo, Norway
Corresponding author:
Hilde Stendal Robinson, IHS, P.O.Box 1153, Blindern, N-0318 Oslo, Norway.
Fax: +47 22858411 Tlf: +47 22858421, E-mail: [email protected]

2
Pelvic girdle pain; potential risk factors in pregnancy in relation to disability and pain
intensity three months postpartum
Abstract
The objective of this prospective cohort study was to examine how results of clinical
tests on women with PGP in late pregnancy were associated with disability and pain intensity
12 weeks postpartum controlling for socio-demographical and psychological factors.
Out of the 283 women clinically examined in gestation week 30, 179 were considered
afflicted from PGP and constituted the study sample.
Potential risk factors were assessed by questionnaires (at inclusion and in gestation
week 30) and clinical examination in gestation week 30. The clinical examination included
pain provocation tests for the pelvis as well as the active straight leg raise test. We used pain
intensity and disability (disability rating index, DRI) as response variables, derived from
questionnaires 12 weeks postpartum.
Using multivariable linear regression analyses, sum of pain provocation tests and pre-
pregnancy LBP were significantly associated with DRI 12 weeks postpartum. Furthermore,
sum of pain provocation tests and number of pain sites were significantly associated with pain
intensity.
In conclusion, we found that when including results of clinical tests as risk factors
together with socio-demographical and psychological factors in multivariable regression
models, the clinical risk factors are the ones that remain significant. These results are of
clinical importance because they seem to have the potential to identify women with a poor
prognosis.
3
Introduction
Pelvic girdle pain (PGP) is a common musculoskeletal disorder during pregnancy and
recent studies have reported that prevalence in late pregnancy may be above 50% (Gutke et
al., 2006; Mogren, 2006; Robinson et al., 2010a). The prevalence of women with PGP falls
substantially during the first 3 months postpartum, reaching about 25% (Ostgaard et al., 1996;
Albert et al., 2001; Wu et al., 2004). About ⅕ of those with PGP postpartum are assumed to
have serious problems and it would be clinically important to identify these women as early as
possible.
Recent studies suggest that pain location could be an important risk factor for
sustained PGP postpartum (Albert et al., 2006; Gutke et al., 2008; Vollestad and Stuge, 2009).
Gutke et al. reported that low back pain (LBP) in combination with PGP in early pregnancy
predicted persistent pain 3 months postpartum (Gutke et al., 2008). Albert et al. reported a
slower recovery postpartum among women with combined symphysis and bilateral posterior
pelvic pain in pregnancy than among women with fewer pain locations (Albert et al., 2001).
Clinical examinations, including functional tests and pain provocation tests for the
pelvic joints, are most often used for diagnostic purposes, and the results have seldom been
evaluated as risk factors for sustained PGP postpartum. However, one study reported that
women with high numbers of positive pain provocation tests in late pregnancy were more
likely to have PGP two years after delivery (Albert et al., 2001). Associations between the
bilateral posterior pelvic pain provocation (P4) test in early pregnancy and the development of
disability and pain intensity in late pregnancy have been reported (Robinson et al., 2010b). It
is of interest to examine whether results of clinical tests may give information about the risk
of sustained PGP postpartum.
Previous studies have reported associations between postpartum PGP and pre-
pregnancy history of LBP, trauma to the pelvis, multipara, and heavy work loads, but the

4
evidence is limited (Ostgaard and Andersson, 1992; Breen et al., 1994; Turgut et al., 1998;
Albert et al., 2001; To and Wong, 2003; Rost et al., 2006; Vleeming et al., 2008). Studies of
LBP have shown that psychosocial factors and emotional distress are important for non-
recovery (Cedraschi and Allaz, 2005; Grotle et al., 2005), but such associations have seldom
been studied for PGP (Vleeming et al., 2008). However, work dissatisfaction (Gutke et al.,
2008) and lack of belief in improvement (Vollestad and Stuge, 2009) have been reported as
risk factors for non-recovery from PGP postpartum.
Most previous studies have used women’s report of the presence or absence of PGP as
response variables, without assessment of the degree of affliction (Albert et al., 2001;
Mogren, 2006; Rost et al., 2006). We have previously reported large variations in disability,
pain intensity, and consequently the impact on daily life, among women with PGP postpartum
and in pregnancy (Stuge et al., 2004; Robinson et al., 2010a). It is therefore of interest to use
disability and pain intensity as response measures postpartum.
The main purpose of this study was to examine how clinical assessments in women
with PGP in late pregnancy were associated with disability and pain intensity 12 weeks
postpartum when we controlled for socio-demographical and psychological factors.
5
Materials and methods
The present study is a prospective cohort study following pregnant women in Norway
from their first contact with the health service (in pregnancy) till 12 weeks postpartum. The
potential risk factors were assessed by questionnaires (at inclusion and in gestation week 30)
and clinical examination in gestation week 30. The responses were derived from
questionnaires 12 weeks postpartum. The examiner was blinded for all questionnaire data.
The Regional Committee for Medical Research Ethics and the Norwegian Social Science
Data Services gave formal approval of the study.
The cohort
The Norwegian public health service offers all women free health service during
pregnancy and most women seek special maternity care units (MCUs) for this purpose. Our
cohort comprised 326 pregnant women, recruited consecutively at their first appointment at
four MCUs in the Oslo (capital city) area. They were 18 to 41 years old and 59% were
pregnant for the first time. During the first 30 weeks of pregnancy nine women reported a
miscarriage and three dropped out of the study (figure 1). The women were selected for a new
examination in gestation week 30, based on a short questionnaire, including three questions
about low back and pelvic pain, distributed by the midwives and answered by the women in
gestation week 28. The women had either to be without symptoms of PGP and LBP, or to
report pain located in the pelvic area or low back area once a week or more. Furthermore, the
pain had to be provoked by sitting, standing or walking. Hence, at gestation week 30, 283
women met and underwent a clinical examination. For the remaining 31 women (9 %) only
questionnaire data were collected.

6
Measurements of response variables, 12 weeks postpartum
Physical disability was assessed by the Disability Rating Index (DRI) (Salen et al.,
1994), scoring the ability to perform activities of daily living (dressing without help, outdoor
walking, climbing stairs, sitting for a longer period, standing leaning over a sink, carrying a
bag, making a bed, running, performing light work, performing heavy work, lifting heavy
objects, participating in exercise/sport). These items were scored by visual analogue scales
(VAS) ranging from 0 – 100 mm, with end points “ability to perform activity without
restriction” and “inability to perform the activity”. We calculated DRI as the mean of the
twelve scales. DRI has previously been applied in studies of pregnant women (Olsson and
Nilsson-Wikmar, 2004; Olsson et al., 2009; Robinson et al., 2010a).
We measured pain intensity by asking: “How intense is your worst PGP before going
to bed?” The response was measured by a 100 mm VAS, with end points: “no pain” and
“unbearable pain”. The intensity of worst evening pain was evaluated and used as the most
relevant measure for pain affliction since PGP is said to increase with activity (Ostgaard et al.,
1994; Larsen et al., 1999).
Measurements of potential risk factors
Questionnaire data at inclusion:
Socio-demographical data included age (years), parity (0, 1, >1 child), marital status
(single, married/cohabitant), education (≤12 years, ≤4 years at university, > 4 years at
university), smoking (yes, no), pre-pregnancy physical activity (none, < 2, 2 - 4, > 4 hours per
week). Pre-pregnancy body mass index (BMI) was calculated from self-reported height and
weight.

7
Questionnaire data at gestation week 30:
Distress was assessed by the Hopkins Symptom Check List (HSCL) (Rickels et al.,
1976). Twenty-five symptoms were ranged on a scale from 1 (not bothered) to 4 (extremely
bothered). The average value was calculated to obtain the HSCL-25 score.
Fear avoidance beliefs were measured by the modified Fear Avoidance Beliefs
Questionnaire (mFABQ) that can be answered also by individuals without pain (Linton et al.,
2000). The mFABQ includes four items from the section concerning physical activity in the
original FABQ (Waddell et al., 1993; Linton et al., 2000). In accordance with the work by
Linton et al. 2000, the introductory text was: “Some women are likely to be afflicted by pain
in the back and pelvis during pregnancy. For research purposes, we would like to know if you
believe that there is a relationship between such afflictions and activities.” For each item the
scale ranged from 0 (total disagreement), to 6 (total agreement), and the sum score from 0 to
24.
We determined pain locations within the pelvic area from pain drawings filled in by
the women previous to the clinical examination in gestation week 30. After the examination,
the women were asked to point out the pain sites on their body and, if necessary, the examiner
corrected the pain drawing to reflect the areas pointed out. The pain locations in the pelvic
area were subsequently coded: no PGP, pain in symphysis only, only posterior pain (uni- or
bilateral), combined symphysis pain and posterior pain.
We asked the women if they had pain in other bodily areas (yes, no). The areas were:
the neck, shoulder and arms, between the shoulder blades, and the knees. The number of pain
sites was added (sum score 0-4). Pain located in the area of the lower back and the pelvis was
used as separate variables.

8
Pre-pregnancy history of LBP was identified from the question: “Have you suffered
from LBP before pregnancy (yes, no)?”
Clinical examinations in gestation week 30
The active straight leg (ASLR) test (Mens et al., 2001): The ASLR was performed
with the women supine, straight legs and feet about 20 cm apart. The women lifted each leg
separately about 20 cm above the couch. They were asked to score the difficulty on a six-
point scale from 0 (not difficult to lift) to 5 (impossible to lift). The scores on both sides were
added and the sum ranged from 0-10.
The Posterior Pelvic Pain Provocation (P4) test (Ostgaard et al., 1994): The P4 test
was performed with the women supine. The hip and knee on the tested side were flexed to
90◦. The examiner stabilized the contra lateral side of the pelvis while a graded force was
applied on the flexed knee into the pelvis along the longitudinal axis of femur. Adduction of
the hip was avoided. We recorded whether a familiar pain was felt in the posterior part of the
pelvis on the provoked side (yes, no) (Ostgaard et al., 1994). Left and right side were tested
and scored separately.
Distraction test (Laslett and Williams, 1994): The women were examined in supine
position. The examiner applied cross-armed pressure directed laterally to the anterior superior
iliac spines. The pain response was recorded (yes, no).
Compression test (Robinson et al., 2007): The women were examined in side lying
position, knees and hips slightly flexed. Pressure was applied vertically into the pelvis when
the examiner leaned her chest against the uppermost iliac crest. The pain response was
recorded (yes, no). Both sides were tested and scored separately.
Patrick-Faber test (Dreyfuss et al., 1996; Slipman et al., 1998): The women were
examined in supine position. The examiner led the ipsilateral leg into flexion, abduction and

9
external rotation so that the heel rested on the opposite kneecap. The examiner stabilized the
contralateral side of the pelvis to ensure that the lower back stayed in a neutral position. The
ipsilateral knee was lowered against the table and the examiner applied a light overpressure to
the subject’s knee. The pain response was recorded (yes, no). Both sides were tested and
scored separately.
Palpation of the pubic symphysis (Albert et al., 2000): The women were examined in
supine position. The examiner applied gentle pressure to the pubic symphysis with her hand
(flat fingers). If the pressure caused pain that persisted more than 5 seconds after removal of
the hand, it was recorded as pain (yes, no).
Palpation of the LDL (Vleeming et al., 2002): The women were examined in a side
lying position and the examiner palpated the LDL at her uppermost side, caudal to the
posterior-superior iliac spine. The test was positive if the palpation provoked pain and
recorded (yes, no). Both sides were examined and scored separately.
All tests have been commonly used with moderate to excellent inter-rater reliability
reported (Ostgaard et al., 1994; Laslett and Williams, 1994; Mens et al., 2001; Robinson et
al., 2007).
Apart from the P4 test, we calculated a sum score of all positive responses from the
described pain provocation tests, ranging from 0 (all negative) to 8 (all positive). Based on
the P4 test’s relevance for PGP reported in previous studies (Ostgaard et al., 1994; Gutke et
al., 2009), we decided to use the P4 as a single response and not as part of a sum score. ASLR
test was also used as a single response.
The study sample
The women were defined as afflicted in gestation week 30 if : 1) they reported to have
PGP (yes, no) and/or had marked in the pelvic area on the pain drawing, and 2) they had a

10
DRI score above the 25 percentile for the 283 women being examined in gestation week 30
(DRI>22). Both criteria were required, and resulted in 179 women included in the analyses.
Statistical analyses
Descriptive data is given as frequencies and percentages, means and standard
deviations (SDs) or medians and ranges or interquartile ranges (IQR). Multiple linear
regression analysis was used to study the associations between potential risk factors measured
in pregnancy and DRI or pain intensity measured 12 weeks postpartum. Associations between
the explanatory variables as well as between the explanatory variables and each of the
response variables were studied by Spearman rank correlation coefficients. Explanatory
variables significantly associated with the response variable or found important in previous
studies were entered into a multiple regression model. The best subsets of explanatory
variables were selected through exclusion of the variables with the smallest contribution to the
model (the largest p-values). We divided pre-pregnancy BMI, ASLR, and HSCL-25 into two
categories (<25, ≥25kg/m2) (WHO, 2010), (0, ≥1) (Mens et al., 2001) and (<1.75, ≥1.75)
(Sandanger et al., 1998) respectively, the sum of pain provocation test into four categories (0-
1, 2-3, 4-5, and 6-8 positive tests) and the number of pain sites into four categories (0, 1, 2,
3-4). Interaction effects were tested, but real interactions may go undetected since this test
lacks power (Kirkwood and Sterne, 2003). The residuals were examined to check model
assumptions. Since a large number of the women reported low pain intensity and DRI 12
weeks postpartum, we also repeated the multiple linear regression analyses with pain intensity
and DRI ln transformed.
In order to estimate the odds ratios for sustained PGP, we categorized the women as
recovered or non-recovered 12 weeks postpartum based on a combination of pain and
disability. Women were non-recovered if self-reported PGP and/or markings in the pelvic area

11
on the pain drawing was present and if the DRI was above 10 (Salen et al., 1994). A logistic
regression model was used to study the associations between non-recovery and the same
explanatory variables as used in the multiple linear regression analyses. We also used an
alternative definition of non-recovery based on the definition described above, but in addition
the pain intensity should be above ten. The results from the logistic regression model with the
latter response variable were similar; hence these results are not presented.
The statistical analyses were conducted in SPSS version 16.0 and a 5% level of
significance was used.
Results
Four percent of the women were single, 5% were smokers and 50% reported a pre-
pregnancy history of LBP (table 1). The frequencies of positive responses at gestation week
30 were high on four of the provocation tests (54 – 77%) (table 2). Lower frequencies were
observed for the compression test (30%) and the palpation of the pubic symphysis (17%).
Sum of pain provocation tests had a median value of 4 (range 0, 8) (table 2).
DRI and pain intensity 12 weeks postpartum had a median value of 5 (IQR 20) and 0
(IQR 12) respectively and were significantly correlated (rs=0.63, p<0.001). The correlation
coefficients between DRI and the potential risk factors ranged from -0.01 to 0.28 and,
between pain intensity and the potential risk factors from -0.08 to 0.34 (table 3). The
correlation coefficients between the potential risk factors did not suggest collinearity (range -
0.28 to 0.36). The only exception from this was a correlation coefficient of 0.75 between the
P4 test and sum of pain provocation tests.
Marital status, education, smoking, pre-pregnancy physical activity, and HSCL-25
were not significantly associated with either DRI or pain intensity12 weeks postpartum in the
bivariate analysis (0.56≤p≤0.81) (table 3). These variables were not entered in the respective

12
multivariable models. Age and parity were not significantly associated with any of the
response variables (0.31≤p≤0.88) and pre-pregnancy LBP was not associated with pain
intensity (p=0.50) (table 3). Yet these variables were entered in the multivariable models
based on previous studies (Berg et al., 1988; Ostgaard et al., 1991; Kristiansson et al., 1996;
Hansen et al., 1999; Mogren and Pohjanen, 2005; Albert et al., 2006). Pain locations were not
associated with DRI (p=0.15) and the ASLR test was not significantly associated with pain
intensity (p=0.07). Yet, these variables were entered in the multivariable models based on the
hypothesis and previous studies (Albert et al., 2001; Vollestad and Stuge, 2009; Robinson et
al., 2010b).
In the multivariable model, pre-pregnancy LBP and sum of pain provocation tests
were significantly associated with DRI 12 weeks postpartum (table 4). Pre-pregnancy BMI
and the ASLR test were also associated with DRI, though not significantly (0.05≤p≤0.07)
Age, parity, pain locations, P4 test and number of pain sites were not significantly associated
with DRI (0.23≤p≤0.88) and were not included in the final model. R2 was 0.18. No significant
interactions were found between the explanatory variables (0.19≤pinteraction≤0.93).
In the multivariable model, the number of pain sites and the sum of pain provocation
tests were significantly associated with pain intensity 12 weeks postpartum (table 5). Pre-
pregnancy BMI was associated with pain intensity, though not significantly (p=0.05). Age,
parity, mFABQ, pain locations, P4 and the ASLR test were not significantly associated with
pain intensity (0.18≤p≤0.75) and were not included in the final model. R2 was 0.16. No
significant interactions were found between the explanatory variables (0.06≤pinteraction≤0.87).
The analyses were repeated with pain intensity and DRI ln transformed. The same risk
factors were identified but the p-values were somewhat changed (table 4 and 5).
Because the P4 test and the sum of pain provocation tests were strongly correlated (rs=
0.75), the analyses were repeated with both variables in the model as well as with each one
13
separately. The results consistently showed that the P4 test was not significantly associated
with either DRI or pain intensity 12 weeks postpartum (0.14≤p≤0.80).
The same explanatory variables as used in the analyses above were also entered into a
logistic regression model with non-recovery 12 weeks postpartum as the response variable.
Number of pain sites and sum of pain provocation tests were significantly associated with
non-recovery (table 6). Pre-pregnancy BMI was also associated with non-recovery, though
not significantly (p=0.05). The odds increased with increased number of pain sites and OR
was 4.4 (95% CI (1.3, 14.6)) for women with 3-4 pain sites as compared to women with no
pain sites in the adjusted analyses. Moreover, OR=3.5 (95% CI (1.2, 10.3)) for women with 6-
8 positive provocation tests as compared to women with 0-1 positive test.
Discussion
To our knowledge, this is the first study that includes both socio-demographical and
psychological factors together with results of clinical tests in multiple regression models, to
identify risk factors for disability and pain intensity 12 weeks postpartum. Our results showed
that a high number of positive pain provocation tests was a significant risk factor for both
disability and pain intensity measured by graded scales 12 weeks postpartum. Furthermore, a
high number of pain sites was a significant risk factor for pain intensity. When we used the
dichotomous variable for non-recovery as response in a multiple logistic regression analysis,
the sum of pain provocation tests and number of pain sites were significant risk factors. Hence
the results were quite consistent.
The outcome variables used in the present study differ from what have previously
been used. Croft has recently recommended graded scales (Croft, 2009), and in accordance
with this we used DRI and pain intensity as measures of affliction. Also when defining the
dichotomous response variable for the logistic regression analysis both pain and disability was
14
included. Hence the outcomes used in both regression models were based on affliction levels
and not simply the presence of PGP.
The present study identified two pain related risk factors. Sum of pain provocation
tests are supposed directly related to the pelvis and the number of positive tests may thus be
assumed to reflect severity of PGP. Hence, it seems that the affliction level of the pelvis itself
is important for the degree of recovery postpartum. The other pain related factor, number of
pain sites, reflects affliction in other areas of the body. Although only four areas were
included in the questionnaire, the number of pain sites in pregnancy was associated with pain
intensity and non-recovery postpartum. This finding is in keeping with a prospective study of
patients with LBP showing that widespread pain was a risk factor of persistent disabling LBP
(Thomas et al., 1999). Furthermore, it has also been shown in a population based study that
the number of pain sites is a predictor of work disability (Kamaleri et al., 2009). Hence, it
seems that widespread pain is a common risk factor for different groups, including those
seeking health care and those less afflicted.
The functional ASLR test was associated with DRI 12 weeks postpartum though not
significant. It has been suggested that the ASLR test can assess disease severity in patients
with PGP postpartum (Mens et al., 2002), and that there is an association between the ASLR
test and mobility in the pelvic joints (Mens et al., 1999), but the evidence for these
associations is weak. We have previously shown that the ASLR test was associated with
disability, when both factors were measured in gestation week 30 (Robinson et al., 2010a).
However, little is known about the relationship between the ASLR test and recovery or
improvement in function, although a relationship could be expected.
Interestingly, the P4 test was not associated with either disability or pain intensity 12
weeks postpartum. Even though it has been identified as a risk factor for the development of
PGP in pregnancy (Robinson et al., 2010a), the P4 test seems to be of negligible importance

15
for the prognosis. The P4 and the ASLR test thus seem to differ in their ability to predict the
development of PGP in pregnancy and prognosis postpartum. This suggests that the P4 and
the ASLR test reflect different aspects of PGP.
Previous studies have shown that pain location was risk factors for sustained PGP after
delivery (Albert et al., 2001; Gutke et al., 2008; Vollestad and Stuge, 2009). Our analyses
with graded scales could not verify these results. Furthermore, logistic regression analyses,
using dichotomous responses gave the same result. Hence the inclusion of clinical tests seems
to abolish possible effects of pain locations.
Age, parity, pre-pregnancy BMI and pre-pregnancy LBP have been associated with
sustained PGP postpartum in previous studies using bivariate statistics (Ostgaard and
Andersson, 1992; Turgut et al., 1998; To and Wong, 2003; Albert et al., 2006) or
multivariable models (Breen et al., 1994; Mogren, 2006; Rost et al., 2006). In the present
study, pre-pregnancy BMI was associated with both DRI and pain intensity, but not
significantly. Pre-pregnancy LBP was identified as a risk factor for disability. Different
terminology and definitions, as well as lack of multivariable analyses in previous studies
make further comparisons difficult.
Apart from the sum of pain provocation tests, the risk factors for sustained disability
and pain intensity postpartum differ from the risk factors identified for development of
disability and pain intensity during pregnancy (Robinson et al., 2010b). The difference
indicates that the underlying processes for development and prolongation of PGP postpartum
are different.
Conclusions
This study shows that results of clinical examinations and tests in late pregnancy are
significant risk factors for disability and pain intensity 3 months postpartum, even when

16
controlling for socio-demographical and psychological factors. The clinical tests used in this
study are easy to perform, and the results are of clinical importance because they seem to have
the potential to identify women with a poor prognosis. It will be of interest to examine if the
clinical factors also represent a risk for pelvic girdle pain and disability when the follow-up
period is extended. Furthermore, the clinical risk factors should be used as basis for
development of strategies for management of women at risk for sustained PGP postpartum.

17
Reference List
Albert H, Godskesen M, Westergaard J. Evaluation of clinical tests used in classification procedures in pregnancy-related pelvic joint pain. Eur Spine J 2000; 9(2): 161-166.
Albert H, Godskesen M, Westergaard J. Prognosis in four syndromes of pregnancy-related pelvic pain. Acta Obstet Gynecol Scand 2001; 80(6): 505-510.
Albert H B, Godskesen M, Korsholm L, Westergaard J G. Risk factors in developing pregnancy-related pelvic girdle pain. Acta Obstet Gynecol Scand 2006; 85(5): 539-544.
Berg G, Hammar M, Moller-Nielsen J, Linden U, Thorblad J. Low back pain during pregnancy. Obstet Gynecol 1988; 71(1): 71-75.
Breen T W, Ransil B J, Groves P A, Oriol N E. Factors associated with back pain after childbirth. Anesthesiology 1994; 81(1): 29-34.
Cedraschi C, Allaz A F. How to identify patients with a poor prognosis in daily clinical practice. Best Practice & Research Clinical Rheumatology 2005; 19(4): 577-591.
Croft P. The question is not "have you got it"? But "how much of it have you got"? Pain 2009; 141(1-2): 6-7.
Dreyfuss P, Michaelsen M, Pauza K, McLarty J, Bogduk N. The value of medical history and physical examination in diagnosing sacroiliac joint pain [see comments]. Spine 1996; 21(22): 2594-2602.
Grotle M, Brox J I, Veierod M B, Glomsrod B, Lonn J H, Vollestad N K. Clinical course and prognostic factors in acute low back pain: patients consulting primary care for the first time. Spine 2005; 30(8): 976-982.
Gutke A, Hansson E R, Zetherstrom G, Ostgaard H C. Posterior pelvic pain provocation test is negative in patients with lumbar herniated discs. Eur Spine J 2009; 18(7): 1008-1012.
Gutke A, Ostgaard H C, Oberg B. Pelvic girdle pain and lumbar pain in pregnancy: a cohort study of the consequences in terms of health and functioning. Spine 2006; 31(5): E149-E155.
Gutke A, Ostgaard H C, Oberg B. Predicting persistent pregnancy-related low back pain. Spine 2008; 33(12): E386-E393.
Hansen A, Jensen D V, Wormslev M, Minck H, Johansen S, Larsen E C, Wilken-Jensen C, Davidsen M, Hansen T M. Symptom-giving pelvic girdle relaxation in pregnancy. II: Symptoms and clinical signs. Acta Obstet Gynecol Scand 1999; 78(2): 111-115.
Kamaleri Y, Natvig B, Ihlebaek C M, Bruusgaard D. Does the number of musculoskeletal pain sites predict work disability? A 14-year prospective study. Eur J Pain 2009; 13(4): 426-430.
Kirkwood B R, Sterne J A C. Essential Medical Statistics. Blackwell Science Ltd, Massachusetts, USA 2003.
18
Kristiansson P, Svardsudd K, von Schoultz B. Back pain during pregnancy: a prospective study. Spine 1996; 21(6): 702-709.
Larsen E C, Wilken-Jensen C, Hansen A, Jensen D V, Johansen S, Minck H, Wormslev M, Davidsen M, Hansen T M. Symptom-giving pelvic girdle relaxation in pregnancy. I: Prevalence and risk factors. Acta Obstet Gynecol Scand 1999; 78(2): 105-110.
Laslett M, Williams M. The reliability of selected pain provocation tests for sacroiliac joint pathology. Spine 1994; 19(11): 1243-1249.
Linton S J, Buer N, Vlaeyen J W, Hellsing A L. Are Fear -Avoidance Beliefs Related to the Inception of an Apisode of Back Pain? A Prospective Study. Psychology and Health 2000; 14: 1051-1059.
Mens J M, Vleeming A, Snijders C J, Koes B W, Stam H J. Reliability and validity of the active straight leg raise test in posterior pelvic pain since pregnancy. Spine 2001; 26(10): 1167-1171.
Mens J M, Vleeming A, Snijders C J, Koes B W, Stam H J. Validity of the active straight leg raise test for measuring disease severity in patients with posterior pelvic pain after pregnancy. Spine 2002; 27(2): 196-200.
Mens J M, Vleeming A, Snijders C J, Stam H J, Ginai A Z. The active straight leg raising test and mobility of the pelvic joints. Eur Spine J 1999; 8(6): 468-474.
Mogren I M. BMI, pain and hyper-mobility are determinants of long-term outcome for women with low back pain and pelvic pain during pregnancy. Eur Spine J 2006; 15(7): 1093-1102.
Mogren I M, Pohjanen A I. Low back pain and pelvic pain during pregnancy: prevalence and risk factors. Spine 2005; 30(8): 983-991.
Olsson C, Buer N, Holm K, Nilsson-Wikmar L. Lumbopelvic pain associated with catastrophizing and fear-avoidance beliefs in early pregnancy. Acta Obstet Gynecol Scand 2009; 88(4): 378-385.
Olsson C, Nilsson-Wikmar L. Health-related quality of life and physical ability among pregnant women with and without back pain in late pregnancy. Acta Obstetricia et Gynecologica Scandinavica 2004; 83(4): 351-357.
Ostgaard H C, Andersson G B. Postpartum low-back pain. Spine 1992; 17(1): 53-55.
Ostgaard H C, Andersson G B, Karlsson K. Prevalence of back pain in pregnancy. Spine 1991; 16(5): 549-552.
Ostgaard H C, Roos-Hansson E, Zetherstrom G. Regression of back and posterior pelvic pain after pregnancy. Spine 1996; 21(23): 2777-2780.
Ostgaard H C, Zetherstrom G, Roos-Hansson E. The posterior pelvic pain provocation test in pregnant women. Eur Spine J 1994; 3(5): 258-260.

19
Rickels K, Garcia C R, Lipman R S, Derogatis L R, Fisher E L. The Hopkins Symptom Checklist. Assessing emotional distress in obstetric-gynecologic practice. Prim Care 1976; 3(4): 751-764.
Robinson H S, Brox J I, Robinson R, Bjelland E, Solem S, Telje T. The reliability of selected motion- and pain provocation tests for the sacroiliac joint. Man Ther 2007; 12(1): 72-79.
Robinson H S, Mengshoel A M, Bjelland E K, Vollestad N K. Pelvic girdle pain, clinical tests and disability in late pregnancy. Man Ther 2010a; 15(3): 280-285.
Robinson H S, Veierød M B, Mengshoel A M, Vøllestad N K. Pelvic girdle pain - associations between risk factors in early pregnancy and disability or pain intensity in late pregnancy: a prospective cohort study. BMC Musculoskeletal Disorders 2010b.
Rost C C, Jacqueline J, Kaiser A, Verhagen A P, Koes B W. Prognosis of women with pelvic pain during pregnancy: a long-term follow-up study. Acta Obstet Gynecol Scand 2006; 85(7): 771-777.
Salen B A, Spangfortke L, Nordemar R. The disability rating index: An instrument for the assessment of disability in clinical settings. Journal of Clinical Epidemiology 1994; 47(12): 1423-1435.
Sandanger I, Moum T, Ingebrigtsen G, Dalgard O S, Sorensen T, Bruusgaard D. Concordance between symptom screening and diagnostic procedure: the Hopkins Symptom Checklist-25 and the Composite International Diagnostic Interview I. Soc Psychiatry Psychiatr Epidemiol 1998; 33(7): 345-354.
Slipman C W, Sterenfeld E B, Chou L H, Herzog R, Vresilovic E. The predictive value of provocative sacroiliac joint stress maneuvers in the diagnosis of sacroiliac joint syndrome. Arch Phys Med Rehabil 1998; 79(3): 288-292.
Stuge B, Veierod M B, Laerum E, Vollestad N. The efficacy of a treatment program focusing on specific stabilizing exercises for pelvic girdle pain after pregnancy: a two-year follow-up of a randomized clinical trial. Spine 2004; 29(10): E197-E203.
Thomas E, Silman A J, Croft P R, Papageorgiou A C, Jayson M I, Macfarlane G J. Predicting who develops chronic low back pain in primary care: a prospective study. BMJ 1999; 318(7199): 1662-1667.
To W W, Wong M W. Factors associated with back pain symptoms in pregnancy and the persistence of pain 2 years after pregnancy. Acta Obstet Gynecol Scand 2003; 82(12): 1086-1091.
Turgut F, Turgut M, Cetinsahin M. A prospective study of persistent back pain after pregnancy. Eur J Obstet Gynecol Reprod Biol 1998; 80(1): 45-48.
Vleeming A, Albert H B, Ostgaard H C, Sturesson B, Stuge B. European guidelines for the diagnosis and treatment of pelvic girdle pain. Eur Spine J 2008; 17(6): 794-819.
Vleeming A, de Vries H J, Mens J M, van Wingerden J P. Possible role of the long dorsal sacroiliac ligament in women with peripartum pelvic pain. Acta Obstet Gynecol Scand 2002; 81(5): 430-436.

20
Vollestad N K, Stuge B. Prognostic factors for recovery from postpartum pelvic girdle pain. Eur Spine J 2009.
Waddell G, Newton M, Henderson I, Somerville D, Main C J. A Fear-Avoidance Beliefs Questionnaire (FABQ) and the role of fear-avoidance beliefs in chronic low back pain and disability. Pain 1993; 52(2): 157-168.
WHO. Obesity and overweight. WHO [serial online] 2010; [cited 2010 Jan. 25]. Available from http://www.who.int/mediacentre/factsheets/fs311/en/index.html.
Wu W H, Meijer O G, Uegaki K, Mens J M A, van Dieen J H, Wuisman P I J M, Ostgaard H C. Pregnancy-related pelvic girdle pain (PPP), I: Terminology, clinical presentation, and prevalence. European Spine Journal 2004; 13(7): 575-589.
Captions to illustrations
Figure 1 The study sample

21
Figure 1
104 women not afflicted with PGP
385 eligible pregnant women from 4 Maternity Care Units
59 denied participation
326 women included, questionnaire and clinical
examination
9 miscarriages and 3 drop outs
Gestation week 30: 283 women met for a new
clinical examination
12 weeks postpartum: 179 women defined as
afflicted in gestation week 30, answered questionnaire
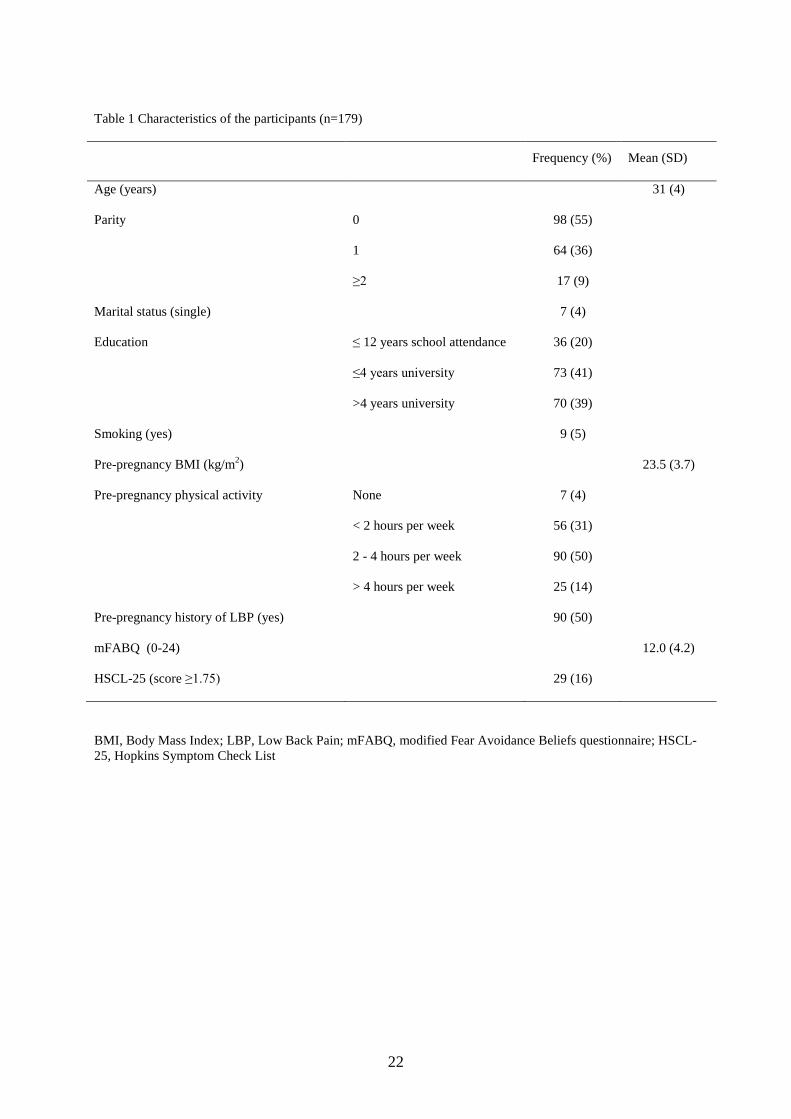
22
Table 1 Characteristics of the participants (n=179)
Frequency (%) Mean (SD)
Age (years) 31 (4)
Parity 0 98 (55)
1 64 (36)
≥2 17 (9)
Marital status (single) 7 (4)
Education ≤ 12 years school attendance 36 (20)
≤4 years university 73 (41)
>4 years university 70 (39)
Smoking (yes) 9 (5)
Pre-pregnancy BMI (kg/m2) 23.5 (3.7)
Pre-pregnancy physical activity None 7 (4)
< 2 hours per week 56 (31)
2 - 4 hours per week 90 (50)
> 4 hours per week 25 (14)
Pre-pregnancy history of LBP (yes) 90 (50)
mFABQ (0-24) 12.0 (4.2)
HSCL-25 (score ≥1.75) 29 (16)
BMI, Body Mass Index; LBP, Low Back Pain; mFABQ, modified Fear Avoidance Beliefs questionnaire; HSCL-25, Hopkins Symptom Check List

23
Table 2 Pain locations and clinical tests in gestation week 30 and DRI and pain intensity 12 weeks postpartum. (n=179)
Frequency (%) Median
(range)
Pain locations No pain 3 (2)
Pain in symphysis only 12 (7)
Posterior pain only 99 (55)
Combined symphysis
and posterior pain
65 (36)
Pain provocation
tests
Distraction test Negative 83 (46)
Positive 96 (54)
Compression test Negative 125 (70)
Unilateral positive 33 (18)
Bilateral positive 21 (12)
Patrick-Faber test Negative 54 (30)
Unilateral positive 51 (29)
Bilateral positive 73 (41)
Palpation of pubic
symphysis
Negative
148 (83)
Positive 30 (17)
Palpation of LDL Negative 50 (29)
Unilateral positive 44 (25)
Bilateral positive 81 (45)
Sum of pain
provocation tests (0, 8)
4 (0, 8)
P4 test Negative 41 (23)
Unilateral positive 30 (17)
Bilateral positive 108 60)
Functional test
ASLR test (0, 10) 3 (0, 10)
Number of pain sites 0 92 (51)
1 44 (25)
2 25 (14)
3 14 (8)
4 4 (2)
LDL, Long Dorsal Sacroiliac Ligament; P4 test, Posterior Pelvic Pain Provocation test; ASLR test, Active Straight Leg Raise test
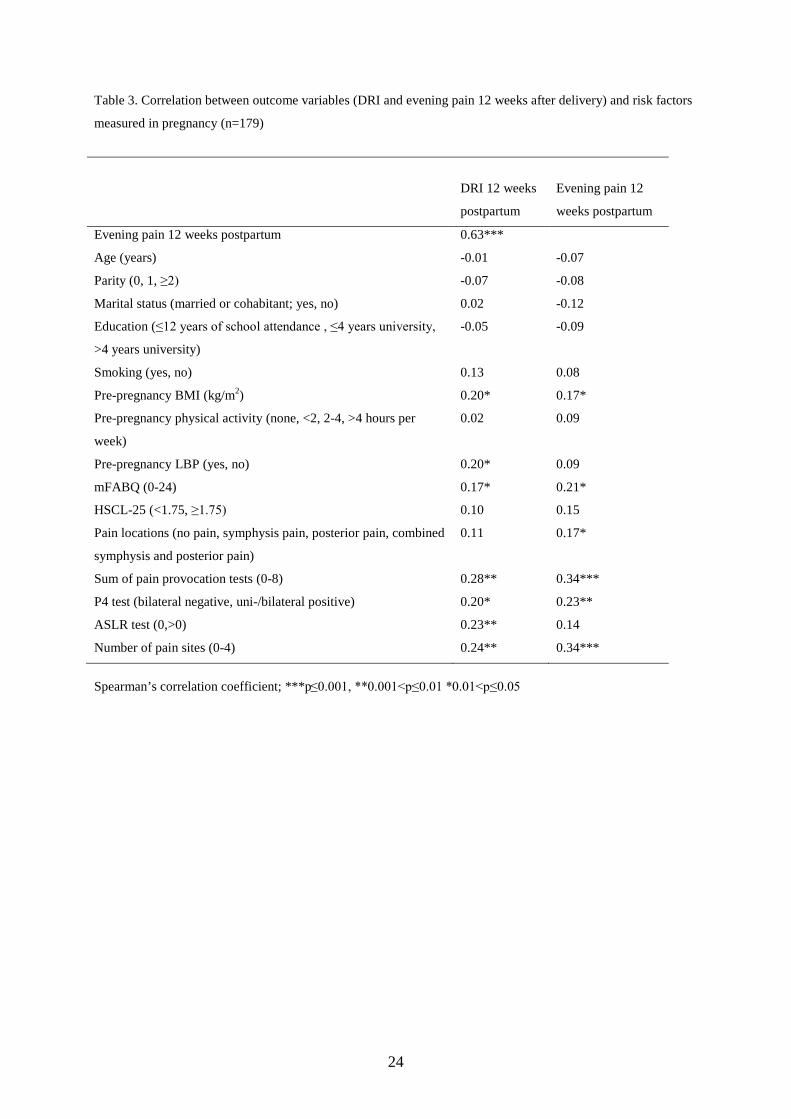
24
Table 3. Correlation between outcome variables (DRI and evening pain 12 weeks after delivery) and risk factors
measured in pregnancy (n=179)
DRI 12 weeks
postpartum
Evening pain 12
weeks postpartum
Evening pain 12 weeks postpartum 0.63***
Age (years) -0.01 -0.07
Parity (0, 1, ≥2) -0.07 -0.08
Marital status (married or cohabitant; yes, no) 0.02 -0.12
Education (≤12 years of school attendance , ≤4 years university,
>4 years university)
-0.05 -0.09
Smoking (yes, no) 0.13 0.08
Pre-pregnancy BMI (kg/m2) 0.20* 0.17*
Pre-pregnancy physical activity (none, <2, 2-4, >4 hours per
week)
0.02 0.09
Pre-pregnancy LBP (yes, no) 0.20* 0.09
mFABQ (0-24) 0.17* 0.21*
HSCL-25 (<1.75, ≥1.75) 0.10 0.15
Pain locations (no pain, symphysis pain, posterior pain, combined
symphysis and posterior pain)
0.11 0.17*
Sum of pain provocation tests (0-8) 0.28** 0.34***
P4 test (bilateral negative, uni-/bilateral positive) 0.20* 0.23**
ASLR test (0,>0) 0.23** 0.14
Number of pain sites (0-4) 0.24** 0.34***
Spearman’s correlation coefficient; ***p≤0.001, **0.001<p≤0.01 *0.01<p≤0.05
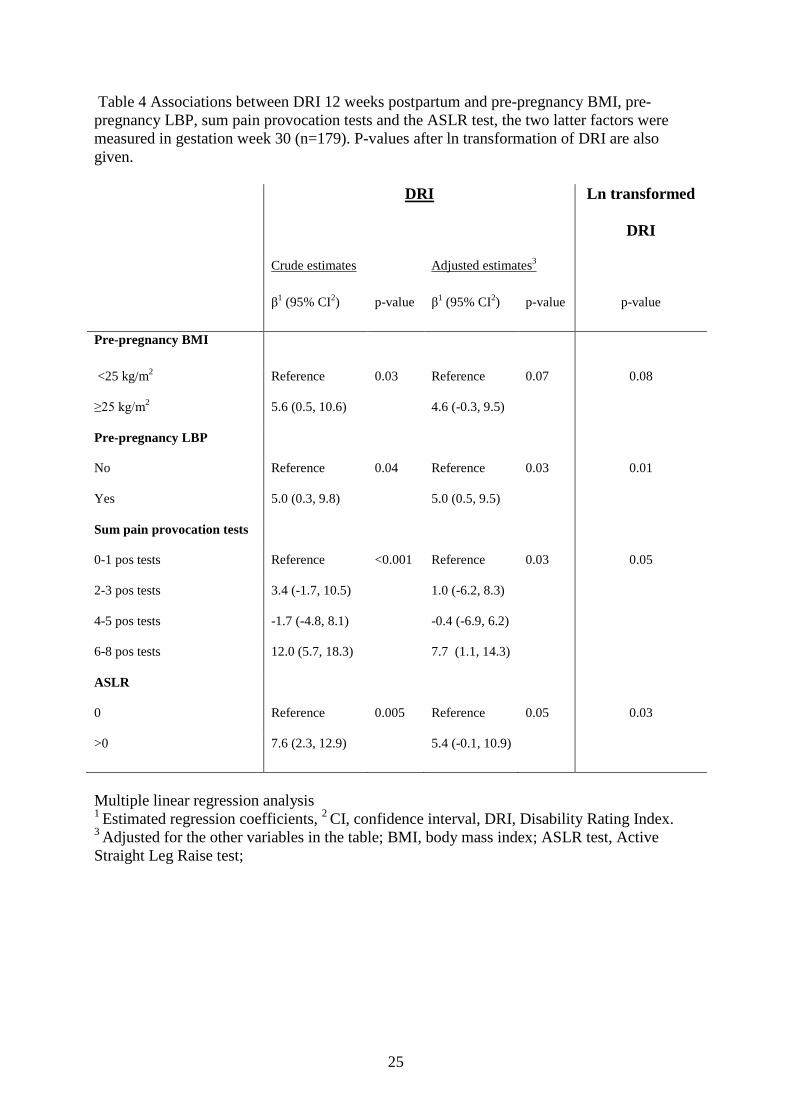
25
Table 4 Associations between DRI 12 weeks postpartum and pre-pregnancy BMI, pre-pregnancy LBP, sum pain provocation tests and the ASLR test, the two latter factors were measured in gestation week 30 (n=179). P-values after ln transformation of DRI are also given. DRI Ln transformed
DRI
Crude estimates Adjusted estimates3
β1 (95% CI2) p-value β1 (95% CI2) p-value p-value
Pre-pregnancy BMI
<25 kg/m2 Reference 0.03 Reference 0.07 0.08
≥25 kg/m2 5.6 (0.5, 10.6) 4.6 (-0.3, 9.5)
Pre-pregnancy LBP
No Reference 0.04 Reference 0.03 0.01
Yes 5.0 (0.3, 9.8) 5.0 (0.5, 9.5)
Sum pain provocation tests
0-1 pos tests Reference <0.001 Reference 0.03 0.05
2-3 pos tests 3.4 (-1.7, 10.5) 1.0 (-6.2, 8.3)
4-5 pos tests -1.7 (-4.8, 8.1) -0.4 (-6.9, 6.2)
6-8 pos tests 12.0 (5.7, 18.3) 7.7 (1.1, 14.3)
ASLR
0 Reference 0.005 Reference 0.05 0.03
>0 7.6 (2.3, 12.9) 5.4 (-0.1, 10.9)
Multiple linear regression analysis 1 Estimated regression coefficients, 2 CI, confidence interval, DRI, Disability Rating Index. 3 Adjusted for the other variables in the table; BMI, body mass index; ASLR test, Active Straight Leg Raise test;

26
Table 5 Associations between pain intensity 12 weeks postpartum and pre-pregnancy BMI, sum of pain provocation tests and number of pain sites (n=179). The two latter factors were measured in gestation week 30. P-values after ln transformation of pain intensity are also given.
Pain intensity Ln transformed
pain intensity
Crude estimates Adjusted estimates3
β1 (95% CI2) p-value β1 (95% CI2) p-value p-value
Pre-pregnancy BMI
<25 kg/m2 Reference 0.02 Reference 0.05 0.007
≥25 kg/m2 8.8 (1.5, 15.1) 5.7 (-0.3, 11.8)
Number of pain sites
0 Reference 0.03 Reference 0.007 0.001
1 3.9 (-3.5, 11.4) 1.5 (-5.9, 9.0)
2 9.9 (0.4, 19.3) 8.8 (-0.5, 18.2)
3-4 21.5 (10.7, 32.3) 18.7 (7.9, 29.6)
Sum pain provocation tests
0-1 pos tests Reference 0.006 Reference 0.04 0.001
2-3 pos tests 5.7 (-4.1, 15.5) 2.3 (-7.4, 11.9)
4-5 pos tests 5.4 (-3.5, 14.3) 1.3 (-7.4, 10.1)
6-8 pos tests 15.1 (6.4, 23.8) 11.2 (2.4, 19.8)
Multiple linear regression analysis 1 Estimated regression coefficients, 2 CI, confidence interval, DRI, Disability Rating Index. 3 Adjusted for the other variables in the table; BMI, body mass index
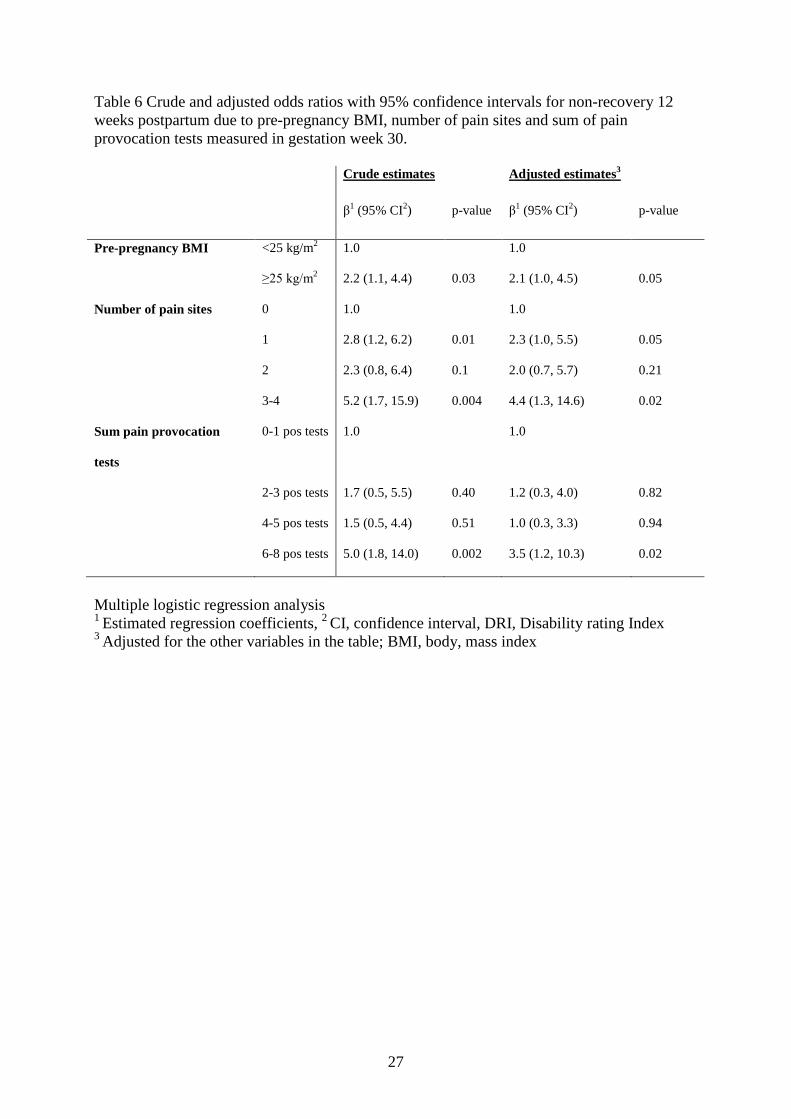
27
Table 6 Crude and adjusted odds ratios with 95% confidence intervals for non-recovery 12 weeks postpartum due to pre-pregnancy BMI, number of pain sites and sum of pain provocation tests measured in gestation week 30. Crude estimates Adjusted estimates3
β1 (95% CI2) p-value β1 (95% CI2) p-value
Pre-pregnancy BMI <25 kg/m2 1.0 1.0
≥25 kg/m2 2.2 (1.1, 4.4) 0.03 2.1 (1.0, 4.5) 0.05
Number of pain sites 0 1.0 1.0
1 2.8 (1.2, 6.2) 0.01 2.3 (1.0, 5.5) 0.05
2 2.3 (0.8, 6.4) 0.1 2.0 (0.7, 5.7) 0.21
3-4 5.2 (1.7, 15.9) 0.004 4.4 (1.3, 14.6) 0.02
Sum pain provocation
tests
0-1 pos tests 1.0 1.0
2-3 pos tests 1.7 (0.5, 5.5) 0.40 1.2 (0.3, 4.0) 0.82
4-5 pos tests 1.5 (0.5, 4.4) 0.51 1.0 (0.3, 3.3) 0.94
6-8 pos tests 5.0 (1.8, 14.0) 0.002 3.5 (1.2, 10.3) 0.02
Multiple logistic regression analysis 1 Estimated regression coefficients, 2 CI, confidence interval, DRI, Disability rating Index 3 Adjusted for the other variables in the table; BMI, body, mass index


APPENDIX Information form


UNIVERSITETET I OSLO,
Seksjon for helsefag, Postboks 1153 Blindern,
0318 Oslo
FORESPØRSEL OM DELTAGELSE I FORSKNINGSPROSJEKT:
KVINNERS PLAGER OG FYSISKE FUNKSJON UNDER OG ETTER SVANGERSKAP
Det har tidligere vært gjennomført flere helseundersøkelser i befolkningen, men få har
fokusert på kvinner under og etter svangerskap. Seksjon for helsefag ved Universitetet i Oslo i
samarbeid med Gamle Oslo helsestasjon og helsestasjonene i Oppegård, er nå i gang med en
undersøkelse av kvinners plager og fysiske funksjon under og etter svangerskap. For å få vite
noe om dette spør vi deg om du kan tenke deg å delta.
Undersøkelsen er en del av et doktorgradsarbeid ved Universitetet i Oslo.
Praktisk gjennomføring.
Kvinner som skal gå til svangerskapskontroll ved Gamle Oslo helsestasjon og helsestasjonene
i Oppegård, blir bedt om å delta i prosjektet. Deltagelse medfører at du må svare på et
spørreskjema tre ganger underveis i svangerskapet samt to ganger i løpet av de tre første
månedene etter fødsel. Det er derfor nødvendig at du behersker norsk språk både muntlig og
skriftlig. Innholdet i disse skjemaene dreier seg om din helse og fysiske funksjon samt om
eventuelle smerter eller plager som du opplever underveis i svangerskapet. Utfyllingen av det
første spørreskjemaet tar en drøy halv time, de resterende vil ta noe kortere tid. Ved første
gangs kontroll på helsestasjonen ønsker vi å ta en blodprøve av deg. Denne blodprøven
benyttes til å undersøke innholdet av et hormon (relaxin), som er relatert til svangerskap.
Dette hormonet kan være med å påvirke bevegelighet og funksjon hos gravide.
I tillegg ber vi om at en fysioterapeut får lov til å undersøke deg to ganger mens du er gravid
samt en gang tre mnd etter fødsel. Dette innebærer at vi tester ut hvor bevegelig du er i
leddene dine, om du har noen smerter fra korsrygg og bekken og hvordan du utfører enkle
funksjonsprøver. Selve undersøkelsen vil vare ca en halv time hver gang.
Det er frivillig å delta.
Du kan trekke deg fra prosjektet når som helst, uten å oppgi noen grunn, og det får ingen
konsekvenser for deg eller for dine videre kontroller på helsestasjonen. Hvis du skulle trekke
deg fra prosjektet så vil dine data bli anonymisert, og blodprøven din blir destruert.
Prosjektet er meldt til personvernombudet for forskning, Norsk Samfunnsvitenskapelig
datatjeneste.
Din sikkerhet.
Alle undersøkelser som benyttes er kjente og godt etablerte og benyttes daglig i undersøkelse
og behandling av gravide kvinner. Alle opplysninger vil være konfidensielle og bare brukes så
lenge prosjektet pågår. Opplysningene du gir oss oppbevares slik at de ikke kan kobles til deg.
Blodprøven din vil bli avidentifisert og sendt til Hormonlaboratoriet ved Aker
Universitetssykehus hvor den analyseres og lagres i en biobank. Denne forskningsbiobanken
er godkjent opprettet av Sosial- og helsedirektoratet.
Prosjektet planlegges å være ferdig 31. desember 2009. Etter avslutning vil de innsamlede
dataene oppbevares, men uten at deltagerne kan identifiseres. Avhengig av resultatene vi får,
kan det hende at vi kontakter deg igjen og spør om du kan tenke deg å svare på noen flere
spørsmål. Vi understreker at det er frivillig å være med på en eventuell oppfølging og at du
kan takke nei til dette. Hvis du ikke har blitt kontaktet igjen før prosjektet er avsluttet
(31.12.09), vil datamaterialet uansett bli anonymisert og blodprøvene destruert.
Prosjektet er tilrådd av Regional komité for medisinsk forskningsetikk (REK).

Dersom du har noen spørsmål er du velkommen til å ta kontakt med meg eller jordmor på
helsestasjonen. Jeg kan nås på følgende telefon nummer, 22858421, mobil: 90607081 (med
telefonsvarer). Informasjon om prosjektet finnes også på internett: http:/folk.uio.no/hildesr
Med vennlig hilsen
Hilde Stendal Robinson
Prosjektleder, doktorgradsstipendiat


Informert samtykke. Jeg har mottatt skriftlig og muntlig informasjon, og jeg er villig til å delta i prosjektet
”Kvinners plager og fysiske funksjon under og etter svangerskap”.
Jeg har forstått at deltagelsen er frivillig, og at jeg når som helst kan trekke meg fra
undersøkelsen uten å oppgi noen grunn.
………………………….. ………………….
Sted dato
…………………………………………………
Signatur