PEER-REVIEWED ARTICLE bioresources · PEER-REVIEWED ARTICLE bioresources.com Mohamed et al. (2019)....
17
PEER-REVIEWED ARTICLE bioresources.com Mohamed et al. (2019). “Rice husk composites,” BioResources 14(1), 1110-1126. 1110 Integration of Taguchi-Grey Relational Analysis Technique in Parameter Process Optimization for Rice Husk Composite Sity Ainy Nor Mohamed, a, * Edi Syams Zainudin, a,b S. M. Sapuan, a,b Mohd Azaman Md. Deros, c and Ahmad Mubarak Tajul Arifin d Injection molding is a widely used manufacturing process operation that generates polymer products. The selection of optimal injection molding process settings is essential due to the distinct influences of process parameters on polymeric material behavior and quality, particularly during the injection process. Therefore, it is vital to determine the optimized process parameters to enhance the mechanical properties of the products and ensure the most favorable performance. This paper examined the integration of Taguchi’s method with grey relational analysis (GRA) to determine the effects of varied injection molding parameters on the mechanical properties such as tensile strength and hardness values. The experiments were designed using Taguchi’s L9 orthogonal array after weighing in control factors, such as melting temperature, injection pressure, injection speed, and cooling time. The GRA revealed that the multiple responses correlation was successfully established. Finally, an analysis of variance was performed to validate the test outputs. The results revealed that the most influential factor was injection pressure, sequentially followed by melting temperature, cooling time, and injection speed. Keywords: Integration; Injection molding; Natural composite; Optimization Contact information: a: Department of Mechanical and Manufacturing Engineering, Faculty of Engineering, Universiti Putra Malaysia, 43400 UPM Serdang, Selangor Darul Ehsan, Malaysia; b: Laboratory of Biocomposite Technology, Institute of Tropical Forestry and Forest Products (INTROP), Universiti Putra Malaysia, 43400 UPM Serdang, Selangor, Malaysia; c: School of Manufacturing Engineering, Universiti Malaysia Perlis, Kampus Alam Pauh Putra, 02600 Arau, Perlis, Malaysia; d: Department of Materials and Design Engineering, Faculty of Mechanical and Manufacturing Engineering, Universiti Tun Hussein Onn Malaysia, 86400 Batu Pahat, Johor, Malaysia; * Corresponding author: [email protected] INTRODUCTION Based on recent developments in the manufacturing sector, plant fibers are being used as an amplifier in thermoset and thermoplastic products to replace synthetic materials. Such usage of plant fibers is particularly motivated by reductions in manufacturing costs, natural fiber capabilities to enhance the performance of engineering component applications, and concerns over environmental pollution due to disposal constraints (Sanjay et al. 2018). Therefore, cutting-edge research and development efforts have led to new products based on natural resources. Plant fibers, such as hemp, jute, flax, and kenaf, are the primary choices in generating plant fiber composites for various industry sectors (Lau et al. 2018).
Transcript of PEER-REVIEWED ARTICLE bioresources · PEER-REVIEWED ARTICLE bioresources.com Mohamed et al. (2019)....

PEER-REVIEWED ARTICLE bioresources.com
Mohamed et al. (2019). “Rice husk composites,” BioResources 14(1), 1110-1126. 1110
Integration of Taguchi-Grey Relational Analysis Technique in Parameter Process Optimization for Rice Husk Composite
Sity Ainy Nor Mohamed,a,* Edi Syams Zainudin,a,b S. M. Sapuan,a,b Mohd Azaman Md.
Deros,c and Ahmad Mubarak Tajul Arifin d
Injection molding is a widely used manufacturing process operation that generates polymer products. The selection of optimal injection molding process settings is essential due to the distinct influences of process parameters on polymeric material behavior and quality, particularly during the injection process. Therefore, it is vital to determine the optimized process parameters to enhance the mechanical properties of the products and ensure the most favorable performance. This paper examined the integration of Taguchi’s method with grey relational analysis (GRA) to determine the effects of varied injection molding parameters on the mechanical properties such as tensile strength and hardness values. The experiments were designed using Taguchi’s L9 orthogonal array after weighing in control factors, such as melting temperature, injection pressure, injection speed, and cooling time. The GRA revealed that the multiple responses correlation was successfully established. Finally, an analysis of variance was performed to validate the test outputs. The results revealed that the most influential factor was injection pressure, sequentially followed by melting temperature, cooling time, and injection speed.
Keywords: Integration; Injection molding; Natural composite; Optimization
Contact information: a: Department of Mechanical and Manufacturing Engineering, Faculty of
Engineering, Universiti Putra Malaysia, 43400 UPM Serdang, Selangor Darul Ehsan, Malaysia;
b: Laboratory of Biocomposite Technology, Institute of Tropical Forestry and Forest Products (INTROP),
Universiti Putra Malaysia, 43400 UPM Serdang, Selangor, Malaysia; c: School of Manufacturing
Engineering, Universiti Malaysia Perlis, Kampus Alam Pauh Putra, 02600 Arau, Perlis, Malaysia;
d: Department of Materials and Design Engineering, Faculty of Mechanical and Manufacturing
Engineering, Universiti Tun Hussein Onn Malaysia, 86400 Batu Pahat, Johor, Malaysia;
* Corresponding author: [email protected]
INTRODUCTION
Based on recent developments in the manufacturing sector, plant fibers are being
used as an amplifier in thermoset and thermoplastic products to replace synthetic materials.
Such usage of plant fibers is particularly motivated by reductions in manufacturing costs,
natural fiber capabilities to enhance the performance of engineering component
applications, and concerns over environmental pollution due to disposal constraints
(Sanjay et al. 2018). Therefore, cutting-edge research and development efforts have led to
new products based on natural resources. Plant fibers, such as hemp, jute, flax, and kenaf,
are the primary choices in generating plant fiber composites for various industry sectors
(Lau et al. 2018).

PEER-REVIEWED ARTICLE bioresources.com
Mohamed et al. (2019). “Rice husk composites,” BioResources 14(1), 1110-1126. 1111
Research on composites has shifted its focus to a variety of agricultural waste as
fillers and reinforcements in composites; these include rice and wheat husks, as well as
straw, bagasse, and corn stalks (Madurwar et al. 2013). Rice husk (RH) is an agricultural
waste that has vast product advantages. During the rice milling process, approximately
78% of the outcome is identified as rice, broken rice, and bran. Meanwhile, the remaining
22% of the weight is identified as RH. Similar to other plant fibers, RH is a lignocellulosic
fiber that is composed of cellulose (35%), hemicellulose (25%), and lignin (20%)
(Arjmandi et al. 2017). However, RH is hydrophilic and absorbs moisture, which suggests
a drawback in its mechanical properties. The combination of a hydrophobic thermoplastic
matrix, such as polypropylene (PP), polyethylene, and polystyrene, produces a composite
that has the strength of a fiber-matrix interface that enhances mechanical properties.
Natural fiber composites are derived from various manufacturing techniques,
including press molding, extrusion, injection molding, compression molding, and resin
transfer molding (Ho et al. 2012). To mass produce thermoplastic composites, injection
molding is an easy and effective method. However, essential process parameters need to
be optimized for ideal outcomes, such as injection speed, injection pressure, melting
temperature, holding time, and cooling time (Muthuraj et al. 2016). Hence, investigations
have been conducted to improve or optimize quality characteristics to generate high-quality
commercial plastic products, apart from maximizing service capabilities for the products.
Studies have omitted the interaction effects between the fixed parameters and the
mechanical properties of the products, although these aspects may have substantial
implications.
This paper describes the influence of optimizing the parameters involved in the
injection molding process to obtain maximum performing mechanical properties (tensile,
strength, and hardness) in the composite polymer. The method applied in this study refers
to the integration between the Taguchi’s method and the grey relational analysis (GRA),
which is a simultaneous optimization process of varied parameters to display the impacts
of multiple reaction combinations on the mechanical properties of RH composites. The
tested parameters were injection pressure, injection speed, melting temperature, and
cooling time. The GRA results indicated that injection pressure had the dominant effect on
the mechanical properties of RH composites, followed by the melting temperature, cooling
time, and injection speed. Additionally, characterization via an analysis of variance
(ANOVA) was performed in this study to verify the values obtained from the integrated
Taguchi-GRA method.
THEORY
Taguchi Method The Taguchi method has been widely applied in the engineering design sector. It is
comprised of system design, parameter design, and tolerance design procedures to achieve
a robust process and produce the best quality products (Mitra et al. 2016). The primary
application of the Taguchi method is for parameter design, which refers to an engineering
method to generate products or to devise a process design with the focus placed on
optimizing the integral parameters to establish good quality production with minimal
variation. The Taguchi design works as a dominant and efficient method to design
processes that operate consistently and optimally in numerous situations. Table 1 presents

PEER-REVIEWED ARTICLE bioresources.com
Mohamed et al. (2019). “Rice husk composites,” BioResources 14(1), 1110-1126. 1112
the required number of experiments based on orthogonal array. This process devises a
strategic set of required arrangements, apart from determining the best design.
Table 1. Orthogonal Array Selection (Karna and Sahai 2012)
Number of
Levels
Number of Parameters
2 3 4 5 6 7 8 9 10
2 L4 L4 L8 L8 L8 L8 L12 L12 L12
3 L9 L9 L9 L18 L18 L18 L18 L27 L27
4 L16 L16 L16 L16 L32 L32 L32 L32 L32
5 L25 L25 L25 L25 L25 L50 L50 L50 L50
The Taguchi method employs a signal-noise (S/N) ratio as a quality feature. The
S/N ratio refers to a measurable value in place of the standard deviation value. This is
because when the mean value decreases, the standard deviation will most likely decrease
as well and vice versa. Therefore, the quality characteristics are classified into three
categories which are named “the larger the better”, “the smaller the better”, and “nominal
is the best” (Lal and Vasudevan 2013).
Grey Relational Analysis (GRA) The Grey system theory, which was initiated by Deng in 1982 (Raju et al. 2017),
has been successfully applied in the engineering industry for prediction and control, as well
as social, economic, and agricultural systems. In fact, the development and application of
the Grey system theory is ongoing. The concept of GRA originated from the Grey system
theory, which reflects a measurement method that determines the correlation between
sequences using a certain amount of data. The GRA is based on geometrical mathematics
in compliance with the principles of normality, symmetry, entirety, and proximity. The
measure of relevance between two systems or two sequences can be defined as the
relational grade that depicts the trend correlation between reference (objective sequence)
and comparative sequences within a system (Prayogo and Lusi 2016). If both the reference
and comparative sequences lean toward concordance, then the relational grade approaches
one. In contrast, if the reference and comparative sequences do not lean toward
concordance, then the relational grade approaches zero. In comparison to conventional
statistical procedures, GRA only requires small amounts of data and the data are not limited
to a certain statistical distribution. Generally, GRA gives desirable information on the
similarity among sequences. The following equations (Eqs. 4 to 7) present the GRA
algorithm.
Data Pre-processing for Normalized Values The data pre-processing step is essential in GRA because the range and unit in a
data sequence may vary from the rest. This step is also necessary when the range of
sequence scatter is too large, or when the target direction in the sequence differs. This data
pre-processing step refers to a process of transferring the original sequence to one that is
comparable (Sreenivasulu and Rao 2012; Ali et al. 2018). Thus, the experimental outputs
are normalized in a range between zero and one. The original sequence, and the first
characteristic, “the larger, the better,” is shown in Eq. 4,
𝑥𝑖∗ =
𝑥𝑖(𝑘)−min 𝑥𝑖(𝑘)
max 𝑥𝑖(𝑘) min 𝑥𝑖(𝑘) (1)

PEER-REVIEWED ARTICLE bioresources.com
Mohamed et al. (2019). “Rice husk composites,” BioResources 14(1), 1110-1126. 1113
where *
ix (k) and xi(k) refer to the sequence after data pre-processing and the comparability
sequence, respectively, and k = 1 for i = 1, 2, 3, … for experiment numbers 1 to 9. The
deviation sequence of the reference sequence 𝑥0∗(𝑘) and the comparability sequence *
ix (k)
can be calculated using Eq. 5:
∆0𝑖(𝑘) = |𝑥0∗(𝑘) − 𝑥𝑖
∗(𝑘)| (2)
Computing the Grey Relational Coefficient (GRC) and Grey Relational Grade (GRG)
The correlation between the ideal and the actual normalized experimental outputs
can be expressed via the GRC and the GRG. The GRC is defined in Eq. 6,
min max
0 max
( )( )
i
i
kk
(3)
where ∆0𝑖(𝑘) denotes the deviation sequence of the reference sequence, 𝑥0∗(𝑘), and the
comparability sequence is *( ),ix k
for the identification coefficient, which is fixed at 0.5.
After obtaining the GRC, the GRG is computed by averaging the GRC
corresponding to each performance characteristic. The overall evaluation of the multiple
performance characteristics is based on the GRG, as presented in Eq. 7,
1
1( )
n
i i
k
kn
(4)
where yi refers to the GRG for the ith experiment, while n reflects the number of
performance characteristics. Therefore, a higher GRG showed that the corresponding
experimental result was closer to the ideally normalized value.
Validation Test Using ANOVA The main purpose of an ANOVA is to evaluate experimental error (Sufiyanto
2017). In the Taguchi method, the interaction between factors has been regarded as part of
the experimental error. A factor effect is considered meaningful when its value exceeds the
experimental error. Based on this method, a process adjustment approach in optimizing
parameter sets or process specifications is applied after considering a particular limit and
maintaining the other factors. The main objective of this method is to reduce cost and
enhance efficiency. In fact, this approach is a quantitative technique related to making
decisions, especially within the manufacturing industry (Shivapragash et al. 2013). Studies
have attempted to associate process parameters with the mechanical properties of
polymers. During the injection molding process, the fiber orientation varied substantially
across mold thicknesses, hence causing the polymer to be anisotropic, which affected the
main features of the product. However, the mechanical properties of the product can be
improvised by determining the fiber orientation during the injection process. In addition,
the impacts of various parameters, such as the melt and mold temperatures, flow rate,
matrix, fiber properties, volume fraction of fibers, molding geometry, gate type, and gate
location, on detailed distribution and fiber orientation in the final product have been
investigated (Graupner et al. 2016).

PEER-REVIEWED ARTICLE bioresources.com
Mohamed et al. (2019). “Rice husk composites,” BioResources 14(1), 1110-1126. 1114
The fabrication of polymer products through injection molding processes is similar
to the Taguchi method for optimizing process parameters. The effects of integral
processing parameters, such as injection velocity, packing pressure, mold and melt
temperatures, and cooling time, on the mechanical properties and failure behavior of the
polymer have been thoroughly examined (Kc et al. 2016). Based on the observation of the
polycarbonate (PC) polymer study, the mold and melt temperatures display considerable
impacts when compared to other parameters. The combination of higher mold temperatures
with moderate melt temperatures decreases the viscosity of PC while increasing the flow
speed in the molds. As a result, more organized molecular orientation and stronger
molecular bonds can be generated (Dar et al. 2017), resulting in an improvement of the
mechanical properties. Studies investigated optimizing the shrinkage and warpage impacts
on polymer products. Numerous approaches have been proposed to address this problem.
The review by Radhwan et al. (2015) states that the most important parameters that may
affect the shrinkage and warpage are melt temperature, packing time, mold temperature,
and packing pressure.
Kumar et al. (2014) applied the Taguchi method to determine the mechanical
properties of epoxy-based wood dust composites. Optimization of the three varied tensile
speed tests was performed. The main factor that affected both the load and tensile strength
values was speed, in which higher speeds led to shorter time for the filler to become
oriented. In contrast, the bending stress was only influenced by the filler content in the
composite. The bending involved load action on the material thickness. The Taguchi
method was also employed for parameter design to identify the optimum surface roughness
performance on the aluminum material with cutting parameters of depth of cut, cutting
speed, feed rate, and tool diameter (Razavykia et al. 2015). As a result, the tool diameter
was an irrelevant cutting factor for surface roughness. In another study, the Taguchi method
was combined with ANOVA to correlate the cutting speed and feed rate with delamination
in a composite laminate (Sreenivasulu and Rao 2013). Prayogo and Lusi (2016) used the
GRA to evaluate the current, pulse on time, pulse off time, and discharging time as the
electrical discharge machining (EDM) process parameters with the aim of minimizing
material removal rate and overcut.
The optimization method is important to determine the ideal mechanical properties
of composite materials by using efficient, precise, and robust experimental layout
approaches with adequate orthogonal array. However, some aspects must be considered,
in particular, parameter design and optimum condition (optimum level for each parameter).
Additionally, this method saves time and money, as the number of experiments can be
minimized when compared to conventional approaches. The Taguchi method has been
widely applied to determine the influential factors that dictate the quality characteristics in
the manufacturing process. The combination of the Taguchi method with another
optimization technique appears to be effective in investigating the impacts of multiple
factors on performance, aside from identifying the factors that exert more influence than
the rest.
EXPERIMENTAL Materials The RH-PP pellet preparation was performed via an extrusion process with a
compatibilizer agent. A 35 wt% filler loading was designed for this study. The RH fibers

PEER-REVIEWED ARTICLE bioresources.com
Mohamed et al. (2019). “Rice husk composites,” BioResources 14(1), 1110-1126. 1115
with sizes ranging between 100 µm and 500 µm were used as the filler content with Struktol
TR016 (Rhetech, Whitmore Lake, MI, USA) as the compatibilizer agent. The
compatibilizer agent functioned as an effective binder with good adhesion. It is important
for polymers to have filler content with uniform blending to maintain their physical
properties (Borůvka et al. 2015). Its low molecular weight reduced the viscosity during the
process, hence enhancing flow characteristics. The PP with 0.90 gm/cm3 to 0.91 gm/cm3
gravity (Polypropylene Malaysia Sdn Bhd, Pahang, Malaysia) was selected as the polymer
matrix because it is environmentally friendly, cost-effective, and fulfills technical
requirement.
Methods Mixing and processing
In this study, the RH-PP composites were prepared via an injection molding
technique at the SIRIM Green Laboratory, Shah Alam (Selangor, Malaysia). Experimental
ground RH was dried at 105 °C in an air dryer oven for 24 h to expel any moisture trapped
to a content of 1% to 2%, and then stored over desiccant in a sealed container. The RH was
then mixed with PP using a tumbler mixer for better dispersion of the RH and PP. Later,
the mixed compounds were melt-blended with a twin-screw extruder (ZE-25;
KraussMaffei Berstorff, Munich, Germany) at 160 °C and 190 °C for the feed zone and die
zone, respectively. The twin-screw extruder was a co-rotating type (L/D ratio = 33). The
compounds were extruded and pelletized at 100 rpm screw speed. The pellets were stored
in a sealed container and dried for approximately 3 h to 4 h before being injection-molded.
The temperatures applied for injection-molded samples were 170 °C and 190 °C for the
feed zone and die zone, respectively. The samples were injected at an injection pressure
between 45 kg/m2 and 50 kg/m2 with a 30 s cooling time. At the end of the procedure,
composites with varied filler loading composed of RH, PP, and a coupling agent were
prepared.
Specimen preparation
After the extrusion process, the pellets were injected using a 60-tonne Haitian
MA600 II/130 machine (Haitan Precision, Ningbo, China) (Fig. 1) into the shape shown in
Fig. 2 based on the test standard ASTM D638-03 (2004). The experiments were run at the
National Energy University laboratory located at Selangor, Malaysia.
Fig. 1. 60-tonne injection molding machine

PEER-REVIEWED ARTICLE bioresources.com
Mohamed et al. (2019). “Rice husk composites,” BioResources 14(1), 1110-1126. 1116
Fig. 2. Test specimen
Process parameters (e.g., injection pressure and speed, melt and mold temperatures,
cooling and holding time, and holding pressure) can strongly affect the mechanical
properties, such as tensile strength and hardness (Gaaz et al. 2016). In this optimization
process, three different levels were employed to determine four notable molding
parameters that affected the tensile strength and hardness values, which were melting
temperature, injection pressure, injection speed, and cooling time, as presented in Table 2
(Ibrahim et al. 2014). These parameters were chosen based on the machine setting
capabilities. The design parameters combination (orthogonal array) was integrated to
increase the experimental efficiency. The arrangements of the experimental runs for the L9
orthogonal array are displayed in Table 3.
Table 2. Factors and Levels Selection
Factors Level 1 Level 2 Level 3
A Melting temperature (°C) 170 175 180
B Injection pressure (%) 45 50 55
C Injection speed (%) 25 30 35
D Cooling time (s) 5 10 15
Table 3. Values of Orthogonal Array (Vignesh et al. 2016)
Factor Experiment
Injection Molding Parameter Level
Level of Parameter-A
Level of Parameter-B
Level of Parameter-C
Level of Parameter-D
1 1 1 1 1
2 1 2 2 2
3 1 3 3 3
4 2 1 2 3
5 2 2 3 1
6 2 3 1 2
7 3 1 3 2
8 3 2 1 3
9 3 3 2 1
Methods Tensile test
Mechanical tests have an important role in evaluating the fundamental nature of
engineering materials. This aspect is essential in generating new materials with controlled
material quality for use in designing and constructing sectors. Furthermore, it is important

PEER-REVIEWED ARTICLE bioresources.com
Mohamed et al. (2019). “Rice husk composites,” BioResources 14(1), 1110-1126. 1117
to determine the strength of a material to bear the burden placed on the material. As such,
tensile tests were conducted by adhering to the ASTM D638-03 (2004) standard using a
universal testing machine (Instron 3365; Instron Malaysia, Selangor, Malaysia), as
illustrated in Fig. 3. Dog bone-shaped geometry specimens were tested at a crosshead speed
of 5 mm/min to maintain a constant stress rate and a gauge length of 80 mm. Additionally,
an extensometer device was employed to measure its elongation during the tests. The
specimens were tested in each experimental run based on the orthogonal array arrangement.
Fig. 3. Tensile machine, Instron 3365
Fig. 4. The specimen placed on the Rockwell hardness machine
Machine Grip
Specimen
PEER-REVIEWED ARTICLE bioresources.com
Mohamed et al. (2019). “Rice husk composites,” BioResources 14(1), 1110-1126. 1118
Hardness test
Hardness tests were conducted using a Rockwell hardness tester (Yakin Maju,
Jakarta, Indonesia). The specimens were carefully placed on the machine, as portrayed in
Fig. 4. The tests adhered to test standard ASTM D785-08 (2008) and were recorded based
on the R scale. During the experiments, 0.5 in (12.7 mm) bends were applied with a major
load fixed at 60 kg. The pointer was rotated clockwise until the pointer tip touched the
surface of the specimen. This experiment was held for 30 s until the machine screen
displayed the specimen hardness readings. The experiments were repeated at various spots
on the specimens to obtain the mean value of the hardness aspect. The Rockwell
experiments were performed mainly because the accuracy of hardness readings can be
obtained directly via machine display, hence dismissing special preparation on various
specimens.
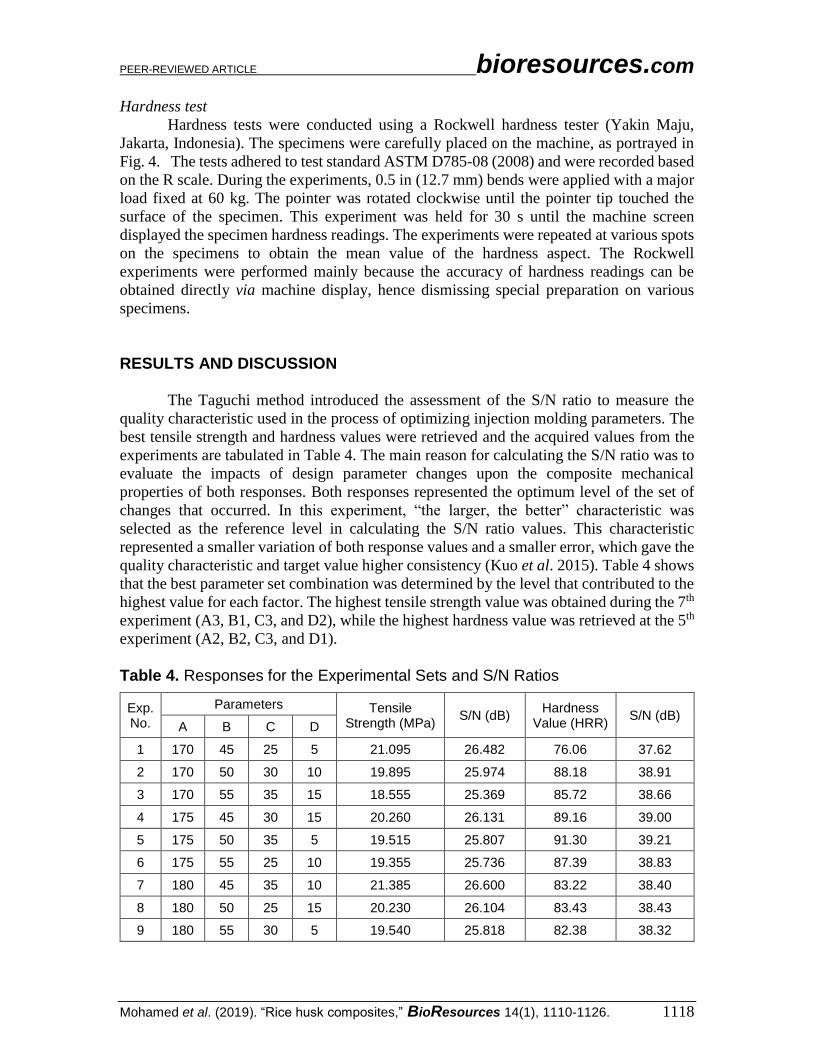
RESULTS AND DISCUSSION
The Taguchi method introduced the assessment of the S/N ratio to measure the
quality characteristic used in the process of optimizing injection molding parameters. The
best tensile strength and hardness values were retrieved and the acquired values from the
experiments are tabulated in Table 4. The main reason for calculating the S/N ratio was to
evaluate the impacts of design parameter changes upon the composite mechanical
properties of both responses. Both responses represented the optimum level of the set of
changes that occurred. In this experiment, “the larger, the better” characteristic was
selected as the reference level in calculating the S/N ratio values. This characteristic
represented a smaller variation of both response values and a smaller error, which gave the
quality characteristic and target value higher consistency (Kuo et al. 2015). Table 4 shows
that the best parameter set combination was determined by the level that contributed to the
highest value for each factor. The highest tensile strength value was obtained during the 7th
experiment (A3, B1, C3, and D2), while the highest hardness value was retrieved at the 5th
experiment (A2, B2, C3, and D1).
Table 4. Responses for the Experimental Sets and S/N Ratios
Exp. No.
Parameters Tensile Strength (MPa)
S/N (dB) Hardness
Value (HRR) S/N (dB)
A B C D
1 170 45 25 5 21.095 26.482 76.06 37.62
2 170 50 30 10 19.895 25.974 88.18 38.91
3 170 55 35 15 18.555 25.369 85.72 38.66
4 175 45 30 15 20.260 26.131 89.16 39.00
5 175 50 35 5 19.515 25.807 91.30 39.21
6 175 55 25 10 19.355 25.736 87.39 38.83
7 180 45 35 10 21.385 26.600 83.22 38.40
8 180 50 25 15 20.230 26.104 83.43 38.43
9 180 55 30 5 19.540 25.818 82.38 38.32

PEER-REVIEWED ARTICLE bioresources.com
Mohamed et al. (2019). “Rice husk composites,” BioResources 14(1), 1110-1126. 1119
In general, the GRA is applied to measure the correlation level between sequences
through the GRG value. Based on the GRA application with the Taguchi method, the
optimization of various reaction characteristics was converted to single feature
optimization, in which the GRG was considered an objective function (Puh et al. 2016).
Tables 5 and 6 present the steps of pre-processing raw data towards normalizing S/N ratios
using Eqs. 1 and 3. This pre-processing stage was performed to prevent the effects of varied
unit (non-dimension) uses, as well as to minimize the aspect of variability due to the diverse
factors that had been considered (Raghuraman et al. 2013).
Table 5. Data Pre-processing for Normalized S/N Ratio Values
Exp. No. Tensile Strength (TS) Hardness Value (HRR)
Reference sequence 1 1
1 0.897527 0
2 0.473498 0.795275
3 0 0.633530
4 0.602473 0.859251
5 0.339223 1
6 0.282686 0.743438
7 1 0.469816
8 0.591873 0.483267
9 0.348057 0.414370
Table 6. Deviation Sequence
Deviation Sequences ΔTS ΔHRR
Exp. No. 1 0.102473 1
Exp. No. 2 0.526502 0.204742
Exp. No. 3 1 0.366469
Exp. No. 4 0.397527 0.140748
Exp. No. 5 0.660777 0
Exp. No. 6 0.717314 0.256561
Exp. No. 7 0 0.530183
Exp. No. 8 0.408127 0.516732
Exp. No. 9 0.651943 0.585629
Based on the normalized experimental data, the GRC was calculated using Eq. 3.
This was performed to select “the larger, the better” category that reflected the correlation
between the desired test data and the actual data. Next, the GRG was calculated using Eq.
4, which refers to the average corresponding to each feature performance. Hence, a
combination of optimal process parameters was rated based on the highest GRG via the
Taguchi method. Both the GRC and GRG values are displayed in Table 7. The values that
exceeded the GRG represented stronger levels of correlations between the referral and
given sequences. The referral sequence was the best process response obtained from the
experimental arrangement. The highest GRG value was obtained at the 7th sequence of the

PEER-REVIEWED ARTICLE bioresources.com
Mohamed et al. (2019). “Rice husk composites,” BioResources 14(1), 1110-1126. 1120
experiment, which signified that the experiment sequence at this level was closer to the
desired optimum value. In contrast, the optimum parameters were determined based on the
GRG presented in Table 8. This study revealed that injection pressure, followed by melting
temperature, injection speed, and cooling time had the most substantial impacts on tensile
strength and hardness. Overall, these experiments suggested that the optimization of
multiple reaction processes can be converted into a single coefficient optimization.
Table 7. GRC and GRG Values
Exp. No. GRC
GRG Rank TS HRR
1 0.829912 0.333333 0.58162 5
2 0.487091 0.709497 0.59829 4
3 0.333333 0.577054 0.45519 8
4 0.557087 0.780337 0.66871 3
5 0.430746 1 0.71537 2
6 0.41074 0.660884 0.53581 6
7 1 0.485350 0.74268 1
8 0.550584 0.491771 0.52118 7
9 0.434049 0.460562 0.44731 9
Table 8. Responses for GRG
Parameters L1 L2 L3 Main Effect Rank
A 0.5450 0.6400 0.5704 0.0949 2
B 0.6643 0.6116 0.4794 0.1849 1
C 0.5462 0.5714 0.6377 0.0915 3
D 0.5814 0.6256 0.5484 0.0772 4
Table 9 summarizes the outcomes obtained from the ANOVA analysis. The
ANOVA analysis determined the parameters that gave the most substantial impact on the
performance characteristic. The injection pressure exhibited the highest percentage of
contribution (59.59%), followed by the melting temperature (15.87%), injection speed
(14.68%), and lastly the cooling time (9.86%). Based on the combination of the Taguchi-
Grey method, the optimal parameters identified were the melting temperature at 2nd level,
injection pressure at 1st level, injection speed at 3rd level, and cooling time at 2nd level, as
showcased in Fig. 5.
Table 9. ANOVA for Responses
Parameter DOF SS MS % of Contribution
A 2 0.0145 0.0072 15.87
B 2 0.0544 0.0272 59.59
C 2 0.0134 0.0067 14.68
D 2 0.0090 0.0045 9.86
Error 0 0 0
Total 8 0.0914 0.0457

PEER-REVIEWED ARTICLE bioresources.com
Mohamed et al. (2019). “Rice husk composites,” BioResources 14(1), 1110-1126. 1121
(a)
(b)
(c)
(d)
Fig. 5. Control factor of GRG response values for: a) melting temperature, b) injection pressure, c) injection speed, and d) cooling time

PEER-REVIEWED ARTICLE bioresources.com
Mohamed et al. (2019). “Rice husk composites,” BioResources 14(1), 1110-1126. 1122
Studies have investigated the formation of core structures in injection molding
products. Mechanical properties reflect the mechanical structure of a product resulting
from the effects controlled by molecular orientation, free volume, chemical nature, and
molecular weight. During the injection process, the outer layer of the product structure is
exposed to high pressure, tensile stress, and a substantial cooling rate, which affects various
structural core morphologies that constitute the mechanical properties of the product.
Meanwhile, the outer core structure is influenced by the melting temperature and injection
pressure (Kuzmanović et al. 2016). Increments in temperature during this process further
reduce molecular orientation, which causes a decrease in both the strain and enthalpy of
cold crystallization. When the injection pressure reaches a certain point, the density of the
product drastically increases, which results in low porosity and a more compacted structure
(Hu 2016).
It is important for the specified parameter value for the injection speed to be
adequate. The molten material should completely fill the cavity, both rapidly and
efficiently, to hinder glitches while removing the component from the mold (Raos and
Stojsic 2014). In contrast to the listed effects, low injection speed results in larger
temperature variations between the parts near the gate and those at a further distance. This
happens because the molten material starts to cool while the mold is still being filled
(Kuram et al. 2014). Cold molten material has higher viscosity and demands higher
injection pressure to generate a good quality product. Consequently, the strength of the
product’s properties increases when the molecular movement is increased.
The semicrystalline polymers are composed of multi-layer configurations (e.g.,
skin-core), mainly due to the presence of high-pressure fields and cooling rates imposed
during the processing stages. The crystallized polymer generates a typical configuration
layer that consists of an amorphous and oriented fiber dispersion in the skin layer, an
intermediate shear crystallized layer, and an internal amorphous core (O'Dowd et al. 2006).
The diversity of these structural layers signifies the importance of crystallization due to the
shear stress that occurs during the injection process (Liparoti et al. 2017). In conclusion,
the composite polymer morphology highly relied on the rate of cooling time and shear
stress imposed during the processing stages because the cooling rate has a notable influence
on the crystallinity (Suplicz et al. 2013).
CONCLUSIONS
In this study, the Grey relational analysis (GRA), which served as the multi-criteria
optimization technique, was applied to optimize the injection molding parameters to exert
an effect on the mechanical properties of natural fiber composites. Conclusions are as
follows:
1. The combination of GRA based on the response table derived from the Taguchi method
successfully assessed the feasibility of each process parameter in injection molding
towards the mechanical properties of RH composites.
2. The multiple responses performance characteristic was converted to an optimization of
a single performance characteristic from the stance of the correlations between melting
temperature, injection pressure, injection speed, and cooling time to obtain enhanced
outcomes for the tensile strength and hardness properties.

PEER-REVIEWED ARTICLE bioresources.com
Mohamed et al. (2019). “Rice husk composites,” BioResources 14(1), 1110-1126. 1123
3. The optimal combination revealed that the injection pressure generated the highest
percentage of the most affected parameter for injection molding process (59.6%), while
melting temperature gave 15.9%, injection speed was 14.7%, and cooling time was
9.9%.
ACKNOWLEDGMENTS
The present work is supported by research grant UPM/700-2/1/GP-
IPS/2017/9538700 and the Ministry of Higher Education.
REFERENCES CITED
Ali, M. A. M., Idayu, N., Izamshah, R., Kasim, M. S., Salleh, M. S., and Sivarao. (2018).
"Multi objective optimization of injection moulding process parameters on
mechanical properties using Taguchi method and grey relational analysis,"
International Journal of Engineering & Technology 7(3.7), 14-16. DOI:
10.14419/ijet.v7i3.7.16196.
Arjmandi, R., Hassan, A., and Zakaria, Z. (2017). “Rice husk and kenaf fiber reinforced
polypropylene biocomposites,” in: Lignocellulosic Fibre and Biomass-Based
Composite Materials, M. Jawaid (ed.), Woodhead Publishing Ltd., Cambridge, UK,
77-94. DOI: 10.1016/B978-0-08-100959-8.00005-6
ASTM D638-03 (2004). “Standard test method for tensile properties of plastics,” ASTM
International, West Conshohocken, PA.
ASTM D785-08 (2008). “Standard test method for Rockwell hardness of plastics and
electrical insulating materials,” ASTM International, West Conshohocken, PA.
Borůvka, V., Zeidler, A., and Holeček, T. (2015). “Comparison of stiffness and strength
properties of untreated and heat-treated wood of Douglas fir and alder,” BioResources
10(4), 8281-8294. DOI: 10.15376/biores.10.4.8281-8294
Dar, U. A., Xu, Y. J., Zakir, S. M., and Saeed, M. U. (2017). “The effect of injection
molding process parameters on mechanical and fracture behavior of polycarbonate
polymer,” Journal of Applied Polymer Science 134(7), Article ID 44474. DOI:
10.1002/app.44474
Gaaz, T. S., Sulong, A. B., Kadhum, A. A. H., Nassir, M. H., and Al-Amiery, A. A.
(2016). “Optimizing injection molding parameters of different halloysites type-
reinforced thermoplastic polyurethane nanocomposites via Taguchi complemented
with ANOVA,” Materials 9(11), 947-966. DOI: 10.3390/ma9110947
Graupner, N., Ziegmann, G., Wilde, F., Beckmann, F., and Müssig, J. (2016).
“Procedural influences on compression and injection moulded cellulose fibre-
reinforced polylactide (PLA) composites: Influence of fibre loading, fibre length,
fibre orientation and voids,” Composites Part A: Applied Science and
Manufacturing 81, 158-171. DOI: 10.1016/j.compositesa.2015.10.040
Ho, M. P., Wang, H., Lee, J. H., Ho, C. K., Lau, K. T., Leng, J., and Hui, D. (2012).
“Critical factors on manufacturing processes of natural fibre composites,” Composites
Part B: Engineering 43(8), 3549-3562. DOI: 10.1016/j.compositesb.2011.10.001

PEER-REVIEWED ARTICLE bioresources.com
Mohamed et al. (2019). “Rice husk composites,” BioResources 14(1), 1110-1126. 1124
Hu, Z. (2016). “Injection parameters optimization and artificial aging of automotive die
cast aluminum alloy,” Materials and Manufacturing Processes 31(6), 787-793. DOI:
10.1080/10426914.2015.1004706
Ibrahim, M. H. I., Zainol, M. Z., Othman, M. H., Amin, A. M., Asmawi, R., and Sa'ude,
N. (2014). “Optimisation of processing condition using Taguchi method on strength
of HDPE-natural fibres micro composite,” Applied Mechanics and Materials 660, 33-
37. DOI: 10.4028/www.scientific.net/AMM.660.33
Karna, S. K., and Sahai, R. (2012). “An overview on Taguchi method,” International
Journal of Engineering and Mathematical Sciences 1(1), 1-7.
Kc, B., Faruk, O., Agnelli, J. A. M., Leao, A. L., Tjong, J., and Sain, M. (2016). “Sisal-
glass fiber hybrid biocomposite: Optimization of injection molding parameters using
Taguchi method for reducing shrinkage,” Composites Part A: Applied Science and
Manufacturing 83, 152-159. DOI: 10.1016/j.compositesa.2015.10.034
Kumar, R., Kumar, K., and Bhowmik, S. (2014). “Optimization of mechanical properties
of epoxy based wood dust reinforced green composite using Taguchi method,”
Procedia Materials Science 5, 688-696. DOI: 10.1016/j.mspro.2014.07.316
Kuo, C. F. J., Lan, W. L., Chen, C. Y., and Tsai, H. C. (2015). “Property modification
and process parameter optimization design of polylactic acid composite materials.
Part I: Polylactic acid toughening and photo-degradation modification and optimized
parameter design,” Textile Research Journal 85(1), 13-25. DOI:
10.1177/0040517514540766
Kuram, E., Timur, G., Ozcelik, B., and Yilmaz, F. (2014). “Influences of injection
conditions on strength properties of recycled and virgin PBT/PC/ABS,” Materials
and Manufacturing Processes 29(10), 1260-1268. DOI:
10.1080/10426914.2014.941481
Kuzmanović, M., Delva, L., Cardon, L., and Ragaert, K. (2016). “The effect of injection
molding temperature on the morphology and mechanical properties of PP/PET blends
and microfibrillar composites,” Polymers 8(10), 355-371 DOI:
10.3390/polym8100355
Lal, S. K., and Vasudevan, H. (2013). “Optimization of injection moulding process
parameters in the moulding of low density polyethylene (LDPE),” International
Journal of Engineering Research and Development 7(5), 35-39.
Lau, K. T., Hung, P. Y., Zhu, M. H. and Hui, D. (2018). “Properties of natural fibre
composites for structural engineering applications,” Composites Part B: Engineering
136, 222-233. DOI: 10.1016/j.compositesb.2017.10.038
Liparoti, S., Speranza, V., Sorrentino, A., and Titomanlio, G. (2017). “Mechanical
properties distribution within polypropylene injection molded samples: Effect of
mold temperature under uneven thermal conditions,” Polymers 9(11), 585-602. DOI:
10.3390/polym9110585
Madurwar, M. V., Ralegaonkar, R. V., and Mandavgane, S. A. (2013). “Application of
agro-waste for sustainable construction materials: A review,” Construction and
Building Materials 38, 872-878. DOI: 10.1016/j.conbuildmat.2012.09.011
Mitra, A. C., Jawarkar, M., Soni, T., and Kiranchand, G. R. (2016). “Implementation of
Taguchi method for robust suspension design,” Procedia Engineering 144, 77-84.
DOI: 10.1016/j.proeng.2016.05.009
Muthuraj, R., Misra, M., Defersha, F., and Mohanty, A. K. (2016). “Influence of
processing parameters on the impact strength of biocomposites: A statistical

PEER-REVIEWED ARTICLE bioresources.com
Mohamed et al. (2019). “Rice husk composites,” BioResources 14(1), 1110-1126. 1125
approach,” Composites Part A: Applied Science and Manufacturing 83, 120-129.
DOI: 10.1016/j.compositesa.2015.09.003
O'Dowd, F., Levesque, M., and Gilchrist, M. D. (2006). “Analysis of fibre orientation
effects on injection moulded components,” Proceedings of the Institution of
Mechanical Engineers, Part B: Journal of Engineering Manufacture 220(12), 1909-
1921. DOI: 10.1243/09544054JEM332
Prayogo, G. S., and Lusi, N. (2016). “Application of Taguchi technique coupled with
grey relational analysis for multiple performance characteristics optimization of EDM
parameters on ST 42 steel,” in: AIP Conference Proceedings 1725(1), 020061(1)-
020061(7). DOI: 10.1063/1.4945515
Puh, F., Jurkovic, Z., Perinic, M., Brezocnik, M., and Buljan, S. (2016). “Optimization of
machining parameters for turning operation with multiple quality characteristics using
Grey relational analysis,” Tehnički Vjesnik 23(2), 377-382. DOI: 10.17559/TV-
20150526131717
Radhwan, H., Mustaffa, M. T., Annuar, A. F., Azmi, H., Zakaria, M. Z., and Khalil, A.
N. M. (2015). “An optimization of shrinkage in injection molding parts by using
Taguchi method,” Journal of Advanced Research in Applied Mechanics 10(1), 1-8.
Raghuraman, S., Thiruppathi, K., Panneerselvam, T., and Santosh, S. (2013).
“Optimization of EDM parameters using Taguchi method and Grey relational
analysis for mild steel IS 2026,” International Journal of Innovative Research in
Science, Engineering and Technology 2(7), 3095-3104.
Raju, B. S., Sekhar, U. C., and Drakshayani, D. N. (2017). “Grey relational analysis
coupled with principal component analysis for optimization of stereolithography
process to enhance part quality,” in: IOP Conference Series: Materials Science and
Engineering 225(1), 012228(1)-012228(13).
Raos, P., and Stojsic, J. (2014). “Influence of injection moulding parameters on tensile
strength of injection moulded part,” Journal of Manufacturing and Industrial
Engineering 13(3-4), 1-3. DOI: 10.12776/mie.v13i3-4.412
Razavykia, A., Yusof, N. M., and Yavari, M. R. (2015). “Determining the effects of
machining parameters and modifier on surface roughness in dry turning of Al-20%
Mg2Si-PMMC using design of experiments (DOE),” Procedia Manufacturing 2, 280-
285. DOI: 10.1016/j.promfg.2015.07.049
Sanjay, M. R., Madhu, P., Jawaid, M., Senthamaraikannan, P., Senthil, S., and Pradeep,
S. (2018). “Characterization and properties of natural fiber polymer composites: A
comprehensive review,” Journal of Cleaner Production 172, 566-581. DOI:
10.1016/j.jclepro.2017.10.101
Shivapragash, B., Chandrasekaran, K., Parthasarathy, C., and Samuel, M. (2013).
“Multiple response optimizations in drilling using Taguchi and Grey relational
analysis,” International Journal of Modern Engineering Research 3(2), 765-768.
DOI: 10.1.1.300.5681
Sufiyanto, S. (2017). “Optimization of injection molding parameters using the Taguchi
method to maximize biocomposite material tensile strength,” Journal Teknik
Mesin 7(2), 81-87.
Sreenivasulu, R., and Rao, C. S. (2012). “Application of Grey relational analysis for
surface roughness and roundness error in drilling of Al 6061 alloy,” International
Journal of Lean Thinking 3(2), 67-78.

PEER-REVIEWED ARTICLE bioresources.com
Mohamed et al. (2019). “Rice husk composites,” BioResources 14(1), 1110-1126. 1126
Sreenivasulu, R., and Rao, C. S. (2013). “Design of experiments based Grey relational
analysis in various machining processes – A review,” Research Journal of
Engineering Sciences 2(1), 9472(21)-9472(26).
Suplicz, A., Szabo, F., and Kovacs, J. G. (2013). “Injection molding of ceramic filled
polypropylene: The effect of thermal conductivity and cooling rate on
crystallinity,” Thermochimica Acta 574, 145-150. DOI: 10.1016/j.tca.2013.10.005
Vignesh, K., Ramasivam, G., Natarajan, U., and Srinivasan, C. (2016). “Optimization of
process parameters to enhance the mechanical properties of bone powder and coir
fiber reinforced polyester composites by Taguchi method,” APRN Journal of
Engineering and Applied Sciences 11(2), 1224-1231.
Article submitted: October 5, 2018; Peer review completed: November 26, 2018; Revised
version received and accepted: November 27, 2018; Published: December 13, 2018.
DOI: 10.15376/biores.14.1.1110-1126