![The starred publications are in Peer-reviewed Congress ... · The starred publications are in Peer-reviewed Congress Proceedings, the others are in Peer- Reviewed Journals 2018 [178]](https://static.fdocuments.us/doc/165x107/5ead514d568d9a70b57151ef/the-starred-publications-are-in-peer-reviewed-congress-the-starred-publications.jpg)
PEER-REVIEWED ARTICLE bioresources€¦ · PEER-REVIEWED ARTICLE bioresources.com Daragon et al....
18
PEER-REVIEWED ARTICLE bioresources.com Daragon et al. (2014). “Recovery agroindustrial vinasse” BioResources 9(4), 7764-7781. 7764 Recovery of an Agro-industrial Vinasse by Adsorption on Different Wood Materials: Parametric Study at Laboratory Scale Guillaume Daragon, Gwenaëlle Trouvé,* Cornelius Schönnenbeck, and Gontrand Leyssens Three types of biomasses (miscanthus, spruce, and a mixture of different woodchips species) were tested as low-cost adsorption media for an industrial agro-industrial effluent, typically a vinasse. Influences of effluent dilution, working temperature, and time duration were studied. Kinetic modelling studies of adsorption were proposed. Ratios of adsorption at ambient temperature and without dilution expressed in g of dry vinasse per g of dry biomass were 1.0, 0.85, and 0.65 for miscanthus, woodchips mixture, and spruce, respectively. An increase of the temperature from 10 °C to 50 °C led to a decrease of the vinasse viscosity and favored its penetration in the biomasses. Maximal adsorbance of dry matter of vinasse was obtained at 50 °C for a vinasse viscosity of 20 mPas. Whatever the experimental conditions required during adsorption processes, miscanthus showed the best affinity for the vinasse. Pseudo-second order and intra-particle diffusion model well described the adsorption process. This study indicates that conventional biomasses could be used as natural low-cost adsorbent for by-products such as vinasse. Keywords: Adsorption; Biomass; By-product; Vinasse; Kinetic studies Contact information: Laboratoire Gestion des Risques et Environnement, Institut de Recherche J.B. Donnet, 3 bis, rue A. Werner 68093 Mulhouse, France, *Corresponding author: [email protected] INTRODUCTION Since several years back, clever management of energy and resources has been implemented on a massive scale. One of the most important points concerns water utilization, and this will remain the most serious challenge for future generations. Therefore, research for clean, safe, and economically feasible technologies for wastewater treatment have reached a prominent place in order to reduce impacts of human activity on the environment. Wastewater treatment plants have been improved and designed to treat a range of effluents from different origins (domestic or industrial). However, some of them are more complex fluids, such as organic effluents from food, agro, or textile industries for instance. These effluents typically have high chemical oxygen demand (COD) values, high organic load (amino-acids, polyphenols, tannins, fatty acids, etc.), and may also contain toxic components and severe pollutants such as heavy metals. These chemical and physical properties disallow direct discharge into natural media since they may cause strong (even irreversible) damage to the environment, such as the eutrophication of rivers if ejected into aquatic media or soil denaturing if spread on the fields. Adsorption on activated carbon is a current technology that can be used to remove pollutants from wastewater. This technique is very interesting because of the high efficiency of the material and its huge specific surface area (Hubbe et al. 2014). Heavy metal removal is widely documented in the literature (Mohan and Pittman 2006; Rao et al.
Transcript of PEER-REVIEWED ARTICLE bioresources€¦ · PEER-REVIEWED ARTICLE bioresources.com Daragon et al....

PEER-REVIEWED ARTICLE bioresources.com
Daragon et al. (2014). “Recovery agroindustrial vinasse” BioResources 9(4), 7764-7781. 7764
Recovery of an Agro-industrial Vinasse by Adsorption on Different Wood Materials: Parametric Study at Laboratory Scale
Guillaume Daragon, Gwenaëlle Trouvé,* Cornelius Schönnenbeck, and
Gontrand Leyssens
Three types of biomasses (miscanthus, spruce, and a mixture of different woodchips species) were tested as low-cost adsorption media for an industrial agro-industrial effluent, typically a vinasse. Influences of effluent dilution, working temperature, and time duration were studied. Kinetic modelling studies of adsorption were proposed. Ratios of adsorption at ambient temperature and without dilution expressed in g of dry vinasse per g of dry biomass were 1.0, 0.85, and 0.65 for miscanthus, woodchips mixture, and spruce, respectively. An increase of the temperature from 10 °C to 50 °C led to a decrease of the vinasse viscosity and favored its penetration in the biomasses. Maximal adsorbance of dry matter of vinasse was obtained at 50 °C for a vinasse viscosity of 20 mPas. Whatever the experimental conditions required during adsorption processes, miscanthus showed the best affinity for the vinasse. Pseudo-second order and intra-particle diffusion model well described the adsorption process. This study indicates that conventional biomasses could be used as natural low-cost adsorbent for by-products such as vinasse.
Keywords: Adsorption; Biomass; By-product; Vinasse; Kinetic studies
Contact information: Laboratoire Gestion des Risques et Environnement, Institut de Recherche J.B.
Donnet, 3 bis, rue A. Werner 68093 Mulhouse, France, *Corresponding author: [email protected]
INTRODUCTION
Since several years back, clever management of energy and resources has been
implemented on a massive scale. One of the most important points concerns water
utilization, and this will remain the most serious challenge for future generations.
Therefore, research for clean, safe, and economically feasible technologies for wastewater
treatment have reached a prominent place in order to reduce impacts of human activity on
the environment. Wastewater treatment plants have been improved and designed to treat a
range of effluents from different origins (domestic or industrial). However, some of them
are more complex fluids, such as organic effluents from food, agro, or textile industries for
instance. These effluents typically have high chemical oxygen demand (COD) values, high
organic load (amino-acids, polyphenols, tannins, fatty acids, etc.), and may also contain
toxic components and severe pollutants such as heavy metals. These chemical and physical
properties disallow direct discharge into natural media since they may cause strong (even
irreversible) damage to the environment, such as the eutrophication of rivers if ejected into
aquatic media or soil denaturing if spread on the fields.
Adsorption on activated carbon is a current technology that can be used to remove
pollutants from wastewater. This technique is very interesting because of the high
efficiency of the material and its huge specific surface area (Hubbe et al. 2014). Heavy
metal removal is widely documented in the literature (Mohan and Pittman 2006; Rao et al.

PEER-REVIEWED ARTICLE bioresources.com
Daragon et al. (2014). “Recovery agroindustrial vinasse” BioResources 9(4), 7764-7781. 7765
2006; Hubbe et al. 2011). However, the use of activated carbon still remains relatively
expensive, and steps of support regeneration are needed after several cycles of adsorption
to recover the initial capacity. Thus, many authors have focused their attention on new
types of adsorbents based on biomass and other kinds of low-cost supports such as sludge,
clay, fly ash, and chitosan materials (Babel and Kurniawan 2003; Shin et al. 2007; Naiya
et al. 2009; Quasim and Mane 2013; Aziz et al. 2014). In recent years, many authors have
focused their attention on using biomass for effluent treatment. Indeed those materials such
as wood, sawdust, bark, straw, or even sludge are widely available and cost-effective. Due
to their good adsorption properties, they are considered an interesting adsorption support
alternative (Yu et al. 2003; Grini 2005; Aziz et al. 2014). For example, biomasses like
sawdust, woodchips, bark, straw, and leaves also present good adsorption properties for
many pollutants such as fluoride (Yadav et al. 2013) or heavy metals such as chromium
(Yu et al. 2003), lead (Reddy et al. 2010; Gundogdu et al. 2009), and even arsenic and
mercury (Sud et al. 2008). Others have studied adsorption for far more complex
compounds like dyes from textile and leather industries on peanut husks or on sawdust
(Kausik et al. 2009; Noreen et al. 2013), dyes such as methylene-blue from the paper
industry on different agricultural wastes, clays, and zeolites, or even pesticides on
sugarcane, bagasse fly ash, and rice husk (Akhtar et al. 2007; Rafatullah et al. 2010). Since
biomass is cheap, widely available, renewable, and often a byproduct itself (from
agriculture or wood industry), it is considered a promising alternative (Nguyen et al. 2013).
Agro-food industrial processes lead to large amounts of by-product as vinasse
(Carrocci et al. 2012; Christofoletti et al. 2013). Vinasse is generally used as an additive
for animal feed because it contains a large fraction of organics (proteins, pectins,
polyphenols, and colored compounds) and as a fertilizer because its mineral composition
is rich in NPK elements. Recently its demand may be limited in such potential applications
by strict environmental restrictions. Vinasse is an acid by-product with high COD (30-60
g L-1) containing a large fraction of organics as proteins, pectins, polyphenols, and
melanoïdins (Caqueret et al. 2008). Therefore, there has recently been an increase of
interest in recovering valuable components from distillery vinasse.
By-product effluents as vinasses are mostly adsorbed onto activated carbons
(Caqueret et al. 2008) or by initial clarification by gravity followed by secondary treatment
with activated sludge (Vaccari et al. 2005; Yang and Li 2013). The main objective of this
work was to study the natural adsorbent capacities of three different biomasses by
adsorption as low cost adsorbents with a vinasse (organic by-product from sugar industry
with high COD), without any biomass chemical pre-treatment, in order to recover the dry
matter parts for energy recovery. The amount of dry matter taken from vinasse was
followed by simple ratio calculations. Different adsorption conditions were tested in order
to reach the highest adsorption yields of organic matter possible. The study of adsorption
equilibrium and kinetics is essential to supply the basic information required for the design
of an adsorption process.
EXPERIMENTS
Materials Two wood samples (spruce and wood chips) and one energetic crop (miscanthus)
were chosen for this study. Spruce (Spc) was manufactured by AGRIVALOR SA
(Bergheim, France) and represented wood from the Alsatian forest. Forest chips of
miscanthus (Msc) were harvested and sieved around the south of Alsace in the village of
Ammertzwiller. Wood chips are produced from European forests and are a mixture (Mix)

PEER-REVIEWED ARTICLE bioresources.com
Daragon et al. (2014). “Recovery agroindustrial vinasse” BioResources 9(4), 7764-7781. 7766
of different woods with spruce representing 70% of the total mass. The 30% left is
composed of fir, pine, oak, and beech, of which the different proportions depend on the
countries of Europe where the trees were harvested. As shown in Fig. 1, Mix and Spc
based materials are woodchip byproducts from the sawmill industry. Raw Msc is a grass
sold as straw.
Fig. 1. Biomass external aspects (A: Msc, B: Spc, C: Mix)
Physical and chemical characterizations of the different samples were performed
through the ultimate analyses as well as apparent porosity and bulk densities, relative
moisture, and ash contents. The ultimate analyses of samples were carried out by the
SOCOR laboratory (Dechy, France) to determine carbon, hydrogen, oxygen, nitrogen,
chlorine, and sulfur weight fractions. Ash content had been established using a muffle
furnace at two different temperatures according the NF-EN-14775 norm. Two protocols
were compared; in the first one samples were heated at 550 °C for 2 h (with a burning stage
at 250 °C for 1 h), and in the second protocol they were heated at 815 °C for 3 h. Water
contents were determined after drying biomass samples at 105 °C according to the NF-EN-
14774 norm. Bulk densities were determined using a beaker whose mass and volume were
precisely known and filled with uncompressed biomass.
In this study, the industrial agro-effluent was a vinasse obtained from the final phase
of alcohol fermentation, characteristic of the agro-food industry. It was used as received,
and it contained 57% by weight of dry matter. A known volume weighing had been done
in order to determine its density. The dynamic viscosity µ was measured using a falling-
sphere viscometer.
Adsorption Protocol Adsorption experiments on raw materials (as received) as shown in Fig. 1 were
performed, and adsorption ratios were obtained with relatively high standard deviations,
mainly due to both variation of humidity during different storage conditions and various
particle sizes. Size distribution was determined first. In order to study the influence of
particle size on adsorption ratios, based materials were calibrated using different sieves
with particle diameters (d) ranging from less than 1 mm to over 20 mm. The influence of
parameters on adsorption ratios as dilution ratio, temperature, and step duration were only
evaluated for size fractions of 4 to 9 mm in order to increase the accuracy of the protocol.

PEER-REVIEWED ARTICLE bioresources.com
Daragon et al. (2014). “Recovery agroindustrial vinasse” BioResources 9(4), 7764-7781. 7767
Based materials were ground and sieved to meet the size range of 4 to 9 mm and then dried
in an oven at 105 °C. Kinetic modelling was also studied for this size fraction. 10 g of each
dry sample (8 g for Msc) were each put in 80 mL of vinasse in 100 mL beakers for 2 h;
they then were drained for 2 h to finally be dried at 105 °C in an oven for 24 h. Results
given in the parametric study are the mean of at least three experiments. The bars in the
following figures represent the standard deviations.
Calculations of Adsorption Ratios Two different adsorption ratios Rdm
[vns/bio(i)] and Rdm[vns/bio(f)] were calculated
according the following equations (Eqs. 1 and 2),
Rdm
[vns bio(i)⁄ ]=
(mbio
[Ads,Drn, Dry]-m
bio
[Dry])
mbio
[Dry] (1)
Rdm
[vns bio(f)⁄ ]=
(mbio
[Ads,Drn, Dry]-m
bio
[Dry])
mbio
[Ads,Drn,Dry] (2)
Where mbio[Dry]
is the mass of dry biomass (mbio) before adsorption (g), mbio[Ads,Drn] is the
mass of the biomass after adsorption and draining, mbio[Ads,Drn,Dry] is the mass of the biomass
after adsorption, draining, and drying processes. The difference given in the following Eq.
3 represents the mass of dry matter of vinasse mdm[Ads]adsorbed on dry biomass:
mdm
[Ads]=(m
bio
[Ads,Drn,Dry]-mbio
[Dry]) (3)
Rdm[vns/bio(i)] (g vinasse dry/ g initial biomass dry) indicates the dry matter part of the
vinasse adsorbed on the dry biomass support. Rdm[vns/bio(f)] (g vinasse dry/ g final dry
biomass after adsorption) represents the part of dried matter of vinasse adsorbed on the dry
mixture (dry vinasse + dry biomass) after adsorption. Measurement of the bulk density was
done using a beaker whose mass and volume were known and then filled with
uncompressed biomass. The dynamic viscosity µ was measured using a falling-sphere
viscometer.
RESULTS AND DISCUSSION Physical and Chemical Properties of Biomass Types
Table 1 shows both the chemical characteristics and the particle size distributions
of biomasses. Particles in the size ranges of over 20 mm and 20 to 2.5 mm constituted the
main part of the total mass for Mix, Msc, and Spc with proportions ranging from 95% to
98%.

PEER-REVIEWED ARTICLE bioresources.com
Daragon et al. (2014). “Recovery agroindustrial vinasse” BioResources 9(4), 7764-7781. 7768
Table 1. Physical and Chemical Characteristics of Biomasses Msc Mix Spc Vinasse
Chemical characteristicsa
C (%)a 48.70 49.94 50.50 41.65
H (%)a 5.89 6.06 5.97 4.30
O (%)a 43.67 45.35 42.22 33.19
N (%)a < 0.30 < 0.10 < 0.30 3.92
S (%)a 0.12 < 0.3 0.06 0.26
Cl (%)a 0.16 < 0.0005 0.09 0.44
P (ppm)a 345 nd < 200 2900
Ca (ppm)a 6 700 nd 6 200 14 000
K (ppm)a 3 300 nd 1 600 87 100
Mg (ppm)a 450 nd 920 1 140
Na (ppm)a 82 nd 156 35 700
Atomic O/C ratio 0.67 0.68 0.63 0.60
Atomic H/C ratio 1.45 1.45 1.42 1.24
COD (mg L-1 O2)b -- -- -- 520 000
Organic Carbon (g kg-1 DM)c
-- -- -- 325
Particle size distributions
D >20 mm 0.2 10.0 11.9 --
20 mm >D >9 mm 39.4 47.8 66.9 --
9 mm >D> 6 mm 38.1 19.9 11.7 --
6 mm >D >4 mm 11.4 10.9 5.1 --
4 mm >D >3.15 mm 5.4 3.5 2.4 --
3.15 mm >D >2.5 mm 0.1 2.5 0.3 --
2.5 mm >D >2 mm 0.3 1.6 0.3 --
2 mm >D >1.6 mm 0.8 1.6 0.5 --
1.6 mm >D >1.25 mm 1.0 0.9 0.3 --
1.25 mm >D >1 mm 0.2 0.4 0.1 --
D <1 mm 3.1 1.6 0.5 --
a: on dry basis; b: standard NFT-90-101; c: standard NF ISO 14235; n.d.: not determined
Compared with literature data concerning wood biomass, energy crops, and
agricultural by-products (corn, rice straw, and shell), these materials were found to have
typical compositions (Senneca et al. 2007; Jeguirim et al. 2010; Verma et al. 2012). Weight
fractions of the different elements (C, H, O, N, and S) samples were in the same order of
magnitude as those reported for conventional lignocellulosic materials (Johansson et al.
2005). The elemental analysis of the studied vinasse was close to those of distillery and
olive mill oil extraction effluents in terms of COD and the amount of organic carbon
(España-Gamboa et al. 2011; Chouchene et al. 2012). With O/C and H/C atomic ratio
values at 0.60 and 1.24, respectively, this vinasse can be classified as biomass according to
the Van Krevelen diagram (Senneca 2007; Koppejan and Van Loo 2008). These ratio values
are very close to those of the three lignocellulosic materials (Msc, Mix, and Spc) used as
adsorption support.
However, chlorine content in the vinasse appeared to be high and would enhance
the amount of this element in the mixture after adsorption. Table 2 gives physical
properties.

PEER-REVIEWED ARTICLE bioresources.com
Daragon et al. (2014). “Recovery agroindustrial vinasse” BioResources 9(4), 7764-7781. 7769
Table 2. Physical Characteristics of Biomass Types Msc Mix Spc Vinasse
pH -- -- -- 7.2
density -- -- -- 1.25
b (kg.m-3)a 116 148 286 --
a 44 n.d 52 --
µ (mPa.s) at 20°C -- -- -- 60.6
Moisture (%)a 10 39 44 43
Ash at 550°C (%)a 1.40 0.6 0.12 16.50
Ash at 815°C (%)a 1.24 0.4 0.15 10.20
a: on raw basis; n. d.: not determined
Msc presented the lowest humidity content related to its fine structure of straw.
Humidity contents for Mix and Spc were very close to those of biomass in district heat
production facilities. The vinasse presented ash content very close to those of distillery
effluents found in literature (Robertiello 1982; España-Gamboa et al. 2011, Christofoletti
et al. 2013). Calcination at different temperatures did not significantly influence the ash
content for Msc, Mix, and Spc. The vinasse presented high ash content whatever the
temperature of calcination, and there was a significant difference between calcination at
550 °C and 815 °C. This was probably due to two phenomenons: organic compounds still
remained at 550 °C, and/or an increase of temperature to 815 °C could have involved the
devolatilization of some mineral fractions, such as sodium and potassium combined with
chlorine and sulphur under their chloride and sulphate salts.
Wood densities are generally relatively variable even for the same wood
species depending on wood origin, cutting period, and tree age. Indeed, densities could
even be different within the same trunk, depending on which part of the wood is
analyzed, whether sapwood (beneath the bark) or heartwood (also called duramen). Despite
that, the results were close to those found in other publications. Densities of beech and
spruce were close to those of wood chips (550 kg m-3) and wood pellets (693 kg m-3)
(Senneca et al. 2007; Verma et al. 2012). Concerning dry silage miscanthus, its density was
close to 0.12 g cm-3 in agreement with the literature (Lewandowski et al. 1995; Lisowski
et al. 2011). Value of the density of liquid vinasse (1250 kg m-3) is slightly higher than
those found for other agro-food effluents with values varying in the range 1010 to 1060 kg
m-3 (Robertiello 1982).
Parametric Study of the Adsorption Process Influence of biomass particle size
The influence of biomass particle size was studied under standard conditions
(adsorption time 2 h and draining time 2 h) at room temperature (20 °C). Adsorption of
biomasses was done on different distribution sizes representing the main part of the
biomass mass from 20 mm to 3.15 mm. Fractions below 3.15 mm represented less than 8%
of the total mass. A high relative standard deviation was observed for the biggest particle
size of miscanthus (>20 mm). This size fraction only consisted of 0.2% of the total mass
(i.e., Table 1), and the value of Rdm[vns/bio(f)] was not included in Fig. 2.

PEER-REVIEWED ARTICLE bioresources.com
Daragon et al. (2014). “Recovery agroindustrial vinasse” BioResources 9(4), 7764-7781. 7770
Fig. 2. Influence of the size distribution on Rdm[vns/bio(f)]
Regarding standard deviations, one tendency appeared to indicate an influence of
the size particles on adsorption ratios, particularly between 3.15 and 9 mm. These results
confirm that the smaller the chip is, the better the dry matter adsorption is. Values of linear
correlation ratios R2 are 0.9923, 0.9083, and 0.8918 for Spc, Mix, and Msc, respectively.
Influence of effluent dilution
Dilution could theoretically lead to better circulation and penetration within the
chips and water could act as an adsorption vector for big molecules of the vinasse. Effluent
was diluted at 20 °C from 0 (raw) to 80 % (vol/vol) with demineralized water. The
influence of the dilution of the vinasse was performed in the standard conditions with an
adsorption time of 2 h and a draining time of 2 h at 20 °C. Results of Rdm[vns/bio(i)] and
Rdm[vns/bio(f)] are presented in Fig. 3.
(a)
y = -0.0218x + 0.6783R² = 0.8918
y = -0.018x + 0.5849R² = 0.9083
y = -0.0279x + 0.6708R² = 0.9923
0
0.1
0.2
0.3
0.4
0.5
0.6
0.7
3.15>S>2.5 4>S>3.15 6>S>4 9>S>6 20>S>9 S>20
Rd
m[v
ns/b
io(f
)] (
g o
f d
ry v
ns/
g o
f d
ry a
ds
orb
ed
bio
mas
s)
Size distribution (mm)
Msc Mix Spc
y = 0.0352x + 0.0882R² = 0.985
y = 0.0294x + 0.1118R² = 0.9952
y = 0.0226x + 0.1475R² = 0.9699
0
0.2
0.4
0.6
0.8
1
1.2
80%70%60%50%40%30%20%10%0%
Rd
m[v
ns/b
io(i
)](g
VN
Sd
ry/g
bio
mass d
ry)
Proportion of dilution
Msc Mix Spc
PEER-REVIEWED ARTICLE bioresources.com
Daragon et al. (2014). “Recovery agroindustrial vinasse” BioResources 9(4), 7764-7781. 7771
(b)
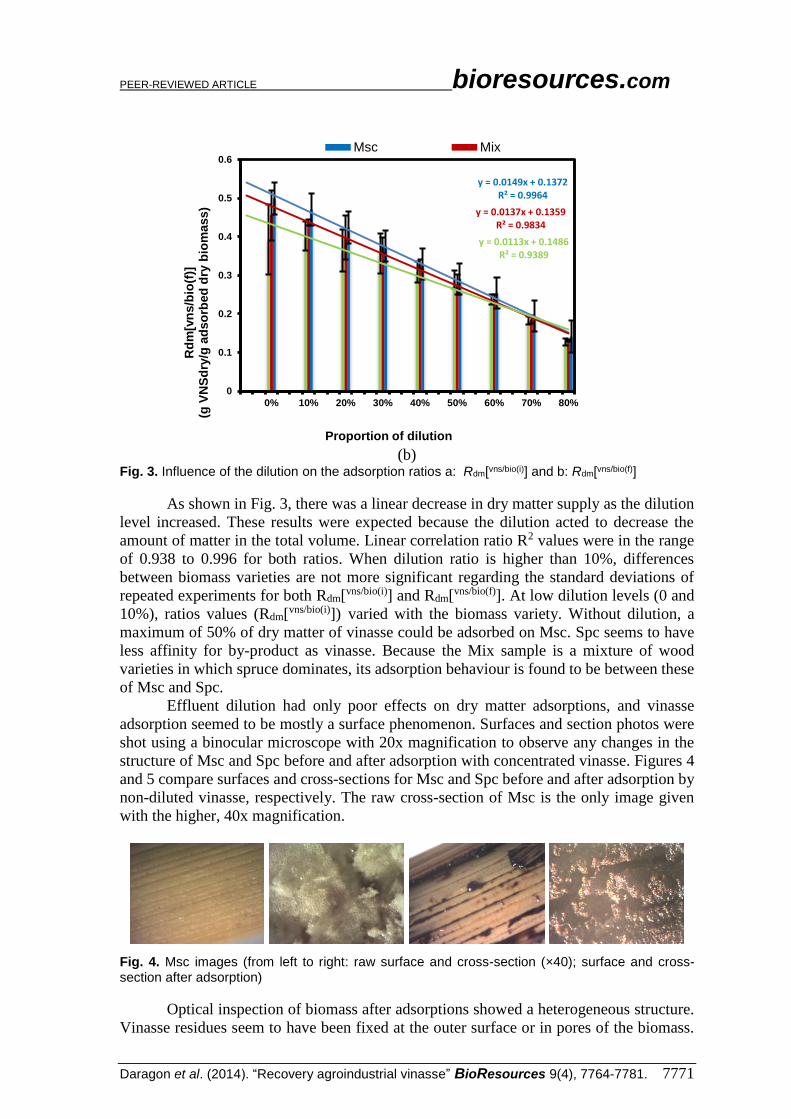
Fig. 3. Influence of the dilution on the adsorption ratios a: Rdm[vns/bio(i)] and b: Rdm[vns/bio(f)]
As shown in Fig. 3, there was a linear decrease in dry matter supply as the dilution
level increased. These results were expected because the dilution acted to decrease the
amount of matter in the total volume. Linear correlation ratio R2 values were in the range
of 0.938 to 0.996 for both ratios. When dilution ratio is higher than 10%, differences
between biomass varieties are not more significant regarding the standard deviations of
repeated experiments for both Rdm[vns/bio(i)] and Rdm[vns/bio(f)]. At low dilution levels (0 and
10%), ratios values (Rdm[vns/bio(i)]) varied with the biomass variety. Without dilution, a
maximum of 50% of dry matter of vinasse could be adsorbed on Msc. Spc seems to have
less affinity for by-product as vinasse. Because the Mix sample is a mixture of wood
varieties in which spruce dominates, its adsorption behaviour is found to be between these
of Msc and Spc.
Effluent dilution had only poor effects on dry matter adsorptions, and vinasse
adsorption seemed to be mostly a surface phenomenon. Surfaces and section photos were
shot using a binocular microscope with 20x magnification to observe any changes in the
structure of Msc and Spc before and after adsorption with concentrated vinasse. Figures 4
and 5 compare surfaces and cross-sections for Msc and Spc before and after adsorption by
non-diluted vinasse, respectively. The raw cross-section of Msc is the only image given
with the higher, 40x magnification.
Fig. 4. Msc images (from left to right: raw surface and cross-section (×40); surface and cross-section after adsorption)
Optical inspection of biomass after adsorptions showed a heterogeneous structure.
Vinasse residues seem to have been fixed at the outer surface or in pores of the biomass.
y = 0.0149x + 0.1372R² = 0.9964
y = 0.0137x + 0.1359R² = 0.9834
y = 0.0113x + 0.1486R² = 0.9389
0
0.1
0.2
0.3
0.4
0.5
0.6
80%70%60%50%40%30%20%10%0%
Rd
m[v
ns/b
io(f
)](g
VN
Sd
ry/g
ad
so
rbed
dry
bio
mass)
Proportion of dilution
Msc Mix

PEER-REVIEWED ARTICLE bioresources.com
Daragon et al. (2014). “Recovery agroindustrial vinasse” BioResources 9(4), 7764-7781. 7772
The cross-section of Msc was well defined by a honeycomb-shaped internal structure that
allowed good penetration of the vinasse compared to the external surface where it was
mainly in the grooves.
Fig. 5. Spc images (from left to right: raw surface and cross-section; surface and cross-section after adsorption)
The adsorption phenomenon was found to be quite different for spruce. Adsorption
of vinasse was favoured on the wood surface. With a higher bulk density for Spc than Msc,
penetration was limited via the cross-section for Spc. Msc reached the highest values of
adsorption ratios due to its widely porous and honeycomb-shaped internal structure.
Influence of working temperature
The influence of temperature was evaluated with non-diluted vinasse under the
standard conditions (adsorption time of 2 h and draining time of 2 h). An increasing
working temperature should decrease the vinasse viscosity and may favor the increase of
dry matter ratio in the biomass. Adsorptions of this effluent on biomasses were tested in
the temperature range 10 °C to 80 °C. Figure 6 shows the evolution of Rdm[vns/bio(i)] and
Rdm[vns/bio(f)] versus temperature during the adsorption process.
(a)
0.0
0.2
0.4
0.6
0.8
1.0
1.2
1.4
1.6
1.8
10 22 30 40 50 60 70 80
Rd
m[v
ns/b
io(i
)]
(g V
NS
dry
/g d
ry b
iom
ass)
Temperature (°C)
Msc Mix Spc

PEER-REVIEWED ARTICLE bioresources.com
Daragon et al. (2014). “Recovery agroindustrial vinasse” BioResources 9(4), 7764-7781. 7773
(b)
Fig. 6. Influence of the temperature on adsorption ratios (a: Rdm[vns/bio(i)] and b: Rdm[vns/bio(f)])
Adsorption ratios of the dry matter part of the vinasse are shown in Fig. 6. From 10
°C to 50 °C, there was a slight increase for dry matter adsorption with the increase of
temperature, mainly for Msc and Spc. The enhancement in adsorption for temperatures
between 10 °C and 50 °C could be due to the decrease of the viscosity of the vinasse of 80
mPas at 10 °C to 20 mPas at 50 °C. This could increase the mass transfer in the boundary
layer of the adsorbate. Moreover, this may also be a result of an increase in the mobility of
the vinasse and then in an increase of intra-particle diffusion of sorbate with the rise of
temperature. At higher temperatures, the total quantity adsorbed is not temperature
dependent. This is in accordance with the mechanism of physical adsorbance – at higher
temperatures adsorbance decreases (exothermic reaction). Meanwhile, changes of viscosity
at temperatures over 50 °C were small (viscosity versus temperature follows a negative
exponential law), and then the global adsorption efficiency was stable for this temperature
range. Adsorption ratios are compared for both temperatures 10 °C and 50 °C in Table 3
and yields are calculated. Yield is defined by the ratio of Rdm (50 °C)/Rdm (10 °C).
Table 3. Comparison of Ratios Rdm[vns/bio(i)] and Rdm[vns/bio(f)] at 10 °C and 50 °C Msc Mix Spc
Rdm[vns/bio(i)] (mg g-1) at 10 °C
730 670 580
Rdm[vns/bio(i)] (mg g-1) at 50 °C
1500 1080 1110
Yield 2.0 1.6 1.9
Rdm[vns/bio(f)] (mg g-1) at 10 °C
430 410 380
Rdm[vns/bio(f)] (mg g-1) at 50 °C
590 510 520
Yield 1.4 1.2 1.4
0.35
0.45
0.55
0.65
10 22 30 40 50 60 70 80
Rd
m [
vn
s/b
io(f
)](g
VN
S d
ry/
g a
dso
rbed
dry
bio
mass)
Temperature (°C)
Msc Mix Spc

PEER-REVIEWED ARTICLE bioresources.com
Daragon et al. (2014). “Recovery agroindustrial vinasse” BioResources 9(4), 7764-7781. 7774
An increase in temperature from 10 °C to 50 °C had a positive effect on ratios and
was particularly significant for biomass as Msc and Spc. Yields for both ratios presented
the same values for Msc and Spc. Samples containing several types of biomass species as
Mix (30% of the total mass were not known) gave lower yield values. This fact pointed out
the main influence of the 30% of unknown species in the Mix woodchips.
Adsorption Kinetic Modelling Studies Experimental data were recorded at room temperature (20 °C) with the variation of
the adsorption time from 0.5 h to 16 h. Draining time was standardized at 2 h, and after the
adsorption process samples were dried in an oven at 105 °C for 24 h. Kinetic studies are
essential here because they reveal the uptake rate of adsorbate, which controls the residual
time for the entire adsorption process (Demirbas 2008).
Adsorption can be described by different models. The Lagergren’s pseudo first
order, the pseudo second order, and the intraparticle diffusion models were used to describe
the adsorption mechanism of vinasse on the three biomass supports. Kinetic data in the
following Figs. 7 to 9 represent the mean values of at least three experiments.
The first order adsorption kinetics as Lagergren’s law is described by the following
equation (Eq. 4):
dqt
dt= k1(qe − qt) (4)
This can be integrated for the boundary conditions t= 0 to t= t and qt= 0 to qt= qe with qt
equal to the adsorbed quantity at t and qe the maximum adsorbed quantity in mg g-1 of dry
biomass. Equation 3 may then be arranged for linearized data plotting as shown by Eq. 5:
log(qe − qt) = log(qe) −k1
2.303t (5)
Linear Lagergren fits are plotted in Fig. 7. In our case, qt and qe are represented by
Rdm[vns/bio(i)]
t and Rdm[vns/bio(i)]
eq, respectively. Correlation coefficient values were between
0.6437 and 0.9598, indicating that this pseudo-first order rate expression could not properly
fit the experimental data, particularly for Msc. Equation 5 can also be arranged to simulate
the adsorption extent qt at different times with the following equation (Eq. 6):
qt = qe − 10(log(qe)−k1
2.303t)
(6)
When tracing the experimental and modeled adsorption (see Fig.7), it can be seen that the
overall adsorption process for longer times is reasonable, whereas the prediction quality
for small times is poor. It seems then that the initial adsorption velocity is fast and slows
down afterwards.

PEER-REVIEWED ARTICLE bioresources.com
Daragon et al. (2014). “Recovery agroindustrial vinasse” BioResources 9(4), 7764-7781. 7775
(a)
(b)
Fig. 7. Lagergren pseudo-first order model (a: experimental Eq. 5; b: modelled Eq. 6)
Second order kinetic is described by the following equation (7):
dqt
dt=k2(q
e-q
t)
2 (7)
Integration for the boundary conditions t= 0 to t= t and qt= 0 to qt= qe leads to Eq. 8:
1
qe-qt
=1
qe
+k2t (8)
Equation 8 may then be arranged for linearized data plotting as shown by Eq. 9:
t
qt
=t
qe
+1
k2qe2 (9)
y = -0.1865x + 2.8757R² = 0.9598
y = -0.2008x + 2.6354R² = 0.8847
y = -0.0971x + 2.6135R² = 0.6437
0.0
0.5
1.0
1.5
2.0
2.5
3.0
3.5
0 2 4 6 8 10log
(R
dm
eq
[vn
s/b
io(i
)-R
dm
t[vn
s/b
io(i
)])
Time (h)
Msc Mix Spc
0
200
400
600
800
1000
1200
1400
0 2 4 6 8 10 12 14 16 18
Rd
mt[
vn
s/b
io(i
)](m
g/g
)
Time (h)
Msc Msc_th Mix Mix_th Spc Spc_th

PEER-REVIEWED ARTICLE bioresources.com
Daragon et al. (2014). “Recovery agroindustrial vinasse” BioResources 9(4), 7764-7781. 7776
To calculate adsorbance as a function of time, Eq. 8 can be arranged as Eq. 10:
qt= q
e-
1
1qe
⁄ +k2t (10)
In our case, qt and qe are represented by Rdm[vns/bio(i)]
t and Rdm[vns/bio(i)]
eq, respectively.
Pseudo second order kinetics fit are given in Fig. 8.
(a)
(b)
Fig. 8. Pseudo-second order model (a: experimental Eq. 8; b: modelled Eq. 9)
The values of the coefficients of determination obtained for these fits were between
0.9967 and 0.9995, indicating that the pseudo-second order rate expression could properly
fit the experimental data. This model assumes that the rate-limiting step may be described
by complex interactions between sorbent and sorbate. As described in the Hubbe et al.
reviews, adsorption mechanisms introduce large possibilities of correlations to functional
groups of the sorbent (Hubbe et al. 2012, 2014). Our data shows then the same tendency
observed by Ho and McKay (Ho and McKay 1999): pseudo first-order kinetics in the first
20 min tends to show higher sorption rates than are observed afterwards and fits the whole
dataset well, whatever the time. This suggests that the presented sorption system could not
be properly described by first-order kinetics and that pseudo-second order kinetics should
be used. A main advantage of this model is that the equilibrium capacity and the initial
y = 0.0009x + 0.0005R² = 0.9981
y = 0.001x + 0.0002R² = 0.9995
y = 0.0011x + 0.0005R² = 0.9967
0
0.002
0.004
0.006
0.008
0.01
0.012
0.014
0.016
0.018
0.02
0 5 10 15 20
t/R
dm
[vn
s/b
io(i
)]
(h.g
.mg
-1)
Time (h)
MSC Mix SPC
0
200
400
600
800
1000
1200
1400
0 5 10 15 20
Rd
m[v
ns
/bio
(i)]
(m
g/g
)
Time (h)
Msc Msc_th Mix Mix_th Spc Spc_th

PEER-REVIEWED ARTICLE bioresources.com
Daragon et al. (2014). “Recovery agroindustrial vinasse” BioResources 9(4), 7764-7781. 7777
sorption rate can be obtained from the model (Ho 2006). The sorption capacity may be
proportional to the number of active sites occupied by the sorbent (Ho and Chiang 2001).
Comparable results have been obtained by Atun and Sismanoglu (1996). In contrast to Ho,
they used two pseudo first-order reaction steps and explained that the sorption was mainly
controlled by either film diffusion or intra-particle diffusion.
The plotting of experimental data allows for the determination of k2, Rdm[vns//bio(i)]
eq,
and half reaction time. Values are given in Table 4.
Table 4. Kinetic Parameters of Pseudo-second Order Model Msc Mix Spc
R2 0.9981 0.9995 0.9967
Rdm[vns/bio(i)]
eq (mg.g-1)
1175 956 908
k2 1.45E-03 4.97E-03 2.30E-03
Half reaction time (h) 0.585 0.210 0.479
If kinetic data are well-documented in the literature, they mainly concern organic
molecules such as dyes, polyphenols, or heavy metal removals on various biomass
supports. Modelling of wastewater adsorption was studied by Figaro but on activated
carbon, a well-known adsorbent (Figaro et al. 2006; Figaro et al. 2009). Though
experimental data obtained under the same conditions as this study are not found in the
literature for comparison, the kinetic constant k2 and the half reaction time in Table 4 are
in the same order of magnitude of the values for the adsorption of molasses wastewaters
after anaerobic digestion and melanoidin on activated carbon at pH= 7 (a pH very close to
that of vinasse) (Figaro et al. 2009). As previously observed during the experiments, Msc
presents the maximal adsorption capacity compared to woodchips of Mix and Spc.
The intra-particle model described by Weber and Morris was also tested (Weber
and Morris 1962). The rate limiting steps of the adsorption, i.e., either external mass
transfer (film diffusion), intra-particle diffusion (pore diffusion), or both principally control
the process, and the same can be predicted by diffusion coefficients calculated from a
diffusion model. The linear form of the Morris-Weber equation (Eq. 11) can confirm the
presence or absence of intra-particle diffusion,
qt=kid*t
12⁄ +C (11)
where qt (mg g-1) is the dry matter of vinasse uptake amount at time t (min), kid is the intra-
particle diffusion rate constant (mg g-1 min-1/2), and C is the constant indicating the
thickness of the boundary layer. The plot of qt versus t1/2 shows multi-linearity indicating
three steps that take place:
Step 1 is the sharper portion taking place at the beginning of adsorption (t1/2
lower than 0.5) and may be attributed to the diffusion of the adsorbate in the
boundary layer (external diffusion);
Step 2 describes the intra-particle diffusion taking place between 0.5 and
2.5 h1/2; and
Step 3 is attributed to the final equilibrium stage for which saturation takes
place for longer times and where the intra-particle diffusion is rate limited.

PEER-REVIEWED ARTICLE bioresources.com
Daragon et al. (2014). “Recovery agroindustrial vinasse” BioResources 9(4), 7764-7781. 7778
In this study, qt was assumed to be Rdm[vns/bio(i)]. The coefficient kid can be
determined from the slope and C from the intercept of the plot of qt versus t1/2 as shown in
Fig. 9.
Fig. 9. Intra-particle diffusion model
Coefficient of determination values for Step 2 were 0.92, 0.98, and 0.98 for Mix,
Msc, and Spc, respectively. This indicates that the model could reasonably fit the
experimental data with the presence of intra-particle diffusion of the vinasse in wood chips
as Mix and Msc. The correlation for Step 3 was not calculated due to the small number of
experiments in that range. On the contrary, for Spc, Step 3 was not observed. In the time
range 0.25 h to 16 h, a dependency of the observed rate on intra-particle diffusion of vinasse
was still evident.
CONCLUSIONS
1. These studies at laboratory scale made it possible to distinguish what parameters
influence vinasse adsorption on biomass. Effluent dilution had only weak effects
on dry matter adsorption, and vinasse adsorption seemed to be mostly a surface
phenomenon.
2. The best results were obtained when the biomass surface was considered. These
studies also highlighted the different adsorption capacities according to the used
wood material, closely linked to biomass structure, available macro-porosity, and
surface roughness. Due to its fine and honeycomb-shaped structure, Msc straw was
judged to be the best support.
3. Heating the vinasse significantly reduces its viscosity and improves the portion of
dry matter of vinasse in dry biomass. The maximal mass transfer in the boundary
layer of the adsorbate is obtained for a temperature of 50 °C for a vinasse viscosity
of 20 mPas.
4. The pseudo second order kinetic model fit well with the experimental data. Between
0.25 h and 4 h, the intra-particle diffusion of the vinasse was shown to account for
y = 222.88x + 494.04R² = 0.9802
y = 187.21x + 557.51R² = 0.9284
y = 83.926x + 569.1R² = 0.9818
0
200
400
600
800
1000
1200
0 1 2 3 4 5
Rd
mt[
vn
s/b
io(i
)] (
mg
/g)
t1/2
MSC Mix Spc
Step 2 Step 3Step 1

PEER-REVIEWED ARTICLE bioresources.com
Daragon et al. (2014). “Recovery agroindustrial vinasse” BioResources 9(4), 7764-7781. 7779
the rate of adsorption for all wood samples. The external diffusion in the solution
was the limiting phenomenon for times below 0.25 h, while saturation was observed
for two wood samples (Msc and Mix) at times exceeding 4 h. A pseudo first order
kinetic model was able to describe adsorption phenomena for long interaction times
but failed for short times ranging from 0.5 h to 4 h.
REFERENCES CITED
Akhtar, M., Hasany, S. M., Bhanger, M. I., and Iqbal, S. (2007). “Low cost sorbents for
the removal of methyl parathion pesticide from aqueous solutions,” Chemosphere 66,
1829-1838. DOI: 10.1016/j.chemosphere.2006.09.006 Atun, G., and Sismanoglu, T. (1996). “Adsorption of 4,4’ ‐iso propylidene diphenol and
diphenylolpropane 4,4’ dioxyaceticacid from aqueous solution on kaolinite,” Journal
of Environmental Science and Health Part A: Environmental Science and
Engineering and Toxicology 31, 2055-2069. DOI: 10.1080/10934529609376474
Aziz, A. S. A., Manaf, L. A., Man, H. C., and Kumar, N. S. (2014). “Kinetic modeling
and isotherm studies for copper (II) adsorption onto palm oil boiler mill fly ash
(POFA) as natural low-cost adsorbent,” BioResources 9 (1), 336-356.
Babel, S., and Kurniawan, T. A. (2003). “Low-cost adsorbents for heavy metals uptake
from contaminated water: A review,” Hazardous Materials 97, 219-243. DOI:
10.1016/S0304-3894(02)00263-7
Caqueret, V., Bostyn, S., Cagnon, B., and Fauduet, H. (2008). “Purification of sugar beet
vinasse. Adsorption of polyphenolic and dark compounds on different commercial
activated carbons,” Bioresource Technology 99, 5814-5821. DOI:
10.1016/j.biortech.2007.10.009 Carrocci, J. S., Mori, R. Y., Cobra Guimaraes, O. L., dos Santos Salazar, R. F., de
Oliveira, M. F., de Castro Peixoto, A. L., and Izario, H. J. (2012). “Application of
heterogenous catalysis with TiO2 photo irradied by sunlight and later activated
sludge system for the reduction of vinasse organic load,” Engineering 4, 746-760.
DOI: 10.4236/eng.2012.411096
Chouchene, A., Jeguirim, M., Favre-Reguillon, A., Trouvé, G., Le Buzit, G., Khiari, B.,
and Zagrouba, F. (2012). “Energetic valorisation of olive mill wastewater
impregnated on low cost absorbent: sawdust versus olive solid waste,” Energy 39,
74-81. DOI: 10.1016/j.energy.2011.03.044
Christofoletti, C. A., Escher, J. P., Correia, J. E., Urbano Marhino, J. F., and Fontanetti,
C. S. (2013). “Surgarcane vinasse: Environmental implications of its use,” Waste
Management 33, 2752-2761. DOI: 10.1016/j.wasman.2013.09.005
Demirbas, A. (2008). “Heavy metal adsorption onto agro-based waste materials: A
review,” Journal of Hazardous Materials 157 (2-3), 220-229. DOI:
10.1016/j.jhazmat.2008.01.024
España-Gamboa, E., Mijangos-Cortes, J., Barahona-Perez, L., Dominguez-Maldonado,
J., Hernández-Zarate, G., and Alzate-Gaviria, L. (2011). “Vinasses: Characterization
and treatments,” Waste Management and Resource 29, 1235-50. DOI:
10.1177/0734242X10387313
Figaro, S., Louisy-Louis, S., Lambert, J., Ehrhardt, J. J., Ouesanga, A., and Gaspard, S.
(2006). “Adsorption studies of recalcitrant compounds of molasses spentwash on
activated carbons,” Water Research 40, 3456-3466. DOI:
10.1016/j.watres.2006.07.037

PEER-REVIEWED ARTICLE bioresources.com
Daragon et al. (2014). “Recovery agroindustrial vinasse” BioResources 9(4), 7764-7781. 7780
Figaro, S., Avril, J. P., Brouers, F., Ouensanga, A., and Gaspard, S. (2009). “Adsorption
studies of molasses wasters on activated carbons: Modelling with a new fractal
kinetic equation and evaluation of kinetic models,” Journal of Hazardous Materials
161, 649-656. DOI: 10.1016/j.jhazmat.2008.04.006
Gundogdu, A., Ozdes, D., Duran, C., Bulut, V. N., Soylak, M., and Senturk, H. B.
(2009). “Biosorption of Pb(II) ions from aqueous solution by pine bark (Pinus brutia
Ten.),” Chemical Engineering Journal 153, 62-69. DOI: 10.1016/j.cej.2009.06.017
Ho, Y. S. and Mac Kay G. (1999), “Pseudo-second order model for sorption processes”,
Process Biochemistry 34, 451-465. DOI: 10.1016/S0032-9592(98)00112-5
Ho, Y. S. and Chiang, C.C. (2001). “Sorption studies of acid dyes by mixed sorbents”.
Adsorption 7, 139-147. DOI: 10.1023/A:1011652224816
Ho, Y. S. (2006) “Review of second-order models for adsorption sytems” Journal of
Hazardous Materials 136, 681-689. DOI: 10.1016/j.jhazmat.2005.12.043 Hubbe, M. A., Hasan, S. H., and Ducoste, J. J. (2011). "Cellulosic substrates for removal
of pollutants from aqueous systems: A review. 1. Metals," BioResources 6(2), 2161-
2287.
Hubbe, M. A., Beck, K. R., O'Neal, W. G., and Sharma, Y. C. (2012). "Cellulosic
substrates for removal of pollutants from aqueous systems: A review. Part 2. Dye,"
BioResources 7(2), 2592-2687.
Hubbe, M. A., Park, J., and Park, S. (2014). "Cellulosic substrates for removal of
pollutants from aqueous systems: A review. Part 4. Dissolved petrochemical
compounds," BioResources 9(4), 1-144.
Jeguirim, M., Dorge, S., and Trouvé, G. (2010). “Thermogravimetric analysis and
emission characteristics of two energy crops in air atmosphere: Arundo donax and
Miscanthus giganthus,” Bioresource Technology 101, 788-793. DOI:
10.1016/j.biortech.2009.05.063
Johansson, L. S., Tullin, C., Leckner, B., and Sjövall, P. (2005). “Particle emissions from
biomass combustion in small combustors,” Biomass and Bioenergy 25, 435-446.
DOI: 10.1016/S0961-9534(03)00036-9
Koppejan, J., and Van Loo S. (2008). The Handbook of Biomass Combustion and Co-
firing, Earthscan, London.
Lewandowski, I., Kirchenert, A., and Vonie, P. (1995). “CO2-balance for the cultivation
and combustion of miscanthus,” Biomass and Bioenergy 8, 81-90. DOI:
10.1016/0961-9534(95)00008-U
Lisowski, A., Swietochowski, A., Szulc, K., and Lenart, A. (2011). “Density and
porosity of the cut and ground material of energy plants,” Agricultural Forest and
Engineering 58, 21-28.
Mohan, D., and Pittman Jr., C. U. (2006). “Activated carbons and low cost adsorbents for
remediation of tri- and hexavalent chromium from water,” Hazardous Materials 137,
762-811. DOI: 10.1016/j.jhazmat.2006.06.060 Naiya, T. K., Chowdhury, P., Bhattacharya, A. K., and Das, S. K. (2009). “Saw dust and
neem bark as low-cost natural biosorbent for adsorptive removal of Zn(II) and Cd(II)
ions from aqueous solutions,” Chemical Engineering Journal 148, 68-79. DOI:
10.1016/j.cej.2008.08.002
Nguyen, T. A. H., Ngo, H. H., Guo, W. S., Zhang, J., Liang, S., Yue, Q. Y., Li, Q., and
Nguyen, T. V. (2013). “Applicability of agricultural waste and by-products for
adsorptive removal of heavy metals from wastewater,” Bioresource Technology 148,
574-585. DOI: 10.1016/j.biortech.2013.08.124
Noreen, S., Bhatti, H. N., Nausheen, S., Sadaf, S., and Ashfaq, M. (2013). “Batch and
fixed bed adsorption study for the removal of Drimarine Black CL-B dye from

PEER-REVIEWED ARTICLE bioresources.com
Daragon et al. (2014). “Recovery agroindustrial vinasse” BioResources 9(4), 7764-7781. 7781
aqueous solution using a lignocellulosic waste: A cost affective adsorbent,”
Industrial Crops and Products 50, 568-579. DOI: 10.1016/j.ind.crop.2013.07.065
Qasim, W., and Mane A. V. (2013). “Characterization and treatment of selected food
industrial effluents by coagulation and adsorption techniques,” Water Resources and
Industry 4, 1-12. DOI: 10.1016/j.wri.2013.09.005
Rao, M. M., Ramesh, A., Rao, G. P.C., and Szshaiah, K. (2006). “Removal of copper and
cadmium from the aqueous solutions by activated carbon derived from Ceiba
Pentandra hulls,” Journal of Hazardous Materials 129(1-3), 123-129. DOI:
10.1016/j.jhazmat.2005.08.018
Reddy, D. H. K., Seshaiah, K., Reddy, A. V. R., Rao, M. M., and Wang, M. C. (2010)
“Biosorption of Pb2+ from aqueous solutions by Moringa oleifera bark: Equilibrium
and kinetic studies” Hazardous Materials 174, 831-838. DOI:
10.1016/j.jhazmat.2009.09.128
Robertiello, A. (1982). “Updgrading of agricultural and agro-industrial wastes: The
treatment of distillery effluents (vinasses) in Italy,” Agricultural Wastes 4, 387-395.
Senneca, O. (2007). “Kinetics of pyrolysis, combustion and gasification of three biomass
fuels,” Fuel Processing Technology 88, 87-97. DOI: 10.1016/j.fuproc.2006.09.002
Senneca, O., Chirone, R., Salatino, P., and Nappi, L. (2007). “Patterns and kinetics of
pyrolysis of tobacco under inert and oxidative conditions,” Analytical and Applied
Pyrolysis 79, 227-33. DOI: 10.1016/j.jaap.2006.12.011
Shin, E. W., Karthikeyan, K. G., and Tshabalala, M. A. (2007). “Adsorption mechanism
of cadmium on juniper bark and wood,” Bioresource Technology 98, 588-594. DOI:
10.1016/j.biortech.2006.02.024
Sud, D., Mahajan, G., and Kaur, M. P. (2008). “Agricultural waste material as potential
adsorbent for sequestering heavy metal ions from aqueous solutions – A review,”
Bioresource Technology 99, 6017-6027. DOI: 10.1016/j.biortech.2007.11.064
Vaccari, G., Tamburini, E., Sgualdino, G., Urbaniec, K., Klemes, J. (2005). “Overview of
the environmental problems in beet sugar processing: possible solutions”, Journal of
Cleaner Production 13, 499-507. DOI: 10.1016/j.jclepro.2003.09.008
Verma, V. K., Brama, S., Delattin, F., Laha, P., Vandendael, I., Hubin, A., and De
Ruyck, J. (2012). “Agro-pellets for domestic heating boilers: Standard laboratory and
real life performance,” Applied Energy 90, 17-23. DOI:
10.1016/j.apenergy.2010.12.079
Weber, W. J., and Morris, J. C. (1962). Proceedings of the International Conference on
water Pollution Symposium, Pergamon Press, 2, 231-266.
Yadav, A. K., Abbassi, R. Gupta, A., and Dadashzadeh, M. (2013). “Removal of fluoride
from aqueous solution and groundwater by wheat straw, sawdust and activated
bagasse carbon of sugarcane,” Ecological Engineering 52, 211-218.
DOI:10.1016/j.ecoleng.2012.12.069
Yang, H., and Li, S. (2013). “Energy analysis of cassava vinasse treatment,” Process
Safety and Environmental Protection 91, 503-507. DOI: 10.1016/j.psep.2013.01.003
Yu, L. J., Shukla, S. S., Dorris, K. L., Shukla, A., and Margrave, J. (2003) “Adsorption of
chromium from aqueous solutions by maple sawdust,” Hazardous Materials 100, 53-
63. DOI: 10.1016/S0304-3894(03)00008-6
Article submitted: August 18, 2104; Peer review completed: September 14, 2014;
Revisions accepted: October 9, 2014; Published: October 31, 2014.