PEER-REVIEWED ARTICLE bioresources · Chaenomeles sinensis is a deciduous spiny shrub or...
15
PEER-REVIEWED ARTICLE bioresources.com Liu et al. (2020). “FCS pectin characterization,” BioResources 15(1), 854-868. 854 Extraction and Characterization of Pectic Polysaccharides from Chaenomeles sinensis Fruit by Hot Compressed Water Hua-Min Liu, a Ya-Nan Wei, a Yuan-Yuan Yan, a Min Wu, b Guang-Yong Qin, b and Xue-De Wang a, * The effects of extraction conditions on the yield of polysaccharides from the fruit of Chaenomeles sinensis (FCS) using a hot compressed water method were investigated. The results showed that an appropriately high temperature (150 °C) and a moderate extraction time (45 min) at a material to water ratio of 1 to 10 g/mL led to a high yield of alcohol precipitation polysaccharide (PA). The purified polysaccharides (CSP-1, CSP-2, and CSP-3) were successfully obtained using a DEAE-52 chromatographic column. Chemical analysis showed that CSP-2 and CSP-3 were homogenous and exhibited characteristics of esterified pectins, whereas CSP-2 mainly consisted of galacturonic acid (GalA), galactose (Gal), arabinose (Ara), rhamnose (Rha), and mannose (Man) with an average molecular weight of 59.1 kDa. Furthermore, CSP-1 possessed stronger antioxidant ability according to DPPH scavenging and reducing power compared with CSP-2 and CSP-3. However, it was weaker with respect to OH scavenging. The technical data presented in this study could help the industry make use of polysaccharides from FCS as a source of pectin for a range of pharmaceutical, culinary, and cosmetic products. Keywords: Chaenomeles sinensis fruit; Pectic polysaccharide; Hot compressed water; Structure; Antioxidant activities Contact information: a: College of Food Science and Technology, Henan University of Technology, Zhengzhou 450001, China; b: Institute of Physical Science and Engineering, Zhengzhou University, Zhengzhou 450001, China; *Corresponding author: [email protected] INTRODUCTION Chaenomeles sinensis is a deciduous spiny shrub or semi-evergreen tree native to China and widely distributed throughout China, Japan, and Korea. The ripe fruit of Chaenomeles sinensis (FCS) is oval-shaped and golden in color. Its flesh is hard, dry, sour, and astringent due to its high amount of lignin. Thus, the flesh of FCS fruits is seldom consumed fresh but is most often consumed in processed forms (e.g., drinks, jam, jelly, and candy). As a traditional oriental medicine, the crude extracts from FCS can be used to treat sore throat, influenza, anaphylaxis, and diabetes (Kim et al. 2013). Polysaccharides isolated from natural materials have gained attention because they possess antioxidant, antitumor, and anti-cancer activities (Chen and Huang 2018). Pectin is a polysaccharide found in the middle lamella, primary cell, and secondary walls. It is used as a gelling and/or thickening agent in home canning and the food industry. Pectin possesses extensive pharmacological activities. Many attempts have been made to extract its bioactive components such as phenols from FCS (Kim et al. 2013; Fagioli et
Transcript of PEER-REVIEWED ARTICLE bioresources · Chaenomeles sinensis is a deciduous spiny shrub or...

PEER-REVIEWED ARTICLE bioresources.com
Liu et al. (2020). “FCS pectin characterization,” BioResources 15(1), 854-868. 854
Extraction and Characterization of Pectic Polysaccharides from Chaenomeles sinensis Fruit by Hot Compressed Water Hua-Min Liu,a Ya-Nan Wei,a Yuan-Yuan Yan,a Min Wu,b Guang-Yong Qin,b and
Xue-De Wang a,*
The effects of extraction conditions on the yield of polysaccharides from the fruit of Chaenomeles sinensis (FCS) using a hot compressed water method were investigated. The results showed that an appropriately high temperature (150 °C) and a moderate extraction time (45 min) at a
material to water ratio of 1 to 10 g/mL led to a high yield of alcohol precipitation polysaccharide (PA). The purified polysaccharides (CSP-1, CSP-2, and CSP-3) were successfully obtained using a DEAE-52 chromatographic column. Chemical analysis showed that CSP-2 and CSP-3 were homogenous and exhibited characteristics of esterified pectins, whereas CSP-2 mainly consisted of galacturonic acid (GalA), galactose (Gal), arabinose (Ara), rhamnose (Rha), and mannose (Man) with an average molecular weight of 59.1 kDa. Furthermore, CSP-1 possessed stronger antioxidant ability according to DPPH scavenging and reducing power compared with CSP-2 and CSP-3. However, it was weaker with respect to OH scavenging. The technical data presented in this study could help the industry make use of polysaccharides from FCS as a source of pectin for a range of pharmaceutical, culinary, and cosmetic products.
Keywords: Chaenomeles sinensis fruit; Pectic polysaccharide; Hot compressed water; Structure;
Antioxidant activities
Contact information: a: College of Food Science and Technology, Henan University of Technology,
Zhengzhou 450001, China; b: Institute of Physical Science and Engineering, Zhengzhou University,
Zhengzhou 450001, China; *Corresponding author: [email protected]
INTRODUCTION
Chaenomeles sinensis is a deciduous spiny shrub or semi-evergreen tree native to
China and widely distributed throughout China, Japan, and Korea. The ripe fruit of
Chaenomeles sinensis (FCS) is oval-shaped and golden in color. Its flesh is hard, dry,
sour, and astringent due to its high amount of lignin. Thus, the flesh of FCS fruits is
seldom consumed fresh but is most often consumed in processed forms (e.g., drinks, jam,
jelly, and candy). As a traditional oriental medicine, the crude extracts from FCS can be
used to treat sore throat, influenza, anaphylaxis, and diabetes (Kim et al. 2013).
Polysaccharides isolated from natural materials have gained attention because
they possess antioxidant, antitumor, and anti-cancer activities (Chen and Huang 2018).
Pectin is a polysaccharide found in the middle lamella, primary cell, and secondary walls.
It is used as a gelling and/or thickening agent in home canning and the food industry.
Pectin possesses extensive pharmacological activities. Many attempts have been made to
extract its bioactive components such as phenols from FCS (Kim et al. 2013; Fagioli et

PEER-REVIEWED ARTICLE bioresources.com
Liu et al. (2020). “FCS pectin characterization,” BioResources 15(1), 854-868. 855
al. 2019).
The extraction and properties of pectic polysaccharides from FCS remain poorly
investigated. A hot acid method is conventionally used to extract commercial pectin.
However, this method requires a long extraction time, significant amounts of energy and
solvent, and creates environmental pollutants. More efficient and eco-friendly green
extraction methods have been developed, such as ultrasound-assisted or microwave-
assisted extraction, accelerated solvent extraction, hot compressed water extraction,
supercritical fluid extraction, and enzymatic extraction.
The hot compressed water method (HCW), commonly referred to as the
subcritical water extraction, has been used to extract pectin from many materials
(Miyazawa and Funazukuri 2004; Wang et al. 2017). Water under subcritical conditions
remains in a liquid state, but it manifests changes in some physicochemical properties
such as density, polarity, electrical properties, dissociation constant, surface tension,
viscosity, diffusivity, and solvency (Zhao et al. 2013). During the HCW procedure, the
pH of the reaction system is reduced to the range of 3 to 4 due to the release of acetic acid
from O-acetyl groups within the polysaccharides. When the temperature rises, the
dielectric constant of water decreases and so does its polarity (Chen et al. 2010).
Therefore, it is possible to use HCW to extract polar, moderately polar, and nonpolar
substances (Zhao et al. 2013). HCW has been widely used in the extraction of
polysaccharides, glycoside, oil, nutraceuticals, and proteins (Liu et al. 2016).
The object of this study was to investigate the effects of HCW extraction
conditions on the yields of pectic polysaccharides and elucidate their physical properties
and chemical structures. Finally, the antioxidant ability of the polysaccharides was also
assessed in vitro.
EXPERIMENTAL
Materials Ripe FCS was purchased in October from a farm in Tanghe (Nanyang, China).
The fruits were cleaned to remove the seeds and cut into 5 mm slices. The slices were
freeze dried, ground to a fine powder by high speed rotary cutting, and then sifted
through a 0.45 mm mesh screen. The powder was dewaxed with a toluene and ethanol
ratio (2 to 1, volume per volume) in a Soxhlet extraction apparatus for 12 h at 60 °C. The
dewaxed sample was air dried for 24 h and stored in a freezer at -4 °C until use. All
reagents and chemicals were of analytical grade and were commercially purchased unless
otherwise stated.
Methods Extraction and purification of polysaccharides
Polysaccharides were extracted from the powder sample using a previously
reported method (Liu et al. 2016). For a typical run, 20 g of material and 200 mL of
distilled water were added into a 350 mL pressure glass reactor. After the extraction was
completed, the aqueous phase and solid residue (SR) were separated using a vacuum
filtration flask. The filtrate was concentrated to a certain volume under reduced pressure
at 50 °C and precipitated with 4 volumes of ethanol for 12 h at 4 °C. The precipitates
were collected by filtration and washed with 80% ethanol; these precipitates were defined
as polysaccharide A (PA). The ethanol soluble fraction was gathered and concentrated by

PEER-REVIEWED ARTICLE bioresources.com
Liu et al. (2020). “FCS pectin characterization,” BioResources 15(1), 854-868. 856
rotary evaporation at 45 °C and defined as polysaccharide B (PB). Lastly, SR, PA, and PB
were lyophilized for further analysis or dried at 105 °C. The yields were calculated as
follows in Eq. 1,
YP = [WP ÷ Wd (1 – Yw)] × 100 (1)
where YP is the yield of PA, PB, and SR (wt%); WP is the weight of PA, PB, and SR (g); Wd
is the weight of raw material (g); Yw is the moisture content within the raw material
(wt%).
For the purification process, the crude polysaccharides from the process (CSP)
were re-dissolved in distilled water and centrifuged. Then a sevage solution (chloroform:
n-butyl alcohol equals 4 to 1, volume per volume) was added to remove the proteins.
After being decolored by a macroporous resin AB-8, the CSP polysaccharide was
dialyzed, freeze dried, and then purified with a cellulose DEAE-52 column (2.6 by 40
cm) pre-equilibrated with distilled water. Fractions were eluted stepwise with distilled
water, 0.1 mol/L NaCl, and 0.2 mol/L NaCl at a flow rate of 1.1 mL/min, and then
collected for 5 min in each tube using an automatic fraction collector. The polysaccharide
content was determined by the phenol sulfuric acid method at 490 nm, and the elution
curves were plotted. The products of three elution’s were pooled, concentrated, and
dialyzed against running water for 2 days and distilled water for 2 h to remove small
molecular substances (molecular weight 3,500 Da). Finally, the three fractions were
freeze dried and then stored in a desiccator at room temperature for further studies.
Monosaccharide composition analysis
The method determination of monosaccharide compositions by high performance
anion exchange chromatography (Dionex, ICS-3000, Shanghai, China) equipped with an
AS50 auto-sampler and a Carbopac PA-20 column (4 × 250 mm, Dionex) were described
by Wang et al. (2017).
Structural characterization
The homogeneity and molecular weight of the polysaccharide fraction were
determined using gel permeation chromatography (GPC) (Agilent, PLGPC50, Shanghai,
China), matched with a KW 402.5-4F column (300 mm by 4.6 mm by 5 µm, Shodex,
Shanghai, China). Samples (1 mg) were dissolved in 1 mL of distilled water and then
passed through a 0.22 µm filter. For GPC analysis, 10 µL of the solution was injected.
The solution was eluted with distilled water at a flow rate of 0.3 mL/min under a column
temperature of 30 °C. Polyethylene oxide (molecular weights of 25.8, 40.1, and 52.9
kDa) was also analyzed under the same conditions to establish the standard curve. The
molecular weight (Mw) was calculated from the standard curve using Eq. 2,
log Mw = 5.524 - 0.1062 t
R2 = 0.996074 (2)
where Mw is the molecular weight (g/mole), t is the retention time, and R2 is the
coefficient of determination.
The UV spectra were obtained on a T6 UV-Vis spectrophotometer (Puxi, China)
in the range of 200 to 600 nm at room temperature. The Fourier transform infrared (FT-
IR) spectroscopy spectrum was recorded on a WQF-510 FT-IR Microscope (North Points
Rayleigh, Beijing, China) within the frequency range of 450 to 4000 cm-1 using 16 scans

PEER-REVIEWED ARTICLE bioresources.com
Liu et al. (2020). “FCS pectin characterization,” BioResources 15(1), 854-868. 857
recorded at a resolution of 4 cm-1. One mg sample was mixed with 50 mg of KBr powder,
thoroughly ground, and then pressed into a 1 mm pellet. The degree of esterification (DE)
has been determined according to Eq. 3,
DE (%) = [A1745 ÷ (A1745 + A1615)] × 100% (3)
where A1745 and A1615 are the peak area at 1745 cm-1 and 1615 cm-1, respectively.
According to previous research regarding the methylation analysis of acidic
polysaccharides, the carboxyl portion of the molecule should be first reduced and then
methylated (Pettolino et al. 2012). Complete methylation was confirmed by the
disappearance of the OH band (3200 to 3700 cm-1) from the FTIR spectrum. The
methylated product was hydrolyzed, reduced with NaBH4, and then acetylated with acetic
anhydride. Finally, the partially methylated alditol acetates (PMAAs) were analyzed by
an HP 6890 GC-MS system (Agilent, Shanghai, China) fitted with a BPX70 column and
coupled with an HP 5973 MS instrument.
The 1H and 13C nuclear magnetic resonance (NMR) spectra were obtained using a
Bruker Advance 500 MHz NMR spectrometer (III HD, Karlsruhe, Germany).
Homogeneous samples (30 mg) were dissolved in 0.7 mL of D2O with overnight stirring
at room temperature. The NMR spectra were recorded at room temperature.
Antioxidant capacity in vitro
The OH scavenging activity was assessed according to a previous report (Pu et al.
2016) with some modifications. One mL of various concentrations (0.1 to 2 mg/mL) of
the sample or vitamin C (VC) was added successively into isometric ferrous sulfate (6
mM), salicylic acid ethanol (6 mM), and hydrogen peroxide (6 mM). After incubating at
37 °C for 1 h, 4 mL of the reaction mixture was assessed for absorbance at 510 nm. For
the control, the sample was replaced by distilled water. Radical scavenging activity was
determined by the previous method with some modifications (Pu et al. 2016). The
reaction mixture contained 2 mL DPPH solution (0.04 mg/mL in anhydrous ethanol) and
2 mL of various concentrations (0.1 to 2 mg/mL) of the sample or VC. After vigorous
shaking, the solutions were incubated at room temperature in the dark for 30 min and
then tested at 517 nm. For the control, the sample was substituted by distilled water.
For reducing power tests, 0.5 mL of various concentrations (0.1 to 2 mg/mL) of
sample or VC mixed with 1 mL phosphate buffer (0.2 M, pH=6.6), and 1 mL potassium
ferricyanide solution (1%, w/v) were incubated at 50 °C for 20 min. The reactions were
terminated by trichloroacetic acid (10%, w/v), and then solutions were centrifuged for 10
min at 3000 ×g. 1.5 mL of supernatant was mixed with isovolumetric distilled water and
ferric chloride (0.1%, w/v). The absorbance of samples was measured at 700 nm.
Distilled water took the place of samples for the control. The scavenging rate was
calculated according to Eq. 4,
Scavenging rate (%) = (1 – (At ÷ A0)) × 100% (4)
where A0 is the absorbance of the control and A1 is the absorbance of the samples per VC.
RESULTS AND DISCUSSION Effect of Extraction Conditions on Product Yields
The effects of temperature and extraction time on the yield of products are shown

PEER-REVIEWED ARTICLE bioresources.com
Liu et al. (2020). “FCS pectin characterization,” BioResources 15(1), 854-868. 858
in Fig. 1A and B. In the trials, the highest yield of PA (14.4 ± 0.4%) in Fig. 1A was
obtained at 150 °C. The yield of PA was also positively correlated with an increased
duration initially, reaching 14.0 ± 0.8% within 45 min, as shown in Fig. 1B. Higher
temperature and longer extraction time resulted in a lower SR yield and higher PA yield,
due to thermal degradation of SR. During extraction, large chain compounds such as
cellulose, hemicellulose, and lignin are typically broken down into smaller and simpler
molecules, which can dissolve to form water-soluble polysaccharides (Yuliansyah et al.
2010). However, PA is further decomposed by dehydration and fragmentation reactions if
the treatment with HCW is prolonged. The yield of PA decreased when the temperature
exceeded 150 °C or when the time was longer than 45 min. The PB yield tended to drop
slightly at the beginning, followed by a remarkable rise from 14.4 ± 0.6% to 22.7 ± 0.2%
with temperatures of 135 to 165 °C in Fig. 1A. After 45 min, there was also a slight
increase of PB yield. There might be a conversion of PA to PB, induced by the longer-term
degradation of PA (Liu et al. 2016). However, those conditions could also destroy the
structures and promote the decomposition of polysaccharides into smaller molecules.
There was a slight increase of SR at 165 °C, which was interpreted as the re-condensation
of soluble components that originated from lignin (Alvira et al. 2010). Based on these
results, the optimum extraction conditions for PA were 150 °C and 45 min.
100 120 140 160
10
20
60
70
Yie
ld (
%)
Temperature (oC)
SR
PA
PB
A
20 40 60 800
10
20
60
70
Yie
ld (
%)
Time (min)
SR
PA
PB
B
1:5 1:10 1:15 1:20 1:25
10
20
60
70
Yie
ld (
%)
Ratio (g : mL)
SR
PA
PB
C
Fig. 1. Effect of extraction conditions on product yields based on raw material: (A) temperature (105 to 165 °C), extraction time 45 min, and solid to liquid ratio of 1 to 10; (B) extraction time (10 to 85 min), temperature 120 °C, and a solid to liquid ratio of 1 to 10; (C) solid to liquid ratio (1 to 5 and 1 to 30), extraction time 45 min, and a temperature of 120 °C
The relative content of solvent is another important factor in the treatment of the
raw material. As shown in Fig. 1C, the yield of SR notably decreased as the solid/liquid

PEER-REVIEWED ARTICLE bioresources.com
Liu et al. (2020). “FCS pectin characterization,” BioResources 15(1), 854-868. 859
ratio (g/mL) was decreased from 1:5 to 1:15. The yield continued to decrease slightly, as
the material to water ratio approached the range 1:15 to 1:30. The yield of PA first
increased and then decreased. A valley in the peak yield (14.0 ± 0.8%) can be observed at
a 1:10 ratio, with a plateau region observed thereafter. One explanation of this result was
that the large content of water encouraged diffusion of the solvent into the cells, as well
as more rapid dissolution of the polysaccharide (Zhao et al. 2013; Xu et al. 2016).
However, increasing the solvent had little effect on the yield after PA reached maximum
solubility. Presumably, this is because an excess of water absorbs cavitation energy from
the extraction system, which negatively influences the breakage of cell walls and mass
transmission (Samavati 2013). From an economic perspective, a material to water ratio of
1:10 is apparently optimal and was selected here for subsequent study.
Among the three extraction factors studied, an appropriately high temperature
(150 °C), moderate extraction time (45 min), and a 1 to 10 ratio of material to water were
found to exert a positive effect on PA extraction. Similar conditions have been shown to
be ideal for extracting pectic polysaccharides from apple pomace (Wang and Lv 2014).
Purification and Analysis of Molecular Weight (Mw)
CSP (PA) produced under the optimized conditions (150 °C, 45 min, 1 to 10) was
used for further purification and structural characterization. The crude polysaccharide
precipitated by ethanol contained considerable impurities, such as polyphenols,
flavonoids, and proteins. After deproteinization and de-coloration, samples were further
purified by anion exchange chromatography via DEAE-52. One neutral polysaccharide
and two acidic components designated as CSP-1, CSP-2, and CSP-3 were obtained. CSP-
1 was a neutral polysaccharide because it was eluted by water, while CSP-2 and CSP-3
were known to represent acidic polysaccharides because they were eluted by NaCl
solutions. In terms of conventional physicochemical properties, the purified
polysaccharides were flocculent, white, odorless, soluble in water and DMSO, and only
slightly soluble in organic solvents.
The homogeneity and Mw of acidic polysaccharides were evaluated by GPC. As
illustrated in Fig. 2, CSP-2 and CSP-3 showed single, symmetrical, and narrow peaks
with elution times of 7.08 min and 7.17 min, respectively. Thus, CSP-2 and CSP-3 were
regarded as homogeneous polysaccharides. Their average Mw values were estimated to be
59.1 kDa and 57.9 kDa, respectively. However, CSP-1 was not homogenous because it
was eluted at three peaks, as can be seen in Fig. 2.
2 4 6 8 10 12-2
0
2
4
6
V (
mV
)
Retention Time (min)
CSP-1 6.62
8.57
9.37
2 4 6 8 10 12
0
6
12
18
24
30
V (
mV
)
Retention Time (min)
CSP-27.09

PEER-REVIEWED ARTICLE bioresources.com
Liu et al. (2020). “FCS pectin characterization,” BioResources 15(1), 854-868. 860
2 4 6 8 10 12
0
6
12
18
24
30
36
V (
mV
)Retention Time (min)
CSP-3 7.17
Fig. 2. GPC analysis of CSP-1, CSP-2 and CSP-3 Monosaccharide Composition
As shown in Table 1, CSP-1, CSP-2, and CSP-3 were comprised of similar types
of monosaccharides; namely, Ara, Gal, Glu, Man, Rhm, and GalA. CSP-1 was highly
enriched with Ara (45.4%), followed by Gal (19.1%), and Glu (14.4%). A few uronic
acid molecules (6.2%) were present in CSP-1, indicating that it was a neutral
polysaccharide. The primary uronic acid in CSP-1 was GluA. As a comparison, the CSP
eluted from DEAE-sepharose by water from Chaenomeles speciosa using the hot water
method only contained four neutral monosaccharides: Glc, Gal, Rha, and Ara (Xie et al.
2015). The variation in the amount of sugars was most likely related to the differences of
species between the presented studied material and Chaenomeles speciosa. In addition,
the high temperature and pressure could contribute to different degrees of degradation.
During the process of biomass hydrolysis within hot compressed water, Ara was shown
to be hydrolyzed and degraded first (Wang et al. 2014), which led to the high amount of
Ara in the polysaccharides obtained.
CSP-2 and CSP-3 primarily contained GalA, followed by Gal and Ara with molar
ratios of 4.6:2.4:1 and 6.3:0.5:1.5, respectively. The molar ratio of GalA reached 53.2,
and its relative proportion increased to 73.6%. Both figures are typical of the
monosaccharides of pectins. These results suggest that the backbones of the two fractions
comprised homogalacturonan (HG) and rhamnogalacturonan (RG) carrying side chains
containing primarily Gal and Ara. The molar ratio of GalA per (Rha + Gal + Ara + Man
+ Glu) in CSP-3 (2.8) was higher than in CSP-2 (1.4), demonstrating that CSP-3 was
more linear. The molar ratio of (Ara + Gal) per Rha reflected the degree of side chain
branching, so it seemed that longer side chains were attached to the RG portion in CSP-2
(Ferreira et al. 2006). In addition, the small amount of Man and Glu bound to the side
chains might originate from hemicelluloses or cellulose. Two uronic acids could be
detected, with contents of 6.2%, 53.2%, and 78.0% in CSP-1, CSP-2, and CSP-3,
respectively. Uronic acid content increased with increasing salting strength of the eluant.
The same trend could be seen in Sadeqs’ research on Mangifera pajang fruits (Al-Sheraji
et al. 2012). Clearly, CSP-2 and CSP-3 are pectic polysaccharides and contain more
GalA than apple pomace extracted by HCW (Wang and Lv 2014).

PEER-REVIEWED ARTICLE bioresources.com
Liu et al. (2020). “FCS pectin characterization,” BioResources 15(1), 854-868. 861
Table 1. Monosaccharide Components of CSP-1, CSP-2, and CSP-3
Fraction Molar compositiona (% based on total sugar)
GalA Ara Gal Glu Rhm Man GluA Xyl
CSP-1 0.4 45.4 19.1 14.4 4.3 5.6 5.8 5.0
CSP-2 53.2 11.6 27.7 4.5 2.4 0.6 - -
CSP-3 73.6 17.7 6.0 1.2 1.5 0.1 - - aGalA: galacturonic acid; Ara: arabinose; Gal: galactose; GluA: Glu: glucose; Rhm: rhamnose; Man: mannose; glucuronic acid; Xyl: Xylose
Analysis of UV and FTIR Spectra As shown in Fig. 3A, there were no peaks at 280 or 260 nm, demonstrating the
absence of proteins and nucleic acids in all three samples. All FTIR spectrograms in Fig.
3B present typical characteristics of polysaccharides. The spectra of the three
polysaccharides were almost identical, which indicates that they had similar chemical
structures.
Fig. 3. (A-B) UV and FTIR spectra of CSP-1, CSP-2, CSP-3; (C-D) 1H and 13C of CSP-2
The strong and wide band near 3378 cm-1 represents the O-H stretching vibration
of water or carboxylic acid, and the relatively weak absorption peaks located at 2937 cm-1
and 1371 cm-1 are due to C-H stretching and bending vibrations. Moreover, the bands at
1615 cm-1 and 1417 cm-1 are associated with asymmetric and symmetric stretching
vibrations, respectively, of free carboxylate groups. The peak at 1745 cm-1 suggests the
6.0 5.5 5.0 4.5 4.0 3.5 3.0 2.5 2.0 120 100 80 60 50
δH (ppm) δC (ppm)
200 250 300 350 400 450 500 4000 2000 1500 1000 500
Wavenumber (nm) Wavenumber (nm)
Tra
nsm
itta
nc
e
Ab
so
rban
ce

PEER-REVIEWED ARTICLE bioresources.com
Liu et al. (2020). “FCS pectin characterization,” BioResources 15(1), 854-868. 862
existence of C=O in the ester carbonyl. Namely, the peaks at approximately 1745 cm-1,
1615 cm-1, and 1417 cm-1 indicate the presence of uronic acid, which again confirms the
data obtained by the monosaccharide analysis. Usually, the ratio of band areas between
1745 cm-1 and 1615 cm-1 (R1745 per 1615) presents the degree of esterification (DE)
(Pappas et al. 2004). In Fig. 3B, the DE value of CSP-2 was 44.6%, which was slightly
lower than that of CSP-3 (45.0%). Polysaccharides extracted by water are usually highly
methyl esterified. In the fingerprint region, a band at 1245 cm-1 would be derived from
the stretching vibration of C-O or O-H deformation vibrations, and the small signal at
1049 cm-1 was assigned to the C-O, C-C stretching, or C-OH bending typical of
arabinofuranose (Kacurakova et al. 1998). The peak at 960 cm-1 can be attributed to the
skeletal mode of a pyranose ring (Zheng et al. 2015). In addition, the strong absorptions
at 1147 cm-1, 1103 cm-1, 1012 cm-1, 916 cm-1, and 765-1 are typical of the α-pyranose
form of the glucoside, while the absorption peaks at 831 cm-1 indicate that the β-
configuration existed in the three polysaccharides (Luo et al. 2008; Han et al. 2016).
There was a strong peak at 1103 cm-1 indicating that the glycosidic bond was primarily α-
glycosidic. The weak peak located at 896 cm-1 corresponding to the C-1 group frequency
or ring frequency, also represented the β-linkage of galactose residues (Kruse and Dinjus
2007; Azad et al. 2015). Additionally, the weak absorption at 802 cm-1 established the
presence of a small amount of mannose. The two acidic fractions had many typical
characteristics of pectin, and they were rich in uronic acid and methyl groups to varying
extents.
Glycosidic Linkage Analysis
Homogeneous polysaccharide (CSP-2) with the stronger antioxidant activity was
selected (as shown below) for methylation and NMR analysis to elucidate its structural
characterization. To elucidate the linkages of CSP-2, the methylated product was
analyzed by GC-MS. The molar ratio of each linkage residue was calculated from the
peak area in the total ion chromatogram and the molecular weight of PMAAs. The
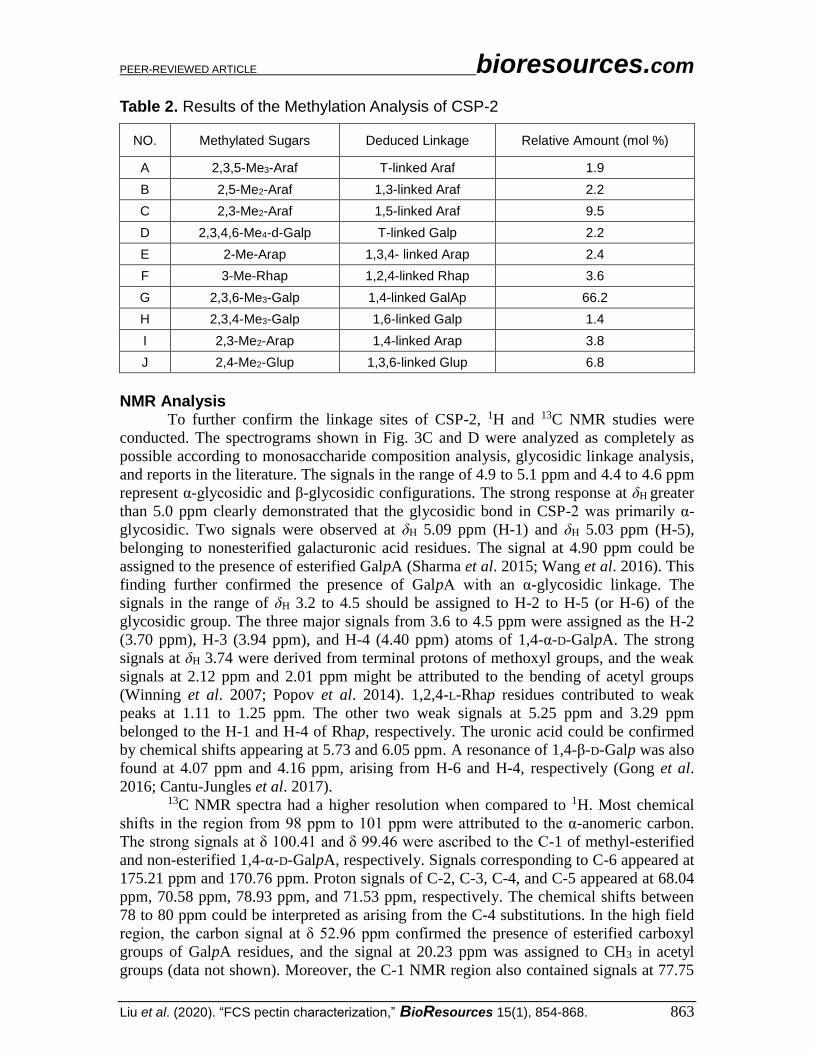
analysis results are presented in Table 2. The methylation data indicated that there were
many 1,4-D-GalpA units on the CSP-2 backbones. The acidic fractions consisted of large
amounts of GlapA, where more than 80.2% of GlapA was 1,4-linked, indicating large
amounts of homogalacturonan. 1,4-D-Galp was the second most abundant glycosidic
linkage, with a content of 25.7%. Most of the Galp (91.7%) was 1,4-linked.
Approximately 5.0% of Galp was found to be terminal-linked (T-linked), and 3.3% was
1,6-linked. Thus, galactose residues were supposed to mostly be present as 1,4-D-
galactans. In addition, Ara was found to include T-, 3-, 4-, 5-, and 3,4-linked furanosyl or
pyranoid units. 48.2% of Ara was 1,5-L-Araf, which suggested the presence of arabinan
or arabinogalactan. Small amounts of rhamnose derivatives demonstrated the presence of
1,2,4-L-Rhap units. According to the ratio of Rha per 1,4-GalpA, approximately 5.4%,
rhamnogalacturonan-I (RG-I) might be attached to an HG backbone (Schols and Voragen
1996). The primary terminal residues of CSP-2 were T-L-Arap (1.2%), T-L-GalpA
(6.9%), and T-D-Galp (1.4%). Moreover, there was a fair amount of 1,3-L-Araf, 1,4-L-
Arap, 1,3,4- L-Arap, and 1,6-D-Galp residues, which were probably incorporated
randomly in the side chains. These results are consistent with data from the FTIR and
monosaccharide composition analysis.
PEER-REVIEWED ARTICLE bioresources.com
Liu et al. (2020). “FCS pectin characterization,” BioResources 15(1), 854-868. 863
Table 2. Results of the Methylation Analysis of CSP-2
NO. Methylated Sugars Deduced Linkage Relative Amount (mol %)
A 2,3,5-Me3-Araf T-linked Araf 1.9
B 2,5-Me2-Araf 1,3-linked Araf 2.2
C 2,3-Me2-Araf 1,5-linked Araf 9.5
D 2,3,4,6-Me4-d-Galp T-linked Galp 2.2
E 2-Me-Arap 1,3,4- linked Arap 2.4
F 3-Me-Rhap 1,2,4-linked Rhap 3.6
G 2,3,6-Me3-Galp 1,4-linked GalAp 66.2
H 2,3,4-Me3-Galp 1,6-linked Galp 1.4
I 2,3-Me2-Arap 1,4-linked Arap 3.8
J 2,4-Me2-Glup 1,3,6-linked Glup 6.8
NMR Analysis To further confirm the linkage sites of CSP-2, 1H and 13C NMR studies were
conducted. The spectrograms shown in Fig. 3C and D were analyzed as completely as
possible according to monosaccharide composition analysis, glycosidic linkage analysis,
and reports in the literature. The signals in the range of 4.9 to 5.1 ppm and 4.4 to 4.6 ppm
represent α-glycosidic and β-glycosidic configurations. The strong response at δH greater
than 5.0 ppm clearly demonstrated that the glycosidic bond in CSP-2 was primarily α-
glycosidic. Two signals were observed at δH 5.09 ppm (H-1) and δH 5.03 ppm (H-5),
belonging to nonesterified galacturonic acid residues. The signal at 4.90 ppm could be
assigned to the presence of esterified GalpA (Sharma et al. 2015; Wang et al. 2016). This
finding further confirmed the presence of GalpA with an α-glycosidic linkage. The
signals in the range of δH 3.2 to 4.5 should be assigned to H-2 to H-5 (or H-6) of the
glycosidic group. The three major signals from 3.6 to 4.5 ppm were assigned as the H-2
(3.70 ppm), H-3 (3.94 ppm), and H-4 (4.40 ppm) atoms of 1,4-α-D-GalpA. The strong
signals at δH 3.74 were derived from terminal protons of methoxyl groups, and the weak
signals at 2.12 ppm and 2.01 ppm might be attributed to the bending of acetyl groups
(Winning et al. 2007; Popov et al. 2014). 1,2,4-L-Rhap residues contributed to weak
peaks at 1.11 to 1.25 ppm. The other two weak signals at 5.25 ppm and 3.29 ppm
belonged to the H-1 and H-4 of Rhap, respectively. The uronic acid could be confirmed
by chemical shifts appearing at 5.73 and 6.05 ppm. A resonance of 1,4-β-D-Galp was also
found at 4.07 ppm and 4.16 ppm, arising from H-6 and H-4, respectively (Gong et al.
2016; Cantu-Jungles et al. 2017). 13C NMR spectra had a higher resolution when compared to 1H. Most chemical
shifts in the region from 98 ppm to 101 ppm were attributed to the α-anomeric carbon.
The strong signals at δ 100.41 and δ 99.46 were ascribed to the C-1 of methyl-esterified
and non-esterified 1,4-α-D-GalpA, respectively. Signals corresponding to C-6 appeared at
175.21 ppm and 170.76 ppm. Proton signals of C-2, C-3, C-4, and C-5 appeared at 68.04
ppm, 70.58 ppm, 78.93 ppm, and 71.53 ppm, respectively. The chemical shifts between
78 to 80 ppm could be interpreted as arising from the C-4 substitutions. In the high field
region, the carbon signal at δ 52.96 ppm confirmed the presence of esterified carboxyl
groups of GalpA residues, and the signal at 20.23 ppm was assigned to CH3 in acetyl
groups (data not shown). Moreover, the C-1 NMR region also contained signals at 77.75

PEER-REVIEWED ARTICLE bioresources.com
Liu et al. (2020). “FCS pectin characterization,” BioResources 15(1), 854-868. 864
ppm, 76.80, and 61.13 ppm from 1,4-D-Galp units. Signals at 107.52 ppm and 103.11
ppm might be assigned to the C-1 of L-Ara and β-D-Galp (substituted at O-6). All the
above assignments were consistent with published values (Chen et al. 2010; Zheng et al.
2015; Han et al. 2016). This result was also consistent with the analysis of the FTIR
spectrometric data.
Antioxidant Activity in vitro Scavenging of hydroxyl radical
The hydroxyl radical is quite toxic to living organisms due to its reaction with all
functional biomacromolecules. Hydroxyl radical activity results in cancer, aging, and
overall degenerative damage. Hydroxyl radicals are mostly produced from the
decomposition of hydroperoxides. The scavenging hydroxyl radical abilities of CSP,
CSP-1, CSP-2, CSP-3, and VC are shown in Fig. 4A. Their activity was concentration
dependent. CSP showed almost no scavenging capacity at a low dosage, but this capacity
increased quickly at higher concentrations reaching 27.2% at 2 mg/mL. Among the three
purified polysaccharides, CSP-2 possessed the highest OH scavenging activity of 28.0%
at 2 mg/mL, but the scavenging capacity of CSP-1 was significantly lower than that of
CSP-2. Overall, pectic polysaccharides from FCS are superior to crude and neutral
polysaccharides with respect to eliminating OH radicals.
0
25
50
75
100
210.50.25
Sc
av
en
gin
g a
cti
vit
y (
%)
Concentration (mg/mL)
CSP
CSP-1
CSP-2
CSP-3
VC
A
0.10
25
50
75
100 CSP-3
VC
210.50.25
Sc
av
en
gin
g a
cti
vit
y (
%)
Concentration (mg/mL)
CSP
CSP-1
CSP-2
B
0.1
0
1
2
3 CSP-3
VC
210.50.25
OD
70
0n
m
Concentration (mg/mL)
CSP
CSP-1
CSP-2
C
0.1
Fig. 4. Antioxidant activity in vitro: (A) Scavenging of hydroxyl radical; (B) Scavenging of DPPH
radical; (C) Reducing power
Scavenging of the DPPH radical
DPPH has been widely used in antioxidant assays due to the convenience of
procedures and the reproducibility of results. DPPH is a free radical compound exhibiting
PEER-REVIEWED ARTICLE bioresources.com
Liu et al. (2020). “FCS pectin characterization,” BioResources 15(1), 854-868. 865
a characteristic absorption at 517 nm. This absorption (visible as a purple color) fades
significantly upon exposure to a proton radical scavenger. As shown in Fig. 4B, the
scavenging abilities of the three CSP polysaccharides were found to be ranked in the
following order: CSP is greater than CSP-1, CSP-1 is greater than CSP-2, and CSP-2 is
greater than CSP-3. The differences among them might arise from a variety of causes,
including the variation in monosaccharide content and/or phenolic compounds,
conformation, or molecular weight. Extraction methods could also influence results, as
seen in previous studies. At concentrations from 0.1 mg/mL to 1 mg/mL, the DPPH
radical scavenging activity increased with concentration. The DPPH scavenging abilities
slightly increased when the concentration exceeded 1 mg/mL. In addition, CSP
developed significant DPPH scavenging activity which was equal to VC at dosages from
0.25 mg/mL to 2 mg/mL. The activity reached a plateau of approximately 85.4% above
0.25 mg/mL. It was obvious that CSP exhibited high DPPH scavenging ability and could
be explored as a new antioxidant in anti-cancer therapies and treatments.
Reducing power assay
The potassium ferricyanide reduction method was used to assess the reductive
activities of samples and Vc, with an observed dose-dependent response as shown in Fig.
4C. During the testing, ferricyanide is reduced to ferrous iron. At concentrations of 0.1
mg/mL and 0.25 mg/mL, the four samples had almost the same optical density (OD) of
approximately 0.18. CSP showed the highest reducing power at a high concentration.
However, there were no obvious changes when the concentrations of the further purified
polysaccharides increased. These results suggest the presence of additional
phytochemicals. In summary, CSP expressed stronger abilities both in eliminating DPPH
radicals and in reducing the three purified polysaccharides. Hence, the detailed defense
mechanism of CSP in FCS, as a potential antioxidant, necessitates further investigation.
CONCLUSIONS 1. Moderate temperature (150 °C) and a short extraction time (45 min) at a solid to
liquid ratio of 1 to 10 g/mL were found to be effective in obtaining high PA yields
from the fruits of Chaenomeles sinensis.
2. A neutral (CSP-1) and two acidic polysaccharides (CSP-2, CSP-3) were separated by
DEAE-52 and characterized. The two acidic fractions showed typical characteristics
of methylated pectins and exerted remarkable antioxidant ability in scavenging
hydroxyl radicals.
3. The backbone of CSP-2 was found to contain primarily 1,4-α-galacturonans with RG-
I insertions. The side chains attached to the 4-position of the 1,2-L-Rhap residues in
the RG region appeared to include primarily 1,4-galactans and to a lesser extent, 1,5-
Araf and 1,3,4-Galp.
4. In summary, these polysaccharides are natural antioxidants, and the ripe fruit of
Chaenomeles sinensis (FCS) appears to be a promising source of pectin for
commercial applications due to its rich raw materials and simple extraction method.
PEER-REVIEWED ARTICLE bioresources.com
Liu et al. (2020). “FCS pectin characterization,” BioResources 15(1), 854-868. 866
ACKNOWLEDGEMENTS
The authors gratefully acknowledge the financial support provided by the
Program for Henan Scientific and Technological Innovation Talents of Colleges and
Universities (19HASTIT012).
REFERENCES CITED
Al-Sheraji, S. H., Ismail, A., Manap, M. Y., Mustafa, S., Yusof, R. M., and Hassan, F. A.
(2012). “Purification, characterization and antioxidant activity of polysaccharides
extracted from the fibrous pulp of Mangifera Pajang fruits,” LWT-Food Science and
Technology 48(2), 291-296. DOI: 10.1016/j.lwt.2012.04.002
Alvira, P., Tomás-Pejó, E., Ballesteros, M., and Negro, M. J. (2010). “Pretreatment
technologies for an efficient bioethanol production process based on enzymatic
hydrolysis: A review,” Bioresource Technology 101(13), 4851-4861. DOI:
10.1016/j.biortech.2009.11.093
Azad, M. A. K., Wang, F., and Kim, H. R. (2015). “Identification of a novel sugar
compound from Korean pine seeds,” Food Science and Technology 24(6), 2011-
2015. DOI: 10.1007/s10068-015-0265-y
Cantu-Jungles, T. M., Cipriani, T. R., Iacomini, M., Hamaker, B. R., and Cordeiro, L. M.
(2017). “A pectic polysaccharide from peach palm fruits (Bactris gasipaes) and its
fermentation profile by the human gut microbiota in vitro,” Bioactive Carbohydrates
and Dietary Fiber 9, 1-6. DOI: 10.1016/j.bcdf.2016.11.005
Chen, F., and Huang, G. (2018). “Extraction and antioxidant activities of cushaw
polysaccharide,” International Journal of Biological Macromolecules 120, 1646-
1649. DOI: 10.1016/j.ijbiomac.2018.09.200
Chen, X., Lawoko, M., and Heiningen, A. (2010). “Kinetics and mechanism of
autohydrolysis of hardwoods,” Bioresource Technology 101(20), 7812-7819. DOI:
10.1016/j.biortech.2010.05.006
Fagioli, L., Pavoni, L., Logrippo, S., Pelucchini, C., Rampoldi, L, Cespi, M., Bonacucina,
G., and Casettari, L. (2019). “Linear viscoelastic properties of selected
polysaccharide gums as function of concentration, pH, and temperature,” Journal of
Food Science 84 (1), 65-72. DOI: 10.1111/1750-3841.14407
Ferreira, J. A., Mafra, I., Soares, M. R., Evtuguin, D. V., and Coimbra, M. A. (2006).
“Dimeric calcium complexes of arabinan-rich pectic polysaccharides from Olea
europaea L. cell walls,” Carbohydrate Polymers 65(4), 535-543. DOI:
10.1016/j.carbpol.2006.02.013
Gong, G., Fan, J., Sun, Y., Wu, Y., Liu, Y., Sun, W., Zhang, Y., and Wang, Z. (2016).
“Isolation, structural characterization, and antioxidativity of polysaccharide LBLP5-A
from Lycium barbarum leaves,” Process Biochemistry 51(2), 314-324. DOI:
10.1016/j.procbio.2015.11.013
Han, Y. L., Gao, L., Yin, Y. Y., Jin, Z. Y., Xu, X. M., and Chen, H. Q. (2016).
“Extraction optimization by response surface methodology of mucilage
polysaccharide from the peel of Opuntia dillenii Haw. fruits and their
physicochemical properties,” Carbohydrate Polymers 151, 381-391. DOI:
10.1016/j.carbpol.2016.05.085

PEER-REVIEWED ARTICLE bioresources.com
Liu et al. (2020). “FCS pectin characterization,” BioResources 15(1), 854-868. 867
Kacurakova, M., Belton, P. S., Wilson, R. H., Hirsch, J., and Ebringerova, A. (1998).
“Hydration properties of xylan-type structures: An FTIR study of
xylooligosaccharides,” Journal of the Science of Food and Agriculture 77(1), 38-44.
DOI: 10.1002/(sici)1097-0010(199805)77:1<38::aid-jsfa999>3.0.co;2-5
Kim, D. H., Lee, J. S., Yun, C. Y., Kim, D. H., and Kim, I. S. (2013). “Chinese quince
(Chaenomeles sinensis) extract inhibits cell migration and cytokine release in HMC-1
cells,” Food Sci. Biotechnol. 22(2), 501-506. DOI: 10.1007/s10068-013-0107-8
Kruse, A., and Dinjus, E. (2007). “Hot compressed water as reaction medium and
reactant: Properties and synthesis reactions,” The Journal of Supercritical Fluids
41(3), 362-380. DOI: 10.1016/j.supflu.2006.03.016
Liu, H. M., Wang, F. Y., and Liu, Y. L. (2016). “Hot-compressed water extraction of
polysaccharides from soy hulls,” Food Chemistry 202, 104-109. DOI:
10.1016/j.foodchem.2016.01.129
Luo, X., Xu, X., Yu, M., Yang, Z., and Zheng, L. (2008). “Characterization and
immunostimulatory activity of an α-(1→6)-D-glucan from the cultured Armillariella
tabescens mycelia,” Food Chemistry 111(2), 357-363. DOI:
10.1016/j.foodchem.2008.03.076
Miyazawa, T., and Funazukuri, T. (2004). “Hydrothermal production of
mono(galacturonic acid) and the oligomers from poly (galacturonic acid) with water
under pressures,” Industrial & Engineering Chemistry Research 43(10), 2310-2314.
DOI: 10.1021/ie0202672
Pappas, C. S., Malovikova, A., Hromadkova, Z., Tarantilis, P. A., Ebringerova, A., and
Polissiou, M. G. (2004). “Determination of the degree of esterification of pectinates
with decyl and benzyl ester groups by diffuse reflectance infrared Fourier transform
spectroscopy (DRIFTS) and curve-fitting deconvolution method,” Carbohydrate
Polymers 56(4), 465-469. DOI: 10.1016/S0144-8617(04)00078-5
Pettolino, F. A., Walsh, C., Fincher, G. B., and Bacic, A. (2012). “Determining the
polysaccharide composition of plant cell walls,” Nature Protocols 7(9), 1590-1607.
DOI: 10.1038/nprot.2012.081
Popov, S. V., Ovodova, R. G., Golovchenko, V. V., Khramova, D. S., Markov, P. A.,
Smirnov, V. V. Shashkov, A. S., and Ovodov, Y. S. (2014). “Pectic polysaccharides
of the fresh plum Prunus domestica L. isolated with a simulated gastric fluid and their
anti-inflammatory and antioxidant activities,” Food Chemistry 143, 106-113. DOI:
10.1016/j.foodchem.2013.07.049
Pu, X., Ma, X., Liu, L., Ren, J., Li, H., Li, X., Yu, S., Zhang, W., and Fan, W. (2016).
“Structural characterization and antioxidant activity in vitro of polysaccharides from
angelica and astragalus,” Carbohydrate Polymers 137, 154-164. DOI:
10.1016/j.carbpol.2015.10.053
Samavati, V. (2013). “Polysaccharide extraction from Abelmoschus esculentus:
Optimization by response surface methodology,” Carbohydrate Polymers 95(1), 588-
597. DOI: 10.1016/j.carbpol.2013.02.041
Schols, H. A., and Voragen, A. G. J. (1996). “Complex pectins: Structure elucidation
using enzymes,” Progress in Biotechnology 14, 3-19. DOI: 10.1016/S0921-
0423(96)80242-5
Sharma, R., Kamboj, S., Khurana, R., Singh, G., and Rana, V. (2015). “Physicochemical
and functional performance of pectin extracted by QbD approach from Tamarindus
indica L. pulp,” Carbohydrate Polymers 134(10), 364-374. DOI:
10.1016/j.carbpol.2015.07.073

PEER-REVIEWED ARTICLE bioresources.com
Liu et al. (2020). “FCS pectin characterization,” BioResources 15(1), 854-868. 868
Wang, K. P., Wang, J., Li, Q., Zhang, Q. L., You, R. X., Cheng, Y., Luo, L., and Zhang,
Y. (2014). “Structural differences and conformational characterization of five
bioactive polysaccharides from Lentinus edodes,” Food Research International 62,
223-232. DOI: 10.1016/j.foodres.2014.02.047
Wang, L., Liu, H. M., Xie, A. J., Zhu, C. Y., and Qin, G. Y. (2017). “Dietary fiber
extraction from defatted corn hull by hot-compressed water,” Polish Journal of Food
and Nutrition Sciences 68(2), 133-140. DOI: 10.1515/pjfns-2017-0015
Wang, W., Ma, X., Jiang, P., Hu, L., Zhi, Z., Chen, J., Ding, T., Ye, X., and Liu, D.
(2016). “Characterization of pectin from grapefruit peel: A comparison of ultrasound-
assisted and conventional heating extractions,” Food Hydrocolloid 61, 730-739. DOI:
10.1016/j.foodhyd.2016.06.019
Wang, X., and Lv, X. (2014). “Characterization of pectic polysaccharides extracted from
apple pomace by hot-compressed water,” Carbohydrate Polymers 102, 174-184.
DOI: 10.1016/j.carbpol.2013.11.012
Winning, H., Viereck, N., Nørgaard, L., Larsen, J., and Engelsen, S. B. (2007).
“Quantification of the degree of blockiness in pectins using 1H NMR spectroscopy
and chemometrics,” Food Hydrocolloid 21(2), 256-266. DOI:
10.1016/j.foodhyd.2006.03.017
Xie, X., Zou, G., and Li, C. (2015). “Antitumor and immunomodulatory activities of a
water-soluble polysaccharide from Chaenomeles speciose,” Carbohydrate Polymers
132, 323-329. DOI: 10.1016/j.carbpol.2015.06.046
Xu, Y., Cai, F., Yu, Z., Zhang, L., Li, X., Yang, Y., and Liu, G. (2016). “Optimization of
pressurized water extraction of polysaccharides from blackcurrant and its antioxidant
activity,” Food Chemistry 194, 650-658. DOI: 10.1016/j.foodchem.2015.08.061
Yuliansyah, A. T., Hirajima, T., Kumagai, S., and Sasaki, K. (2010). “Production of solid
biofuel from agricultural wastes of the palm oil industry by hydrothermal treatment,”
Waste and Biomass Valorization 1(4), 395-405. DOI: 10.1007/s12649-010-9045-3
Zhao, C., Yang, R. F., and Qiu, T. Q. (2013). “Ultrasound-enhanced subcritical water
extraction of polysaccharides from Lycium barbarum, L.,” Separation and
Purification Technology 120, 141-147. DOI: 10.1016/j.seppur.2013.09.044
Zheng, X., Liu, Z., Li, S., Wang, L., Lv, J., Li, J., Ma, X., Fan, L., and Guan, F. (2015).
“Identification and characterization of a cytotoxic polysaccharide from the flower of
Abelmoschus manihot,” International Journal of Biological Macromolecules 82, 284-
290. DOI: 10.1016/j.ijbiomac.2015.10.004
Article submitted: September 26, 2019; Peer review completed: December 1, 2019;
Revised version received: December 5, 2019; Accepted: December 6, 2019; Published:
December 12, 2019.
DOI: 10.15376/biores.15.1.854-868