Upon confirmation of this document’s acceptance for filing ...

MT. EPHRAIM AVENUE (CR 605)PEDESTRIAN ROAD SAFETY AUDIT
June 2013
Camden City, New Jersey
SAFETYREGIONAL
P R O G R A M S

The Delaware Valley Regional Planning
Commission is dedicated to uniting the
region’s elected officials, planning
professionals, and the public with a
common vision of making a great region
even greater. Shaping the way we live,
work, and play, DVRPC builds
consensus on improving transportation,
promoting smart growth, protecting the
environment, and enhancing the
economy. We serve a diverse region of
nine counties: Bucks, Chester, Delaware,
Montgomery, and Philadelphia in
Pennsylvania; and Burlington, Camden,
Gloucester, and Mercer in New Jersey.
DVRPC is the federally designated
Metropolitan Planning Organization for
the Greater Philadelphia Region —
leading the way to a better future.
The symbol in our logo is adapted from the official
DVRPC seal and is designed as a stylized image of the Delaware Valley. The outer ring symbolizes the region as a whole while the diagonal bar signifies the Delaware River. The two adjoining crescents represent the Commonwealth of Pennsylvania and the State of New Jersey.
DVRPC is funded by a variety of funding sources including federal grants from the U.S. Department of Transportation’s Federal Highway Administration (FHWA) and Federal Transit Administration (FTA), the Pennsylvania and New Jersey departments of transportation, as well as by DVRPC’s state and local member governments. The authors, however, are solely responsible for the findings and conclusions herein, which may not represent the official views or policies of the funding agencies.
DVRPC fully complies with Title VI of the Civil Rights Act of 1964 and related statutes and regulations in all programs and activities. DVRPC’s website (www.dvrpc.org) may be translated into multiple languages. Publications and other public documents can be made available in alternative languages and formats, if requested. For more information, please call (215) 238-2871.

i
Table of Contents Executive Summary ................................................................................................................... 1
C H A P T E R 1
Introduction ................................................................................................................................ 3
Corridor Selection .............................................................................................................................. 3
What is a Pedestrian Road Safety Audit? .......................................................................................... 3
The Mt. Ephraim Avenue Pedestrian RSA Event ............................................................................... 4
C H A P T E R 2
Corridor Description and Analysis ............................................................................................. 5
Study Location ................................................................................................................................... 5
Roadway Characteristics ................................................................................................................... 5
Traffic Volumes .................................................................................................................................. 7
Transit Service ................................................................................................................................... 7
Environmental Justice Technical Analysis ....................................................................................... 10
C H A P T E R 3
Crash Findings ......................................................................................................................... 13
Corridor-wide Crash Findings .......................................................................................................... 13
Pedestrian and Bicyclist Crashes .................................................................................................... 19
C H A P T E R 4
Findings and Recommendations ............................................................................................. 23
Audit Team Priorities........................................................................................................................ 23
Road Owner’s Response ................................................................................................................. 24
C H A P T E R 5
Conclusion ............................................................................................................................... 45
Figures and Tables Figure 1: Regional Setting ................................................................................................................................ 5
Figure 2: Mt. Ephraim Avenue Pedestrian Road Safety Audit Study Area ....................................................... 6
Figure 3: Traffic Volumes ................................................................................................................................. 8
Figure 4: Transit Network ................................................................................................................................. 9
Figure 5: Crash Frequency by Milepost ......................................................................................................... 18
Figure 6: Bicyclist and Pedestrian Crash Concentrations .............................................................................. 21
Figure 7: Panel 1 (Ferry Avenue intersection and north to cemetery) ............................................................ 26
Figure 8: Panel 2 (Sayre Avenue to Dayton Avenue) ..................................................................................... 28
Figure 9: Panel 3 (Decatur Street to Jackson Street) ..................................................................................... 30
Figure 10: Panel 4 (Chase Street to Everett Street) ....................................................................................... 32
Figure 11: Panel 5 (Whitman Avenue to Mechanic Street) ............................................................................ 34
Figure 12: Panel 6 (Liberty Street to Sycamore Street) .................................................................................. 36
Figure 13: Panel 7 (Chestnut Street to Walnut Street) ................................................................................... 38
Figure 14: Panel 8 (Spruce Street to Haddon Avenue) .................................................................................. 40

M t . E p h r a i m A v e n u e P e d e s t r i a n R o a d S a f e t y A u d i t – C a m d e n C o u n t y i i
Table 1: Degrees of Disadvantage by Census Tract ...................................................................................... 10
Table 2: Crashes by Year .............................................................................................................................. 13
Table 3: Severity Level of All People Injured Plus Pedestrians and Bicyclists ............................................... 14
Table 4: Collision Type ................................................................................................................................... 15
Table 5: Road Surface and Illumination ......................................................................................................... 15
Table 6: Corridor-wide Statistics Summary .................................................................................................... 16
Table 7: Panel 1 (Ferry Avenue intersection and north through cemetery) .................................................... 27
Table 8: Panel 2 (Sayre Avenue to Dayton Avenue) ...................................................................................... 29
Table 9: Panel 3 (Decatur Street to Jackson Street) ...................................................................................... 31
Table 10: Panel 4 (Chase Street to Everett Street) ........................................................................................ 33
Table 11: Panel 5 (Whitman Avenue to Mechanic Street) .............................................................................. 35
Table 12: Panel 6 (Liberty Street to Sycamore Street) ................................................................................... 37
Table 13: Panel 7 (Chestnut Street to Walnut Street) .................................................................................... 39
Table 14: Panel 8 (Spruce Street to Haddon Avenue) ................................................................................... 41
Table 15: Corridor-wide Issues and Strategies .............................................................................................. 42
Appendices
A P P E N D I X A
Audit Team ............................................................................................................................ A–1
A P P E N D I X B
Road Owner Response ......................................................................................................... B–1
A P P E N D I X C
Presentation .......................................................................................................................... C–1

1
Executive Summary
At the same time that total crash fatalities have decreased both in New Jersey and across the country, the
pedestrian crashes and fatalities of that total have been increasing in the Garden State. The federal government has been watching these trends through the Pedestrian Safety Focus States and Cities program.1 In this effort, they are working to reduce pedestrian deaths by providing extra resources on focus
cities and states where pedestrian fatalities and/or fatality rates are highest. In 2011, the Federal Highway Administration (FHWA) included New Jersey in the program. In response to this distinction, DVRPC coordinated with FHWA-NJ on a Pedestrian Road Safety Audit (RSA) in Camden City.
This document is the final report for the Mt. Ephraim Avenue Pedestrian RSA. A pedestrian RSA is an effective way of identifying pedestrian safety issues, evaluating risks, and brainstorming appropriate countermeasures. The audit process employs a dynamic and intensive short-term approach that taps into the
collective knowledge of local and subject-matter experts using crash data and a walking survey of the corridor. The result—detailed in this report—is a summary of the corridor’s safety history and a listing of needed improvements organized by aerial view maps.
Mt. Ephraim Avenue (CR 605) was identified through a network screening of county-route corridors that had a high pedestrian crash history. This was performed by Rutgers University’s Center for Advanced Infrastructure and Transportation using Plan4Safety, a database analysis and mapping tool. A short list of
the most critical corridors was discussed with the appropriate county representatives, and the selected corridor was Mt. Ephraim Avenue, from Ferry Avenue north to Haddon Avenue. During the five-year analysis period, there were 362 total crashes, including 28 pedestrian crashes and 13 bicyclist crashes along the
1.43-mile stretch.
This project represents a step toward implementation of the Delaware Valley Regional Planning Commission’s (DVRPC’s) Safety Action Plan and the New Jersey Department of Transportation’s (NJDOT’s)
Strategic Highway Safety Plan (SHSP). The RSA event was conducted during Fiscal Year 2012 as part of DVRPC’s Office of Transportation Safety and Congestion Management’s annual work program.
The audit was conducted on Wednesday, June 13, 2012. The preaudit and postaudit meetings were held at
the Camden County Resource Center, 2600 Mt. Ephraim Avenue, Suite 105, Camden, NJ 08104. Among the audit team of 16 participants were representatives from Camden City, Camden County, NJDOT, New Jersey Transit, FHWA-NJ, and other agencies. See Appendix A for the list of audit team members.
Site-specific issues, organized by subareas, are discussed in the Findings and Recommendations chapter. Each subarea is represented graphically on an aerial view map, with a corresponding table to assist the reader in locating identified safety needs and the recommended improvement. Also, a short listing of audit
team priority items is included in the section preceding the graphics and tables.
1Cities were identified as pedestrian focus cities if they had more than 20 average annual pedestrian fatalities or a pedestrian fatality rate greater than 2.33 per 100,000 population (the annual national average number of pedestrian fatalities is 20 and the average national rate of pedestrian fatalities is 2.33 per 100,00 population). States with a focus city were automatically identified as focus states. http://safety.fhwa.dot.gov/ped_bike/ped_focus/

M t . E p h r a i m A v e n u e P e d e s t r i a n R o a d S a f e t y A u d i t – C a m d e n C o u n t y 2
The recommendations herein were developed collaboratively with roadway owners and local stakeholders from the study task force; DVRPC served as facilitator. The study partners expressed an interest in
implementing many of the recommendations, as time and funds allow. Several of the maintenance items, some of which are low cost, can be addressed without additional engineering. The county indicated that most of the striping and pavement issues will be addressed during the next scheduled repaving of the corridor; a
date was not yet set at the time of this document’s publication.

3
C H A P T E R 1
Introduction
As the final report for the Mt. Ephraim Avenue Pedestrian RSA, this document represents a step toward implementation of DVRPC’s Safety Action Plan (DVRPC #12030, 2012). The RSA process identifies safety issues through an intensive and collaborative forum and uses brainstorming and local knowledge to enhance
analysis findings in developing a range of improvement ideas. The NJDOT Bureau of Safety Programs assisted by providing crash rate information and summaries, in addition to staff support at the audit event. DVRPC conducted additional analysis using GIS and Plan4Safety.
Corridor Selection
DVRPC worked with the Rutgers University Center for Advanced Infrastructure and Transportation (CAIT) using Plan4Safety, NJDOT’s crash database decision support tool, to identify county route corridors with a
concentration of pedestrian crashes in DVRPC’s four-county New Jersey subregion. Eligible corridors were identified in each county, but the corridors with the greatest concentrations were in Camden County, and specifically in Camden City. After a vetting round with county partners, Mt. Ephraim Avenue—the second
highest pedestrian crash corridor in Camden County—was selected.
What is a Pedestrian Road Safety Audit?
Following the basic structure of a traditional RSA, the pedestrian RSA is a pedestrian-focused formal safety performance examination of an existing or future road or intersection by a multidisciplinary audit team. Road safety audits can be used on any size project, from minor maintenance to megaprojects, and can be
conducted on facilities with a history of crashes, or during the design phase of a new roadway or planned upgrade. DVRPC uses the tool mostly on roadways of five miles in length or less, where there is a demonstrated history of crashes.
For the Mt. Ephraim Avenue corridor, the team utilized the Pedestrian Road Safety Audit Guidelines and Prompt Lists (FHWA-SA-07-007, 2007) as a resource. This guide gives RSA teams a better understanding of the needs of pedestrians of all abilities and presents an overview of how pedestrians should be considered in
the RSA process.
For each RSA, emphasis is placed on identifying low-cost, quick-turnaround safety improvements, though not excluding strategies that are more complex. Implementation of improvement strategies identified through
this process in New Jersey may be eligible for Local Federal Aid Safety Funds. Because the RSA process is adaptable to local needs and conditions, recommendations can be implemented as time and resources permit.

M t . E p h r a i m A v e n u e P e d e s t r i a n R o a d S a f e t y A u d i t – C a m d e n C o u n t y 4
The audit event has three basic components:
Preaudit – the audit team reviews location characteristics and crash analysis;
Field visit – the audit team walks the corridor to examine conditions along the corridor; and
Postaudit – the audit team shares findings and develops a list of problems and potential strategies.
Prior to the audit, DVRPC collects and analyzes relevant data, including crash concentrations and pedestrian
crash locations, corridor-wide crash summaries, daytime and nighttime roadway video, traffic volume data, and aerial photographs. DVRPC staff also conducts a preaudit field visit to examine existing conditions. The identified crash concentrations served as the focus areas during the audit of the Mt. Ephraim Avenue study
area. All maps used during the audit event are included in the presentation that is found in Appendix C.
Following the event, DVRPC staff compiles the identified problems and potential strategies into a matrix. This document is sent back to the audit team for verification. Upon approval from the team, the matrix is
incorporated into a technical report. This is then distributed to all audit participants and coordinating agencies for advancement to the implementation stage.
The Mt. Ephraim Avenue Pedestrian RSA Event
The one-day pedestrian road safety audit was conducted on Wednesday, June 13, 2012. The preaudit and postaudit meetings were held at the Camden County Resource Center, 2600 Mt. Ephraim Avenue, Suite 105, Camden, NJ 08104. Among the audit team of 16 participants were representatives from Camden City,
Camden County, NJDOT, New Jersey Transit, and FHWA-NJ, among other agencies, with DVRPC serving as facilitator. See Appendix A for the list of audit team members.
The preaudit meeting—an overview of the study area and an examination of crash history—began at 8:30
AM. Next was the field visit, when the audit team walked the entire corridor to examine conditions and identify pedestrian safety issues. After lunch, the team returned to the meeting room for the postaudit session, in which problems were defined and countermeasures discussed.

5
C H A P T E R 2
Corridor Description and Analysis
Study Location
Mt. Ephraim Avenue (County Route 605) serves as a main street and important connector in Camden City,
Camden County, New Jersey (see Figure 1). Philadelphia, Pennsylvania lies west of the study area beyond the Delaware River, and Pennsauken
Township, New Jersey is to the north. The study area is the entire length of Mt. Ephraim Avenue: 1.43 miles from the intersection of County Route 603 (Ferry
Avenue) north to County Route 561 (Haddon Avenue) (see Figure 2). The study area begins at the northwestern edge of Woodlynne Borough and
passes north through Camden City, serving the neighborhoods of Whitman Park to the east and Liberty Park to the west: a densely developed urban
environment. The frontage along the corridor is a mix of commercial with residential uses, with a very active street life.
Roadway Characteristics
Mt. Ephraim Avenue is classified as an urban principal arterial and has a posted speed limit of 35 mph. It is a
two-way street with a north/south orientation. From the intersection of County Route 603 (Ferry Avenue) to Decatur Street, an approximate length of 0.35 miles, Mt. Ephraim Avenue has a four-lane cross-section with no barrier median and no shoulder. This is the widest roadway section of the study area. From Decatur
Street north to County Route 561 (Haddon Avenue), the corridor has a two-lane cross-section with on-street parking. There are no bike lanes or shoulders that could serve as de facto bike lanes because of parallel-parked vehicles. Sidewalks are consistently available, though many sections are in disrepair and
obstructions and tripping hazards were found throughout.
The study area has eight signalized intersections and 22 unsignalized intersections. Access to adjoining roadways in the study area is predominantly unrestricted except at one-way streets. In addition to the
connections with Ferry Avenue at the southern end of the corridor and Haddon Avenue at the northern end, County Route 607 (Kaighns Avenue) intersects the corridor at about 0.4 miles south of Haddon Avenue. Kaighns Avenue provides a direct connection to the US 30 and US 130 interchange known as Airport Circle,
located east of the study area. Taking Kaighns Avenue west provides indirect access to I-676, which connects to both the Ben Franklin and Walt Whitman bridges.
Figure 1: Regional Setting

M t . E p h r a i m A v e n u e P e d e s t r i a n R o a d S a f e t y A u d i t – C a m d e n C o u n t y 6
Figure 2: Mt. Ephraim Avenue Pedestrian Road Safety Audit Study Area

7
Traffic Volumes
Existing Annual Average Daily Traffic (AADT) volumes were used for total vehicle movements (gathered
from DVRPC and NJDOT). Turning movement counts were collected by DVRPC at three intersections within the corridor section where the highest concentration of pedestrian crashes were recorded. Pedestrian and bicyclist movements were also collected for this RSA: three pedestrian count locations and two bicyclist
count locations. These counts can be found on Figure 3: Traffic Volumes.
Traffic volume south of Sayre Avenue is approximately 12,000 vehicles per day, on average. Traffic volume near Thurman Street, near the center of the study area, is approximately 11,500 vehicles per day, on
average. Traffic volume north of Kaighns Avenue is approximately 10,500 vehicles per day, on average. Pedestrian volume near Everett Street, near the center of the study area, is approximately 753 people on the southbound side and 659 people on the northbound side. Pedestrian volume near East Chestnut Street, in
the northern section of the study area, is approximately 200–300 people per direction. Near Spruce Street, in the northernmost section of the study area, approximately 271 people were recorded on the northbound side and 166 on the southbound side. Total bicyclist volume near Sayre Avenue is approximately 20, with nearly
equal travel in both directions. Near Spruce Street, total bicyclist volume is approximately 21, with nearly equal travel in both directions.
Peak hour turning movement volumes were collected at three intersections located within those corridor
sections where the highest concentrations of both total crashes and pedestrian and bicyclist crashes were identified: Sheridan Street, Jackson Street, and Everett Street. Each of these intersections has offset intersection legs. The identified peak hours were 8:00–9:00 AM for all three, 5:00–6:00 PM for Sheridan and
Jackson Streets, and 4:00–5:00 PM for Everett Street. Of the three, the Sheridan Street intersection had the highest overall intersection volumes at 1,446 vehicles in the AM, and 2,136 in the PM period. Next was Jackson Street with an AM count of 859 and 1,158 in the PM. Everett Street’s total was less than half of that
at Sheridan Street. Turning movement count diagrams can be found in Appendix C.
Transit Service
The study corridor is well served by transit, which provides the residents several travel options (see Figure 4: Transit Network). The NJ Transit Route 400 bus has approximately 16 bus stops in Camden along the study corridor on its route from Sicklerville in southeastern Camden County, to Philadelphia, PA. This is the only
bus route that runs along the entire length of Mt. Ephraim Avenue. Headways range between 5- and 20-minute intervals on weekdays and up to an hour at night. The NJ Transit Route 453 bus runs along the southernmost segment of the corridor entering at Carl Miller Boulevard, then follows Mt. Ephraim Avenue
south, where it turns left to leave the study corridor via Ferry Avenue. This connecting service provides a link to the Ferry Avenue PATCO Station. Although Ferry Avenue Station lies outside the study area, it is still in walking distance to census tracts that are included in the study area.
Several other bus routes cross the corridor, including two that cross along Kaighns Avenue, the 452 and 460, and three that cross the northernmost terminus of the study corridor along Haddon Avenue: 403, 451, and 460. And one route, the 460 bus travels parallel to Mt. Ephraim Avenue along South 9th street two blocks to
the west.

M t . E p h r a i m A v e n u e P e d e s t r i a n R o a d S a f e t y A u d i t – C a m d e n C o u n t y 8
Figure 3: Traffic Volumes

9
Figure 4: Transit Network

M t . E p h r a i m A v e n u e P e d e s t r i a n R o a d S a f e t y A u d i t – C a m d e n C o u n t y 1 0
Environmental Justice Technical Analysis
What is Environmental Justice?
Title VI of the Civil Rights Act of 1964 and the 1994 President’s Executive Order on Environmental Justice
(#12898) state that no person or group shall be excluded from participation in, or denied the benefits of, any program or activity utilizing federal funds. Each federal agency and Metropolitan Planning Organization (MPO) is charged with evaluating their plans and programs for environmental justice (EJ) sensitivity,
including expanding their outreach efforts to low-income, minority, and other disadvantaged populations, as part of the United States Department of Transportation’s certification requirements.
Year 2010 Census Data for Degrees of Disadvantage
The quantitative methodology used to identify disadvantaged groups in the Delaware Valley is documented in the original report “…and Justice for All”: DVRPC’s Strategy for Fair Treatment and Meaningful
Involvement of All People (September 2001, #01022), and subsequent updates rely primarily on available U.S. Census data. The most recent update to this report includes seven degrees of disadvantage (DOD): minorities, Hispanics, the elderly (ages 75 and older), carless households, impoverished households, female
head of household with child, and limited English proficiency households.
A total of all persons in each demographic group—DOD—in the nine-county region is divided by the total nine-county population to obtain a regional threshold, or average. This average is used to determine if the
DODs within a given census tract meet or exceed the regional average. Each DOD within a census tract that meets or exceeds the regional average indicates the presence of a sensitive demographic population at the census tract level, making it an “environmental justice area.”
Characteristics of the Study Area Census Tracts
Table 1 below provides a DOD summary by census tract. The EJ area is located in one county, two municipalities, and involves five census tracts representing 15,501 residents. Qualifying census tracts have Mt. Ephraim Avenue as its border, or are intersected by the corridor. These tracts are predominately dense
urban residential, with a mix of retail and commercial uses along the corridor’s frontage. The densest development is found in the center of the corridor, and very low development density is found at the northern- and southernmost ends of the study area where cemeteries are located.
Table 1: Degrees of Disadvantage by Census Tract
Tracts DODs Exceeding Regional Average
Combined Tract Population
Percent of Total Tract Population
0 0 0 0%
0 1 or 2 0 0%
0 3 or 4 0 0%
4 5 or 6 13,475 87%
1 7 2,026 13%
S o u r c e : D V R P C , 2 0 1 3

1 1
Four of the five study area tracts have either five or six degrees of disadvantage represented, and one tract contained all seven degrees of disadvantage.
All five study area census tracts exceeded the regional thresholds for the following demographics:
Non-Hispanic Minority (highest tract at 77 percent; regional threshold = 27 percent)
Households in Poverty (highest tract at 71 percent; regional threshold = 12 percent)
Female Head of Household with Child (highest tract at 43 percent; regional threshold = 9 percent)
Hispanic (highest tract at 43 percent; regional threshold = 8 percent)
Limited English Proficiency (highest tract at 17 percent; regional threshold = 3 percent)
Of the four tracts that contained five degrees of disadvantage, the demographics that did not exceed the regional thresholds include elderly over 75 years of age and carless households. Only one tract in the study area exceeded the regional threshold for all seven degrees of disadvantage.
Safety Implications of the EJ Evaluation
The purpose of an EJ evaluation in an RSA is to consider factors other than roadway design and condition
that may influence the frequency and severity of crashes—specifically, in this case, pedestrian crashes—and to identify especially vulnerable populations. DVRPC’s EJ process determined that the five census tracts comprising the study corridor exceeded the regional threshold for at least five of the seven degrees of
disadvantage, and in most tracts by two or three times the average. Pedestrian crash frequency is typically higher in the urban areas of the Delaware Valley, especially in places where the demographics resemble Camden City.
Camden City is plagued by many urban ills, with poverty being one of its most pervasive problems. Urban poverty typically correlates with lower education levels, high immigrant populations that often have limited English proficiency, single mother heads of households, all of which were found in the audit study area. A
2010 study by the National Center for Biotechnology Information (National Library of Medicine) on the relationship of pedestrian injuries to socioeconomic characteristics found that “…pedestrian crashes are four times more frequent in poor neighborhoods and that neither age of the population, education, English
language fluency, nor population density explained the effect of poverty.”2
Infrastructure
Despite the poorly maintained pedestrian environment having many examples of ADA non-compliance, Mt. Ephraim Avenue does have sidewalks, crosswalks, and some curb ramps, features that many suburban and
rural locations lack. This indicates that infrastructure is only one component of a safe pedestrian environment.
Improvements to the pedestrian infrastructure can serve as a catalyst for improved safety by raising the
profile of the pedestrian and providing for safe passage by foot, which may be lacking or missing. The best designed facilities also modify driver behavior by helping to establish a pedestrian environment where drivers must slow down and be cognizant of the pedestrians sharing the facility. These benefits are typically shared
2The relationship of pedestrian injuries to socioeconomic characteristics in a large Southern California County, 2010. www.ncbi.nlm.nih.gov/pubmed/20872307

M t . E p h r a i m A v e n u e P e d e s t r i a n R o a d S a f e t y A u d i t – C a m d e n C o u n t y 1 2
with bicyclists, though providing a dedicated right-of-way is the best way to accommodate bicyclists of all skill levels.
Data-Driven Approach to Crime and Traffic Safety (DDACTS)
An increased police presence consistently enforcing traffic laws for both drivers and pedestrians is an
effective companion strategy to support improving the physical environment. Although a crime analysis was not a part of this RSA, the Mt. Ephraim Avenue corridor may also benefit from a hybrid crash and crime analysis approach called DDACTS. The National Highway Traffic Safety Administration (NHTSA) describes
DDACTS as a model that “integrates location-based crime and traffic data to establish effective and efficient methods for deploying law enforcement and other resources, by using geomapping to identify areas that have high incidences of crime and crashes.”3 DDACTS draws on the deterrent of highly visible traffic
enforcement and the knowledge that crime often involves the use of motor vehicles.
3Data-Driven Approaches to Crime and Traffic Safety. http://www.nhtsa.gov/ddacts

1 3
C H A P T E R 3
Crash Findings
Corridor-wide Crash Findings
The analysis used for the Mt. Ephraim Avenue Pedestrian RSA was based solely on reportable crashes, excluding those classified as non-reportable. Reportable crashes result in a fatality, injury, and/or property
damage of $500 or more, determined by the reporting police officer.
Corridor-wide crash characteristics that exceeded the 2010 statewide average for all county routes are discussed in the appropriate subcategory where applicable. This information, provided by the New Jersey
Department of Transportation Bureau of Transportation Data and Safety, includes a note explaining that, although crashes are declining corridor-wide over the five-year study period, a year-by-year comparison may show reductions in various categories each year that are normalized over the five-year period.
Chronology
According to the NJDOT crash database, there were 362 reportable crashes during the five-year analysis period of 2006–2010. As shown in Table 2, crashes have decreased by approximately 50 percent since 2006—a significant reduction. The highest totals were recorded in 2006 and 2007, and the decline began
starting with 2008. This trend is consistent with both the regional and national crash trends.
Table 2: Crashes by Year
Year Crashes Percent of Total
2006 93 26%
2007 93 26%
2008 72 20%
2009 63 17%
2010 41 11%
Total 362
S o u r c e : D V R P C , 2 0 1 3
Examining concentrations by month over the five-year period, the total ranged between 28 and 31 crashes in most months. The low point was 23 in June, and the high was 40 crashes in April. Crashes were steady in January and February and increased through March to the peak in April. This may be related to increased
springtime activity as the weather becomes more favorable. By day of week, crash totals were also fairly evenly spread, with 25 being the mean. Sundays were the only anomaly, with 44 recorded crashes.

M t . E p h r a i m A v e n u e P e d e s t r i a n R o a d S a f e t y A u d i t – C a m d e n C o u n t y 1 4
Regarding hour of the day, 50 percent of the crashes occurred from 12 noon through the 6 PM hour, with a lower but steady number of crashes occurring into the evening.
Severity
Regarding severity, there were two fatal crashes that killed two people, 139 injury crashes that left 206 people injured, and 221 property-damage-only (PDO) crashes (see Table 3).
Table 3: Severity Level of All People Injured Plus Pedestrians and Bicyclists
Severity All People Pedestrians Bicyclists
Unknown 2 1 0
Killed 2 1 0
Incapacitated 7 2 1
Moderate Injury 30 7 2
Complaint of Pain 169 19 8
S o u r c e : D V R P C , 2 0 1 3
One of the fatal crashes resulted in the death of a pedestrian, and 28 more pedestrians were injured, with the majority complaining of pain. No bicyclists were killed, but 11 were injured, eight of whom recorded complaint
of pain.
Both the fatal and injury crash percentages of the Mt. Ephraim Avenue corridor exceeded the 2010 state-wide averages for county routes. A year-by-year comparison to statewide averages would reveal fluctuations
that may be somewhat normalized by using five years of data.
Collision Type
The three highest collision type concentrations were rear-end (31 percent), right-angle (19 percent), and same-direction sideswipe crashes (14 percent) (see Table 4: Collision Type on next page). Rear-end and
right-angle crashes can be common in urban corridors having a high density of intersecting side-streets that become points of conflict as drivers enter and exit the roadway. The availability of on-street parking along most of the corridor contributes to the percentages of same-direction sideswipe and struck parked vehicle
crashes (9 percent), which, when combined, account for 23 percent of the crash total. Same-direction sideswipe, struck parked vehicle, and backing crashes exceeded the statewide average, though none by more than three percentage points.
Both pedestrian and bicyclist crashes were about four times the statewide averages in each of those collision type categories. The 28 pedestrian crashes were 7.7 percent of the total, as compared to the 2010 county route average of 1.9 percent, and bicyclist crashes were 3.6 percent while the statewide average was 0.9
percent. As stated earlier, these percentages are typically higher in urban areas, and as was described in the Environmental Justice evaluation, pedestrian crashes correlate strongly with economically challenged urban areas. This is to say that the problem is more acute in such environments, and that they are good places to
start when seeking to improve safety, highlighting the need for physical improvements combined with education, policy, and enforcement initiatives.

1 5
Table 4: Collision Type
Collision Type Count Percentage Same Direction (Rear-End) 110 31%
Right Angle 68 19%
Same Direction (Sideswipe) 50 14%
Struck-Parked-Vehicle 31 9%
Pedestrian 28 8%
Left Turn/U-Turn 20 5%
Backing 18 5%
Hit-Fixed-Object 12 3%
Pedalcyclist 13 4%
Encroachment 5 1%
Opposite Direction (Sideswipe) 4 1%
Opposite Direction (Head-on) 2 .5%
Other 1 .25%
S o u r c e : D V R P C , 2 0 1 3
Roadway Surface and Lighting Conditions
Eighty-five percent of the corridor-wide crashes occurred on dry road surface conditions, 12 percent on wet
surface, and the remainder on snowy or icy surface conditions (see Table 5: Road Surface and Illumination). This distribution suggests that road surface was not a factor contributing to crash frequency. Light condition is less typical in that only 63 percent of the total occurred in daylight, and 34 percent occurred at night.
According to the 2010 statewide average for county routes, daylight crashes typically account for 71 percent of all crashes. Mt. Ephraim Avenue’s overrepresentation may be related to poor lighting and increased nighttime activity. No other overrepresentations of note were identified.
Table 5: Road Surface and Illumination
Category Condition Crashes Percentage
Road Surface Dry 308 85%
Wet 42 12%
Snowy 6 2%
Ice 5 1%
Unknown 1 0.28%
Illumination Daylight 229 63%
Dusk 6 2%
Night 122 34%
Dawn 2 1%
Unknown 3 1%
S o u r c e : D V R P C , 2 0 1 3

M t . E p h r a i m A v e n u e P e d e s t r i a n R o a d S a f e t y A u d i t – C a m d e n C o u n t y 1 6
Corridor-wide Summary
Table 6 highlights significant data indicators considered in the corridor-wide analysis. Although crashes declined steadily between 2006 and 2010, pedestrian and bicyclist crashes remained a problem, as well as
nighttime and injury crashes.
Table 6: Corridor-wide Statistics Summary
Issue Mt. Ephraim Avenue
Five-year crash trend (’06–’10) Down Highest crash months March, April
Highest crash days Sunday (twice the number of Friday crashes)
Hourly crash trends Midday, PM rush hour Collision type overrepresentations Same-direction sideswipe, struck-parked-vehicle, left/U-
turn, backing, pedestrian, bicyclist Injury crashes Overrepresented
Surface condition and illumination 85% dry/34% nighttime Noteworthy pre-crash actions Stopped in traffic, making a left turn, parked
S o u r c e : D V R P C , 2 0 1 3
Analysis by Cross-Section Geometry
The Mt. Ephraim Avenue crash experience was also considered according to crash rate4 by cross-section
geometry which yielded two analysis sections: 1) southern section: mile post 0.01–0.42, and 2) northern section: mile post 0.42–1.43. NJDOT provided crash rates and crash summaries for each section and statewide average crash rates per cross-section geometry for comparison based on a three-year crash
history (’08–’10). Section 1—four or more lanes, no median, and no shoulder—had a crash rate of 10.12, almost double the statewide average of 5.95. Section 2—two lanes, no shoulder—had a crash rate of 21.92, five times the statewide rate of 4.04. As cautioned by our NJDOT Bureau of Transportation Data and Safety
colleagues, crash rates calculated for roadway sections of less than one mile may yield higher than anticipated results. This evaluation is a standard procedure for comparing a roadway section to statewide averages of like cross-section types for context. The crash trend on Mt. Ephraim Avenue is significant for its
context and is especially concerning given the number of pedestrian crashes. A map of the crash rate sections is available in the PowerPoint presentation included in Appendix C.
Crash Frequency by Mile Post
The crash frequency by mile post map (Figure 5) depicts a bar graph representing crash concentrations by
mile post aligned with an aerial view map of the corridor. Crashes are coded to a two-decimal place tolerance, which allows for locating crashes within approximately 50 feet of one another. This map allows the RSA team to identify sections of the study corridor that may need additional consideration.
This map shows that the single highest concentration mile post location was 1.40 (about 27 crashes), within the catchment area of the CR 561 (Haddon Avenue) intersection. This is just north of one of two low crash 4Crash rate: crashes per million vehicle miles traveled.

1 7
concentration areas, both at the corridor’s two cemeteries. The first, in the southern end of the study area, is the Evergreen/New Camden Cemetery between Ferry Avenue and Sayre Avenue, and the second, in the
north end, is the Old Camden Cemetery between Mt. Vernon Avenue and Division Street.
The highest concentration area is within the two-lane section between Carl Miller Boulevard and Whitman Avenue (about 0.35 miles). This is also the corridor’s most densely populated and developed section. This
map exemplifies the correlation of higher development densities with higher crash frequency, but there is more to consider than just increased exposure because of higher levels of pedestrian activity and many turning opportunities.
Just by the fact that a location is urban and densely developed does not necessarily mean that crashes will be more common. The state of repair of the transportation infrastructure, the details of the roadway design, law enforcement presence, and the state of the local economy, among other things, are all factors
contributing to the crash experience.
M t . E p h r a i m A v e n u e P e d e s t r i a n R o a d S a f e t y A u d i t – C a m d e n C o u n t y 1 8
Figure 5: Crash Frequency by Milepost
S o u r c e : D V R P C , 2 0 1 3

1 9
Pedestrian and Bicyclist Crashes
The primary focus of this road safety audit was pedestrian crashes and the pedestrian environment of the
study corridor. Although road safety audits typically consider pedestrian issues, the Mt. Ephraim Avenue Pedestrian RSA study team concentrated on safety from the pedestrian’s perspective in all three components of the audit process. Also important was the condition of the bicycling environment and the
location and circumstances of each bicycle crash, as well as the pedestrian crashes. Although unique, walking and biking issues are often related in how these modes interact with vehicle traffic and how they must navigate the system.
Pedestrian Crash Statistics and Findings
There were 28 pedestrian crashes in the study corridor, representing eight percent of the five-year total of all crashes (see Figure 6: Bicyclist and Pedestrian Crash Concentrations). These crashes, similar to the corridor-wide crash trend, have declined from seven in 2006 to three in 2010. With force reductions in the
Camden City police department in recent years (according to audit team members and recent news), it is possible that these reductions may be partly due to underreporting; this may also have affected the corridor-wide crash totals. This is an important consideration since the pedestrian crashes and fatalities in the state of
New Jersey have increased in recent years (141 in 2010, and 143 in 2011), while total crash deaths have declined. Despite the drop in pedestrian crashes, the average share of pedestrian crashes for all county routes in the state is about two percent annually,5 thus Mt. Ephraim Avenue remains overrepresented. Of the
28 pedestrian crashes, one resulted in a fatality and 27 were injury crashes.
In an effort to learn more about the pedestrian crashes and to better identify improvement opportunities, the crashes were analyzed as a subset, as well as part of the corridor-wide total. The following findings should
be noted:
12 occurred at an intersection, and16 were between intersections (midblock);
32 percent involved a driver making a left turn;
10 crashes involved a hit and run situation;
82 percent occurred on dry road surface, meaning that inclement weather was not a contributing factor;
50 percent at occurred night (7 PM to midnight), well above the corridor-wide total crash percentage of 34 percent;
29 percent on occurred on Saturdays;
Victims’ ages: 6–17 (four crashes), 18–64 (21 crashes), unknown age (3 crashes).
5http://www.state.nj.us/transportation/refdata/accident/10/ARDSMRPT02.2010.pdf

M t . E p h r a i m A v e n u e P e d e s t r i a n R o a d S a f e t y A u d i t – C a m d e n C o u n t y 2 0
Bicyclist Crash Statistics and Findings
There were 13 bicyclist crashes, representing four percent of the five-year total of all crashes on the corridor. These crashes followed no real trend by year but saw a spike of five in 2008, and the remaining four years
had either three or one in each. The average share of bicyclist crashes for all county routes in the state is about one percent annually,6 thus Mt. Ephraim Avenue is again overrepresented.
Of the 13 bicyclist crashes, none resulted in a fatality, 11 were injury crashes, and two were property
damage only. As done with the pedestrian crashes, the bicyclist crashes were analyzed as a subset, as well as part of the corridor-wide total in an effort to identify improvement opportunities. The following findings should be noted:
Nine occurred at an intersection, and four were between intersections (midblock);
“Driver going straight” was the most common pre-crash action in 46 percent of the crashes;
Four crashes involved a hit and run situation;
All 13 crashes occurred on dry road surface, thus weather was not a factor;
Almost half (46 percent) of the crashes occurred at night (6 PM–1 AM)—as with the pedestrian crashes, this is well above the corridor-wide total nighttime crash percentage of 34 percent;
Most crashes occurred on Saturdays (5 = 38.5 percent), as did the pedestrian crashes;
Victims ages: 12–17 (1 crash), 18–64 (11 crashes), unknown (1 crash).
Pedestrian and Bicyclist Crash Concentrations
Pedestrian crash concentration areas were identified through the mapping process. Along the stretch of Mt. Ephraim Avenue between Carl Miller Boulevard and Jackson Street, there were 14 pedestrian crashes and
three bicyclist crashes. This segment is 0.12 miles long and had 50 percent of the pedestrian crashes and 23 percent of the bicyclist crashes. Within this concentration, nine of the 14 crashes occurred on the one-block stretch from Sheridan Street to Jackson Street (one-way eastbound). This section of the corridor is
predominantly retail and home to Bonsall Elementary School, which is located on the north side Jackson Street.
6http://www.state.nj.us/transportation/refdata/accident/10/ARDSMRPT02.2010.pdf

2 1
Figure 6: Bicyclist and Pedestrian Crash Concentrations
Aerial Imagery, DVRPC 2010

M t . E p h r a i m A v e n u e P e d e s t r i a n R o a d S a f e t y A u d i t – C a m d e n C o u n t y 2 2

2 3
C H A P T E R 4
Findings and Recommendations
The following section summarizes the findings, potential strategies, and priorities of the Mt. Ephraim Avenue Pedestrian RSA in Camden City, New Jersey, using tables and corresponding maps. The table for each section shows site-specific safety issues and potential strategies, general ratings for difficulty to implement,
proposed safety benefits, and responsible agency. An aerial map indicating the relative location of each identified issue (where possible) is paired with each table.
DVRPC uses the following general descriptions to characterize each of the three ratings associated with the
“difficulty to implement” category:
Low—can be accomplished through maintenance;
Medium—requires use of existing or new contract and some engineering, and funding may be
readily available; and
High—longer-term project, may need full engineering, and may require right-of-way acquisition and new funding.
The following abbreviations are used in the tables: SB–southbound, NB–northbound, WS–west side, ES–east side, NS–north side, SS–south side, SW–southwest, SE–southeast, TBD–to be determined, ADA–Americans with Disabilities Act, RRFB–Rectangular Rapid Flashing Beacon, HAWK–High-Intensity Activated
crossWalk beacon.
Yellow highlighting identifies those issues that have a low rating for difficulty to implement. These improvements can typically be addressed through maintenance, or without beginning a new planning or
engineering effort. It is expected that implementing these recommendations will improve the safety and operations along the study corridors. Note that potential strategies that call for further study do have a safety benefit because they are the next step toward a more detailed and appropriate safety improvement. Given
fiscal constraints, recommendations may be considered one at a time or in small groups.
Being the roadway owner, Camden County should use the findings of the RSA as a guide for designing improvements to address these issues. Whereas the RSA findings are numerous, Camden County should
use its experience in safety engineering to determine which issues from the table will yield the highest safety benefit given limited funds.
Audit Team Priorities
The audit process provides an opportunity for the audit team members to advocate for what they consider the single most important issue to be addressed as a result of the audit. These items are important because they are endorsed by individuals who spent the day familiarizing themselves with the corridor’s statistics,
listening to the perspectives of the local participants including local police, and experiencing the issues first-

M t . E p h r a i m A v e n u e P e d e s t r i a n R o a d S a f e t y A u d i t – C a m d e n C o u n t y 2 4
hand having walked the entire corridor during the field visit. Camden County, the roadway owner, is encouraged to consider the following items both in follow-up maintenance work, and to give them a high
priority when doing long-term planning for the corridor:
Re-stripe all pavement markings: centerline, edge line, stop bars, shoulders, crosswalks (where existing), no parking zones at corners, school zones, and lane designation;
Replace and/or upgrade all signs where needed;
Upgrade pedestrian environment to meet ADA standard, including installing or repairing curb ramps, installing missing crosswalks, widening sidewalks, adjusting cross slopes, and installing pedestrian countdown timers per new MUTCD recommendations;
Address the issues identified at the intersection of Mt. Ephraim and Haddon Avenues (see panel discussion in Panel 8);
Upgrade all drainage inlets to bike-safe inlets.
Road Owner Response
An important part of the audit process is the road owner’s response: an acknowledgment of the audit’s findings and recommendations, and their planned follow-up. Camden County delivered their response
following the finalization of the findings and recommendations table.
In responding to the RSA’s findings, the road owner must bear in mind all the competing objectives involved when implementing the recommendations, and foremost among them is available resources. Because the
audit process generated a long and wide-ranging list of improvements, the road owner is expected to implement as time and funds allow in coordination with other projects and priorities. The safety issues table should feed development of long-term improvement projects and serve as a punch list of maintenance tasks.
As mentioned, items highlighted in yellow are considered low difficulty to implement and will produce a high safety benefit. These should be priority items.
Camden County’s response sheet indicated that “although the difficulty to implement something might be low
and easily accomplished through maintenance, at this time the County is not in a position (financially) to be able to commit a time frame for when these improvements will be implemented.” The complete response sheet, found in Appendix B, lists items from the corridor-wide list that will be addressed during regularly
scheduled maintenance, including the following:
Replace drainage grates where needed;
Repaint all line striping;
Repave the roadway;
Address all sign issues;
Address crosswalk issues and make curb ramps ADA compliant.
DRVPC was fortunate to have worked closely with Camden County on the selection of the audit corridor, and as an audit team member, and will continue to collaborate with them on securing federal safety funds to implement audit recommendations.

2 5

M t . E p h r a i m A v e n u e P e d e s t r i a n R o a d S a f e t y A u d i t – C a m d e n C o u n t y 2 6
Figure 7: Panel 1 (Ferry Avenue intersection and north to cemetery)

2 7
Table 7: Panel 1 (Ferry Avenue intersection and north through cemetery)
S o u r c e : D V R P C , 2 0 1 3
M t . E p h r a i m A v e n u e P e d e s t r i a n R o a d S a f e t y A u d i t – C a m d e n C o u n t y 2 8
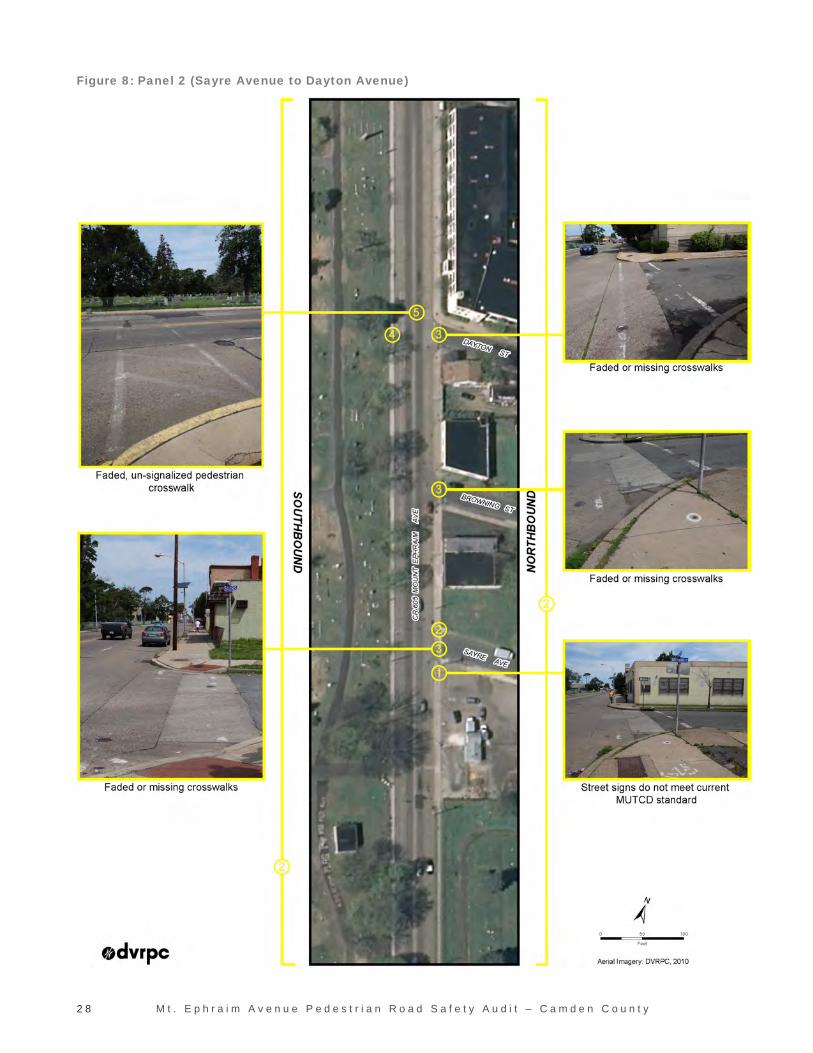
Figure 8: Panel 2 (Sayre Avenue to Dayton Avenue)

2 9
Table 8: Panel 2 (Sayre Avenue to Dayton Avenue)
S o u r c e : D V R P C , 2 0 1 3

M t . E p h r a i m A v e n u e P e d e s t r i a n R o a d S a f e t y A u d i t – C a m d e n C o u n t y 3 0
Figure 9: Panel 3 (Decatur Street to Jackson Street)

3 1
Table 9: Panel 3 (Decatur Street to Jackson Street)
S o u r c e : D V R P C , 2 0 1 3

M t . E p h r a i m A v e n u e P e d e s t r i a n R o a d S a f e t y A u d i t – C a m d e n C o u n t y 3 2
Figure 10: Panel 4 (Chase Street to Everett Street)

3 3
Table 10: Panel 4 (Chase Street to Everett Street)
S o u r c e : D V R P C , 2 0 1 3

M t . E p h r a i m A v e n u e P e d e s t r i a n R o a d S a f e t y A u d i t – C a m d e n C o u n t y 3 4
Figure 11: Panel 5 (Whitman Avenue to Mechanic Street)

3 5
Table 11: Panel 5 (Whitman Avenue to Mechanic Street)
S o u r c e : D V R P C , 2 0 1 3

M t . E p h r a i m A v e n u e P e d e s t r i a n R o a d S a f e t y A u d i t – C a m d e n C o u n t y 3 6
Figure 12: Panel 6 (Liberty Street to Sycamore Street)

3 7
Table 12: Panel 6 (Liberty Street to Sycamore Street)
S o u r c e : D V R P C , 2 0 1 3

M t . E p h r a i m A v e n u e P e d e s t r i a n R o a d S a f e t y A u d i t – C a m d e n C o u n t y 3 8
Figure 13: Panel 7 (Chestnut Street to Walnut Street)

3 9
Table 13: Panel 7 (Chestnut Street to Walnut Street)
S o u r c e : D V R P C , 2 0 1 3

M t . E p h r a i m A v e n u e P e d e s t r i a n R o a d S a f e t y A u d i t – C a m d e n C o u n t y 4 0
Figure 14: Panel 8 (Spruce Street to Haddon Avenue)

4 1
Table 14: Panel 8 (Spruce Street to Haddon Avenue)
S o u r c e : D V R P C , 2 0 1 3

M t . E p h r a i m A v e n u e P e d e s t r i a n R o a d S a f e t y A u d i t – C a m d e n C o u n t y 4 2
Table 15: Corridor-wide Issues and Strategies
S o u r c e : D V R P C , 2 0 1 3

4 3
S o u r c e : D V R P C , 2 0 1 3

M t . E p h r a i m A v e n u e P e d e s t r i a n R o a d S a f e t y A u d i t – C a m d e n C o u n t y 4 4

4 5
C H A P T E R 5
Conclusion
The Mt. Ephraim Avenue Pedestrian RSA was conducted to identify issues that compromise the walking and biking environment, making it undesirable and potentially dangerous to pedestrians and bicyclists. The team identified a long list of issues from the field visit, as well as many practical short- and long-term
improvements during the post-audit.
The recommendations documented in this report are designed to improve safety for those using Mt. Ephraim Avenue. Some of the strategies identified can be implemented through routine maintenance; all will be
constrained by available time and budgetary priorities. The audit process and the resulting final document highlight the safety issues posed to pedestrians and bicyclists and present the needed improvements by location organized for systematic implementation by the roadway owner.
When it comes to improving safety, engineering strategies alone only go so far. This is especially true when trying to address pedestrian safety in an economically challenged location like Camden City, as demonstrated in the Environmental Justice analysis. Education, with support from a targeted enforcement
campaign, is an effective approach for addressing the driver behaviors that lead to crashes. In addition, policy actions can provide the legal weight needed to motivate people to be safer and more conscientious drivers, as well as pedestrians and bicyclists. Employing a multipronged approach that includes engaging the
appropriate stakeholders is an effective course of action to advance the goal of improved safety on the corridor. Those stakeholders are the roadway owners (Camden County), the police department, and the Office of the Mayor of Camden.
It is recommended that the issues highlighted in yellow (from the preceding section) be implemented first because they are typically easier to implement and are projected to have a medium or high safety benefit. Many of these items are low-cost safety improvements, such as signs and pavement markings, and can be
implemented through the existing maintenance schedule.

M t . E p h r a i m A v e n u e P e d e s t r i a n R o a d S a f e t y A u d i t – C a m d e n C o u n t y 4 4

A P P E N D I X A


A – 1
Audit Team
Name Agency
Gary Chambers Camden County Engineering
Andrew Levecchia Camden County Improvement Authority
Uzo Ahiarakwe City of Camden Planning and Engineering
Officer Vallen City of Camden Police
Regina Moore DVRPC
Kevin Murphy DVRPC
Dan Nemiroff DVRPC
Donald Powers DVRPC
Caroline Trueman FHWA – NJ
Jay Wolf New Jersey State Police
Ray Reeve NJ Division of Highway Traffic Safety
Virgilio Tan NJDOT Bureau of Transportation Data and Safety
Beth Waltrip NJTransit
Sally Karasov Rutgers University TSRC
Andy Kaplan Rutgers University TSRC
Jennifer Marandino South Jersey Transportation Planning Organization


A P P E N D I X B


B – 1
Road Owner Response
Camden County Response to Mt. Ephraim Avenue Pedestrian RSA
Corridor-wide Issues
Although the difficulty to implement something might be low and easily accomplished through maintenance at this time the County is not in a position (financially) to be able to commit a time frame for
when these improvements will be implemented.
The responses below indicate if we agree or disagree with the assessment but should in no way be perceived as a commitment to the implementation of such suggestions.
Rather than focus on each individual item Panel by Panel, I am focusing on the eleven (11) Corridor-wide Issues.
Corridor-wide Issues
1. Agree – drainage inlets can be updated and replaced during the next regularly scheduled maintenance event.
2. Although the line striping issues can and will be addressed during the next regularly scheduled
maintenance event, the County does not enforce or delineate statutory parking restrictions, as these issues are a municipal responsibility.
3. Agree - Roadway pavement conditions are poor and will be added to the next regularly scheduled
maintenance event for this corridor.
4. Sidewalk issues – the county does not maintain sidewalk issues on any county highway. Sidewalk maintenance is the responsibility of the municipality.
5. The movement and replacing of utility poles is a very expensive task. The benefit is low; therefore, unless the county receives funding for the complete reconstruction of the highway, this is a task that is a low priority for the county.
6. Agree – all road striping will be updated during the next regularly scheduled maintenance event for this corridor.
7. Agree – all signage issues will be addressed during the next regularly scheduled maintenance event
for this corridor.
8. Agree – all crosswalk and ADA-compliant curb ramps will be updated during the next regularly scheduled maintenance event for this corridor. Please note that the county does not promote the use of,
nor will it maintain any mid-block crosswalks. If a municipality is interested in a mid-block crosswalk, several steps are required by the county concluding with a Freeholder Resolution dedicating all responsibilities of the mid-block crosswalk to the municipal entity.

B – 2
9. Agree – the county agrees with the assessment but cannot define a course of action until a full engineering review of the corridor is completed to determine if the cart way can be redesigned to
accommodate a bike lane.
10. Transit issues along the corridor are not the responsibility of the County. Placement of bus stops and shelters is the sole responsibility of the municipality.
11. Agree – traffic enforcement is not something that Camden County is responsible for, and this issue will have to be addressed by the municipality or new Metro Division of the Police force.

A P P E N D I X C


1
Mt. Ephraim Avenue (CR 605)Pedestrian Road Safety Audit
Wednesday, June 13, 2012
Camden City, NJ
DVRPC – Delaware Valley Regional Planning Commission• Metropolitan Planning Organization of the Delaware Valley
serving 9 counties:– PA: Bucks, Chester, Delaware, Montgomery, and Philadelphia
– NJ: Burlington, Camden, Gloucester, and Mercer
• Transportation Improvement Program (TIP)– DVRPC facilitates a regional body to oversee allocation of federal
transportation funds

2
Audit Team Introductions
Name
Affiliation
Mt. Ephraim Avenue (CR 605)
• Why this route?– High pedestrian-crash county route corridor
– Identified in a network screening performed by Rutgers TSRC using Plan4Safety
– Response to New Jersey’s pedestrian crash trend
• Collaboration among:– FHWA-NJ
– NJDOT
– Camden County Planning & Engineering
– City of Camden
– DVRPC’s Office of Transportation Safety and Congestion Management

3
RSA Schedule
1. Pre-Audit Meeting - 8:30 AM– Analyze and discuss study area crash data and related safety issues
2. Field Visit– Foot survey of the corridor to identify safety issues and examine conditions
– Lunch
3. Post Audit Meeting– Define problems
– Brainstorm improvement ideas
– Wrap up by 4:30 PM
What is a Road Safety Audit?
• Federal Highway Administration Road Safety Audit Video

4
What is a Pedestrian RSA?
• An RSA is a safety performance examination of an existing or future road or intersection by an independent, multidisciplinary audit team
• A Pedestrian RSA considers pedestrian (and bicyclists) crashes, and their circumstances, more closely
History of RSAs
• First used in the United Kingdom in 1980s
• Australia and New Zealand have used RSAs since the 1990s
• Formal practice in the United States began in 1997 when the Federal Highway Administration sponsored a pilot program in 13 states
• Pedestrian-specific RSAs even more recent (NJ 70 Ped RSA: 2008)
• FHWA-sponsored Ped RSA held at DVRPC on May 1, 2012

5
Benefits
• Adaptable to local needs and conditions
• Short term
• Recommendations can be implemented in small stages as time and resources permit
• An audit can be performed during any stage of a project
How are RSAs conducted?
Source: VHB

6
Audit Team• FHWA-NJ• NJDOT Bureau of Safety Programs• Camden County Planning & Engineering• City of Camden• City of Camden Police Department• New Jersey Division of Highway Traffic Safety • Rutgers Transportation Safety Resource Center• NJ Transit• Bicycle Coalition of Greater Philadelphia• Cross County Connection TMA• South Jersey Transportation Planning Organization• DVRPC
– Office of Safety & Cng Mgmt, and Office of Transit, Bike and Ped Plng
Audit Materials
• Location Maps/Aerials
• Crash Data– Data Summaries
– Analysis
• Traffic Counts– AADTs
– Turning Movement Counts
• Checklist
• Field Note Sheets

7
Study Area: Mt. Ephraim Avenue
Land Use• Dense urban environment• Mix of commercial and
residential on street front• Serves as main street for
larger residential area• Very active street life• Urban ills
Insert Kensington Avenue Study area Map
Operational Characteristics
Roadway• 1.43 miles• Two-way street• Orientation: North-south• Ferry Ave. to Decatur St.:
• 4 lanes, no shoulder• Decatur St. to Haddon Ave.:
• 2 lanes, parking • Sidewalks throughout • No bike lanes• Speed limit: 35 mph• 35 Intersections:
– 8 signalized intersections– 22 unsignalized

8
Traffic VolumesAADTs• South of Sayre Ave.: aprx 12,000
vehicles per day (VPD)• Center of corridor near Thurman
St.:11,500 VPD • North of Kaighns Ave.: aprx. 10,500 VPD
Pedestrian Volumes • Near Everett St.: aprx. 700 people per
direction• Near E Chestnut St.: aprx. 200 – 300
people per direction• Near Spruce St.: aprx. 271 people
northbound, 166 southbound
Bicyclist Volumes • Near Sayre Ave.: aprx. 20 total volume• Near Spruce St.: aprx. 21 total volume
Insert Mt Ephraim Ave Traffic Volumes Map
Peak Hour Turning Movement Counts at Sheridan Street
• Intersection volumes (combined)– AM = 1,446 vehicles
– PM = 2,136 vehicles
• Higher volumes – Mt. Ephraim Avenue through movements,
especially in the PM
• Higher volumes – < 50 vehicles turning in and out of Sheridan
Ave. in the AM. Higher turning movements made from Sheridan Street (eastside) in the PM

9
Peak Hour Turning Movement Counts at Jackson Street
• Intersection volumes (combined)– AM = 859 vehicles
– PM = 1,158 vehicles
– No counts taken at Jackson St. westside
• Higher volumes – Mt. Ephraim Avenue through movements,
especially in the PM
• Lower volumes – < 50 vehicles turning into Jackson St.
Peak Hour Turning Movement Counts at Everett Street
• Intersection volumes (combined)– AM = 617 vehicles
– PM = 940 vehicles
• Higher volumes – Mt. Ephraim Avenue through
movements, especially in the PM
• Higher volumes – < 50 vehicles turning in and out of
Everett Street
– Barely any vehicles turning onto Everett Street (westside)

10
Buses along the corridorNJ Transit 400 Bus •Follows Mt. Ephraim Ave through the entire study length on its route from Sicklerville to Philadelphia
•Runs at 5-20 minute intervals on weekdays and up to an hour at night
•Hours of operation are from 4:47 AM to 3:22 AM
•Ridership in May 2011 was 5,247 on weekdays, 3,715 on Saturday, and 2,307 on Sunday. This is an increase over the 4,595 recorded on weekdays in 2004.
•There are aprx.16 route 400 Bus stops in the study area
NJ Transit Bus 453 •Runs only in the southernmost section with two stops in the study area
Buses crossing the corridor•NJ Transit 452 and 460 Buses cross the corridor at Kaighns Avenue
Rail•The PATCO High Speed Line-no at grade crossings
•Closest station: Ferry Avenue (outside study area)
Insert NEW Mt Ephraim Ave Transit Map
Transit
Crash Data
Reportable crashes• Reportable criteria: personal injury, or minimum $500 of property damage, determined by
officer on the scene
Data Analysis Period• 2006 – 2010
NJDOT Bureau of Safety Programs• Police reports, details sheets, crash rates

11
Corridor-wide Crash FindingsYEAR
ReportableYEAR TOTAL PERCENTAGE2006 93 26%
2007 93 26%
2008 72 20%
2009 63 17%
2010 41 11%
Total 362
Corridor-wide Crash Findings MONTH OF YEAR

12
DAY OF WEEK
Corridor-wide Crash Findings
TIME OF DAY
Corridor-wide Crash Findings

13
COLLISION TYPE
Total Crashes PercentageSame Direction (Rear End) 110 31%Right Angle 68 19%Same Direction (Sideswipe) 50 14%Struck Parked Vehicle 31 9%
Pedestrian 28 8%
Left Turn/U Turn 20 5%
Backing 18 5%
Fixed Object 12 3%
Pedalcyclist 13 4%
Encroachment 5 1%
Opposite Direction (Sideswipe) 4 1%
Opposite Direction (Head-on) 2 .5%
Other 1 .25%
Corridor-wide Crash Findings
CRASH SEVERITY
Corridor-wide Crash Findings

14
ENVIRONMENTAL CONDITIONS
Total Crashes Percentage
Road Surface
Dry 308 85%
Wet 42 12%
Snowy 6 2%
Ice 5 1%
Unknown 1 0.28%
Illumination
Daylight 229 63%
Dusk 6 2%
Night 122 34%
Dawn 2 1%
Unknown 3 1%
Corridor-wide Crash Findings
DRIVER PRE-CRASH ACTIONS
Corridor-wide Crash Findings
Total Crashes PercentageGoing Straight Ahead 286 41.5%
Stopped in Traffic 100 14.5%
Making Left Turn 64 9.3%
Slowing or Stopping 57 8.3%
Parked 40 5.8%
Starting in Traffic 38 5.8%
Making Right Turn (not on red) 34 4.9%
Backing 20 2.9%
Changing Lanes 10 1.5%
Starting from Parking 10 1.5%
Passing 7 1.0%

15
Corridor-wide Crash Findings SUMMARY
Issue Mt. Ephraim Ave.
Five-year trend Down
Highest Crash Months March, April
Highest Crash Days Sunday (2x Friday)
Daily Trends Midday, PM rush hour
Collision Type OverrepresentationsSDSS, Parked Vehicle, LT-UT, Backing, Ped,
Bike
Injury Crashes Over-represented
Surface Cond./Illumination Dry / 34% Nighttime
Pre-crash Actions of Note Stopped in traffic, Making a left turn, Parked
Crash Rates by Cross-section Type
Summary • Crash Rate – crashes per million vehicle miles
traveled• Compared to the statewide crash rates for like
facilities• Three-years of data: 2008-2010
Two Cross-section Types1. 4 or more lanes, no median, no shoulder, crash
rate = 10.122. 2 lanes, no shoulder, crash rate = 21.92
Considerations• Rates are effected by land use, e.g. parking• Short sections of roadway typically have
higher rates

16
Crash Frequency by Mile Post
Summary: • Highest concentration: within the 2-lane
section, specifically between Carl Miller
Blvd. and Whitman Ave.
• Lowest concentrations (2):
• Evergreen/New Camden Cemeteries
frontage – north of Ferry Ave. to Carl
Miller Blvd.
• Old Camden Cemetery/PATCO – Mt.
Vernon Ave. to Division St.
• Observation
• Higher land use density coincides with
crash frequency on study corridor
Pedestrian Crashes
Summary: • 28 pedestrian crashes
• 1 fatal (Atlantic Ave.)• 27 injury crashes
• 12 at intersection, 16 between
• Making left turn (driver) – 32%
• Hit and run = 10
• 82% on dry surface
• 50% at night (7PM – midnight)
• 29% on Saturdays• Victim ages:
• 6-17 = 4• 18-64 = 21• Unknown = 3
• Drop in 2010

17
Bicyclist Crashes
Summary: • 13 bicyclist crashes
• 11 injury crashes
• 2 PDO
• 9 at intersection, 4 between
• Going straight (driver) – 46%
• Hit and run = 4
• All on dry surface
• 46% at night (6PM – 1AM)
• 38.5% (5) on Saturdays
• Victim ages:
• 12-17 = 1
• 18-64 = 11
• Unknown = 1
• Drop in 2010
Bicyclist and Pedestrian Crash Concentration Areas
Observations: • Several concentration areas,
though not isolated to single intersections
• One major concentration area: Carl Miller Blvd. To Chase St.
• Bicyclist crashes - more of a corridor-wide problem, smaller concentrations do exist
Observations: • Several concentration areas,
though not isolated to single intersections
• One major concentration area: Carl Miller Blvd. To Chase St.
18
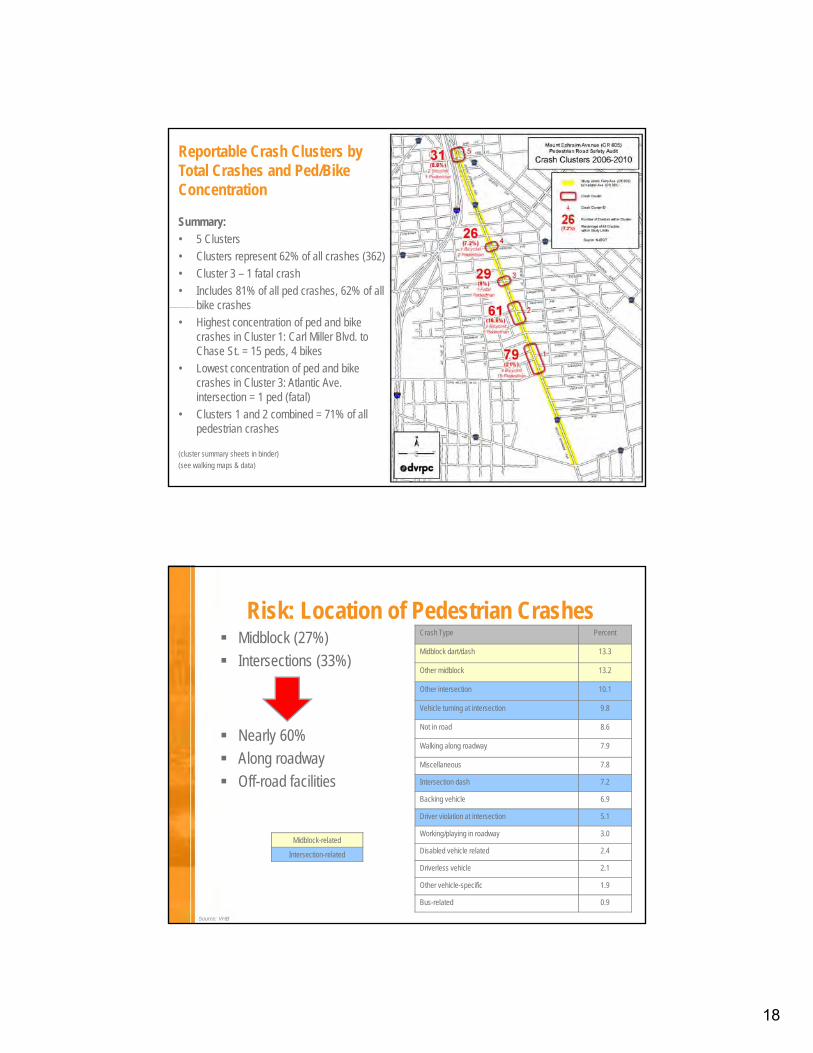
Reportable Crash Clusters by Total Crashes and Ped/Bike Concentration
Summary: • 5 Clusters
• Clusters represent 62% of all crashes (362)
• Cluster 3 – 1 fatal crash
• Includes 81% of all ped crashes, 62% of all bike crashes
• Highest concentration of ped and bike crashes in Cluster 1: Carl Miller Blvd. to Chase St. = 15 peds, 4 bikes
• Lowest concentration of ped and bike crashes in Cluster 3: Atlantic Ave. intersection = 1 ped (fatal)
• Clusters 1 and 2 combined = 71% of all pedestrian crashes
(cluster summary sheets in binder)
(see walking maps & data)
Risk: Location of Pedestrian Crashes Midblock (27%)
Intersections (33%)
Nearly 60%
Along roadway
Off-road facilities
Crash Type Percent
Midblock dart/dash 13.3
Other midblock 13.2
Other intersection 10.1
Vehicle turning at intersection 9.8
Not in road 8.6
Walking along roadway 7.9
Miscellaneous 7.8
Intersection dash 7.2
Backing vehicle 6.9
Driver violation at intersection 5.1
Working/playing in roadway 3.0
Disabled vehicle related 2.4
Driverless vehicle 2.1
Other vehicle-specific 1.9
Bus-related 0.9
Midblock-related
Intersection-related
Source: VHB

19
Crosswalks and Pedestrian SignalsWell designed and properly located crosswalks and signals:
– Inform motorists of the location of a pedestrian crossing
– Inform pedestrians where to cross
– Consider needs of users with disabilities
– Made with high-visibility markings
– Easily understood
– Use countdown timers
– Provide adequate crossing time
Source: VHB
Signal Timing and Phasing Walk Signal and Clearance Interval
– Revisions to the MUTCD
– Average walking speed reduced- 4 ft/s to 3.5 ft/s
Longer Cycle Lengths– Increase delay
– Reduce likelihood that pedestrians will wait
Signal Phasing– Left-turn conflicts with permissive phasing
– Potential for long delay or confusion with split phasing
Source: VHB

20
Features that Affect Bicyclists
Source: VHB
• Uneven surfaces, pavement deterioration– Impact bicyclists more than motorist
– Can throw rider off balance
• Raised utility covers and drainage grates, openings perpendicular to direction of travel
• Traffic speed
• Traffic volume
• Parking
• Bus activity
• Pedestrians
Pedestrian RSA Guidelines
The Pedestrian RSA Prompt Lists are a useful tool for RSA teams to:
• Review prior to field visits
• Take along in the field
• Write RSA report
(FHWA Master Prompt List in binder)
Source: VHB

21
Field Visit Itinerary
• Start at southern end
– Ferry Avenue intersection
• Stop at northern end
– Haddon Avenue intersection
Field View Checklist• Drainage
– Inlets bicycle compatible
• Public utilities• Does placement obstruct sight line, or pedestrian path• Access management
– Driveway spacing, redundancy
• Lighting• Driver expectation
– Sight distance adequate for pedestrians– Street signs visible
• Transit considerations• Pedestrian crossings
– Curb ramps in place– Crosswalks adequately marked
• Pavement markings and lane delineation

22
Field View
• Material– Notes sheet– Aerial maps
• Vests
Nighttime Video

23
Post Audit Analysis
• Debriefing from field visit
• Define the problems
• Next steps
• Target finish: 4:30 PM
QUESTIONS ?


Publication Title: Mt. Ephraim Avenue (CR 605) Pedestrian Road Safety Audit
Publication Number: 11035
Date Published: June 2013
Geographic Area Covered: Camden City in Camden County, New Jersey
Key Words: Road safety audit, RSA, pedestrian, bicyclist, walking, biking,
crashes, injuries, fatalities, issues, strategies, traffic signal, crossing, intersection, engineering, enforcement, education, stakeholders, prioritize, behavior, speed limit, traffic volumes, stakeholders, audit
team, geometry, pavement markings, signs, crosswalk, sidewalk, CR 605.
Abstract: This report documents the process and findings of the Mt. Ephraim Avenue Pedestrian Road Safety Audit undertaken by the Delaware Valley Regional Planning Commission (DVRPC). The report details
safety issues identified by the audit team at the study location and remedial strategies to address them. The goal of this audit was to identify safety issues and generate improvement recommendations
for the study area in an effort to reduce crashes and improve walking and biking. Emphasis is placed on identifying low-cost, quick-turnaround safety projects to address the identified issues, where
possible. This project represents a step toward implementation of DVRPC’s Safety Action Plan. Implementation of improvement strategies may be eligible for Local Federal Aid Safety Funds.
Staff Contact:
Kevin S. Murphy Principal Planner, Transportation Safety and Congestion Management
(215) 238-2864 [email protected]
Delaware Valley Regional Planning Commission 190 N. Independence Mall West, 8th Floor Philadelphia PA 19106
Phone: (215) 592-1800 Fax: (215) 592-9125 Internet: www.dvrpc.org