Pedestrian risk from cars and sport utility vehicles – a ...
16
1085 Pedestrian risk from cars and sport utility vehicles – a comparative analytical study C K Simms1* and D P Wood2 1 Centre for Bioengineering, Department of Mechanical Engineering, Trinity College, Dublin, Ireland 2 Denis Wood Associates, Dublin, Ireland The manuscript was received on 23 March 2006 and was accepted after revision for publication on 15 May 2006. DOI: 10.1243/09544070JAUTO319 Abstract: Analysis of real-world crash data from the USA shows that 11.5 per cent of pedestrians struck by large sport utility vehicles (SUVs) are killed, compared with 4.5 per cent of pedestrians struck by passenger cars. The design of the vehicle front-end structure has a substantial influence on injury outcome when pedestrians are struck by vehicles. In the context of the rising population of SUVs, it is important to determine the causes of their increased hazard to pedestrians. In this paper, validated multi-body models are used to show that the shape of SUVs results in higher pedestrian injuries to the mid-body regions compared to passenger cars. Analysis shows that the mass difference between cars and SUVs is not significant for pedestrian injury causation and it is shown that an important effect of the higher front profile of SUVs is that the pedestrian is struck more centrally with respect to the body’s centre of gravity, increasing the momentum transfer in the primary impact. A further important effect of the higher bonnet leading edge is that there is a direct impact to the mid-body region, which explains the significant abdomen and other internal injuries reported from real-world SUV/pedestrian impacts. By comparison, head injuries sustained from primary vehicle contact are shown to be similar or slightly lower for SUV/pedestrian impacts compared to car/ pedestrian impacts. However, real-world evidence and the current models suggest that the secondary impact with the ground is more severe in SUV/pedestrian impacts compared to car/ pedestrian impacts. Overall, these results show that the empirical finding that SUVs are more hazardous for pedestrians than passenger cars is primarily a function of the high bumper and bonnet for such vehicles. Keywords: pedestrian safety, SUV, front-end shape, injury risk 1 INTRODUCTION vehicular traffic from pedestrians. If a collision is unavoidable, the most important factor in deter- Pedestrian injuries and fatalities from collisions with mining injury severity is the impact speed [5–7]. At vehicles represent about 11 per cent of all automotive speeds below 20 km/h, pedestrians usually sustain casualties in the USA [1] and about 20 per cent in only minor injuries, but above 45 km/h collisions the EU [2]. In countries with poorer roads and where with pedestrians are mostly fatal [8, 9]. The reason a higher percentage of travel is by foot, the pro- for the dominance of speed is that the collision portion of automotive casualties who are pedestrians energy increases with the square of the impact speed. can rise to nearly 50 per cent [3], while in Ethiopia Recently, ‘smart vehicles’ have been developed to it has been reported at 85 per cent [4]. Maximizing alert a driver to an impending collision. However, the pedestrian protection is therefore an important goal complexity of road traffic accidents means that worldwide. This is best achieved by separation of vehicle pedestrian accidents will continue to occur. Finally, pedestrian safety has been improved by reducing the hazard posed by vehicle fronts. The * Corresponding author: Centre for Bioengineering, Department European Transport Safety Council recommen- of Mechanical Engineering, Trinity College, Parsons Building, College Green, Dublin 2, Ireland. email: [email protected] dations focus on reducing vehicle body stiffness and JAUTO319 © IMechE 2006 Proc. IMechE Vol. 220 Part D: J. Automobile Engineering
Transcript of Pedestrian risk from cars and sport utility vehicles – a ...
1085
Pedestrian risk from cars and sport utility vehicles –a comparative analytical studyC K Simms1* and D P Wood2
1Centre for Bioengineering, Department of Mechanical Engineering, Trinity College, Dublin, Ireland2Denis Wood Associates, Dublin, Ireland
The manuscript was received on 23 March 2006 and was accepted after revision for publication on 15 May 2006.
DOI: 10.1243/09544070JAUTO319
Abstract: Analysis of real-world crash data from the USA shows that 11.5 per cent ofpedestrians struck by large sport utility vehicles (SUVs) are killed, compared with 4.5 per centof pedestrians struck by passenger cars. The design of the vehicle front-end structure has asubstantial influence on injury outcome when pedestrians are struck by vehicles. In the contextof the rising population of SUVs, it is important to determine the causes of their increasedhazard to pedestrians. In this paper, validated multi-body models are used to show that theshape of SUVs results in higher pedestrian injuries to the mid-body regions compared topassenger cars. Analysis shows that the mass difference between cars and SUVs is not significantfor pedestrian injury causation and it is shown that an important effect of the higher frontprofile of SUVs is that the pedestrian is struck more centrally with respect to the body’s centreof gravity, increasing the momentum transfer in the primary impact. A further importanteffect of the higher bonnet leading edge is that there is a direct impact to the mid-body region,which explains the significant abdomen and other internal injuries reported from real-worldSUV/pedestrian impacts. By comparison, head injuries sustained from primary vehicle contactare shown to be similar or slightly lower for SUV/pedestrian impacts compared to car/pedestrian impacts. However, real-world evidence and the current models suggest that thesecondary impact with the ground is more severe in SUV/pedestrian impacts compared to car/pedestrian impacts. Overall, these results show that the empirical finding that SUVs are morehazardous for pedestrians than passenger cars is primarily a function of the high bumper andbonnet for such vehicles.
Keywords: pedestrian safety, SUV, front-end shape, injury risk
1 INTRODUCTION vehicular traffic from pedestrians. If a collision isunavoidable, the most important factor in deter-
Pedestrian injuries and fatalities from collisions with mining injury severity is the impact speed [5–7]. Atvehicles represent about 11 per cent of all automotive speeds below 20 km/h, pedestrians usually sustaincasualties in the USA [1] and about 20 per cent in only minor injuries, but above 45 km/h collisionsthe EU [2]. In countries with poorer roads and where with pedestrians are mostly fatal [8, 9]. The reasona higher percentage of travel is by foot, the pro- for the dominance of speed is that the collisionportion of automotive casualties who are pedestrians energy increases with the square of the impact speed.can rise to nearly 50 per cent [3], while in Ethiopia Recently, ‘smart vehicles’ have been developed toit has been reported at 85 per cent [4]. Maximizing alert a driver to an impending collision. However, thepedestrian protection is therefore an important goal complexity of road traffic accidents means thatworldwide. This is best achieved by separation of vehicle pedestrian accidents will continue to occur.
Finally, pedestrian safety has been improved byreducing the hazard posed by vehicle fronts. The* Corresponding author: Centre for Bioengineering, Department
European Transport Safety Council recommen-of Mechanical Engineering, Trinity College, Parsons Building,
College Green, Dublin 2, Ireland. email: [email protected] dations focus on reducing vehicle body stiffness and
JAUTO319 © IMechE 2006 Proc. IMechE Vol. 220 Part D: J. Automobile Engineering
1086 C K Simms and D P Wood
providing sufficient crush depth for the bumper, Longhitano et al. [18] used the Pedestrian Crashbonnet leading edge (le), and bonnet top [10]. It has Data Study (PCDS) to analyse the influence of vehiclealso been shown that the vehicle front-end shape body type on pedestrian injury distribution, andaffects pedestrian injuries [11, 12]. found AIS3+ head injuries in 71 per cent of cases
Sport utility vehicles (SUVs) have significantly for car impacts compared to 81 per cent of cases fordifferent mass characteristics and front shapes from LTVs. Ground impact injuries were excluded in thispassenger cars. The population of SUVs in many study. By comparison, AIS3+ injuries of the mid-countries is rising rapidly, and the effect of this trend body regions were found in car impacts in only 25 peron pedestrian safety therefore needs to be assessed. cent of cases, compared to 60 per cent of cases forIn Europe, SUVs now represent 15 per cent of new LTVs.vehicle registrations [13], while in the USA 40 per Roudsari et al. [19] also used the PCDS to analysecent of new vehicles are either light trucks or SUVs 3146 injuries among 386 pedestrians. There was no[14]. This paper examines the effect of the mass significant difference in mean impact speed betweendifferences and shape differences between cars and LTVs and passenger cars. There were 159 adults withSUVs on the resulting injury patterns of struck head injuries, of which 46 were struck by LTVs,pedestrians. The objective is to explain the real-world making the statistical distribution between vehiclefinding that SUVs present a substantially higher risk types much better than for Ballesteros et al. [17].to pedestrians than cars in the event of a collision. They reported that the likelihood of adult head
injuries was minimally higher for LTVs (54 per cent)than car crashes (46 per cent) (p=0.16). In addition,
2 REVIEW OF EMPIRICAL EVIDENCE OF SUV 39 per cent of head injuries from LTV impacts wereRISK attributed to the secondary ground impact, com-
pared to only 7 per cent for cars. The likelihoodLefler and Gabler [14] used the real-world data from of thorax injuries was considerably higher for LTVthe USA to show that 11.5 per cent of pedestrians crashes (37 per cent) than for cars (20 per cent)struck by large SUVs are killed, compared with (p=0.001). The likelihood of abdomen injuries was4.5 per cent for pedestrians struck by cars. When also considerably higher for LTV crashes (33 per cent)the data were subdivided into three impact velocity than for cars (18 per cent) (p=0.003). These authorsranges 0–20, 21–40, and 41–60 km/h, light trucks and did not report on the isolated risk of pelvis injuries.vans (LTVs – this category includes SUVs) were found These empirical studies clearly show a sub-to be more likely to cause AIS3+ injury than cars in stantially increased risk for pedestrians when struckall three speed ranges. This effect was most pro- by a light truck, van, or SUV compared to a passengernounced at lower speeds, because the impact energy car. However, there is clearly conflicting evidenceat higher speeds for all vehicle types causes serious regarding the relative risk of head injuries frominjury or death for pedestrians. This difference different vehicle types [17–19], and there is also nobetween vehicle types at low/medium speeds is agreement on the source of the increased risk of LTVssignificant since the majority of pedestrian accidents for pedestrians.occur below impact speeds of 50 km/h [8, 15].
Roudsari et al. found that light truck type vehiclespresented a threefold higher risk of severe injuries
3 VEHICLE FACTORS AFFECTING PEDESTRIANto pedestrians than cars [16]. Ballesteros et al. usedRISKreal accident data from Maryland between 1995
and 1999 to analyse pedestrian serious injuries andThe main vehicle factors that influence pedestrianfatalities for different vehicle types [17]. At collisionrisk are mass, geometry, and stiffness. Lefler andvelocities below 50 km/h the odds ratios forGabler [14] stated that pedestrians are at a severepedestrian risk from SUVs compared to cars weredisadvantage regardless of the mass of the striking1.97 for traumatic brain injury, 2.0 for thoracic injury,vehicle and suggested that frontal geometry may beand 2.5 for abdominal injuries. They concluded thatthe controlling factor for pedestrian risk, but they did‘the increased risks to pedestrians of LTVs comparednot elaborate on this. Ballesteros et al. [17] statedto cars may be due to their increased mass andthat the increased danger to pedestrians from SUVsspeed’. However, the breakdown of vehicle type inis due to their higher mass and faster travel speedstheir sample was questionable: only 4.5 per cent of(impact speed was not available, but in their studycases actually involved an SUV, compared to 66 per
cent of cases involving cars. SUV/pedestrian collisions occurred in areas with
JAUTO319 © IMechE 2006Proc. IMechE Vol. 220 Part D: J. Automobile Engineering
1087Pedestrian risk from cars and sport utility vehicles
higher speed limits). They state that the higher The geometry of the front structure of the car andSUV used by Okamoto et al. [23] were used to locatebumper and bonnet heights in SUVs are importantcontact surfaces representing the bumper, bonnetbecause they dictate the initial contact pointsleading edge, and bonnet for each vehicle. The makebetween pedestrians and vehicles. However, they doand model of the vehicles used were not given, andnot comment on the reduced eccentricity of impacttherefore a number of assumptions were necessary.with respect to the pedestrian’s centre of mass andThe mass and inertia characteristics of the vehiclesthe effect this has on momentum transfer in thewere estimated based on real-world data reported bycase of an SUV collision with a pedestrian. RoudsariBallesteros et al. [17] (see Table 1).et al. [19] state that the key to understanding
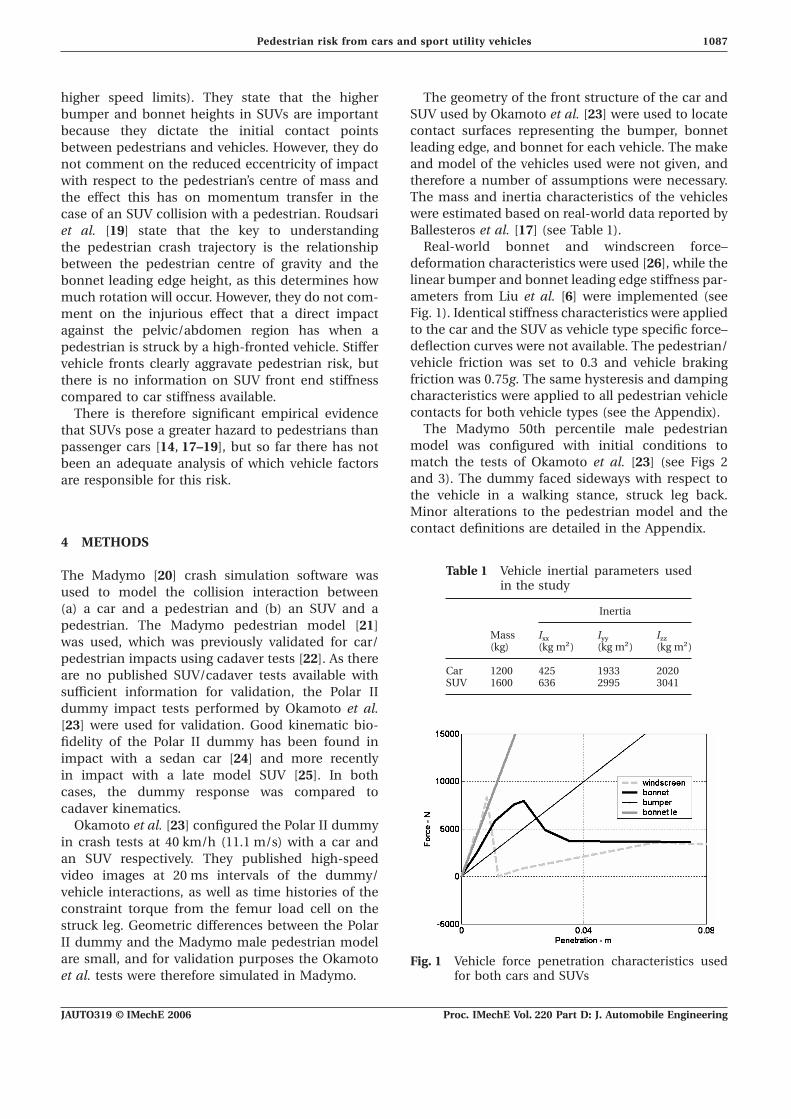
Real-world bonnet and windscreen force–the pedestrian crash trajectory is the relationshipdeformation characteristics were used [26], while thebetween the pedestrian centre of gravity and thelinear bumper and bonnet leading edge stiffness par-bonnet leading edge height, as this determines howameters from Liu et al. [6] were implemented (seemuch rotation will occur. However, they do not com-Fig. 1). Identical stiffness characteristics were appliedment on the injurious effect that a direct impactto the car and the SUV as vehicle type specific force–against the pelvic/abdomen region has when adeflection curves were not available. The pedestrian/pedestrian is struck by a high-fronted vehicle. Stiffervehicle friction was set to 0.3 and vehicle brakingvehicle fronts clearly aggravate pedestrian risk, butfriction was 0.75g. The same hysteresis and dampingthere is no information on SUV front end stiffnesscharacteristics were applied to all pedestrian vehiclecompared to car stiffness available.contacts for both vehicle types (see the Appendix).There is therefore significant empirical evidence
The Madymo 50th percentile male pedestrianthat SUVs pose a greater hazard to pedestrians thanmodel was configured with initial conditions topassenger cars [14, 17–19], but so far there has notmatch the tests of Okamoto et al. [23] (see Figs 2been an adequate analysis of which vehicle factorsand 3). The dummy faced sideways with respect toare responsible for this risk.the vehicle in a walking stance, struck leg back.Minor alterations to the pedestrian model and thecontact definitions are detailed in the Appendix.
4 METHODS
Table 1 Vehicle inertial parameters usedThe Madymo [20] crash simulation software wasin the studyused to model the collision interaction between
(a) a car and a pedestrian and (b) an SUV and a Inertiapedestrian. The Madymo pedestrian model [21]
Mass Ixx
Iyy
Izzwas used, which was previously validated for car/ (kg) (kg m2) (kg m2) (kg m2)
pedestrian impacts using cadaver tests [22]. As thereCar 1200 425 1933 2020are no published SUV/cadaver tests available withSUV 1600 636 2995 3041
sufficient information for validation, the Polar IIdummy impact tests performed by Okamoto et al.[23] were used for validation. Good kinematic bio-fidelity of the Polar II dummy has been found inimpact with a sedan car [24] and more recentlyin impact with a late model SUV [25]. In bothcases, the dummy response was compared tocadaver kinematics.
Okamoto et al. [23] configured the Polar II dummyin crash tests at 40 km/h (11.1 m/s) with a car andan SUV respectively. They published high-speedvideo images at 20 ms intervals of the dummy/vehicle interactions, as well as time histories of theconstraint torque from the femur load cell on thestruck leg. Geometric differences between the PolarII dummy and the Madymo male pedestrian modelare small, and for validation purposes the Okamoto Fig. 1 Vehicle force penetration characteristics used
for both cars and SUVset al. tests were therefore simulated in Madymo.
JAUTO319 © IMechE 2006 Proc. IMechE Vol. 220 Part D: J. Automobile Engineering
1088 C K Simms and D P Wood
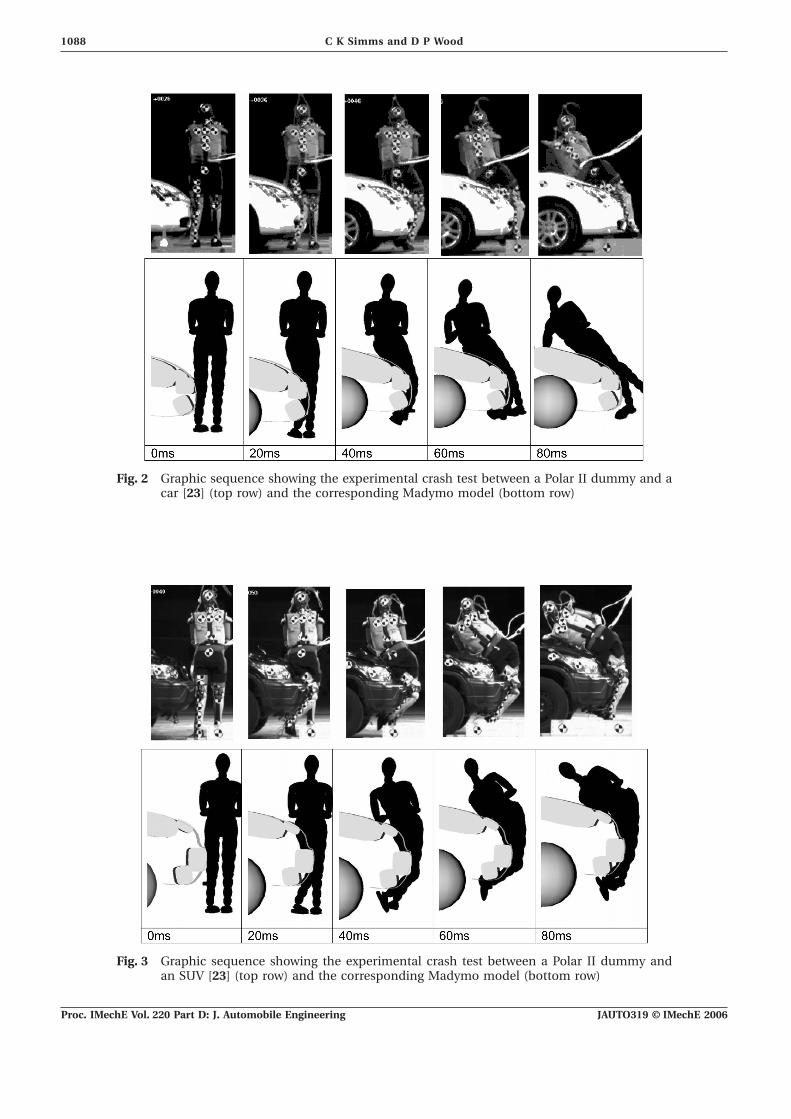
Fig. 2 Graphic sequence showing the experimental crash test between a Polar II dummy and acar [23] (top row) and the corresponding Madymo model (bottom row)
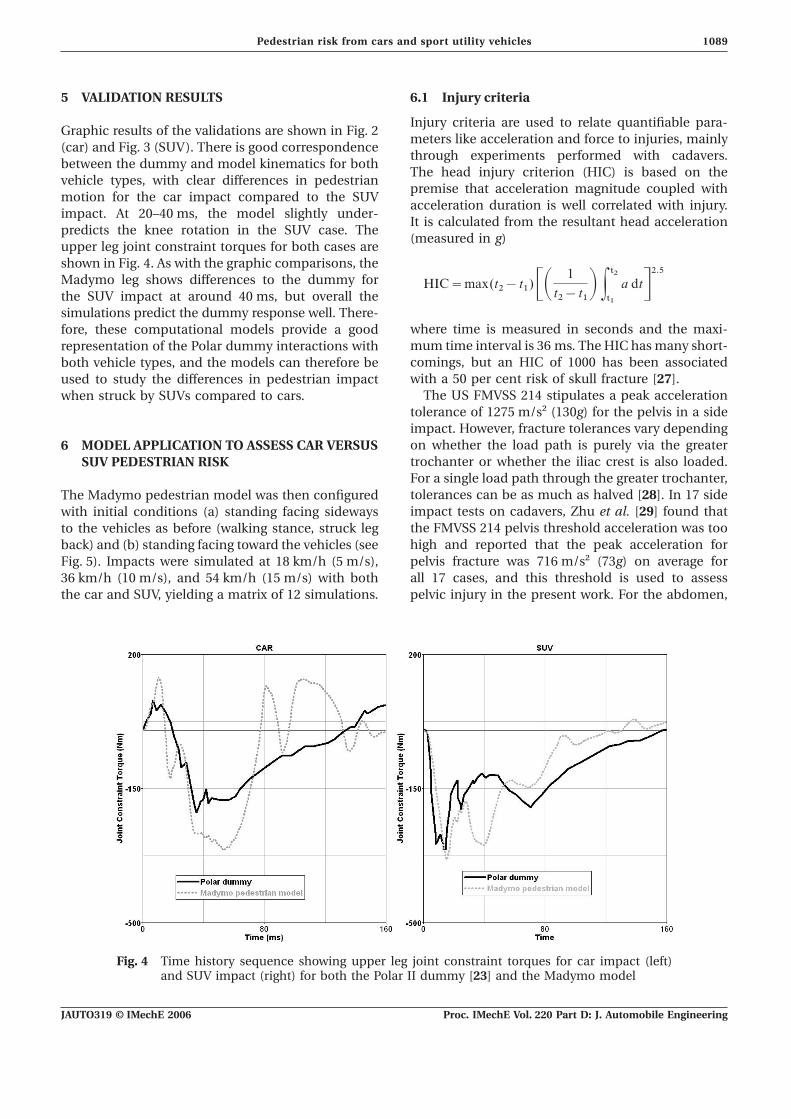
Fig. 3 Graphic sequence showing the experimental crash test between a Polar II dummy andan SUV [23] (top row) and the corresponding Madymo model (bottom row)
JAUTO319 © IMechE 2006Proc. IMechE Vol. 220 Part D: J. Automobile Engineering
1089Pedestrian risk from cars and sport utility vehicles
5 VALIDATION RESULTS 6.1 Injury criteria
Injury criteria are used to relate quantifiable para-Graphic results of the validations are shown in Fig. 2
meters like acceleration and force to injuries, mainly(car) and Fig. 3 (SUV). There is good correspondence
through experiments performed with cadavers.between the dummy and model kinematics for both
The head injury criterion (HIC) is based on thevehicle types, with clear differences in pedestrian
premise that acceleration magnitude coupled withmotion for the car impact compared to the SUV
acceleration duration is well correlated with injury.impact. At 20–40 ms, the model slightly under-
It is calculated from the resultant head accelerationpredicts the knee rotation in the SUV case. The
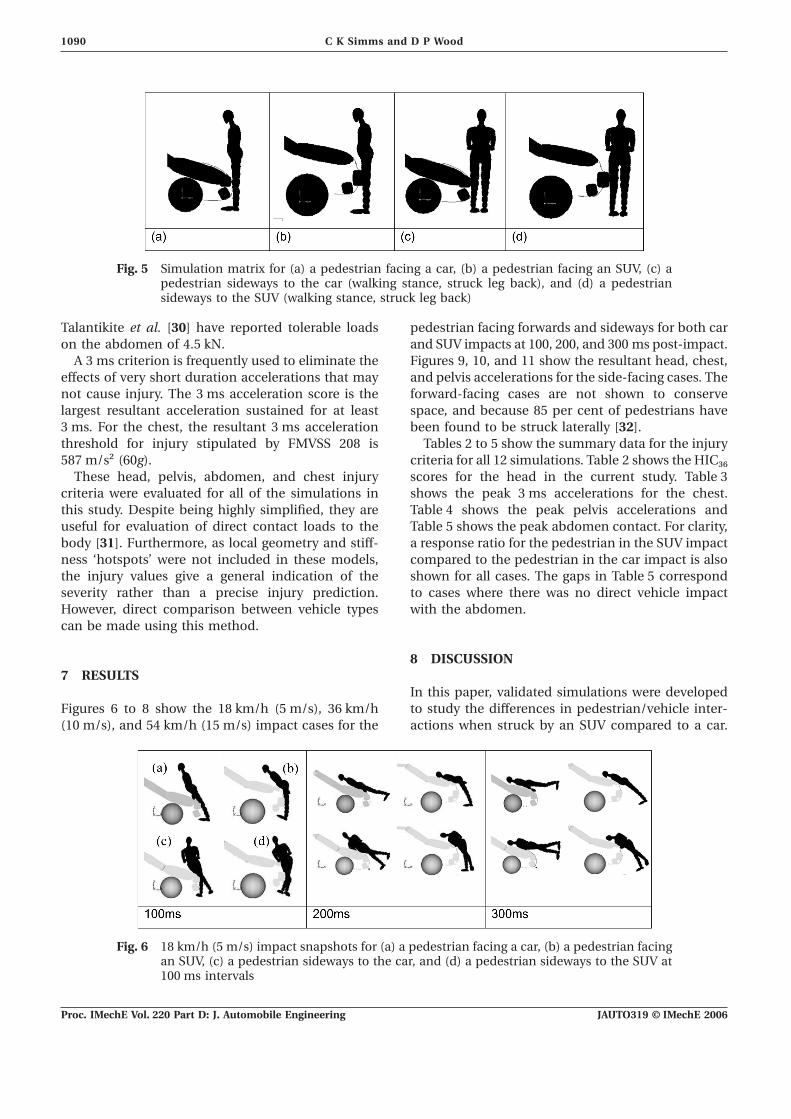
(measured in g)upper leg joint constraint torques for both cases areshown in Fig. 4. As with the graphic comparisons, theMadymo leg shows differences to the dummy for HIC=max(t2−t1)CA 1
t2−t1B P t2t1
a dtD2.5the SUV impact at around 40 ms, but overall thesimulations predict the dummy response well. There-
where time is measured in seconds and the maxi-fore, these computational models provide a goodmum time interval is 36 ms. The HIC has many short-representation of the Polar dummy interactions withcomings, but an HIC of 1000 has been associatedboth vehicle types, and the models can therefore bewith a 50 per cent risk of skull fracture [27].used to study the differences in pedestrian impact
The US FMVSS 214 stipulates a peak accelerationwhen struck by SUVs compared to cars.tolerance of 1275 m/s2 (130g) for the pelvis in a sideimpact. However, fracture tolerances vary dependingon whether the load path is purely via the greater6 MODEL APPLICATION TO ASSESS CAR VERSUStrochanter or whether the iliac crest is also loaded.SUV PEDESTRIAN RISKFor a single load path through the greater trochanter,tolerances can be as much as halved [28]. In 17 sideThe Madymo pedestrian model was then configuredimpact tests on cadavers, Zhu et al. [29] found thatwith initial conditions (a) standing facing sidewaysthe FMVSS 214 pelvis threshold acceleration was tooto the vehicles as before (walking stance, struck leghigh and reported that the peak acceleration forback) and (b) standing facing toward the vehicles (seepelvis fracture was 716 m/s2 (73g) on average forFig. 5). Impacts were simulated at 18 km/h (5 m/s),all 17 cases, and this threshold is used to assess36 km/h (10 m/s), and 54 km/h (15 m/s) with both
the car and SUV, yielding a matrix of 12 simulations. pelvic injury in the present work. For the abdomen,
Fig. 4 Time history sequence showing upper leg joint constraint torques for car impact (left)and SUV impact (right) for both the Polar II dummy [23] and the Madymo model
JAUTO319 © IMechE 2006 Proc. IMechE Vol. 220 Part D: J. Automobile Engineering
1090 C K Simms and D P Wood
Fig. 5 Simulation matrix for (a) a pedestrian facing a car, (b) a pedestrian facing an SUV, (c) apedestrian sideways to the car (walking stance, struck leg back), and (d) a pedestriansideways to the SUV (walking stance, struck leg back)
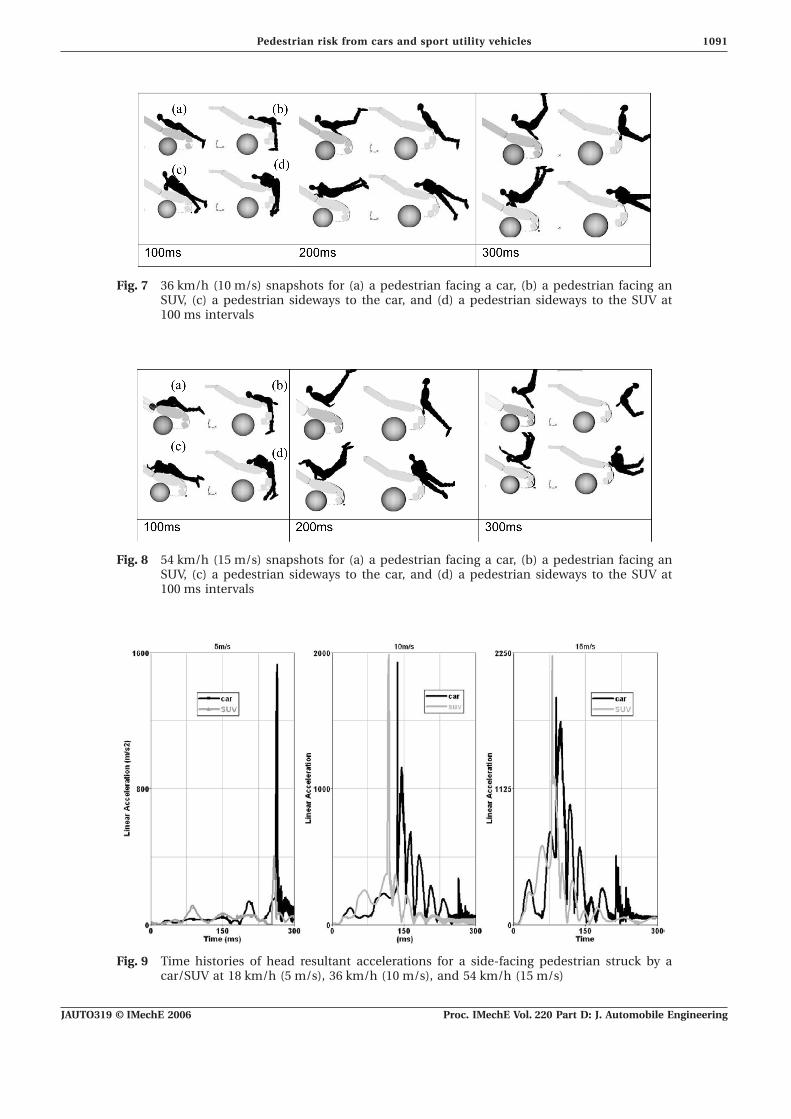
Talantikite et al. [30] have reported tolerable loads pedestrian facing forwards and sideways for both carand SUV impacts at 100, 200, and 300 ms post-impact.on the abdomen of 4.5 kN.
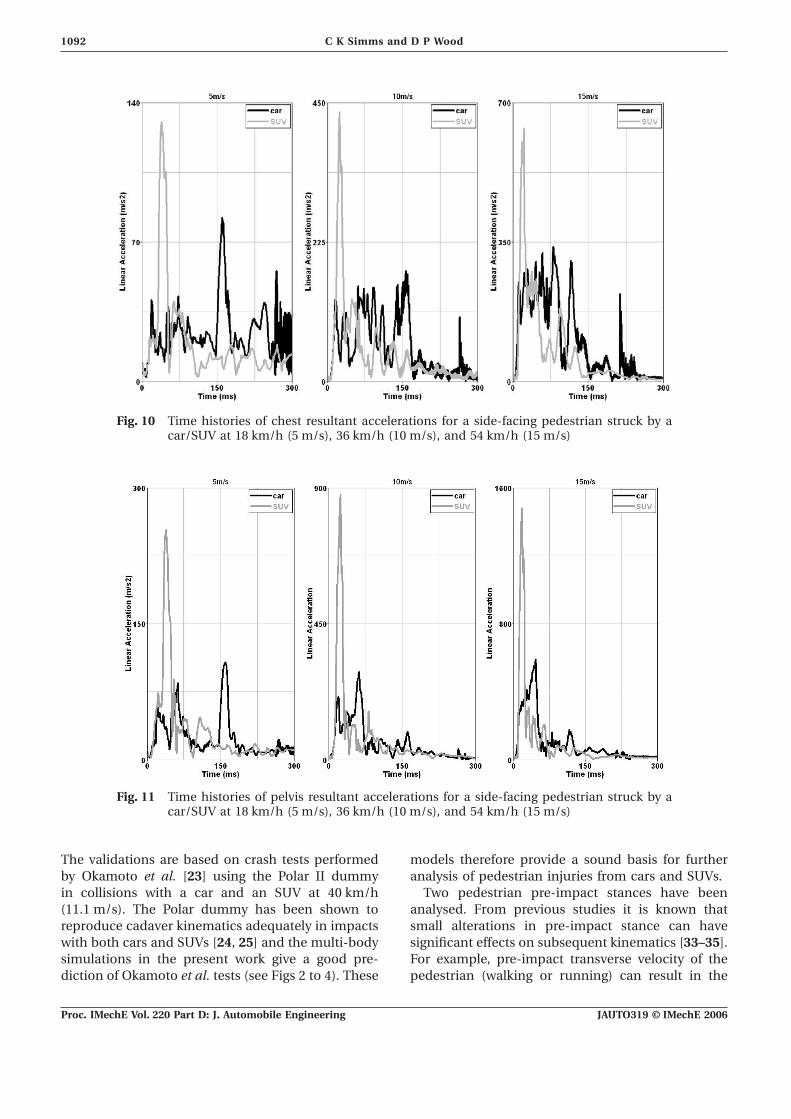
A 3 ms criterion is frequently used to eliminate the Figures 9, 10, and 11 show the resultant head, chest,and pelvis accelerations for the side-facing cases. Theeffects of very short duration accelerations that may
not cause injury. The 3 ms acceleration score is the forward-facing cases are not shown to conservespace, and because 85 per cent of pedestrians havelargest resultant acceleration sustained for at least
3 ms. For the chest, the resultant 3 ms acceleration been found to be struck laterally [32].Tables 2 to 5 show the summary data for the injurythreshold for injury stipulated by FMVSS 208 is
587 m/s2 (60g). criteria for all 12 simulations. Table 2 shows the HIC36
scores for the head in the current study. Table 3These head, pelvis, abdomen, and chest injurycriteria were evaluated for all of the simulations in shows the peak 3 ms accelerations for the chest.
Table 4 shows the peak pelvis accelerations andthis study. Despite being highly simplified, they areuseful for evaluation of direct contact loads to the Table 5 shows the peak abdomen contact. For clarity,
a response ratio for the pedestrian in the SUV impactbody [31]. Furthermore, as local geometry and stiff-ness ‘hotspots’ were not included in these models, compared to the pedestrian in the car impact is also
shown for all cases. The gaps in Table 5 correspondthe injury values give a general indication of theseverity rather than a precise injury prediction. to cases where there was no direct vehicle impact
with the abdomen.However, direct comparison between vehicle typescan be made using this method.
8 DISCUSSION7 RESULTS
In this paper, validated simulations were developedto study the differences in pedestrian/vehicle inter-Figures 6 to 8 show the 18 km/h (5 m/s), 36 km/h
(10 m/s), and 54 km/h (15 m/s) impact cases for the actions when struck by an SUV compared to a car.
Fig. 6 18 km/h (5 m/s) impact snapshots for (a) a pedestrian facing a car, (b) a pedestrian facingan SUV, (c) a pedestrian sideways to the car, and (d) a pedestrian sideways to the SUV at100 ms intervals
JAUTO319 © IMechE 2006Proc. IMechE Vol. 220 Part D: J. Automobile Engineering
1091Pedestrian risk from cars and sport utility vehicles
Fig. 7 36 km/h (10 m/s) snapshots for (a) a pedestrian facing a car, (b) a pedestrian facing anSUV, (c) a pedestrian sideways to the car, and (d) a pedestrian sideways to the SUV at100 ms intervals
Fig. 8 54 km/h (15 m/s) snapshots for (a) a pedestrian facing a car, (b) a pedestrian facing anSUV, (c) a pedestrian sideways to the car, and (d) a pedestrian sideways to the SUV at100 ms intervals
Fig. 9 Time histories of head resultant accelerations for a side-facing pedestrian struck by acar/SUV at 18 km/h (5 m/s), 36 km/h (10 m/s), and 54 km/h (15 m/s)
JAUTO319 © IMechE 2006 Proc. IMechE Vol. 220 Part D: J. Automobile Engineering
1092 C K Simms and D P Wood
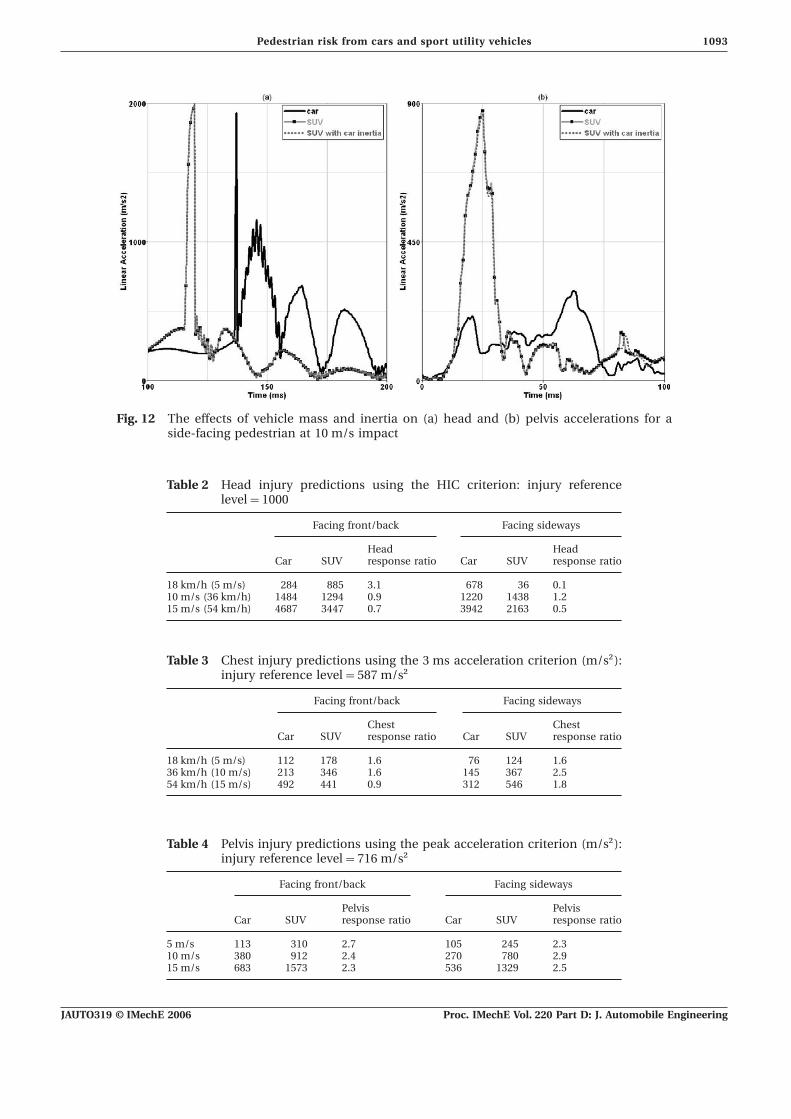
Fig. 10 Time histories of chest resultant accelerations for a side-facing pedestrian struck by acar/SUV at 18 km/h (5 m/s), 36 km/h (10 m/s), and 54 km/h (15 m/s)
Fig. 11 Time histories of pelvis resultant accelerations for a side-facing pedestrian struck by acar/SUV at 18 km/h (5 m/s), 36 km/h (10 m/s), and 54 km/h (15 m/s)
The validations are based on crash tests performed models therefore provide a sound basis for furtheranalysis of pedestrian injuries from cars and SUVs.by Okamoto et al. [23] using the Polar II dummy
in collisions with a car and an SUV at 40 km/h Two pedestrian pre-impact stances have beenanalysed. From previous studies it is known that(11.1 m/s). The Polar dummy has been shown to
reproduce cadaver kinematics adequately in impacts small alterations in pre-impact stance can havesignificant effects on subsequent kinematics [33–35].with both cars and SUVs [24, 25] and the multi-body
simulations in the present work give a good pre- For example, pre-impact transverse velocity of thepedestrian (walking or running) can result in thediction of Okamoto et al. tests (see Figs 2 to 4). These
JAUTO319 © IMechE 2006Proc. IMechE Vol. 220 Part D: J. Automobile Engineering
1093Pedestrian risk from cars and sport utility vehicles
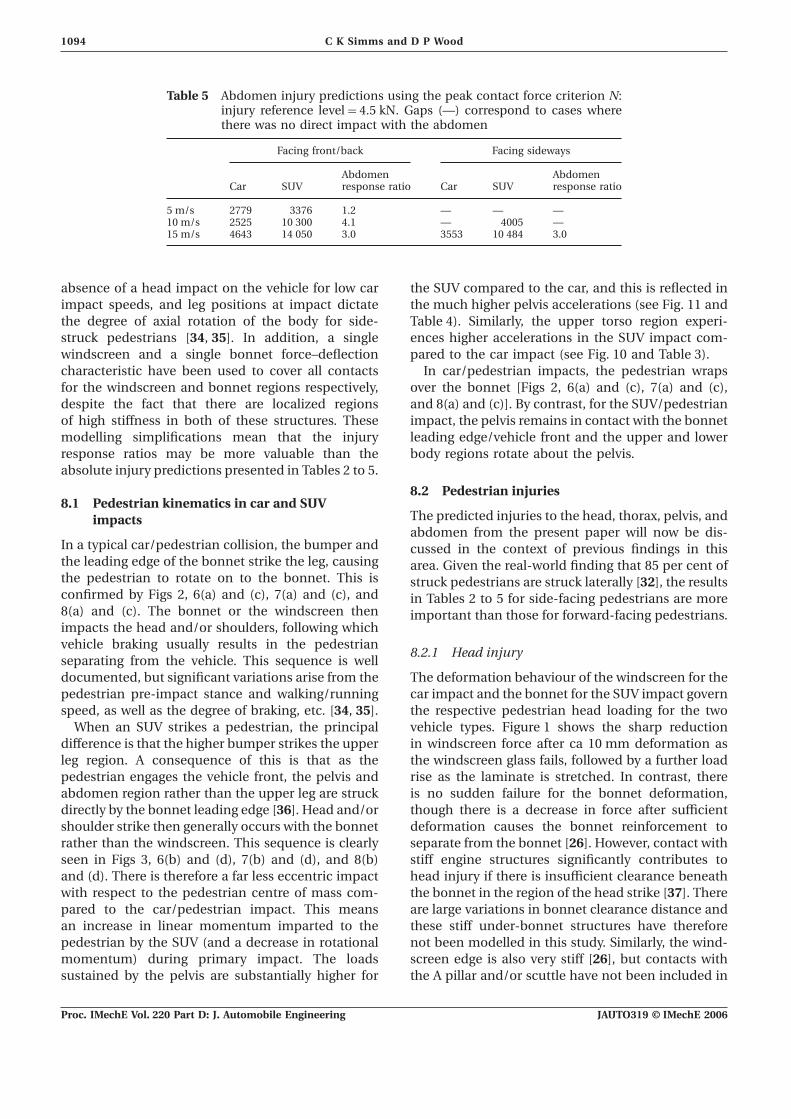
Fig. 12 The effects of vehicle mass and inertia on (a) head and (b) pelvis accelerations for aside-facing pedestrian at 10 m/s impact
Table 2 Head injury predictions using the HIC criterion: injury referencelevel=1000
Facing front/back Facing sideways
Head HeadCar SUV response ratio Car SUV response ratio
18 km/h (5 m/s) 284 885 3.1 678 36 0.110 m/s (36 km/h) 1484 1294 0.9 1220 1438 1.215 m/s (54 km/h) 4687 3447 0.7 3942 2163 0.5
Table 3 Chest injury predictions using the 3 ms acceleration criterion (m/s2):injury reference level=587 m/s2
Facing front/back Facing sideways
Chest ChestCar SUV response ratio Car SUV response ratio
18 km/h (5 m/s) 112 178 1.6 76 124 1.636 km/h (10 m/s) 213 346 1.6 145 367 2.554 km/h (15 m/s) 492 441 0.9 312 546 1.8
Table 4 Pelvis injury predictions using the peak acceleration criterion (m/s2):injury reference level=716 m/s2
Facing front/back Facing sideways
Pelvis PelvisCar SUV response ratio Car SUV response ratio
5 m/s 113 310 2.7 105 245 2.310 m/s 380 912 2.4 270 780 2.915 m/s 683 1573 2.3 536 1329 2.5
JAUTO319 © IMechE 2006 Proc. IMechE Vol. 220 Part D: J. Automobile Engineering
1094 C K Simms and D P Wood
Table 5 Abdomen injury predictions using the peak contact force criterion N:injury reference level=4.5 kN. Gaps (—) correspond to cases wherethere was no direct impact with the abdomen
Facing front/back Facing sideways
Abdomen AbdomenCar SUV response ratio Car SUV response ratio
5 m/s 2779 3376 1.2 — — —10 m/s 2525 10 300 4.1 — 4005 —15 m/s 4643 14 050 3.0 3553 10 484 3.0
absence of a head impact on the vehicle for low car the SUV compared to the car, and this is reflected inthe much higher pelvis accelerations (see Fig. 11 andimpact speeds, and leg positions at impact dictate
the degree of axial rotation of the body for side- Table 4). Similarly, the upper torso region experi-ences higher accelerations in the SUV impact com-struck pedestrians [34, 35]. In addition, a single
windscreen and a single bonnet force–deflection pared to the car impact (see Fig. 10 and Table 3).In car/pedestrian impacts, the pedestrian wrapscharacteristic have been used to cover all contacts
for the windscreen and bonnet regions respectively, over the bonnet [Figs 2, 6(a) and (c), 7(a) and (c),and 8(a) and (c)]. By contrast, for the SUV/pedestriandespite the fact that there are localized regions
of high stiffness in both of these structures. These impact, the pelvis remains in contact with the bonnetleading edge/vehicle front and the upper and lowermodelling simplifications mean that the injury
response ratios may be more valuable than the body regions rotate about the pelvis.absolute injury predictions presented in Tables 2 to 5.
8.2 Pedestrian injuries8.1 Pedestrian kinematics in car and SUV
The predicted injuries to the head, thorax, pelvis, andimpactsabdomen from the present paper will now be dis-
In a typical car/pedestrian collision, the bumper and cussed in the context of previous findings in thisthe leading edge of the bonnet strike the leg, causing area. Given the real-world finding that 85 per cent ofthe pedestrian to rotate on to the bonnet. This is struck pedestrians are struck laterally [32], the resultsconfirmed by Figs 2, 6(a) and (c), 7(a) and (c), and in Tables 2 to 5 for side-facing pedestrians are more8(a) and (c). The bonnet or the windscreen then important than those for forward-facing pedestrians.impacts the head and/or shoulders, following whichvehicle braking usually results in the pedestrian
8.2.1 Head injuryseparating from the vehicle. This sequence is welldocumented, but significant variations arise from the The deformation behaviour of the windscreen for the
car impact and the bonnet for the SUV impact governpedestrian pre-impact stance and walking/runningspeed, as well as the degree of braking, etc. [34, 35]. the respective pedestrian head loading for the two
vehicle types. Figure 1 shows the sharp reductionWhen an SUV strikes a pedestrian, the principaldifference is that the higher bumper strikes the upper in windscreen force after ca 10 mm deformation as
the windscreen glass fails, followed by a further loadleg region. A consequence of this is that as thepedestrian engages the vehicle front, the pelvis and rise as the laminate is stretched. In contrast, there
is no sudden failure for the bonnet deformation,abdomen region rather than the upper leg are struckdirectly by the bonnet leading edge [36]. Head and/or though there is a decrease in force after sufficient
deformation causes the bonnet reinforcement toshoulder strike then generally occurs with the bonnetrather than the windscreen. This sequence is clearly separate from the bonnet [26]. However, contact with
stiff engine structures significantly contributes toseen in Figs 3, 6(b) and (d), 7(b) and (d), and 8(b)and (d). There is therefore a far less eccentric impact head injury if there is insufficient clearance beneath
the bonnet in the region of the head strike [37]. Therewith respect to the pedestrian centre of mass com-pared to the car/pedestrian impact. This means are large variations in bonnet clearance distance and
these stiff under-bonnet structures have thereforean increase in linear momentum imparted to thepedestrian by the SUV (and a decrease in rotational not been modelled in this study. Similarly, the wind-
screen edge is also very stiff [26], but contacts withmomentum) during primary impact. The loadssustained by the pelvis are substantially higher for the A pillar and/or scuttle have not been included in
JAUTO319 © IMechE 2006Proc. IMechE Vol. 220 Part D: J. Automobile Engineering
1095Pedestrian risk from cars and sport utility vehicles
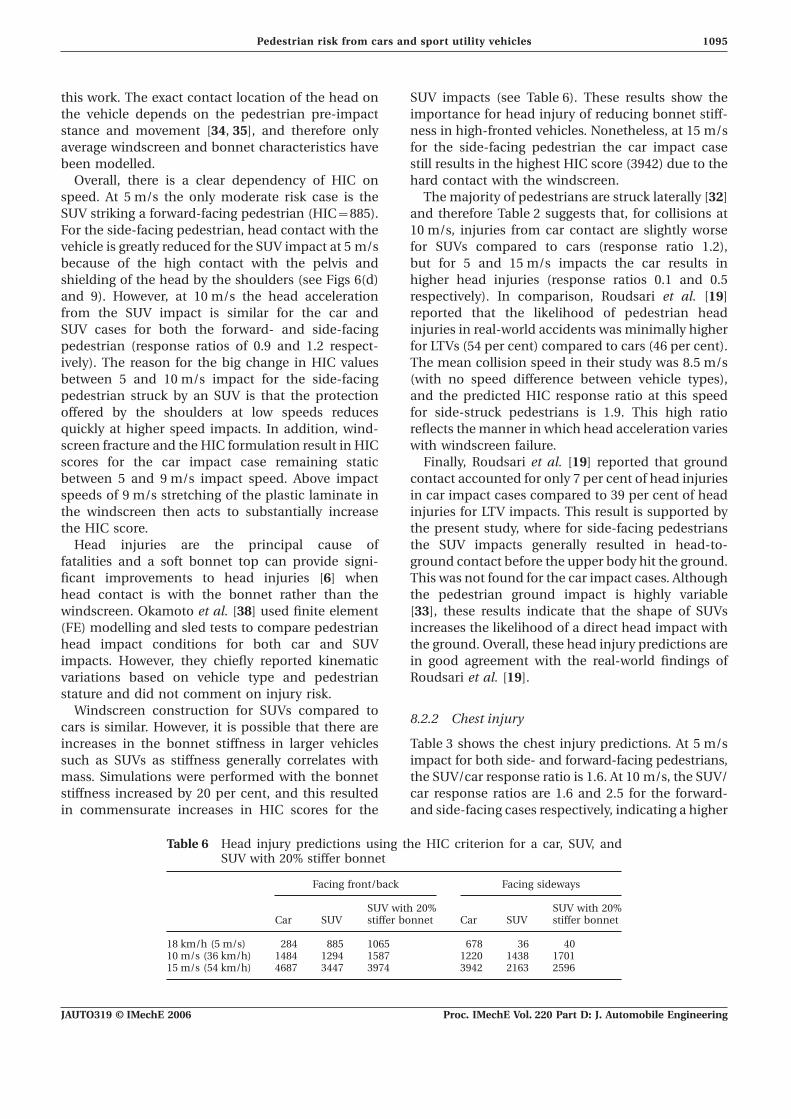
this work. The exact contact location of the head on SUV impacts (see Table 6). These results show theimportance for head injury of reducing bonnet stiff-the vehicle depends on the pedestrian pre-impact
stance and movement [34, 35], and therefore only ness in high-fronted vehicles. Nonetheless, at 15 m/sfor the side-facing pedestrian the car impact caseaverage windscreen and bonnet characteristics have
been modelled. still results in the highest HIC score (3942) due to thehard contact with the windscreen.Overall, there is a clear dependency of HIC on
speed. At 5 m/s the only moderate risk case is the The majority of pedestrians are struck laterally [32]and therefore Table 2 suggests that, for collisions atSUV striking a forward-facing pedestrian (HIC=885).
For the side-facing pedestrian, head contact with the 10 m/s, injuries from car contact are slightly worsefor SUVs compared to cars (response ratio 1.2),vehicle is greatly reduced for the SUV impact at 5 m/s
because of the high contact with the pelvis and but for 5 and 15 m/s impacts the car results inhigher head injuries (response ratios 0.1 and 0.5shielding of the head by the shoulders (see Figs 6(d)
and 9). However, at 10 m/s the head acceleration respectively). In comparison, Roudsari et al. [19]reported that the likelihood of pedestrian headfrom the SUV impact is similar for the car and
SUV cases for both the forward- and side-facing injuries in real-world accidents was minimally higherfor LTVs (54 per cent) compared to cars (46 per cent).pedestrian (response ratios of 0.9 and 1.2 respect-
ively). The reason for the big change in HIC values The mean collision speed in their study was 8.5 m/s(with no speed difference between vehicle types),between 5 and 10 m/s impact for the side-facing
pedestrian struck by an SUV is that the protection and the predicted HIC response ratio at this speedfor side-struck pedestrians is 1.9. This high ratiooffered by the shoulders at low speeds reduces
quickly at higher speed impacts. In addition, wind- reflects the manner in which head acceleration varieswith windscreen failure.screen fracture and the HIC formulation result in HIC
scores for the car impact case remaining static Finally, Roudsari et al. [19] reported that groundcontact accounted for only 7 per cent of head injuriesbetween 5 and 9 m/s impact speed. Above impact
speeds of 9 m/s stretching of the plastic laminate in in car impact cases compared to 39 per cent of headinjuries for LTV impacts. This result is supported bythe windscreen then acts to substantially increase
the HIC score. the present study, where for side-facing pedestriansthe SUV impacts generally resulted in head-to-Head injuries are the principal cause of
fatalities and a soft bonnet top can provide signi- ground contact before the upper body hit the ground.This was not found for the car impact cases. Althoughficant improvements to head injuries [6] when
head contact is with the bonnet rather than the the pedestrian ground impact is highly variable[33], these results indicate that the shape of SUVswindscreen. Okamoto et al. [38] used finite element
(FE) modelling and sled tests to compare pedestrian increases the likelihood of a direct head impact withthe ground. Overall, these head injury predictions arehead impact conditions for both car and SUV
impacts. However, they chiefly reported kinematic in good agreement with the real-world findings ofRoudsari et al. [19].variations based on vehicle type and pedestrian
stature and did not comment on injury risk.Windscreen construction for SUVs compared to
8.2.2 Chest injurycars is similar. However, it is possible that there areincreases in the bonnet stiffness in larger vehicles Table 3 shows the chest injury predictions. At 5 m/s
impact for both side- and forward-facing pedestrians,such as SUVs as stiffness generally correlates withmass. Simulations were performed with the bonnet the SUV/car response ratio is 1.6. At 10 m/s, the SUV/
car response ratios are 1.6 and 2.5 for the forward-stiffness increased by 20 per cent, and this resultedin commensurate increases in HIC scores for the and side-facing cases respectively, indicating a higher
Table 6 Head injury predictions using the HIC criterion for a car, SUV, andSUV with 20% stiffer bonnet
Facing front/back Facing sideways
SUV with 20% SUV with 20%Car SUV stiffer bonnet Car SUV stiffer bonnet
18 km/h (5 m/s) 284 885 1065 678 36 4010 m/s (36 km/h) 1484 1294 1587 1220 1438 170115 m/s (54 km/h) 4687 3447 3974 3942 2163 2596
JAUTO319 © IMechE 2006 Proc. IMechE Vol. 220 Part D: J. Automobile Engineering
1096 C K Simms and D P Wood
risk for the chest from SUVs at this speed. Matsui amelioration due to rotation as occurs when thelower limbs are struck first in a car impact.et al. impacted the Polar pedestrian dummy laterally
with a car at 40 km/h and concluded there is Table 5 shows the direct abdomen contact force.The SUV impacts are much more severe in all casesnegligible chest loading in such cases [39]. Table 3
shows good agreement with this finding. (response ratio 1.2–4.1). At impact speeds of 10 m/sand greater, the abdomen contact force for the SUVFor the forward-facing pedestrian at the 15 m/s
impact, chest loadings for the car and SUV impacts impacts is above the 4.5 kN threshold reported byTalantikite et al. [30], indicating a substantial risk forare similar (response ratio 0.9). For the side-facing
case, the SUV score is much higher for the SUV the abdomen from the leading edge structures ofhigh-fronted vehicles. These results compare well(response ratio 1.8) and the chest acceleration at this
speed approaches the tolerance level. These results with the findings of Roudsari et al. [19], who reporteda 33 per cent chance of abdomen injuries for LTVscompare well with the findings of Roudsari et al. [19]
who reported a 37 per cent chance of thorax injuries compared to an 18 per cent chance of abdomeninjuries for car impacts.for LTVs compared to a 20 per cent chance of thorax
injuries for car impacts.8.3 Vehicle mass effects versus vehicle geometry
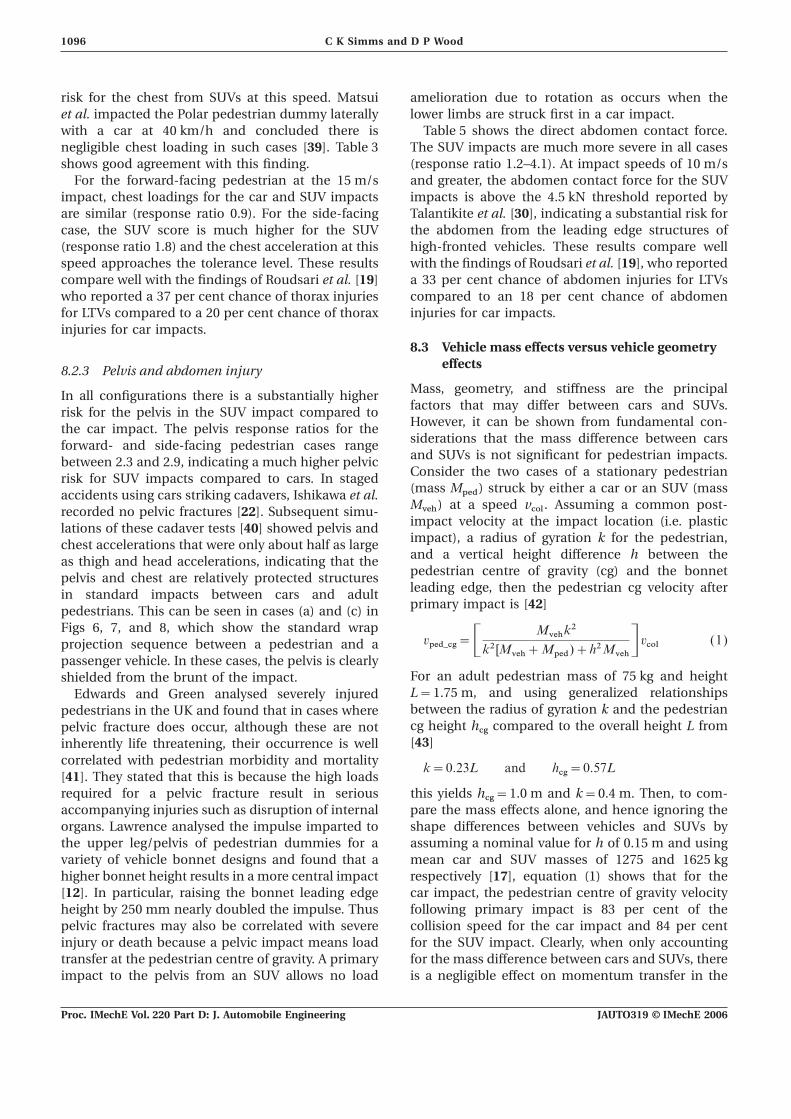
effects8.2.3 Pelvis and abdomen injuryMass, geometry, and stiffness are the principalIn all configurations there is a substantially higherfactors that may differ between cars and SUVs.risk for the pelvis in the SUV impact compared toHowever, it can be shown from fundamental con-the car impact. The pelvis response ratios for thesiderations that the mass difference between carsforward- and side-facing pedestrian cases rangeand SUVs is not significant for pedestrian impacts.between 2.3 and 2.9, indicating a much higher pelvicConsider the two cases of a stationary pedestrianrisk for SUV impacts compared to cars. In staged(mass M
ped) struck by either a car or an SUV (massaccidents using cars striking cadavers, Ishikawa et al.
Mveh
) at a speed vcol
. Assuming a common post-recorded no pelvic fractures [22]. Subsequent simu-impact velocity at the impact location (i.e. plasticlations of these cadaver tests [40] showed pelvis andimpact), a radius of gyration k for the pedestrian,chest accelerations that were only about half as largeand a vertical height difference h between theas thigh and head accelerations, indicating that thepedestrian centre of gravity (cg) and the bonnetpelvis and chest are relatively protected structuresleading edge, then the pedestrian cg velocity afterin standard impacts between cars and adultprimary impact is [42]pedestrians. This can be seen in cases (a) and (c) in
Figs 6, 7, and 8, which show the standard wrapvped_cg=C Mvehk2
k2 [Mveh+Mped)+h2MvehD vcol (1)projection sequence between a pedestrian and apassenger vehicle. In these cases, the pelvis is clearly
For an adult pedestrian mass of 75 kg and heightshielded from the brunt of the impact.L=1.75 m, and using generalized relationshipsEdwards and Green analysed severely injuredbetween the radius of gyration k and the pedestrianpedestrians in the UK and found that in cases wherecg height h
cgcompared to the overall height L frompelvic fracture does occur, although these are not
[43]inherently life threatening, their occurrence is wellcorrelated with pedestrian morbidity and mortality
k=0.23L and hcg=0.57L[41]. They stated that this is because the high loadsrequired for a pelvic fracture result in serious this yields h
cg=1.0 m and k=0.4 m. Then, to com-
pare the mass effects alone, and hence ignoring theaccompanying injuries such as disruption of internalorgans. Lawrence analysed the impulse imparted to shape differences between vehicles and SUVs by
assuming a nominal value for h of 0.15 m and usingthe upper leg/pelvis of pedestrian dummies for avariety of vehicle bonnet designs and found that a mean car and SUV masses of 1275 and 1625 kg
respectively [17], equation (1) shows that for thehigher bonnet height results in a more central impact[12]. In particular, raising the bonnet leading edge car impact, the pedestrian centre of gravity velocity
following primary impact is 83 per cent of theheight by 250 mm nearly doubled the impulse. Thuspelvic fractures may also be correlated with severe collision speed for the car impact and 84 per cent
for the SUV impact. Clearly, when only accountinginjury or death because a pelvic impact means loadtransfer at the pedestrian centre of gravity. A primary for the mass difference between cars and SUVs, there
is a negligible effect on momentum transfer in theimpact to the pelvis from an SUV allows no load
JAUTO319 © IMechE 2006Proc. IMechE Vol. 220 Part D: J. Automobile Engineering
1097Pedestrian risk from cars and sport utility vehicles
primary impact. This is verified by Fig. 13 where predictions for the head, chest, and pelvis are in goodagreement with the real-world findings of Roudsarithe resultant head and pelvis acceleration time
histories for the 10 m/s SUV impact on a side-facing et al. [19]. The results show that, on average, headinjuries are similar or slightly lower from contact withpedestrian are given for the two cases where (a) the
SUV has its correct inertia properties and (b) the SUV SUVs compared to cars, but injuries to the mid-bodyregions are substantially higher. The primary reasonhas the inertia properties of the passenger car. There
is a negligible difference between these two cases. for the increased hazard to pedestrians from SUVsis the high front shape of the bumper and bonnet.Mizuno and Kajzer reached a similar conclusion
using real-world data from Japan [44]. The mass difference between cars and SUVs is notvery significant for pedestrian injury causation. TheHowever, approximating the bonnet leading edge
heights for typical cars and SUVs at 0.7 and 1.0 m location of the primary impact is such that the mid-body region is directly struck in an SUV/pedestrianrespectively, the height difference h between the
bonnet leading edge and the pedestrian centre of collision, allowing less rotation of the body. Thismeans that for pedestrians struck by SUVs there isgravity is 0.3 m for cars and 0 m for SUVs. Application
of equation (1) shows that the pedestrian centre of the combination of a harder primary impact whichoccurs directly with the critical mid-body region.gravity velocity following primary impact is now only
62 per cent of the impact speed for a car impact but Lowering the bumper and bonnet and reducingbonnet stiffness for SUVs would help to reduce96 per cent of the impact speed for an SUV impact.
These results concur approximately with Lawrence’s injuries to these mid-body regions.finding that raising the bonnet leading edge heightfrom 600 to 850 mm nearly doubled the impulse [12].
Therefore, an important effect of the bonnet edge REFERENCESheight is that the pedestrian is struck more centrallyand hence closer to the centre of gravity, which lies 1 Traffic safety facts 2002, National Highway Traffic
Safety Administration, US Department of Trans-at about 57 per cent of body height, i.e. in the regionportation, Washington, DC, 2003.of the pelvis [43]. This increases the impact efficiency
2 Reducing traffic injuries through vehicle safetyand the overall momentum transfer from the vehicleimprovements – the role of vehicle design, Europeanto the pedestrian is greater. Lawrence noticed thisTransport Safety Council, Brussels, 1993.
phenomenon in the 1980s in the context of bonnet 3 Mohan, D., Kajzer, J., Bawa-Bhalla, W., Chawla, A.,heights of passenger cars [12], but this has not been and Sarabjit, S. Impact modelling studies for a threereported with respect to SUVs. wheeled scooter taxi. In Proceedings of the IRCOBI
Conference, Brunnen, Switzerland, 1995, pp. 325–337.8.4 The future 4 Jacobs, G. and Thomas, A. Africa road safety review:
Final Report. US Department of Transport, FederalRecently, designers have attempted to improve SUV Highway Administration, 2000.front-end design by removing additional hazards 5 Walz, F. H., Hoefliger, M., and Fehlmann, W. Speedsuch as bull bars and by creating more curved limit reduction from 60 to 50 km/h and pedestrian
injuries. In Proceedings of the 27th Stapp Car Crashbonnets with a lower primary impact location. ThisConference, San Diego, 1983, SAE paper 831625,is a very positive development and has resulted inpp. 311–318.improvement in EuroNCAP ratings for some SUVs.
6 Liu, X. J., Yang, J. K., and Lovsund, P. A study ofHowever, Snedeker et al. [45] and Kuehn et al.influences of vehicle speed and front structure on
[46] have correctly raised the question of whether pedestrian impact responses using mathematicalthe simplified EEVC tests used in EuroNCAP can models. Traff. Injury Prev., 2002, 3(31), 42.accurately represent the three-dimensional nature of 7 Anderson, R. W. G., McClean, A. J., Farmer, M. J. B.,
Lee, B. H., and Brooks, C. G. Vehicle travel speedsa vehicle/pedestrian impact. The findings of thisand the incidence of fatal pedestrian crashes. Accid.paper suggest that more detailed tests are necessaryAnalysis Prev., 1997, 29(5), 667–674.to assess vehicle front-end shape.
8 Wood, D. P. Pedestrian impact, injury and accidentcausation. In Automotive engineering and litigation(Eds G. A Peters and B. J. Peters), 1991, vol. 4, ch. 39 CONCLUSIONS(John Wiley, New York).
9 Otte, D. Severity and mechanism of head impacts inA review of real-world accident data and the detailed vehicle to pedestrian accidents. In Proceedings of themodels presented in this paper show that pedestrian IRCOBI Conference, Isle of Man, 2001, pp. 329–341.risk when struck by SUVs compared to cars is higher 10 Priorities for EU motor vehicle safety design, European
Transport Safety Council, Brussels, 2001.and the body regions at risk are different. The injury
JAUTO319 © IMechE 2006 Proc. IMechE Vol. 220 Part D: J. Automobile Engineering
1098 C K Simms and D P Wood
11 Niederer, P. and Schlumpf, M. Influence of vehicle 27 Hertz, E. A note on the head injury criterion as apredictor of skull fracture. In Proceedings of the 37thgeometry on impact pedestrian kinematics. SAE
paper 841663, 1984. AAAM Conference, San Antonio, 1993.28 Haffner, M. Synthesis of pelvic fracture criteria for12 Lawrence, G. The influence of vehicle shape on
pedestrian impact energies and its application to lateral impact loading. In Proceedings of the 11thESV Conference, 1985, SAE paper 856022, Nationalsub-system tests. In Proceedings of the 12th ESV
Conference, Gothenburg, 1989. Highway Traffic Safety Administration.29 Zhu, J. Y., Cavanaugh, J. M., and King, A. I. Pelvic13 PricewaterhouseCoopers European Quarterly Review.
New car volume trends, 2005 (Eurocarprice, Aston biomechanical response and padding benefits inside impact based on a cadaveric test series. SAESandford).
14 Lefler, D. E. and Gabler, H. C. The fatality and injury paper 933128, 1993.30 Talantikite, Y., Brun-Cassan, F., Lecoz, J., andrisk of light truck impacts with pedestrians in the
United States. Accid. Analysis Prev., 2004, 36(2), Tarriere, C. Abdominal injury protection in sideimpact – injury mechanisms and protection295–304.
15 Ashton, S. J. and Mckay, G. M. Benefits from changes criteria. In Proceedings of the IRCOBI Conference,Eindhoven, 1993, pp. 131–144.in vehicle exterior design: field accident and experi-
mental work in Europe. SAE paper 830626, 1983. 31 Schmitt, K. U., Niederer, P., and Walz, F. Traumabiomechanics: introduction to accidental injury,16 Roudsari, B., Mock, C., Kaufmann, R., Grossman, D.,
Henary, B., and Crandall, J. Pedestrian crashes: 2004 (Springer, Berlin).32 Yang, J. K., et al. Pedestrian position definition,higher injury severity and mortality rate for light
truck vehicles compared with passenger vehicles. deliverable D8, HUMOS2 Project, GRD-2001-50053,2003.Injury Prev., 2004, 10, 154–158.
17 Ballesteros, M. F., Dischinger, P. C., and 33 Bhalla, K., Montazemi, P., Crandall, J., Yang, J.,Liu, X., Dokko, Y., Takahashi, Y., Kikuchi, Y., andLangenberg, P. Pedestrian injuries and vehicle type
in Maryland, 1995–1999. Accid. Analysis Prev., 2004, Longhitano, D. Vehicle impact velocity prediction:trade offs between throw formulae, crash simulators36(1), 73–81.
18 Longhitano, D., Henary, B., Bhalla, K., Ivarsson, J., and detailed multi-body modelling. In Proceedingsof the IRCOBI Conference, Munich, September 2002.and Crandall, J. Influence of vehicle body type on
pedestrian injury distribution. SAE paper 2005-01- 34 Simms, C. K. and Wood, D. P. Pedestrian impact:The effect of pedestrian motion on head contact1876, 2005.
19 Roudsari, B., Mock, C., and Kaufmann, R. An forces with the ground. In Proceedings of theIRCOBI Conference, Prague, 2005.evaluation of the association between vehicle type
and the source and severity of pedestrian injuries. 35 Simms, C. K., Wood, D. P., and Walsh, D. G.Confidence limits for impact speed estimationTraff. Injury Prev., 2005, 6, 185–192.
20 Madymo database manual, 2004 (TNO, Delft). from pedestrian projection distance. Int. J. Crash-worthiness, 2004, 9(2), 219–228.21 Coley, G., De Lange, R., de Oliviera, P., Neal-
Sturgess, C. E., and Happee, R. Pedestrian human 36 Simms, C. K. and O’Neill, D. Sport utility vehiclesand vulnerable road users. Br. Med. J., 2005, 331,body model validation using detailed real-world
accidents. In Proceedings of the IRCOBI Conference, 787–788.37 Pritz, H. B. Experimental investigation of pedestrianIsle of Man, 2001, pp. 89–101.
22 Ishikawa, H., Kajzer, J., and Schroeder, G. Com- head impacts on hood and fenders of productionvehicles. SAE paper 830055, 1983.puter simulation of impact response of the human
body in vehicle pedestrian accidents. In Proceedings 38 Okamoto, Y., Sugimoto, T., Enomoto, K., andKikuchi, J. Pedestrian head impact conditionsof the 37th Stapp Vehicle Crash Conference, San
Antonio, 1993. depending on the vehicle front shape and its con-struction – full model simulation. Traff. Injury Prev.,23 Okamoto, Y., Akiyama, A., Okamoto, M., and
Kikuchi, Y. A study of the upper leg component 2003, 4, 74–82.39 Matsui, Y., Wittek, A., and Tanahashi, M. Pedestriantests compared with pedestrian dummy tests. In
Proceedings of the ESV Conference, Nagoya, 2001. kinematics due to impacts by various passenger carsusing full scale dummy. Int. J. Veh. Safety, 2005,24 Akiyama, A., Okamoto, M., and Rangarajan, N.
Development and application of the new pedestrian 1(1/2/3), 64–84.40 Yang, J. K. and Lovsund, P. Development anddummy. In Proceedings of the ESV Conference,
Nagoya, 2001. validation of a human body mathematical modelfor simulation of vehicle–pedestrian collisions. In25 Kerrigan, J., Kam, C., Murphy, D., Bose, D.,
Ivarsson, J., and Crandall, J. Kinematic comparison Proceedings of the IRCOBI Conference, Hannover,1997.of the Polar II and PMHS in pedestrian impacts with
a sport utility vehicle. In Proceedings of the IRCOBI 41 Edwards, K. J. and Green, J. F. Analysis of the inter-relationship of pedestrian leg and pelvis injuries. InConference, Prague, 2005, pp. 159–174.
26 Mizuno, K. and Kajzer, J. Head injuries in vehicle Proceedings of the IRCOBI Conference, Sitges, 1999.42 Wood, D. P. Application of a rigid body impactpedestrian impact. SAE paper 2000-01-0157, 2000,
pp. 24–40. model to the pedestrian–vehicle collision. In
JAUTO319 © IMechE 2006Proc. IMechE Vol. 220 Part D: J. Automobile Engineering
1099Pedestrian risk from cars and sport utility vehicles
Proceedings of the IRCOBI Conference, Bron, 1988,pp. 241–252.
43 Wood, D. P. and Walsh, D. G. Pedestrian forwardimpact projection. Int. J. Crashworthiness, 2002,7(3), 285–305.
44 Mizuno, K. and Kajzer, J. Compatibility problemsin frontal, side, single car collisions and car-to-pedestrian accidents in Japan. Accid. Analysis Prev.,1999, 31, 381–389.
45 Snedeker, J., Walz, F., Muser, M., Lanz, C., andSchroeder, G. Assessing femur and pelvis injury riskin car–pedestrian collisions, comparison of full bodyPMTO impacts, and a human body finite elementmodel. In Proceedings of the ESV Conference,Washington, 2005.
46 Kuehn, M., Froeming, R., and Schindler, R. Anadvanced testing procedure for pedestrian carcollisions. Int. J. Veh. Safety, 2005, 1(1/2/3), 65–99.
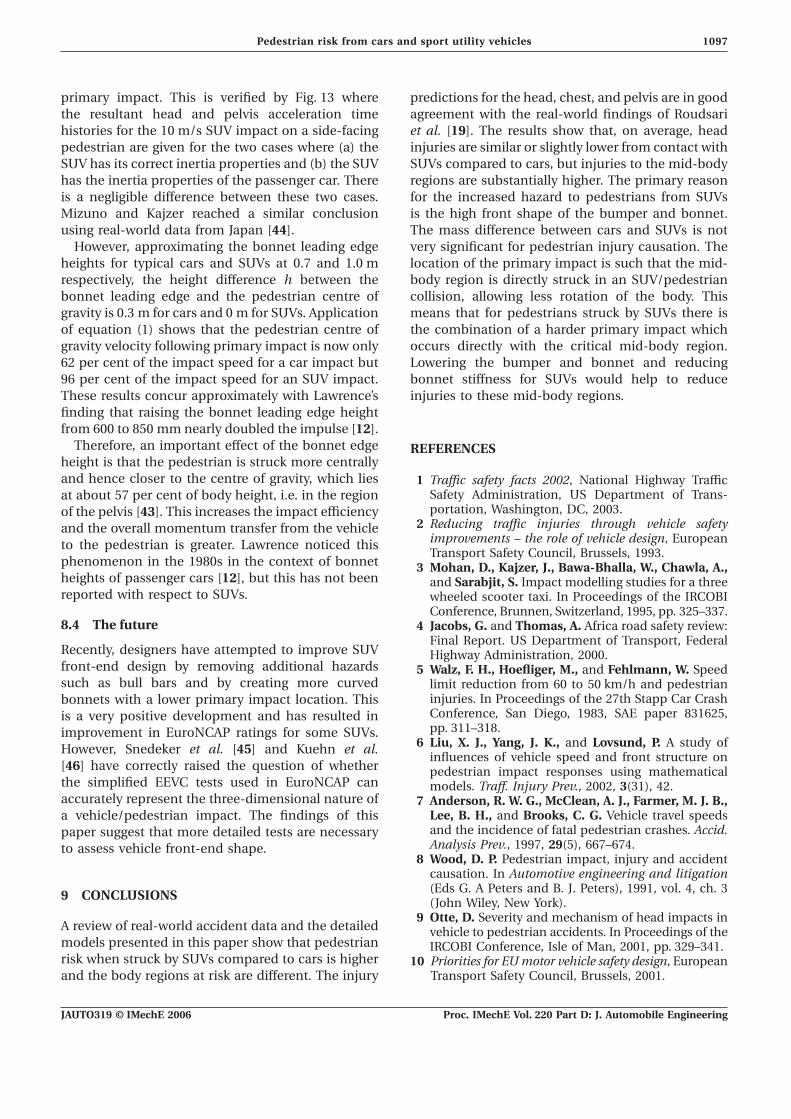
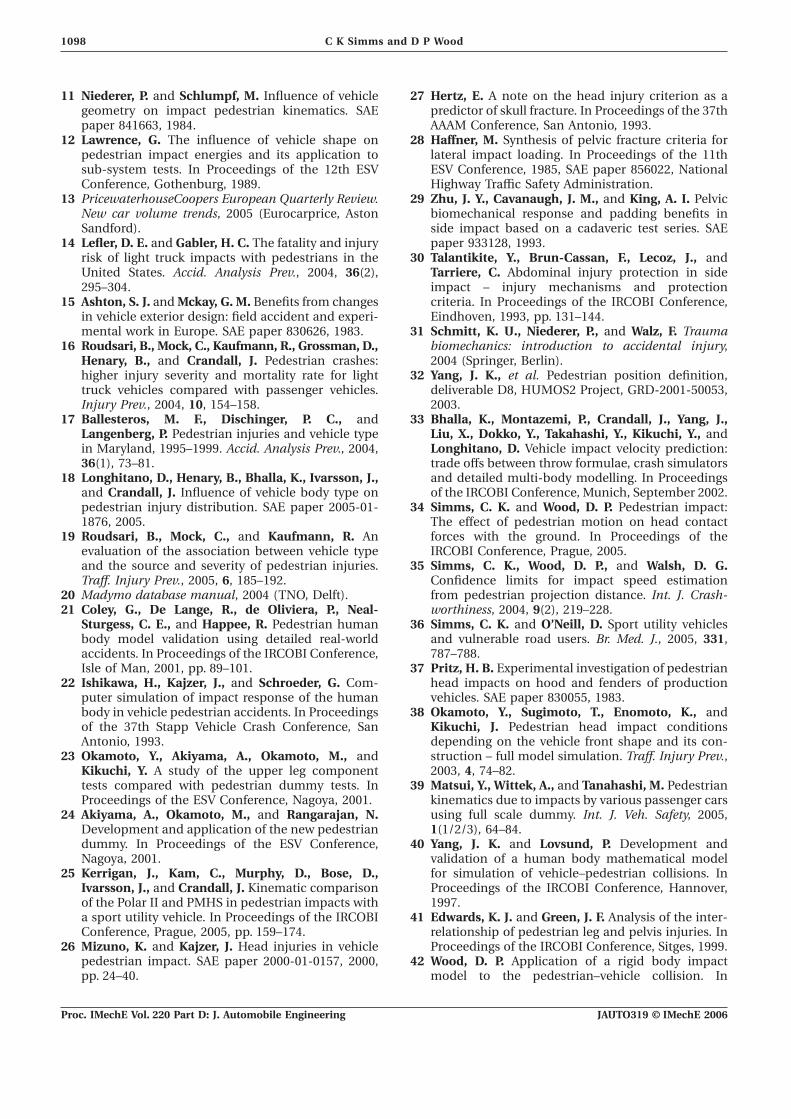
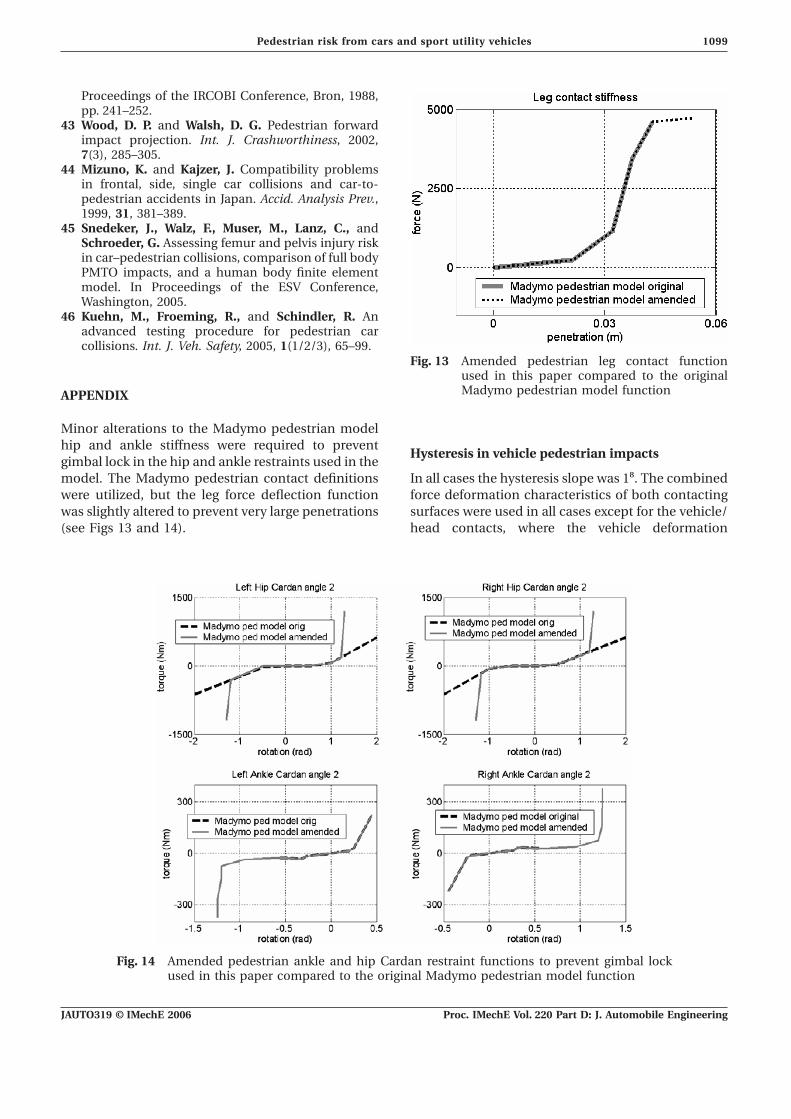
Fig. 13 Amended pedestrian leg contact functionused in this paper compared to the originalMadymo pedestrian model functionAPPENDIX
Minor alterations to the Madymo pedestrian modelhip and ankle stiffness were required to prevent
Hysteresis in vehicle pedestrian impactsgimbal lock in the hip and ankle restraints used in themodel. The Madymo pedestrian contact definitions In all cases the hysteresis slope was 18. The combined
force deformation characteristics of both contactingwere utilized, but the leg force deflection functionwas slightly altered to prevent very large penetrations surfaces were used in all cases except for the vehicle/
head contacts, where the vehicle deformation(see Figs 13 and 14).
Fig. 14 Amended pedestrian ankle and hip Cardan restraint functions to prevent gimbal lockused in this paper compared to the original Madymo pedestrian model function
JAUTO319 © IMechE 2006 Proc. IMechE Vol. 220 Part D: J. Automobile Engineering
1100 C K Simms and D P Wood
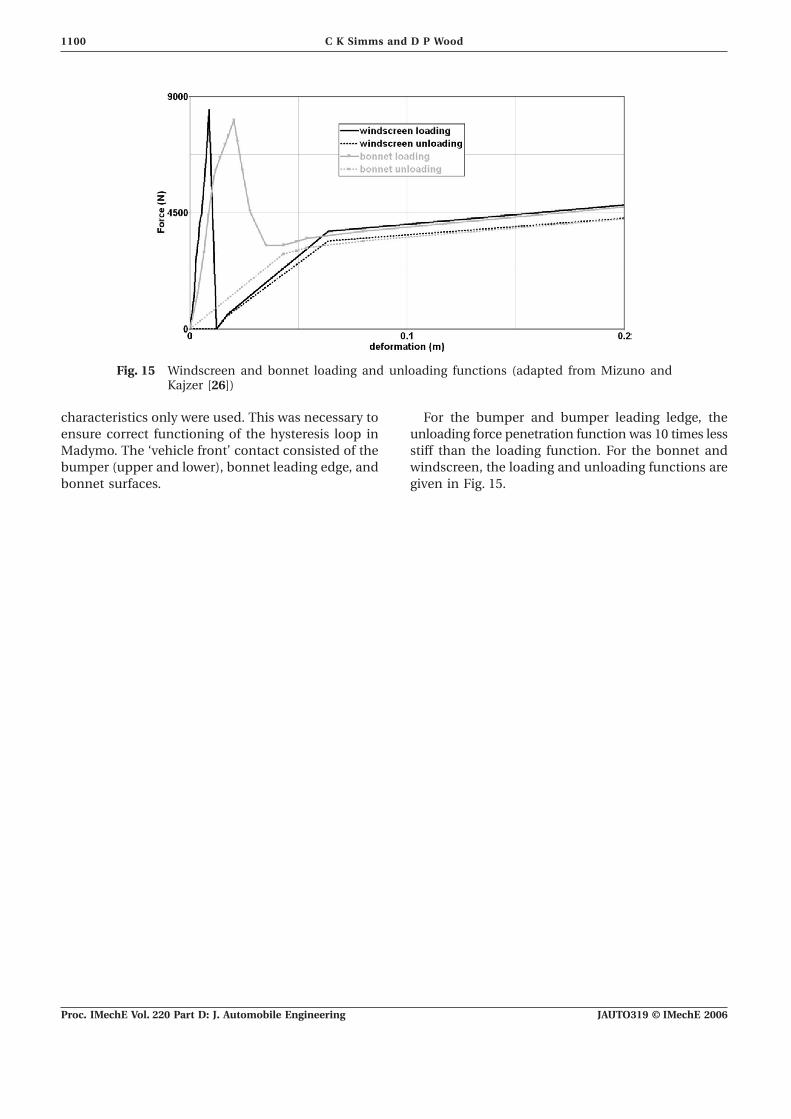
Fig. 15 Windscreen and bonnet loading and unloading functions (adapted from Mizuno andKajzer [26])
characteristics only were used. This was necessary to For the bumper and bumper leading ledge, theunloading force penetration function was 10 times lessensure correct functioning of the hysteresis loop in
Madymo. The ‘vehicle front’ contact consisted of the stiff than the loading function. For the bonnet andwindscreen, the loading and unloading functions arebumper (upper and lower), bonnet leading edge, and
bonnet surfaces. given in Fig. 15.
JAUTO319 © IMechE 2006Proc. IMechE Vol. 220 Part D: J. Automobile Engineering