Pecking Order Theory versus Trade-Off Theory - Universidade do
44
EMPIRICAL ARTICLE Pecking Order Theory versus Trade-Off Theory: are service SMEs’ capital structure decisions different? Ze ´lia Silva Serrasqueiro • Manuel Rocha Armada • Paulo Mac ¸a ˜s Nunes Abstract This paper seeks to analyse if the capital structure decisions of service small and medium-sized enterprises (SMEs) are different from those of other types of firm. To do so, we consider four research samples: (i) 610 service SMEs; (ii) 126 service large firms; (iii) 679 manufacturing and construction SMEs; and (iv) 132 manufacturing and construction large firms. Using the two-step estimation method, the empirical evidence obtained in this study shows that the capital structure decisions of service SMEs are different from those of other types of firm. Service SMEs’ capital structure decisions are closer to the assumptions of Pecking Order Theory and further removed from those of Trade-Off Theory compared with the case of other types of firm. Keywords Other firms Pecking Order Theory Service SMEs Trade-Off Theory Two-step estimation method JEL Classification G32 L80 Z. S. Serrasqueiro P. M. Nunes Management and Economics Department, Beira Interior University, Covilha ˜, Portugal Z. S. Serrasqueiro P. M. Nunes CEFAGE Research Center, E ´ vora University, E ´ vora, Portugal Z. S. Serrasqueiro (&) Faculdade de Cie ˆncias Sociais e Humanas, Universidade da Beira Interior, Estrada do Sineiro, Polo IV, Ernesto Cruz, 6200-209 Covilha ˜, Portugal e-mail: [email protected] M. R. Armada Management and Economics School, Minho University, Braga, Portugal M. R. Armada NEGE Research Center, Minho University, Braga, Portugal Serv Bus (2011) 5:381–409 DOI 10.1007/s11628-011-0119-5
Transcript of Pecking Order Theory versus Trade-Off Theory - Universidade do

EMPIRICAL ARTICLE
Pecking Order Theory versus Trade-Off Theory: areservice SMEs’ capital structure decisions different?
Zelia Silva Serrasqueiro • Manuel Rocha Armada •
Paulo Macas Nunes
Received: 28 March 2011 /Accepted: 15 September 2011 / Published online: 29 September 2011
� Springer-Verlag 2011
Abstract This paper seeks to analyse if the capital structure decisions of service
small and medium-sized enterprises (SMEs) are different from those of other types
of firm. To do so, we consider four research samples: (i) 610 service SMEs; (ii) 126
service large firms; (iii) 679 manufacturing and construction SMEs; and (iv) 132
manufacturing and construction large firms. Using the two-step estimation method,
the empirical evidence obtained in this study shows that the capital structure
decisions of service SMEs are different from those of other types of firm. Service
SMEs’ capital structure decisions are closer to the assumptions of Pecking Order
Theory and further removed from those of Trade-Off Theory compared with the
case of other types of firm.
Keywords Other firms � Pecking Order Theory � Service SMEs � Trade-OffTheory � Two-step estimation method
JEL Classification G32 � L80
Z. S. Serrasqueiro � P. M. Nunes
Management and Economics Department, Beira Interior University, Covilha, Portugal
Z. S. Serrasqueiro � P. M. Nunes
CEFAGE Research Center, Evora University, Evora, Portugal
Z. S. Serrasqueiro (&)
Faculdade de Ciencias Sociais e Humanas, Universidade da Beira Interior,
Estrada do Sineiro, Polo IV, Ernesto Cruz, 6200-209 Covilha, Portugal
e-mail: [email protected]
M. R. Armada
Management and Economics School, Minho University, Braga, Portugal
M. R. Armada
NEGE Research Center, Minho University, Braga, Portugal
123
Serv Bus (2011) 5:381–409
DOI 10.1007/s11628-011-0119-5

2
Pecking Order Theory Versus Trade-Off Theory: Are Service SMEs’
Capital Structure Decisions Different?
1. Introduction
In the context of firms’ financing decisions, after the important contributions by
Modigliani and Miller (1958, 1963), various studies were devoted to investigating what
the main determinants of firms’ capital structure were. In this connection, two theories
are particularly relevant in explaining firms’ capital structure: i) Trade-Off Theory
(Kraus and Litzenberger, 1973; Scott, 1977; Kim, 1978); and ii) Pecking Order Theory
(Myers, 1984; Myers and Majluf, 1984). According to Trade-Off Theory, firms seek to
achieve the target debt ratio that corresponds to the point where the marginal benefits
equal the marginal costs of debt. According to Pecking Order Theory, variations in debt
do not are not motivated by the wish to achieve the target debt ratio, but are the
consequence of the accumulated funding needs that are not covered by internal finance,
and in this situation firms prefer to turn to debt rather than external equity. According to
these two main theories, capital structure decisions are influenced by several firm
characteristics, namely: profitability, size, age, growth opportunities, risk, asset
structure, non-debt tax shields, and others. Pecking Order and Trade-off theories do not
converge regarding the influence of these determinants on capital structure decisions.
Small and medium-sized enterprises (SMEs), mainly smaller and younger firms
with growth opportunities that are associated with high risk, are known to have
difficulty in obtaining external finance. Size and tangible assets can be particularly
important for SMEs with insufficient internal finance to be able to obtain debt on more
advantageous terms to fund the multiple investment opportunities.
rsaraiva
Rectangle
3
Service SMEs have peculiar characteristics that may justify the differences in their
capital structure decisions in comparison to those taken by other types of firm. Indeed,
smaller size together with lower level of tangible assets may aggravate the problems of
information asymmetry between service SME owners/managers and creditors, leading
creditors to impose particularly adverse conditions for these firms to obtain debt.
The service industry sector is especially important in the European economy in
general, and in peripheral economies such as Portugal in particular. In this context, the
service industry sector is especially important for economic and employment growth in
Portugal. SMEs account for 99.68% of all firms in Portugal (INE, 2010). Among
Portuguese SMEs, service SMEs are particularly important. Between 2000 and 2005,
with respect to SMEs in the service industry, growth in the number of firms was found
to be the 10.1%, employment growth was 8.6%, and growth of business turnover was
7.3%. In comparison, concerning SMEs in manufacturing industry, growth in the
number of firms was found to be 4.5%, employment fell by 0.2%, and business turnover
fell by 0.3%.
Given the considerable importance of service SMEs in the Portuguese economy, it is
particularly relevant to study how information asymmetry between these firms and
creditors, influences their capital structure decisions, making service SMEs a special
case regarding financing strategies, compared to what occurs in other types of firms.
Therefore, this paper seeks to analyse if the capital structure decisions of service small
and medium-sized enterprises (SMEs) are different from those of other types of firm
To reach the goal of this study, we use four research samples: i) 610 service SMEs;
ii) 126 large service firms; iii) 679 SMEs in manufacturing and construction industries;
and iv) 132 large firms in manufacturing and construction industries. In this way, we
compare the results obtained for service SMEs with those for larger firms with higher
4
level of tangible assets to analyse the possible influence of problems of information
asymmetry in relationships between service SME owners/managers and creditors on the
financing decisions of service SMEs, compared to what occurs in other types of firm.
Methodologically, so as to avoid possible result bias due to the matter of survival, we
use the two-step estimation method proposed by Heckman (1979). In the first step, we
use probit regressions, considering all service SMEs and other types of firm. In the
second step, after calculating the inverse Mill´s ratio, and including it in the regressions,
considering surviving service SMEs and other surviving firms, we estimate the
regressions with respect to the applicability of Pecking Order Theory and Trade-Off
Theory to the capital structure decisions of service SMEs and other types of firm.
This paper has various original contributions regarding the state-of-the-art of the
literature on SME capital structure in general, and the capital structure of service SMEs
in particular. Firstly, it is pioneering in studying specifically the applicability of
representative models of Pecking Order Theory and Trade-Off Theory to the capital
structure decisions of service SMEs. Secondly, it is pioneering in comparing the
applicability of representative models of Pecking Order Theory and Trade-Off Theory
between the situation of service SMEs and that of other types of firm, namely large
service firms, manufacturing and construction SMEs and large manufacturing and
construction firms. Thirdly, the study is pioneering in applying the two-step estimation
method to the capital structure decisions of service SMEs, and comparing them with the
capital structure decisions of other types of firm.
The multiple empirical evidence presented in this paper allow us to draw a
particularly important conclusion for managers, practitioners and academics: the capital
structure decisions of service SMEs are considerably different from those of other types
of firm, such as large service firms, and SMEs and large firms in manufacturing and

5
construction industries. Decisive for this result could be the combination of smaller size
and lower level of tangible assets that particularly affect service SMEs, compared to
other types of firm.
After this introduction, this paper has the following structure: i) Section 2.
Methodology and Research Hypotheses, presents the models to estimate, the variables
used and corresponding measures, the estimation method and research hypotheses; ii)
Section 3. Database and Descriptive Statistics, presents the database used and the
descriptive statistics of the variables used in the study; iii) Section 4. Results, presents
the empirical evidence obtained in the study; iv) Section 5. Discussion of the Results,
goes on to discuss the empirical evidence obtained; and v) finally, Section 6.
Conclusions and Implications, presents the main conclusions and implications of the
study.
2. Methodology and Research Hypotheses
In this section we present the models used to test the applicability of Pecking Order and
Trade-Off theories to the capital structure decisions of service SMEs and other types of
firm. Initially, we present the models to estimate together with the variables used and
their corresponding measures, and after this we present the research hypotheses.
2.1. Pecking Order Theory
Relationship between Financial Deficit and Debt – POT Model I
Firstly, to test Pecking Order Theory, we use the model proposed by Shyam-Sunder and
Myers (1999). This model consists of testing a regression between financial deficit and
variations in debt.
6
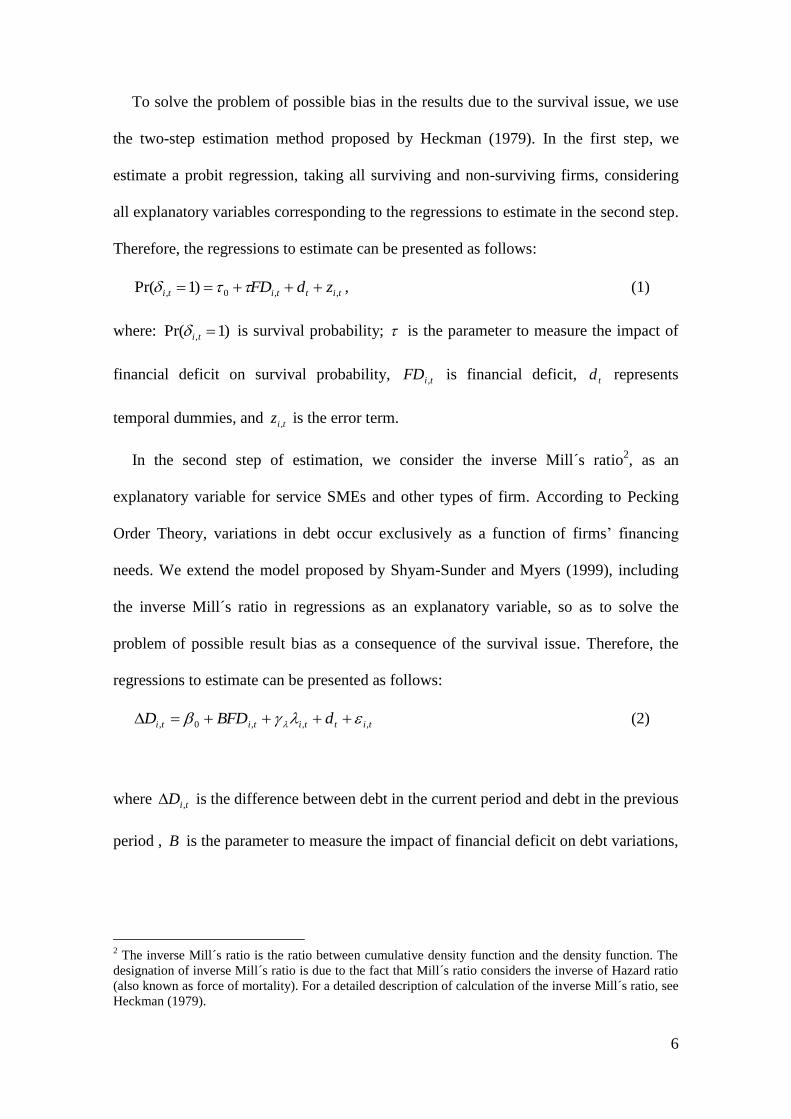
To solve the problem of possible bias in the results due to the survival issue, we use
the two-step estimation method proposed by Heckman (1979). In the first step, we
estimate a probit regression, taking all surviving and non-surviving firms, considering
all explanatory variables corresponding to the regressions to estimate in the second step.
Therefore, the regressions to estimate can be presented as follows:
tittiti zdFD ,,0, )1Pr( , (1)
where: )1Pr( , ti is survival probability; is the parameter to measure the impact of
financial deficit on survival probability, tiFD , is financial deficit, td represents
temporal dummies, and tiz , is the error term.
In the second step of estimation, we consider the inverse Mill´s ratio2, as an
explanatory variable for service SMEs and other types of firm. According to Pecking
Order Theory, variations in debt occur exclusively as a function of firms’ financing
needs. We extend the model proposed by Shyam-Sunder and Myers (1999), including
the inverse Mill´s ratio in regressions as an explanatory variable, so as to solve the
problem of possible result bias as a consequence of the survival issue. Therefore, the
regressions to estimate can be presented as follows:
tittititi dBFDD ,,,0, (2)
where tiD , is the difference between debt in the current period and debt in the previous
period , B is the parameter to measure the impact of financial deficit on debt variations,
2 The inverse Mill´s ratio is the ratio between cumulative density function and the density function. The
designation of inverse Mill´s ratio is due to the fact that Mill´s ratio considers the inverse of Hazard ratio
(also known as force of mortality). For a detailed description of calculation of the inverse Mill´s ratio, see
Heckman (1979).

7
ti , is the inverse Mill’s ratio, td represents temporal dummies, and ti , is the error that
is assumed to have normal distribution.
To estimate equation (2), we turn to OLS regressions for two fundamental reasons:
i) the non-existence of the lagged dependent variable in the relationship forecast by
equation (2) makes use of dynamic estimators impossible; and ii) since the dependent
variable is in first differences, non-observable individual effects ( iv ) become irrelevant,
and it is no impossible to estimate the relationship forecast in equation (2) with panel
models considering random or fixed non-observable individual effects.
Given that heteroskedasticity is normally a relevant phenomenon in empirical
studies that use cross-section data, standard deviations of the parameters are estimated
according to the White estimator. This estimator allows us to obtain standard deviations
of estimated parameters consistent with the possible existence of heteroskedasticity.
Determinants of Debt – POT Model II
Following other studies (Michaellas et al., 1999; Aybar et al., 20043 ; López-Gracia and
Sánchez-Andújar, 2007; López-Gracia and Sogorb-Mira, 2008), we test the Pecking
Order Theory, on the basis of a second regression model, considering the determinants
of debt according to what is predicted by Pecking Order Theory: i) cash flow; ii) age;
and iii) interaction between cash flow and growth opportunities.
As in Model I, in the first step we estimate probit regressions in order to estimate the
inverse Mill´s ratio. The regressions to estimate can be presented as follows:
tit
tititititi
zd
LGOHHCFHGOLCFAGECF
,
,4,3,2,10, )1Pr(
(3)
3 Aybar Arias, C., Casino Martínez, A. and López Gracia, J. (2004). Efectos Financieros y Estratégicos
sobre la Estructura de Capital de la Pequeña y Mediana Empresa. Moneda y Crédito, 58, 71-98.

8
in which: tiCF , corresponds to cash flow, given by the ratio of earnings after interest
and taxes plus depreciation to total assets; tiAGE , , is age, given by the number of years
the firm has been in existence; tiHGOLCF, , are the growth opportunities of firms (i), at
a given moment (t), corresponding to situations of high growth opportunities and low
cash flow; tiLGOHCF, , are the growth opportunities of firm (i), at a given moment (t),
corresponding to situations of low growth opportunities and high cash flow.
To calculate tiHGOLCF, we consider initially a dummy variable with the value of 1
corresponding to firms that, at a given moment, have simultaneously growth
opportunities above the median of growth opportunities of the total sample and cash
flow under the median of cash flow of the total sample; and the value of 0 in the
remaining situations. To calculate tiLGOHCF, we consider, initially, a dummy variable
with the value of 1 when firms, at a given time, have simultaneously growth
opportunities under the median of growth opportunities of the total sample and cash
flow above the median of cash flow of the total sample; and the value of 0 in the
remaining situations. Finally, to calculate the variables tiHGOLCF, and tiLGOHCF, , we
multiply the previously calculated dummy variables by sales growth (considered as a
measure of growth opportunities).
In the second step, to estimate the relationships forecast by Pecking Order Theory
between determinants and debt, for service SMEs and other types of firm, we use static
panel models. The regressions to estimate can be presented as follows:
tititi
tititititi
du
LGOHCFHGOLCFAGECFD
,,
,4,3,2,10,
, (4)

9
in which: tiD , corresponds to debt, given by the ratio of total liabilities to total assets
and iu are firms’ specific factors that are not directly observable from debt
determinants.
We use the LM test in order to verify if non-observable individual effects (ui) are
relevant in explaining debt. The null hypothesis indicates the irrelevance of non-
observable individual effects, against the alternative hypothesis of relevance of non-
observable individual effects. In the case of rejecting the null hypothesis, due to the
relevance of non-observable individual effects in explaining debt, an OLS regression is
not the most appropriate way to estimate the relationships between determinants and
debt. If non-observable individual effects are relevant in explaining debt, we also use
the Hausman test to check whether non-observable individual effects are correlated with
the independent variables. The null hypothesis indicates the non-existence of correlation
between non-observable individual effects and the independent variables, against the
alternative hypothesis that non-observable individual effects are correlated with the
dependent variable. By not rejecting the null hypothesis, non-observable individual
effects are not correlated with the independent variables, and so it makes no difference
estimating relationships between determinants and debt with a random or fixed effect
panel model. In the case of rejecting the null hypothesis, there is correlation between
non-observable individual effects and the independent variables, and so the
relationships between determinants and debt should be estimated using a fixed effect
model.
This paper presents the results of the LM and Hausman tests for the different types
of firms considered, and the most suitable model for estimating results with respect to to
relationships between determinants and debt for the different types of firms considered.
10
Research Hypothesis
According to Pecking Order Theory, variations in debt occur exclusively as a function
of firms’ financing needs, i.e., debt variations are a function of the financial deficit
found at a given time (Shyam-Sunder and Myers, 1999). In addition, according to
Pecking Order Theory, we can also expect that: i) firms with greater cash flow resort
less to debt (Myers, 1984; Myers and Majluf, 1984); ii) older firms resort less to debt
(Diamond, 1989; Ang, 1991); iii) firms with greater growth opportunities and low cash
flow resort more to debt (Myers, 1984); and iv) firms with low growth opportunities and
high cash flow resort less to debt (Myers, 1984).
In the SME context, various studies point toward firms preferring to fund themselves
through retained profits, or else through recourse to the savings of family or friends
(Pettit and Singer, 1985; Ang 1992; Scherr and Hulburt 2001; López-Gracia and
Sánchez-Andújar, 2008; Ramalho and Silva 2009). SME preference for retained profits
is related to the particular difficulties faced by SMEs in obtaining external finance, due
to their greater likelihood of bankruptcy (Pettit and Singer, 1985; Ang, 1991). Indeed,
Franco and Haase (2010) conclude that financing restrictions are one of the main
problems affecting these firms’ survival in their operating markets.
Cruz-Ros et al. (2010) conclude that intangible assets are particularly relevant for
increased performance in service firms. However, the authors conclude that service firm
activities based on intangible assets may contribute to these firms having greater
difficulty in obtaining debt. According to Cressy and Olofsson (1997) and Abor (2007),
for SMEs with higher level of tangible assets it is easier to obtain debt than for SMEs
whose activities are based predominantly on intangible assets. For Cressy and Olofsson
(1997), greater intangibility of assets in service firms in general, and service SMEs in
particular, contributes decisively to these firms to have greater difficulty in obtaining

11
debt than may be the case of firms belonging to other sectors of activity where tangible
assets are more important.
Service SMEs may be particularly dependent on internal finance to fund their
multiple growth opportunities. Smaller size, associated with the importance of
intangible activities in these firms’ activities, and consequently lower capacity in
providing tangible assets security on debt may aggravate the problems of information
asymmetry. Therefore, creditors may hinder service SMEs’ access to debt. When
internal finance is insufficient, service SMEs’ particular difficulty in obtaining external
funding may prevent these firms from taking advantage of the multiple opportunities
available to this type of firm. The majority of service SMEs do not fulfill the
requirements to be listed in the stock market, and when firms have little tradition of
using venture capital, as occurs in peripheral economies like Portugal, SMEs are
restrained in using alternative funding sources to internal finance.
Based on the above arguments, we can expect that: i) the impact of financial deficit
on variations of debt is of a greater magnitude for service SMEs than for other types of
firm; ii) as a function of cash flow, age, low growth opportunities and high cash flow,
service SMEs turn less to debt than other types of firms,; and iii) in situations of high
growth opportunities and low cash flow, service SMEs turn less to debt than other types
of firm. Therefore, we formulate the following research hypothesis:
H1: The capital structure decisions of service SMEs are closer to what is forecast by
Pecking Order Theory than the capital structure decisions of other types of firm.

12
2.2. Trade-Off Theory
Adjustment of Actual Level of Debt toward Target Debt Ratio and Debt Determinants
We present the partial adjustment that allows us to test the degree of adjustment of
actual debt toward target debt ratio, and the relationships between debt and determinants
forecast by Trade-Off Theory. Firstly, we estimate probit regressions, considering as
explanatory variables the determinants of debt according to Trade-Off Theory. The
regressions to estimate can be presented as follows:
titStiti
tititititi
zdDEVOLETRNDTS
GOTANGSIZEPROF
,7,6,5
,4,3,2,10, )1Pr(
, (5)
in which: profitability ( tiPROF , ) is given by the ratio of earnings before interest and
taxes to total assets; size ( tiSIZE , ) is the natural logarithm of total assets; asset
tangibility ( tiTANG , ) is the ratio of tangible assets to total assets; growth opportunities
( tiGO , ) is the growth of total assets; non-debt tax shields ( tiNDTS , ) is the ratio of
depreciations and amortizations to total assets; effective tax rate ( tiETR , ) is the ratio of
actual income tax paid to net taxable income before taxes; level of risk ( tiEVOL , ) is the
absolute value of the first difference of percentage change of earnings before interest,
taxes and depreciation.
In the second step of estimation, we estimate the adjustment of the actual debt level
in service SMEs and other types of firm, toward respective target debt ratios, as well as
the relationships between determinants and debt forecast by Trade-Off Theory, using
the GMM system (1998) dynamic estimator. To do so, just as López-Gracia and

13
Sánchez-Andujar (2007) and López-Gracia and Sogorb-Mira (2008), we use the partial
adjustment model, which is given by:
)*( 1,,1,, titititi DDDD , (6)
in which: 1, tiD is the debt of firm i in the period t-1; *,tiD is the target debt ratio of
firm i in period t, and is the speed of adjustment of actual level of debt toward target
debt ratio.
To estimate the above equation it is necessary to find the target debt ratio that is not
directly observable. In this study we consider just as López-Gracia and Sánchez-
Andújar (2007) and López-Gracia and Sogorb-Mira (2008), that target debt ratio
depends on firms’ specific characteristics. Therefore, firms’ target debt ratio is given by:
n
K
tiitStitikKti vudDZD1
,,,,, * , (7)
in which tiKZ ,, is the determinant k of the debt of firm i at time t, K are the
coefficients of each debt determinant and tiv , is the error term.
Substituting (7) in (6) and regrouping the terms, we have:
n
K
tititikKtiti ZDD1
,,,1,0, , (8)
in which: )1(0 , KK , ii u , tt d , and titi v ,, .
To estimate the equation (8) on the basis of traditional panel methods, considering
fixed or random individual effects, we obtain biased and inconsistent estimates of the
parameters, given that, asides from the existence of correlation between i and 1, tiD ,
there is also correlation between ti , and 1, tiD , i.e., firms’ non-observable individual
effects and the error are correlated with the lagged debt. In addition, use of dynamic

14
estimators rather than use of traditional panel methods has the following extra
advantages: i) greater control of endogeneity; ii) greater control of possible collinearity
between explanatory variables; and iii) greater effectiveness in controlling effects
caused by the absence of relevant explanatory variables for the results.
This study uses the Generalized Moments Method – GMM system (1998) estimator
by Blundell and Bond (1998) to estimate the model of partial adjustment. Blundell and
Bond (1998) conclude that when the dependent variable is persistent, the GMM system
(1998) estimator is more robust than the Generalized Moments Method – GMM (1991)
estimator4. Blundell and Bond (1998) extend the GMM (1991) estimator, considering a
system of variables at level and in first differences. For the variables at level the
instruments are presented in first differences, and for the variables in first differences
the instruments are presented at level.
Nevertheless, the GMM system (1998) estimator can only be considered valid if: i)
the restrictions, a consequence of use of the instruments, are valid; and ii) there is no
second-order autocorrelation.
To test the validity of the restrictions, we use the Hansen test. The null hypothesis
indicates that the restrictions, imposed by use of the instruments, are valid. By rejecting
the null hypothesis, we conclude that the restrictions are not valid, and so the results are
not robust. We test for the existence of first and second-order autocorrelation. The null
hypothesis is that there is no autocorrelation. Rejecting the null hypothesis of non-
existence of second-order autocorrelation, we conclude that the results are not robust.
For the results of the GMM system (1998) estimator to be considered robust, the
4 In this study, we find persistence of debt for service SMEs and other types of firms. The correlation
coefficient of present debt and previous debt is 0.81991 in service SMEs, 0.84513 in large service firms,
0.82737 in other SMEs, and 0.85616 in other large firms. Therefore, it is clearly advisable to use the
GMM system (1998) estimator, rather than the GMM (1991) estimator.

15
restrictions imposed by use of the instruments have to be valid and there can be no
second-order autocorrelation.
To test the robustness of the empirical evidence obtained, we use the LSDVC
(2005) estimator, proposed by Bruno (2005). The LSDVC (2005) estimator is
appropriate in situations without a great number of observations. If the number of cross-
sections is below 30, it is recommendable to use the LSDVC (2005) estimator to test the
robustness of the results obtained with the GMM system (1998) estimator. The results
are presented in an appendix.
Research Hypothesis
According to Trade-Off Theory, firms adjust the actual debt level toward a target debt
ratio (Lev and Pekelman, 1975; Ang, 1976; Taggart, 1977; Jalilvand and Harris, 1984).
Lower transaction costs borne by firms in obtaining debt will correspond to greater
adjustment of the actual debt level toward the target debt ratio. Also according to Trade-
Off Theory, we can expect that: i) firms with level of profitability turn more to debt
(Kraus and Litzenberger, 1973; Scott, 1977; Kim, 1978); ii) larger firms turn more to
debt (Rajan and Zingales, 1995); iii) firms with more tangible assets turn more to debt
(Myers, 1977; Scott, 1977; Myers and Majluf, 1984; Harris and Raviv, 1991); iv) firms
with greater growth opportunities turn less to debt (Jensen and Meckling, 1976; Myers,
1977; Stulz, 1990; McConnell and Servaes, 1995; Barclay et al., 2006); v) firms with
greater non-debt tax shields turn less to debt (DeAngelo and Masulis, 1980); vi) firms
with higher effective tax rates turn more to debt (Haugen and Senbet, 1986; Scott, 1976;
DeAngelo and Masulis, 1980); and vii) firms with greater risk turn less to debt (Bradley
et al., 1984; Mackie-Mason, 1990).

16
Service SMEs can be particularly affected by problems of information asymmetry in
the relationships between owners/managers and creditors. Service SME special
characteristics, such as higher levels of intangible assets, and consequently lower level
of tangible assets may lead lenders to make credit difficult. Furthermore, SMEs’ smaller
size and consequently higher level of risk and probability of bankruptcy may lead
creditors to associate this type of firm with high risk, and consequently make terms of
credit difficult.
Small firms are known to have a high business risk associated with their activities,
and high bankruptcy costs, which may imply high transaction costs in obtaining debt
(Revest and Sapio, 2010).
Due to the high information asymmetry in relationships between the
owners/managers of service SMEs and creditors, these firms may find it particularly
difficult to obtain debt, compared to other types of firms. Indeed, firstly the greater size
of large service firms may contribute to reducing the information asymmetry implicit in
the relationships established with creditors, contributing to debt being obtained on more
advantageous terms. Secondly, in general, the higher level of tangible assets in firms in
other industries, namely those belonging to the manufacturing and construction
industries implies that their risk default become lower. Therefore, it is easier for firms
belonging to the manufacturing and construction industries to obtain debt. For example,
large firms in the manufacturing and construction industries might find much easier to
obtain debt, due to their greater size together with higher level of tangible assets, than
service SMEs.
Elston and Audretsch (2009) state that recourse to debt on particularly adverse terms
imposed by creditors can harm firm’s profitability, therefore contributing to diminished

17
probability of survival. Therefore, firms that face particularly harsh credit terms may
choose debt only in cases of extreme fund needs.
The greater information asymmetry associated with relationships between service
SME owners/managers and creditors, and consequently higher transaction costs for this
type of firm, may lead service SMEs to consider the reaching of the target debt ratio as a
merely secondary objective.
Firms with greater size (Pettit and Singer, 1985; Ang, 1991), and/or with higher level
of tangible assets (Holmes and Kent, 1991; Abor, 2007), consequently with less
problems of information asymmetry, may have lower transaction costs associated with
debt. Consequently, greater firms and firms with greater level of tangible assets can
choose strategies more oriented to the long-term, i.e., more directed toward increasing
firm value rather than using external finance only to cover insufficiencies of internal
finance.
On the basis of the above exposition, we can expect that the financing behavior of
service SMEs is further removed from the assumptions of Trade-Off Theory as other
types of firm, and so we can expect that: i) service SMEs have a lower speed of
adjustment of the actual level of debt toward target debt ratio than do the other types of
firm; ii) service SMEs resort less to debt as a function of profitability, size, tangible
assets, and effective tax rate than do the other types of firm; and iii) service SMEs resort
more to debt as a function of growth opportunities, non-debt tax shields and risk,
compared to the other types of firm. Based on the above, we formulate the following
research hypothesis:
H2: The capital structure decisions of service SMEs are further removed from the
forecasts of Trade-Off Theory than do the capital structure decisions of other types of
firms.

18
3. Database and Descriptive Statistics
3.1. Database
This study uses the SABI (Analysis System of Iberian Balance Sheets) database,
supplied by Bureau van Dijk for the period between 1999 and 2006. The selection of
firms by industry sector was done in accordance with the NACE (Classification of
Economic Activities in the European Union) classification5. We select SMEs based on
the European Union recommendation L124/36 (2003/361/CE). According to this
recommendation, a firm is considered an SME when it meets two of the following
criteria: i) fewer than 250 employees; ii) total assets under 43 million euros; and iii)
turnover under 50 million euros. Firms that do not meet these criteria are considered
large firms.
To solve the problem of possible result bias due to the matter of the survival effect,
and also seeking to have a more representative sample of the Portuguese firms, we
consider three types of firm: i) firms belonging to the market for the whole period of
analysis (1999-2006); ii) firms entering the market during the period of analysis (1999-
2006); and iii) firms leaving the market during the period of analysis (1999-2006).
Given the use of dynamic panel estimators, there are restrictions in including firms
that are in the sample for a very limited number of years. According to Arellano and
Bond (1991), firms must be present in the database for at least four consecutive years to
be considered in the econometric analysis and in the second-order autocorrelation tests
5 Services include: Real Estate Activities; Renting of Machinery and Equipment without Operator and
Personal and Household Goods; Computer and Related Activities; and Other Business Activities. Other
firms include: Manufacture of food products; Manufacture of textiles; Manufacture of wood and paper-
related products; Manufacture of chemicals and chemical products; Manufacture of basic metals;
Manufacture of machinery and equipment; and Construction.

19
that are essential to validate the robustness of the results. Thus, in selecting service
SMEs and other types of firms we consider, besides the criteria stated above, their
inclusion in the samples for at least four consecutive years.
Based on the above criteria, we obtain four research samples with the following
composition: i) sample of 610 service SMEs, of which 468 are in the market for the
whole period of analysis, 66 enter the market during the period of analysis, and 76 leave
the market during the period of analysis; ii) sample of 126 large service firms, of which
112 are in the market for the whole period of analysis, 4 enter the market during the
period of analysis, and 10 leave the market during the period of analysis; iii) sample of
679 SMEs in manufacturing and construction industry sector, of which 506 are in the
market for the whole period of analysis, 61 enter the market during the period of
analysis, and 112 leave the market during the period of analysis; and iv) sample of 132
large manufacturing and construction firms, of which 107 are in the market for the
whole period of analysis, 6 leave the market during the period of analysis, and 19 enter
the market during the period of analysis.
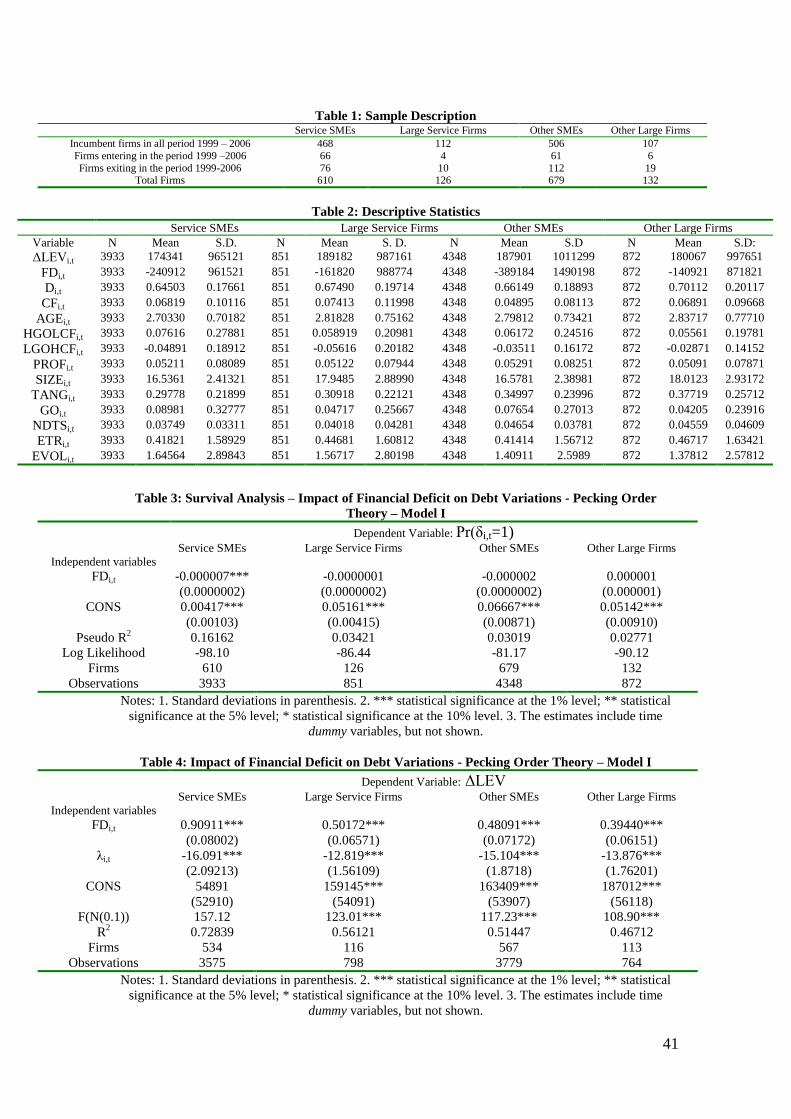
The structure of the samples used in the paper is presented in Table 1.
(Insert Table 1 About Here)
3.2. Descriptive Statistics
Table 2 presents the descriptive statistics of the variables used in this study concerning
service SMEs and other types of firm6.
(Insert Table 2 About Here)
6 For service SMEs, the median of cash flow is 0.067818, being 0.07231 for large service firms, 0.05018
for other SMEs, and 0.06661 for other large firms. The median of growth opportunities is 0.08516 for
service SMEs, being 0.04561 for large service firms, 0.07918 for other SMEs, and 0.04019 for other large
firms.
The median values of the cash flow and growth opportunities variables used for calculating the HGOLCF
and LGOHCF variables are calculated according to what is presented in section 3. Methodology and
Research Hypotheses.
20
It stands out that service SMEs, compared to what occurs in other types of firm, have
on average: i) greater growth opportunities and greater risk; and ii) less variation of
debt, less debt, lower age, lower level of tangible assets and lower non-debt tax shields.
4. Results
4.1. Pecking Order Theory
Relationship between Financial Deficit and Debt – POT Model I
Table 3 presents the results of the survival analysis referring to Model I of Pecking
Order Theory.
(Insert Table 3 About Here)
We find that financial deficit contributes to diminished probability of survival in
service SMEs, which does not occur with respect to other types of firm. This result
reveals the particular importance that financing restrictions may have for service SMEs,
particularly for their survival.
The following tables present the results of the tests of Pecking Order Theory,
regarding Model I.
(Insert Table 4 About Here)
(Insert Table 5 About Here)

21
A positive relationship is found between financial deficit and debt variations in
service SMEs and in the other types of firm considered. However, we find that the
coefficient estimated that measures the relationship between financial deficit and debt
variations is considerably higher in service SMEs than in other types of firm. The
results of the Chow test confirm this, rejecting in all circumstances the null hypothesis
of equality of the estimated parameters measuring relationships between financial
deficit and debt variations in service SMEs and other types of firms.
Additionally, we find that the regression constant is not significant when the subject
of analysis is service SMEs, but it is significant in the case of other types of firm. This
result reinforces the idea of the particular importance of financial deficit in explaining
variations of the debt of service SMEs, compared to the situation of other types of firm.
In all regressions, the statistically significant relationship between the inverse Mill´s
ratio and variations in debt allows us to conclude that the inclusion of the inverse Mill´s
ratio in regressions was effective in controlling for possible bias in the results estimated.
Determinants of Debt – POT Model II
Table 6 presents the results of the survival analysis regarding Model II of Pecking Order
Theory.
(Insert Table 6 About Here)
The results suggest that cash flow is important for the survival of service SMEs and
other types of firm. However, the magnitude of the estimated parameters indicates that
the importance of cash flows greater for service SMEs than for other types of firm. In
addition, age seems to be important for the survival of service SMEs, and large service
firms as well as for the survival of manufacturing and construction SMEs. Considering

22
the magnitude of the estimated parameters, the importance of age seems to be greater
for the survival of service SMEs.
The following tables present the results of the tests of Pecking Order Theory,
concerning Model II.
(Insert Table 7 About Here)
(Insert Table 8 About Here)
In all of the regressions estimated, the results of the LM test indicate the rejection of
the null hypothesis of irrelevance of non-observable individual effects. Therefore, an
OLS regression is not the most appropriate way to estimate the relationships between
determinants and debt in service SMEs and other types of firm. Additionally, the results
of the Hausman test indicate the rejection of the null hypothesis of absence of
correlation between non-observable individual effects and explanatory variables, and so
nor is a regression considering random non-observable individual effects a suitable way
to estimate the relationships between determinants and debt in service SMEs and other
types of firm. This being so, the most correct way to estimate the relationships between
determinants and debt in service SMEs and other types of firm is to consider fixed non-
observable individual effects in the regressions.
For service SMEs, we find that: i) greater cash flow, greater age and situations of low
growth opportunities and high cash flow contribute to reduced debt; and ii) situations of
high growth opportunities and low cash flow contribute to increased debt. For the
remaining types of firm, cash flow is also found to contribute to reduced debt, the same
is verified with respect to age for large service firms as well as for manufacturing and
construction SMEs7. We also find that situations of high growth opportunities and low
7 Although in this case the relationship is only statistically significant at 10% level.

23
cash flow contribute to increased debt in large service firms as well as in manufacturing
and construction SMEs, whereas situations of low growth opportunities and high cash
flow contribute to reduced debt in manufacturing and construction SMEs. The results of
the Chow test indicate that for all determinants, the null hypothesis of equality of
estimated parameters is rejected. The result of the Chow test of parameters as a whole
confirms those differences. In all regressions estimated, a statistically significant
relationship is found between the inverse Mill´s ratio and debt. We can therefore
conclude that the inclusion of the inverse Mill´s ratio in regressions was shown to be
effective in solving possible bias in the results obtained.
4.2. Trade-Off Theory
Table 9 presents the results of the survival analysis regarding the Trade-Off Theory
model.
(Insert Table 9 About Here)
From the results presented in Table 9 and considering the magnitude of the estimated
parameters, we highlight the following: i) profitability is particularly important for the
survival of service SMEs, risk being particularly important for diminished survival of
this type of firm; and ii) size and tangible assets are particularly important for the
survival of SMEs, and large firms belonging to the manufacturing and construction
industries.
Tables 10 and 11 present the results of the tests of Trade-Off Theory.
(Insert Table 10 About Here)
(Insert Table 11 About Here)

24
Regardless of taking service SMEs or other types of firm as the subject of analysis,
the results of the Hausman test indicate that we cannot reject the null hypothesis of
validity of the instruments used. In addition, the results of the second-order
autocorrelation tests indicate that we cannot reject the null hypothesis of absence of
autocorrelation. Based on the results of the Hansen and second-order autocorrelation
tests, we can consider the results obtained with the GMM system (1998) estimator as
valid, and consequently open to interpretation.
We find that service SMEs: i) adjust actual debt toward target debt ratio; ii) reduce
the level of debt as a function of greater profitability; and iii) reduce the level of debt as
a function of greater size and higher levels of tangible assets. As for other types of firm,
we find that: i) they adjust actual debt toward target debt ratio, ii) reduce the level of
debt as a function of greater profitability as well as of greater non-debt tax shields,
while they increase the level of debt as a function of higher level of tangible assets debt;
iii) manufacturing and construction SMEs increase the level of debt as a function of
greater size iv) manufacturing and construction SMEs and large firms reduce the level
of debt as a function of greater growth opportunities; v) large service firms as well as
manufacturing and construction large firms increase the level of debt as a function of
higher effective tax rates; and vi) manufacturing and construction SMEs and large firms
diminish the level of debt as a function of greater risk.
Regarding the regressions presented in Table 10, but using the LSDVC (2005)
estimator, the results presented in appendix are relatively similar to those presented in
Table 10, with respect to sign, magnitude and statistical significance of the estimated
parameters, which confirms the robustness of the results presented. The results of the
Chow test indicate that we can reject the null hypothesis of equality of estimated
parameters, except for the determinants of growth opportunities and risk in comparing

25
service SMEs and large service firms, and those of growth opportunities and effective
tax rate in comparing service SMEs, and manufacturing and construction SMEs. The
result of the Chow test of estimated parameters as a whole confirms that there are
significant differences in the determinants of debt in service SMEs and other types of
firm.
Inclusion of the inverse Mill´s ratio in the regressions was also found to be effective
in controlling for possible bias in the estimated results, since a statistically significant
relationship is found between the inverse Mill´s ratio and debt.
5. Discussion of Results
The impact of financial deficit on debt variations in service SMEs (B=0.90911) is
greater than in the context of large service firms (B=0.50172), manufacturing and
construction SMEs (B=0.48091) as well as for manufacturing and construction large
firms (B=0.39440). The results of the Chow test confirm these differences. In addition,
the regression constant regarding the relationship between financial deficit and debt
variations in service SMEs is not statistically significant, but it is not the case in any
other type of firm. This empirical evidence indicates that recourse to debt by service
SMEs is considerably more influenced by insufficient internal finance than what occurs
in other types of firm.
The relationships identified between determinants and debt in service SMEs and
other types of firm allow us to draw various conclusions. Firstly, we find that service
SMEs reduce recourse to debt in situations of low growth opportunities and high cash
flow, which agrees with the forecasts of Pecking Order Theory. This result is not found
for any other type of firm. Secondly, greater cash flow implies less recourse to debt in
service SMEs and other types of firm, corroborating what is forecast by Pecking Order

26
Theory. However, the magnitude of that reduction in recourse to debt is greater in
service SMEs than in other types of firm. The results of the Chow test confirm those
differences. Thirdly, greater age contributes to reduced recourse to debt in service SMEs
and large firms, and in manufacturing and construction SMEs, corroborating Pecking
Order Theory. The magnitude of reduction in debt, as a consequence of greater age, is
greater in service SMEs than in other types of firm. This result is also confirmed by the
Chow test. Therefore, age is not a determinant of debt for large manufacturing and
construction firms. Fourthly, situations of high growth opportunities and low cash flow
contribute to increased recourse to debt in service SMEs and large firms, and in
manufacturing and construction SMEs, corroborating what is forecast by Pecking Order
Theory. However, the magnitude of the increase in debt is greater in service SMEs than
in large service firms and manufacturing and construction SMEs, a situation that is
confirmed by the results of the Chow test. As for large manufacturing and construction
firms, we find that situations of high growth opportunities and low cash flow imply
neither more nor less recourse to debt.
The multiple empirical evidence obtained allows us to conclude that service SMEs
turn more to debt as a function of financial deficit and high growth opportunities and
low cash flow, and turn less to debt as a function of cash flow, age and situations of low
growth opportunities and high cash flow than is the case in other types of firm. We can
therefore conclude that capital structure decisions in service SMEs are closer to the
forecasts of Pecking Order Theory than the capital structure decisions of other types of
firm, and so we can accept the previously formulated hypothesis H1 as valid.
The importance of internal finance in SME activity (Pettit and Singer, 1985; Ang
1992; Scherr and Hulburt 2001; López-Gracia and Sánchez-Andújar, 2008; Ramalho
and Silva 2009) seems to be particularly strong in service SMEs. This importance is

27
reinforced by the particular relevance of cash flow for the survival of service SMEs, and
also by the fact that financial deficit contributes to diminishing the survival of service
SMEs that does not occur in other types of firm. The conclusions of Franco and Haase
(2010) that financing restrictions may affect SME survival seem to be particularly
relevant in service SMEs.
The smaller size of SMEs, and consequently greater probability of bankruptcy
(Pettit and Singer, 1985; Ang, 1991), associated with higher level of intangible assets
(Cruz-Ros et al., 2010), may decisively contribute to service SMEs to have particular
difficulty in obtaining debt. Therefore, service SMEs may turn to debt only in cases of
need, i.e., when internal funds are clearly insufficient to finance their activities.
The empirical evidence obtained corroborates the conclusions of Cressy and
Olofsson (1997) and Abor (2007), since service SMEs’ lower level of tangible assets
compared to manufacturing and construction8, SMEs’ level of tangible assets may
decisively contribute to increasing the problems of information asymmetry faced by
service SMEs in the relationships with creditors, contributing to internal finance being
their main source of funding.
Regarding the applicability of the assumptions of Trade-Off Theory to the capital
structure decisions of service SMEs and those of other types of firm, we find that their
level of adjustment of actual debt level toward target debt ratio is lower (α=0.21880)
than the level of adjustment verified in large service firms (α=0.40808), in
manufacturing and construction SMEs (α=0.37069) as well as in manufacturing and
construction large firms (α=0.52284). The results of the Chow test confirm the
differences in the adjustments of actual debt level toward the target debt ratio between
service SMEs and other types of firm.
8 From the results presented in Table 2, we see that on average, the tangible assets of service SMEs are
0.29778, while the tangible assets of manufacturing and construction SMEs are 0.34997.

28
With respect to the relationships between determinants and debt, the empirical
evidence allows us to draw important conclusions regarding the applicability of the
assumptions of Trade-Off Theory to the capital structure decisions of service SMEs and
other types of firm. Firstly, greater profitability does not contribute to increased
recourse to debt in service SMEs and other types of firm, which does not corroborate
what is forecast by Trade-Off Theory, because firms do not take advantage of greater
profitability to increase debt tax-shields, arising from greater level of debt. Secondly,
greater growth opportunities, greater non-debt tax shields, and greater risk imply less
recourse to debt by SMEs and large manufacturing and construction firms, results which
are in accordance with Trade-Off Theory. In service SMEs, growth opportunities, non-
debt tax shields, and risk are not determinants of their level of debt. In large service
firms, only non-debt tax shields are a determinant of debt, but growth opportunities and
risk are not determinants of debt. Thirdly, higher effective tax rates contribute to greater
recourse to debt by large service firms and large manufacturing and construction firms,
these results corroborating the forecasts of Trade-Off Theory. Higher effective tax rates
are not a determinant of debt in service SMEs and large service firms.
Fourthly, greater size contributes to increased recourse to debt by service and
manufacturing/construction SMEs, corroborating the forecasts of Trade-Off Theory, but
it is not a determinant of debt in large service firms and large
manufacturing/construction firms. In addition, greater tangibility of assets contributes to
service SMEs, and large service as well as manufacturing/construction firms turning
more to debt, these results agreeing with Trade-Off Theory. It stands out that size and
asset tangibility are of greater relative importance for increased recourse to debt in
service SMEs than in other types of firm, a situation confirmed by the results of the
Chow test.
29
Contrary to our expectations, greater size and higher level of tangible assets are of
greater relative importance for service SMEs turning to debt, compared to the case in
other types of firm. Considering only relationships between size and debt, and between
tangible assets and debt, we would conclude that the capital structure decisions of
service SMEs are closer to the forecasts of Trade-Off Theory than the capital structure
decisions of other types of firm. These results may arise from the importance of greater
size and level of tangible assets to reduce the problems of information asymmetry,
therefore creditors grant debt in more favourable terms to service SMEs. The marginal
importance of size and tangible assets to obtain debt may be greater for service SMEs
than for other types of firm.
Service SMEs have a lower level adjustment of actual debt toward target debt ratio
than is found in other types of firms. Additionally, greater growth opportunities, greater
non-debt tax shields and greater risk do not imply less recourse to debt in service SMEs.
Higher effective tax rates do not imply more recourse to debt in service SMEs, unlike
what occurs in the majority of the situations in other types of firm.
Although not for all determinants, the empirical evidence suggests that the capital
structure decisions of service SMEs are further from the assumptions of Trade-Off
Theory than the capital structure decisions of other types of firm, and so we can accept
the previously formulated hypothesis H2 as partially valid.
It stands out that service SMEs have lower speed of adjustment of the actual debt
level toward target debt ratio than other types of firm. This result suggests the lower
importance that the goal to reaching the target debt ratio has for service SMEs compared
to the case in other types of firm. Contributing to these results are the smaller size and
the lower levels of tangible assets of service SMEs that imply high transaction costs,
30
which may explain the lower speed of adjustment of actual level of debt toward the
target debt ratio.
Värlander and Julien (2010) conclude that personal relationships established with
clients can be particularly important to increase performance in service firms. This
important conclusion by the authors can be extended to the relationships between the
owners/managers of service SMEs and creditors. Indeed, establishing trusting and long-
lasting relationships may be particularly important for reducing the information
asymmetry between service SME owners/managers and creditors, contributing to lower
transaction costs in obtaining debt. Therefore, service SMEs may increase the speed of
adjustment of the actual level of debt toward target debt ratio.
On the one hand, the fact that service SMEs do not reduce the level of debt as a
function of greater growth opportunities, level of risk and non-debt tax shields, and do
not increase the level of debt as a function of tax rate, shows that these firms are less
concerned with a trade-off between the benefits and costs of debt compared to other
types of firm. On the other hand, the fact that size and tangible assets are particularly
relevant for service SMEs to obtain debt indicates that greater size and high level of
tangible assets may be determinant for service SMEs to consider more effectively a
trade-off between the benefits and costs of debt.
The multiple empirical evidence obtained in this study clearly indicates that
problems of information asymmetry between firm owners/managers and creditors can
be particularly relevant in the case of service SMEs. Indeed, in these circumstances, as
Elston and Audretsch (2009) conclude that firms with high information asymmetry
associated with their activities may only resort to debt when internal finance is clearly
insufficient.

31
Reed and Storrud-Barnes (2009) conclude that economies of scale and the power of
the market may be particularly relevant for service firms being able to increase their
performance. There may be an important connection between the conclusions of Reed
and Storrud-Barnes (2009) and the empirical evidence obtained in this paper. Greater
size and higher level of tangible assets may contribute to greater recourse to debt in
service SMEs on particularly advantageous terms. When internal finance is insufficient,
obtaining debt in advantageous terms may be fundamental for service SMEs being able
to take advantage of the multiple investment opportunities arising, which allows to
attain a economies of scale and market power, consequently increasing their
performance.
Hall et al. (2000) for British SMEs and Bhaird and Lucey (2009) for Irish SMEs
conclude that differences between capital structure decisions in service and
manufacturing SMEs are not significant. Identical conclusions are obtained by Cressy
and Olofsson (1997) for Swedish SMEs, and by Abor (2007) for Ghanaian SMEs.
Unlike the conclusions of other empirical studies, we find that the capital structure
decisions of service SMEs differ considerably from those of other types of firm, such as
SMEs and large firms in the manufacturing and construction industry. We also find that
the capital structure decisions of service SMEs are different from those of large service
firms.
It is also important to mention that the capital structure decisions of service SMEs
are closer to the assumptions of Pecking Order Theory, whereas the structure decisions
of large manufacturing and construction firms are closer to the assumptions of Trade-
Off Theory. This difference in the financing behaviour between service SMEs and large
manufacturing and construction firms may be due to the effects of size (i.e., small
versus large firms) and tangible assets (service firms versus manufacturing and

32
construction industries), reinforcing the importance of these two determinants in
explaining differences between the capital structure decisions of service SMEs and
those of other types of firm.
6. Conclusion and Implications
Using four research samples: i) 610 SMEs, ii) 126 large service firms; iii) 679
manufacturing and construction SMEs; and iv) 132 large manufacturing and
construction firms, and resorting to the two-step estimation process, this paper analyses
if the capital structure decisions of service SMEs are different from those of other types
of firm.
The multiple empirical evidence obtained allow us to conclude that the capital
structure decisions of service SMEs are different from those of other types of firm.
Firstly, variations of debt in service SMEs are found to be considerably more influenced
by situations of financial deficit than the debt variations in other types of firm. In
addition, compared to other types of firms, we find that greater relative importance of
cash flow, age and situations of low growth opportunities and high cash flow for
reduced recourse to debt in service SMEs. Additionally, the situations of high growth
opportunities and low cash flow have greater importance for increased recourse to debt
in service SMEs. These results clearly indicate that the capital structure decisions of
service SMEs are closer to the forecasts of Pecking Order Theory than are the capital
structure decisions of other types of firm.
Secondly, the speed of adjustment of actual level of debt toward target debt ratio is
lower in service SMEs than in other types of firm. This result shows that service SMEs
face higher transaction costs in obtaining debt than other types of firm. Furthermore,
service SMEs do not decrease the level of debt as a function of greater growth

33
opportunities, greater non-debt tax shields and greater risk. However, service SMEs do
do not increase the level of debt as a function of higher effective tax rates, unlike what
occurs in large service, manufacturing and construction firms as well as in
manufacturing and construction SMEs for some of the determinants named above.
Thirdly, size and asset tangibility are of greater relative importance for greater level
of debt for service SMEs compared to the case of other types of firm. This result allows
us to conclude that size and tangible assets are particularly important for lessening
problems of information asymmetry in the relationships between the owners/managers
of service SMEs and creditors. Additionally, given that greater size and higher level of
tangible assets contribute to reduced information asymmetry in relationships between
service SME owners/managers and creditors, service SMEs can begin to consider more
effectively in their strategies to reach the target debt ratio, which implies that firms
balance the benefits and costs of debt.
The multiple empirical evidence obtained in this study allow us to make various
contributions to the literature on SME capital structure in general, and to capital
structure in service SMEs in particular. The results show that the capital structure
decisions of service SMEs are considerably different from those of other types of firm.
The empirical evidence obtained here shows that service SMEs resort to debt more as a
consequence of insufficient internal finance, and less with the aim of attaining a target
debt ratio that balances the benefits and costs of debt. The capital structure decisions of
service SMEs are closer to the suppositions of Pecking Order Theory, and further
removed from those of Trade-Off Theory, than the capital structure decisions of other
types of firm.
The paper also makes a relevant theoretical contribution to the literature on SME
capital structure in general, and service SMEs in particular: size and tangible assets can

34
be particularly relevant for firms that face problems of information asymmetry, as may
be the case with service SMEs. Consequently, greater size and higher level of tangible
assets allow service SMEs being able to consider more effectively in their capital
structure decisions a trade-off between the benefits and cost of debt, and not resorting
almost exclusively to debt to cover insufficiencies of internal finance. In other words,
size and tangible assets are important determinants for service SMEs, particularly
affected by problems of information asymmetry, do not consider only the assumptions
of Pecking Order Theory, being able to consider also those of Trade-Off Theory in their
capital structure decisions.
The empirical evidence obtained in this paper allows us to make suggestions for
policy-makers and the owners/managers of service SMEs. Given the importance of
service SMEs in Europe in general, and in Portugal in particular, to policy-makers we
suggest the creation of lines of credit especially directed for SMEs that are financial and
economically sustainable, but facing obstacles in obtaining debt. The creation of lines of
credit would allow service SMEs to take advantage of the multiple investment
opportunities that in turn would contribute to promote firms’ economies of scale, and
consequently to increased employment and economic growth.
To the owners/managers of service SMEs we suggest to establish trusting, long-
lasting relationships with creditors, so as to lessen problems of information asymmetry,
which contributes to obtain debt on more advantageous terms.
Given that firm´s growth may influence funding needs, this study has the limitation
regarding the absence of the analysis of the applicability of the Pecking Order Theory
and Trade-off Theory as a function of the growth levels of the service SMEs and other
types of firm. For future researches, we suggest to study the applicability of
representative models of Pecking Order Theory and Trade-Off Theory to the capital

35
structure decisions of service SMEs and other types of firm considering the firms’ levels
of growth.

36
APPENDIX A: Trade – Off Theory Model - LSDVC (2005) Estimator
Table A1: Trade- Off Theory Model - LSDVC (2005) Estimator
Dependent Variable: Di,t Service SMEs Large Service Firms Other SMEs Other Large Firms
Independent variables
Di,t-1 0.83421***
(0.07882)
0.56172***
(0.06019)
0.65162***
(0.05516)
0.51108***
(0.05314)
PROFi,t -0.85152***
(0.11334)
-0.51018***
(0.06541)
-0.65160***
(0.09445)
-0.37091***
(0.04919)
SIZEi,t 0.07617***
(0.02626)
0.03483*
(0.01770)
0.05718***
(0.01309)
0.00988
(0.01445)
TANGi,t 0.45612***
(0.12681)
0.18919**
(0.09762)
0.21909***
(0.07679)
0.13919*
(0.07018)
GOi,t -0.01408
(0.05181)
0.02056
(0.07142)
-0.03981**
(0.01912)
-0.07909***
(0.02398)
NDTSi,t 0.02718
(0.12871)
-0.21012***
(0.05671)
-0.29667***
(0.09559)
-0.32019***
(0.09382)
ETRi,t 0.00453
(0.021061)
0.067812***
(0.02171)
-0.01299
(0.03617)
0.08108***
(0.02284)
EVOLi,t 0.01415
(0.02718)
0.008905
(0.00987)
-0.02109***
(0.00901)
-0.02223***
(0.00443)
λi,t -18.7762***
(4.2171)
-12.6563***
(3.4092)
-17.6512***
(3.5901)
-14.0201***
(4.1451)
Firms 534 116 567 113
Observations 3097 685 3258 656
Notes: 1. Standard deviations in parenthesis. 2. *** statistical significance at the 1% level; ** statistical
significance at the 5% level; * statistical significance at the 10% level. 3. The estimates include time
dummy variables, but not shown.

37
References
Abor J (2007) “Industry Classification and the Capital Structure of Ghanaian SMEs”.
Stud Econ Financ 23: 207 – 219
Ang J (1976) “The Intertemporal Behaviour of Corporate Debt Policy”. J Financ Quant
Anal 11: 555-566
Ang J (1991) “Small Business Uniqueness & The Theory of Financial Management”. J
Small Bus Financ 1: 1-13
Ang J (1992) “On the Theory of Finance For Privately Held Firms”. J Small Bus
Finance 1: 185-203
Arellano M, Bond S (1991) “Some Tests of Specification For Panel Data: Monte Carlo
Evidence and an Application to Employment Equations”. Rev Econ Stud 58: 277-
297
Barclay M, Smith C, Morellec E (2006) “On the Debt Capacity of Growth
Opportunities”. J Bus 79: 37-59
Bhaird C, Lucey B (2010) “Determinants of Capital Structure in Irish SMEs”. Small
Bus Econ 35: 357 – 375
Blundell M, Bond S (1998) “Initial Conditions and Moment Restrictions in Dynamic
Panel Data Models”. J Econometrics 87: 115-143
Bradley M, Jarrell G, Kim E (1984) “On the Existence of an Optimal Capital Structure:
Theory and Evidence”. J Financ 39: 857-878
Bruno G (2005) “Approximating the Bias of LSDV Estimator for Dynamic Unbalanced
Panel Data Models”. Econ Lett 87: 361-366
Cressy R, Olofsson C (1997) “European SME financing: an Overview”. Small Bus
Econ 9: 87-96

38
Cruz-Ros S, Cruz T, Pérez-Cabañero C (2010) “Marketing Capabilities, Stakeholdrs`
Satisfaction, and Performance”. Serv Bus 4: 209-223
DeAngelo H, Masulis R (1980) “Optimal Capital Structure Under Corporate and
Personal Taxation”. J Financ Econ 8: 3-29
Diamond D (1989) “Reputation Acquisition in Debt Markets”. J Polit Econ 97: 828-862
Elston J, Audretsch D (2011) “Financing the Entrepreneurial Decision: An Empirical
Approach Using Experimental Data on Risk Attitudes”, Small Bus Econ 36: 209-222
Fleck D (2010) “Why we Should Dare to Manage Growth Responsibly”. Manag Decis
48: 1529-1538.
Franco M, Haase H (2010) “Failure Factors in Small and Medium-Sized Enterprises:
Qualitative Study From an Attributional Perspective”. Int Ent Manag J 6: 503-521
Hall G, Hutchinson P, Michaelas N (2000) “Industry Effects on the Determinants of
Unquoted SMEs` Capital Structure”. Int J Econ Bus 7: 297 – 312
Harris M, Raviv A (1991) “The Theory of Capital Structure”. The J of Fin 46: 297-355
Haugen R, Senbet L (1986) “Corporate Finance and Taxes: A Review”. Financ Manage
Autumn: 5-21
Heckman J (1979) “Sample Selection Bias as a Specification Error”. Econometrica 47:
153 – 161
Holmes S, Kent P (1991) “An Empirical Analysis of the Financial Structure of Small
and Large Australian Manufacturing Enterprises”. J Small Bus Financ 2: 141-154
Hyytinen A, Pajarinen M (2005) “Financing of Technology – Intensive Small
Businesses: Some Evidence on the Uniqueness of the ICT Sector”. Inform Econ
Policy 17: 115-132
Jalilvand, A., Harris R (1984) “Corporate Behaviour in Adjusting to Capital Structure
and Dividend Targets: An Econometric Study”. J Financ 39: 127-145

39
Jensen M, Meckling W (1976) “Theory of the Firm: Managerial Behavior, Agency
Costs and Ownership Structure”. J Financ Econ 3: 305-360
Kim E (1978) “A Mean-Variance Theory of Optimal Capital Structure and Corporate
Debt Capacity”. J Financ 33: 45-63
Kraus A, Litzenberger R (1973) “A State-Preference Model of Optimal Financial
Leverage”. J Financ 28: 911-922
Lev B, Pekelman D (1975) “A Multiperiod Adjustment Model For the Firm’s Capital
Structure”. J Financ 30: 75-92
López – Gracia J, Sánchez – Andújar S (2007) “Financial Structure of the Family
Business: Evidence From a Group of Small Spanish Firms”. Fam Bus Rev 20: 269-
287
López – Gracia J, Sogorb – Mira F (2008) “Testing Trade – Off and Pecking Order
Theories in Spanish SMEs”. Small Bus Econ 31: 117-136
MacKie-Mason J (1990) “Do Taxes Affect Corporate Financing Decisions?”. J Financ
45: 1471-1493
McConnell J, Servaes H (1995) “Equity Ownership and the Two Faces of Debt”. J
Financ Econ 39: 131-157
Modigliani F, Miller M (1958) “The Cost of Capital, Corporation Finance and Theory
of Investment”. Am Econ Rev 48: 261-297
Modigliani F, Miller M (1963) “Corporate Income Taxes and the Cost of Capital: a
Correction”. Am Econ Rev 53: 433-443
Myers S (1977) “The Determinants of Corporate Borrowing”. J of Fin Econ 5: 147-176
Myers S (1984) “The Capital Structure Puzzle”. J Financ 57: 575-592
Myers S., Majluf N (1984) “Corporate Financing and Investment Decision When Firms
Have Information That Investors do Not Have”. J Financ Econ 13: 187-221

40
National Institute of Statistics (2010) Structural Business Statistics Studies, Lisbon,
Portugal
Pettit R, Singer R (1985) “Small Business Finance: A Research Agenda”. Financ
Manage Autumn: 47-60
Rajan R, Zingales L (1995) “What do We Know About Capital Structure? Some
Evidence From International Data”. J Financ 50: 1421-1460
Ramalho J, Silva J (2009) “A Two – Part Fractional Regression Model For the Financial
Leverage Decisions of Micro, Small, Medium and Large Firms”. Quant Financ 9:
621-636
Reed R, Storrud-Barnes S (2009) “Systematic Performance Differences Across the
Manufacturing – Service Continuum”. Serv Bus 3: 319-339
Revest V, Sapio A (2010) “Financing Technology-Based Small Firms in Europe: What
do we Know?”. Small Bus Econ Forthcoming: 1-27
Scherr F, Hulburt H (2001) “The Debt Maturity Structure of Small Firms”. Financ
Manage spring: 85-111
Scott J (1977) “Bankruptcy, Secured Debt, and Optimal Capital Structure”. J Financ 32:
1-19
Shyam-Sunder L, Myers S (1999) “Testing Static Trade-Off Against Pecking Order
Models of Capital Structure”. J Financ Econ 51: 219-244
Stulz R (1990) “Managerial Discretion and Optimal Financing Policies”. J Financ Econ
26: 3-27
Taggart R (1977) “A Model of Corporate Financing Decisions”. J Financ, 32: 1467-
1484
Värlander S, Julien A (2010) “The Effect of the Internet on From-Line Employee Skills:
Exploring Banking in Sweden and France”. Serv Ind J 30: 1245-1261
41
Table 1: Sample Description Service SMEs Large Service Firms Other SMEs Other Large Firms
Incumbent firms in all period 1999 – 2006 468 112 506 107
Firms entering in the period 1999 –2006 66 4 61 6
Firms exiting in the period 1999-2006 76 10 112 19 Total Firms 610 126 679 132
Table 2: Descriptive Statistics
Service SMEs Large Service Firms Other SMEs Other Large Firms
Variable N Mean S.D. N Mean S. D. N Mean S.D N Mean S.D:
ΔLEVi,t 3933 174341 965121 851 189182 987161 4348 187901 1011299 872 180067 997651
FDi,t 3933 -240912 961521 851 -161820 988774 4348 -389184 1490198 872 -140921 871821
Di,t 3933 0.64503 0.17661 851 0.67490 0.19714 4348 0.66149 0.18893 872 0.70112 0.20117
CFi,t 3933 0.06819 0.10116 851 0.07413 0.11998 4348 0.04895 0.08113 872 0.06891 0.09668
AGEi,t 3933 2.70330 0.70182 851 2.81828 0.75162 4348 2.79812 0.73421 872 2.83717 0.77710
HGOLCFi,t 3933 0.07616 0.27881 851 0.058919 0.20981 4348 0.06172 0.24516 872 0.05561 0.19781
LGOHCFi,t 3933 -0.04891 0.18912 851 -0.05616 0.20182 4348 -0.03511 0.16172 872 -0.02871 0.14152
PROFi,t 3933 0.05211 0.08089 851 0.05122 0.07944 4348 0.05291 0.08251 872 0.05091 0.07871
SIZEi,t 3933 16.5361 2.41321 851 17.9485 2.88990 4348 16.5781 2.38981 872 18.0123 2.93172
TANGi,t 3933 0.29778 0.21899 851 0.30918 0.22121 4348 0.34997 0.23996 872 0.37719 0.25712
GOi,t 3933 0.08981 0.32777 851 0.04717 0.25667 4348 0.07654 0.27013 872 0.04205 0.23916
NDTSi,t 3933 0.03749 0.03311 851 0.04018 0.04281 4348 0.04654 0.03781 872 0.04559 0.04609
ETRi,t 3933 0.41821 1.58929 851 0.44681 1.60812 4348 0.41414 1.56712 872 0.46717 1.63421
EVOLi,t 3933 1.64564 2.89843 851 1.56717 2.80198 4348 1.40911 2.5989 872 1.37812 2.57812
Table 3: Survival Analysis – Impact of Financial Deficit on Debt Variations - Pecking Order
Theory – Model I
Dependent Variable: Pr(δi,t=1) Service SMEs Large Service Firms Other SMEs Other Large Firms
Independent variables
FDi,t -0.000007***
(0.0000002)
-0.0000001
(0.0000002)
-0.000002
(0.0000002)
0.000001
(0.000001)
CONS 0.00417***
(0.00103)
0.05161***
(0.00415)
0.06667***
(0.00871)
0.05142***
(0.00910)
Pseudo R2
0.16162 0.03421 0.03019 0.02771
Log Likelihood -98.10 -86.44 -81.17 -90.12
Firms 610 126 679 132
Observations 3933 851 4348 872
Notes: 1. Standard deviations in parenthesis. 2. *** statistical significance at the 1% level; ** statistical
significance at the 5% level; * statistical significance at the 10% level. 3. The estimates include time
dummy variables, but not shown.
Table 4: Impact of Financial Deficit on Debt Variations - Pecking Order Theory – Model I
Dependent Variable: ΔLEV Service SMEs Large Service Firms Other SMEs Other Large Firms
Independent variables
FDi,t 0.90911***
(0.08002)
0.50172***
(0.06571)
0.48091***
(0.07172)
0.39440***
(0.06151)
λi,t -16.091***
(2.09213)
-12.819***
(1.56109)
-15.104***
(1.8718)
-13.876***
(1.76201)
CONS 54891
(52910)
159145***
(54091)
163409***
(53907)
187012***
(56118)
F(N(0.1))
157.12 123.01*** 117.23*** 108.90***
R2 0.72839 0.56121 0.51447 0.46712
Firms 534 116 567 113
Observations 3575 798 3779 764
Notes: 1. Standard deviations in parenthesis. 2. *** statistical significance at the 1% level; ** statistical
significance at the 5% level; * statistical significance at the 10% level. 3. The estimates include time
dummy variables, but not shown.

42
Table 5: Chow Test – Impact of Financial Deficit on Debt Variations - Pecking Order Theory –
Model I
Service SMEs versus Large Service Firms Service SMEs versus Other SMEs Service SMEs versus Other Large Firmss
Independent variables
FDi,t 20.90*** 21.34*** 24.56***
Notes: 1. Probabilities in parenthesis. 2. *** statistical significance at the 1% level; ** statistical
significance at the 5% level; * statistical significance at the 10% level.
Table 6: Survival Analysis – Determinants of Debt - Pecking Order Theory – Model II
Dependent Variable: Pr(δi,t=1) Service SMEs Large Service Firms Other SMEs Other Large Firms
Independent variables
CFi,t 0.60561***
(0.08192)
0.17162**
(0.08451)
0.21617***
(0.05918)
0.10923**
(0.05410)
AGEi,t 0.21098***
(0.06172)
0.07182*
(0.03644)
0.10821**
(0.05319)
-0.01872
(0.04813)
HGOLCFi,t -0.02731
(0.04516)
0.01919
(0.04892)
-0.01823
(0.06173)
0.00918
(0.02744)
LGOHCFi,t 0.01824
(0.05671)
0.02818
(0.05889)
-0.02812
(0.03008)
-0.01888
(0.03499)
CONS 0.00837
(0.01775)
0.017162
(0.028381)
0.00991
(0.01848)
0.03182*
(0.01551)
Pseudo R2
0.15517 0.10082 0.11891 0.07661
Log Likelihood -112.10 -102.87 -106.33 -97.67
Firms 610 126 679 132
Observations 3933 851 4348 872
Notes: 1. Standard deviations in parenthesis. 2. *** statistical significance at the 1% level; ** statistical
significance at the 5% level; * statistical significance at the 10% level. 3. The estimates include time
dummy variables, but not shown.
Table 7: Determinants of Debt - Pecking Order Theory – Model II
Dependent Variable: Di,t
Service SMEs Large Service Firms Other SMEs Other Large Firms
Independent variables
CFi,t -0.81734***
(0.15161)
-0.46712***
(0.12843)
-0.30182**
(0.14538)
-0.18781**
(0.09332)
AGEi,t -0.08812***
(0.01784)
-0.04998**
(0.02419)
-0.02091*
(0.01197)
0.01201
(0.02189)
HGOLCFi,t 0.09812***
(0.02810)
0.05120***
(0.01671)
0.04891***
(0.01458)
0.00891
(0.02515)
LGOHCFi,t -0.06718***
(0.015462)
-0.02066
(0.01982)
-0.02797
(0.02568)
0.01562
(0.03899)
λi,t -11.4938***
(2.05169)
-12.6670***
(2.16715)
-15.4312***
(3.9173)
-14.8182***
(4.0182)
CONS 0.01154
(0.01348)
0.02191*
(0.01047)
0.01341
(0.01216)
0.05162***
(0.01516)
R2
0.51527 0.46781 0.41929 0.27172
F(N(0.1)) 111.90*** 103.34*** 102.08*** 81.12***
LM Test 156.90*** 142.05*** 150.09*** 134.86***
Hausman Test 57.56*** 49.89*** 60.10*** 52.33***
Firms 534 116 567 113
Observations 3575 798 3779 764
Notes: 1. Standard deviations in parenthesis. 2. *** statistical significance at the 1% level; ** statistical
significance at the 5% level; * statistical significance at the 10% level. 3. The estimates include time
dummy variables, but not shown.

43
Table 8: Chow Test – Determinants of Debt - Pecking Order Theory – Model II
Service SMEs versus Large Service Firms Service SMEs versus Other SMEs Service SMEs versus Other Large Firmss
Independent variables
CFi,t 14.49***
(0.0000)
16.71***
(0.0000)
22.79***
(0.0000)
AGEi,t 13.13***
(0.0000)
17.05***
(0.0000)
20.14***
(0.0000)
HGOLCFi,t 12.27***
(0.0000)
12.83***
(0.0000)
18.66***
(0.0000)
LGOHCFi,t 15.90***
(0.0000)
15.55***
(0.0000)
16.14***
(0.0000)
Global Difference 14.86***
(0.0000)
16.82***
(0.0000)
20.44***
(0.0000)
Notes: 1. Probabilities in parenthesis. 2. *** statistical significance at the 1% level; ** statistical
significance at the 5% level; * statistical significance at the 10% level.
Table 9: Survival Analysis – Trade-Off Theory Model
Dependent Variable: Pr(δi,t=1) Service SMEs Large Service Firms Other SMEs Other Large Firms
Independent variables
PROFi,t 0.63412***
(0.09019)
0.27381***
(0.51629)
0.45217***
(0.07165)
0.08712*
(0.04498)
SIZEi,t 0.04944***
(0.01506)
0.03982**
(0.01875)
0.11919***
(0.03621)
0.10928**
(0.05418)
TANGi,t 0.05512
(0.10823)
0.05331
(0.11008)
0.36171***
(0.08990)
0.30442***
(0.07680)
GOi,t 0.06511*
(0.03450)
0.08918**
(0.04411)
0.04154
(0.07616)
0.09412**
(0.04657)
NDTSi,t 0.00616
(0.01981)
0.01828
(0.02554)
-0.00978
(0.02003)
0.01450
(0.03811)
ETRi,t -0.01848
(0.02901)
-0.01125
(0.03879)
-0.02172
(0.05142)
-0.03008
(0.06169)
EVOLi,t -0.06172***
(0.01829)
-0.04132**
(0.02014)
-0.02812***
(0.01122)
-0.01181
(0.01165)
CONS 0.01313
(0.02182)
0.00987
(0.01761)
0.01242
(0.02026)
0.01451
(0.02880)
Pseudo R2
0.34152 0.32911 0.38918 0.36631
Log Likelihood -115.95 -113.40 109.01 106.77
Firms 610 126 679 132
Observations 3933 851 4348 872
Notes: 1. Standard deviations in parenthesis. 2. *** statistical significance at the 1% level; ** statistical
significance at the 5% level; * statistical significance at the 10% level. 3. The estimates include time
dummy variables, but not shown.

44
Table 10: Trade of Theory Model – GMM System (1998) Estimator
Dependent Variable: Di,t Service SMEs Large SMEs Other SMEs Other Large Firms
Independent variables
Di,t-1 0.78120***
(0.06718)
0.59192***
(0.05416)
0.62931***
(0.05844)
0.47716***
(0.04990)
PROFi,t -0.91432***
(0.09018)
-0.57818***
(0.06712)
-0.62461***
(0.08172)
-0.43129***
(0.05449)
SIZEi,t 0.08198***
(0.02923)
0.02911
(0.02844)
0.04891**
(0.01550)
0.01122
(0.01874)
TANGi,t 0.39525***
(0.08917)
0.21456**
(0.10604)
0.23081***
(0.07189)
0.12911**
(0.06357)
GOi,t -0.01516
(0.07817)
0.01781
(0.06992)
-0.03481**
(0.01138)
-0.07746***
(0.02407)
NDTSi,t 0.03424
(0.10889)
-0.17821**
(0.08615)
-0.26931***
(0.08918)
-0.37844***
(0.11423)
ETRi,t 0.00771
(0.02668)
0.06171**
(0.03012)
-0.01056
(0.03135)
0.08441***
(0.02435)
EVOLi,t 0.00982
(0.01223)
0.00574
(0.00913)
-0.01818***
(0.00457)
-0.02551***
(0.00511)
λi,t -15.6741***
(3.1029)
-13.0071***
(2.87104)
-16.9944***
(3.2281)
-17.6131***
(3.6178)
CONS 0.06712**
(0.03370)
0.04123*
(0.02277)
0.02371
(0.03445)
0.01806
(0.02878)
F(N(0,1)) 56.90*** 60.19*** 64.59*** 69.07***
Hansen (N(0,1)) 56.10 51.34 61.90 57.01
m1 (N(0,1)) -5.87*** -6.07*** -5.61*** -5.94***
m2 (N(0,1)) 0.23 0.17 0.25 0.12
Firms 534 116 567 113
Observations 3097 685 3258 656
Notes: 1. Standard deviations in parenthesis. 2. *** statistical significance at the 1% level; ** statistical
significance at the 5% level; * statistical significance at the 10% level. 3. The estimates include time
dummy variables, but not shown.
Table 11: Chow Test – Trade – Off Theory Model
Service SMEs versus Large Service Firms Service SMEs versus Other SMEs Service SMEs versus Other Large Firmss
Independent variables
Di,t-1 12.10***
(0.0000)
10.96***
(0.0000)
15.27***
(0.0000)
PROFi,t 11.68***
(0.0000)
9.87***
(0.0000)
16.02***
(0.0000)
SIZEi,t 16.84***
(0.0000)
13.22***
(0.0000)
17.14***
(0.0000)
TANGi,t 8.35***
(0.0000)
7.91***
(0.0000)
9.82***
(0.0000)
GOi,t 0.89
(0.798)
8.10***
(0.0000)
15.18***
(0.0000)
NDTSi,t 9.33***
(0.0000)
11.44***
(0.0000)
14.01***
(0.0000)
ETRi,t 10.41***
(0.0000)
1.21
(0.616)
11.99***
(0.0000)
EVOLi,t 0.61
(0.884)
11.77***
(0.0000)
13.33***
(0.0000)
Global Difference 11.51***
(0.0000)
12.33***
(0.0000)
14.92***
(0.0000)
Notes: 1. Probabilities in parenthesis. 2. *** statistical significance at the 1% level; ** statistical
significance at the 5% level; * statistical significance at the 10% level.