
Pearl y Reed 1920 on the Rate of Growth of the Population of the United States Since 1790 and Its...
15
On the Rate of Growth of the Population of the United States Since 1790 and its Mathematical Representation Author(s): Raymond Pearl and Lowell J. Reed Reviewed work(s): Source: Proceedings of the National Academy of Sciences of the United States of America, Vol. 6, No. 6 (Jun. 15, 1920), pp. 275-288 Published by: National Academy of Sciences Stable URL: http://www.jstor.org/stable/84343 . Accessed: 19/12/2012 00:34 Your use of the JSTOR archive indicates your acceptance of the Terms & Conditions of Use, available at . http://www.jstor.org/page/info/about/policies/terms.jsp . JSTOR is a not-for-profit service that helps scholars, researchers, and students discover, use, and build upon a wide range of content in a trusted digital archive. We use information technology and tools to increase productivity and facilitate new forms of scholarship. For more information about JSTOR, please contact [email protected]. . National Academy of Sciences is collaborating with JSTOR to digitize, preserve and extend access to Proceedings of the National Academy of Sciences of the United States of America. http://www.jstor.org This content downloaded on Wed, 19 Dec 2012 00:34:01 AM All use subject to JSTOR Terms and Conditions
-
Upload
carlos-andrade -
Category
Documents
-
view
60 -
download
2
Transcript of Pearl y Reed 1920 on the Rate of Growth of the Population of the United States Since 1790 and Its...

On the Rate of Growth of the Population of the United States Since 1790 and itsMathematical RepresentationAuthor(s): Raymond Pearl and Lowell J. ReedReviewed work(s):Source: Proceedings of the National Academy of Sciences of the United States of America,Vol. 6, No. 6 (Jun. 15, 1920), pp. 275-288Published by: National Academy of SciencesStable URL: http://www.jstor.org/stable/84343 .
Accessed: 19/12/2012 00:34
Your use of the JSTOR archive indicates your acceptance of the Terms & Conditions of Use, available at .http://www.jstor.org/page/info/about/policies/terms.jsp
.JSTOR is a not-for-profit service that helps scholars, researchers, and students discover, use, and build upon a wide range ofcontent in a trusted digital archive. We use information technology and tools to increase productivity and facilitate new formsof scholarship. For more information about JSTOR, please contact [email protected].
.
National Academy of Sciences is collaborating with JSTOR to digitize, preserve and extend access toProceedings of the National Academy of Sciences of the United States of America.
http://www.jstor.org
This content downloaded on Wed, 19 Dec 2012 00:34:01 AMAll use subject to JSTOR Terms and Conditions

PROCEEDINGS OF THE
NATIONAL ACADEMY OF SCIENCES Volume 6 JUNE 15, 1920 Number 6
ON THE RATE OF GROWTH OF THE POPULATION OF THE UNITED STATES SINCE 1790 AND ITS MATHEMATICAL
REPRESENTATION1
BY RAYMOND PEARL AND LOWELL J. REED
DEPARTMENT OF BIOMETRY AND VITAL STATISTICS, JOHNS HOPKINS UNIVERSITY
Read before the Academy, April 26, 1920
It is obviously possible in any country or community of reasonable size to determine an empirical equation, by ordinary methods of curve
fitting, which will describe the normal rate of population growth. Such a determination will not necessarily give any inkling whatever as to the
underlying organic laws of population growth in a particular community. It will simply give a rather exact empirical statement of the nature of the
changes which have occurred in the past. No process of empirically graduating raw data with a curve can in and of itself demonstrate the
fundamental law which causes the occurring change.2 In spite of the
fact that such mathematical expressions of population growth are purely empirical, they have a distinct and considerable usefulness. This use- fulness arises out of the fact that actual counts of population by census methods are made at only relatively infrequent intervals, usually 10
years and practically never oftener than 5 years. For many statistical
purposes, it is necessary to have as accurate an estimate as possible of the
population in inter-censal years. This applies not only to the years following that on which the last census was taken, but also to the inter- censal years lying between prior censuses. For purposes of practical statistics it is highly important to have these inter-censal estimates of
population as accurate as possible, particularly for the use of the vital
statistician, who must have these figures for the calculation of annual death rates, birth rates, and the like.
The usual method followed by census offices in determining the popula- tion in inter-censal years is of one or the other of two sorts, namely, by arithmetic progression or geometric progression. These methods assume that for any given short period of time the population is increasing either in arithmetic or geometric'ratio. Neither of these assumptions is ever
absolutely accurate even for short intervals of time, and both are grossly 275
This content downloaded on Wed, 19 Dec 2012 00:34:01 AMAll use subject to JSTOR Terms and Conditions

276 STATISTICS: PEARL AND REED PROC. N. A. S.
inaccurate for the United States, at least, for any considerable period of time. What actually happens is that.following any census estimates are made by one or another of these methods of the population for each year up to the next census, on the basis of data given by the last two censuses
only. When that next census has been made, the previous estimates of the inter-censal years are corrected and adjusted on the basis of the facts brought out at that census period.
Obviously the best general method of estimating population in inter- censal years is that of fitting an appropriate curve to all the available
data, and extrapolating for years beyond the last census, and reading off from the curve values for inter-censal years falling between earlier censuses. The methods of arithmetic or geometric progression use only two census counts at the most. Fitting a curve to all the known data
regarding population by the method of least squares must obviously give a much sounder and more accurate result. In making this state-
ment, one realizes perfectly, of course, the' dangers of extrapolation. These dangers have been well emphasized by Perrin,3 who used higher order parabolas to predict the future population of Buenos Aires. In
keeping sharply before our minds the dangers of extrapolation from a
curve, we are apt to forget that the methods of extrapolation by arithmetic or geometric progression have much less general validity than from a
curve, and the inaccuracies are found in practice, except by the rarest of accidents, to be actually greater.
The first one to attempt an adequate mathematical representation of the normal rate of growth of the population of the United States was Pritchett.4 Taking the census data from 1790 to 1880, inclusive, Pritchett fitted by the method of least squares the following equation:
P = A + Bt + Ct2 + Dt (i)
where P represents the population and t the time from some assumed
epoch. As a matter of fact, Pritchett took the origin of the curve at
1840, practically the center of the series. With this third-order parabola Pritchett got a very accurate representation of the population between the dates covered. As will presently appear this curve did not'give, even within the period covered, as accurate results a, a more adequate curve would have done, and it overestimated the population after a very short interval beyond the last observed ordinate as is shown in table 2.
Some 13 years ago one of the writers5 demonstrated the applicability of a logarithmic curve of the form
y = a + bx + cx2 + d log x (ii)
to the representation of growth changes, using the aquatic plant Cera-
tophyllum as material. Following the application of this curve to growth of this plant it was found equally useful in representing a wide range of other growth and related changes.6 This list now includes, of matters
This content downloaded on Wed, 19 Dec 2012 00:34:01 AMAll use subject to JSTOR Terms and Conditions

Vol. 6, 1920 STATISTICS: PEARL AND REED 277
worked out in the Biological Laboratory of the Maine Experiment Station, such diverse phenomena as change of size of egg with successive
layings, change of milk production with age, etc. Donaldson and Hatai7
have demonstrated the applicability of this type of equation to bodily growth in the white rat and frog.
While the increase in size of a population cannot on a priori grounds be
regarded, except by rather loose analogy, as the same thing as the growth of an organism in size, nevertheless it is essentially a growth phe- nomenon. It, therefore, seems entirely reasonable that this type of
curve should give a more adequate representation of population increase
than a simple third-order parabola. The actual event justifies this
assumption, as will presently appear. Table 1 shows the counted population as determined by the Census
Bureau on the dates mentioned from 1790 to 1910. The exact dates were
furnished in a personal communication from the present Director of the
Census. These figures embody some adjustments and corrections made
by the Census Bureau since the original censuses were made.
TABLE I
SHOWING THE DATES OF TIH TAKING OF TIlH CENSUS AND THY RECORDED POPULATIONS
FROM 1790 TO 1910
DATE OF CENSUS RDA
CENSUS CORDED POPULATION
(REVISED FIGURES FROM
Year Month and Day STATISTICAL ABST., 1918)
1790 First Monday in August 3,929,214 1800 First Monday in August 5,308,483 1810 First Monday in August 7,239,881 1820 First Monday in August 9,638,453 1830 June 1 12,866,020 1840 June 1 17,069,453 1850 June 1 23,191,876 1860 June 1 '31,443,321 1870 June 1 38,558,371 1880 June 1 50,155,783 1890 June 1 62,947,714 1900 June 1 75,994,575 1910 April 15 91,972,266
To the data of table 1 the following equation was fitted by the method of least squares, taking origin at 1780, and making due allowance in the abscissal intervals for the actual dates of the several censuses:
y = a + bx + cx2 + d log x
where y denotes population and x time. The actual equation deduced was
y = 9,064,900- 6,281,430x + 842,377x2 + 19,829,500 log x. (iii)
This content downloaded on Wed, 19 Dec 2012 00:34:01 AMAll use subject to JSTOR Terms and Conditions

278 STATISTICS: PEARL AND REED PROC. N. A. S.
The results are set forth in table 2, where Pritchett's figures are given for comparison.
TABLE 2
SHOWING (a) THE ACTUAL POPULATION1 ON CENSUS DATES, (b) ESTIMATED POPULATION
FROM PRITCHETT'S THIRD-ORDER PARABOLA, (C) ESTIMATED POPULATION FROM
LOGARITHMIC PARABOLA, AND (d) (e) ROOT-MEAN SQUARE ERRORS
OF BOTH METHODS
(a) ) (b ()
(d) (e) cENsUs LOGARITHMIC
YEAR OBSRVD PRITCHBTT PARAA - ERROR 0 ERROR O YEAR PARABOLA ES-
POPULATION ESTIMAT A (b) (c) TIMATI
1790 3,929,000 4,012,000 3,693,000 + 83,000 - 236,000 1800 5,308,000 5,267,000 5,865,000 - 41,000 + 557,000 1810 7,240,000 7,059,000 7,293,000 - 181,000 +- 53,000 1820 9,638,000 9,571,000 9,404,000 - 67,000 - 234,000 1830 12,866,000 12,985,000 12,577,000 + 119,000 - 289,000 1840 17,069,000 17,484,000 17,132,000 + 415,000 + 63,000 1850 23,192,000 23,250,000 23,129,000 + 58,000 - 63,000 1860 31,443,000 30,465,000 30,633,000 - 978,000 - 810,000 1870 38,558,000 39,313,000 39,687,000 + 755,000 +1,129,000 1880 50,156,000 49,975,000 50,318,000 - 181,000 + 162,000 1890 62,948,000 62,634,000 62,547,000 - 314,000 - 401,000 1900 75,995,000 77,472,000 76,389,000 +1,477,000 + 394,000 1910 91,972,000 94,673,000 91,647,000 +2,701,000 - 325,000
935,0002 472,0002 1920 114,416,000 108,214,000
' To the nearest thousand. 2 Root-mean square error.
It is obvious from the data of table 2 that, with the same number of
constants, the logarithmic parabola gives a distinctly better graduation than a third-order parabola.
The extreme precision of the present graduation is shown graphically in figure 1.
It is evident that as a purely empirical representation of population growth in the United States equation (iii) gives results of a very high degree of accuracy. Indeed, interpolation on this curve for inter-censal
years may obviously be relied upon with a greater probability that the estimated figures approximate the unknown true facts than is afforded
by any other estimating expedient hitherto applied to the known data. An indication of the general exactness of this curve (iii) for estimating future population by extrapolation may be got in the following way. Suppose a mathematician of the Civil War period had desired to estimate the population of the United States in 1910, and had fitted a curve of the
type of (ii), by the method of least squares to the known data available
This content downloaded on Wed, 19 Dec 2012 00:34:01 AMAll use subject to JSTOR Terms and Conditions
VOL. 6, I920 STATISTICS: PEARL AND REED 279
to him, namely, the census counts of 1790, to 1860, inclusive, he would have
got this result:
. y = 8,619,800-5,680,540x + 822,709x2+ 16,987,200 log x (iv)
If he had calculated from this equation the probable population in
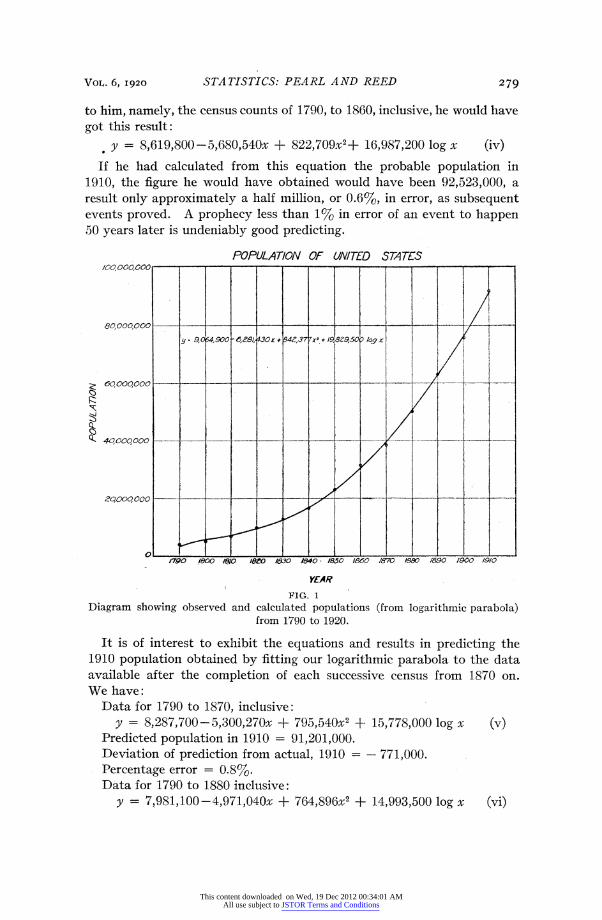
1910, the figure he would have obtained would have been 92,523,000, a result only approximately a half million, or 0.6%, in error, as subsequent events proved. A prophecy less than 1% in error of an event to happen 50 years later is undeniably good predicting.
POPULATION OF UNITED STATES /oo00, ooo00000---- -
8o,0ooo0ooo - - - - - i-- - ---1 ' 9,0 4,900- 6,Sl ,-30r + 42,37 + 19. 629,509 log x X
6000O000 -O - - - - -1
-, o-
Qooc000 ----0 0...______-- -
/790 /100 /8/0 18O /180 1840. /MSO I5860 /870 980 /890 1900 /9/0
YEAR
FIG. 1
Diagram showing observed and calculated populations (from logarithmic parabola) from 1790 to 1920.
It is of interest to exhibit the equations and results in predicting the 1910 population obtained by fitting our logarithmic parabola to the data available after the completion of each successive census from 1870 on. We have:
Data for 1790 to 1870, inclusive:
y = 8,287,700-5,300,270x + 795,540x2 + 15,778,000 log x (v) Predicted population in 1910 = 91,201,000. Deviation of prediction from actual, 1910 = - 771,000.
Percentage error = 0.8%. Data for 1790 to 1880 inclusive:
y = 7,981,100-4,971,040x + 764,896x2 + 14,993,500 log x (vi)
VOL. 6, I920 STATISTICS: PEARL AND REED 279
to him, namely, the census counts of 1790, to 1860, inclusive, he would have
got this result:
. y = 8,619,800-5,680,540x + 822,709x2+ 16,987,200 log x (iv)
If he had calculated from this equation the probable population in
1910, the figure he would have obtained would have been 92,523,000, a result only approximately a half million, or 0.6%, in error, as subsequent events proved. A prophecy less than 1% in error of an event to happen 50 years later is undeniably good predicting.
POPULATION OF UNITED STATES /oo00, ooo00000---- -
8o,0ooo0ooo - - - - - i-- - ---1 ' 9,0 4,900- 6,Sl ,-30r + 42,37 + 19. 629,509 log x X
6000O000 -O - - - - -1
-, o-
Qooc000 ----0 0...______-- -
/790 /100 /8/0 18O /180 1840. /MSO I5860 /870 980 /890 1900 /9/0
YEAR
FIG. 1
Diagram showing observed and calculated populations (from logarithmic parabola) from 1790 to 1920.
It is of interest to exhibit the equations and results in predicting the 1910 population obtained by fitting our logarithmic parabola to the data available after the completion of each successive census from 1870 on. We have:
Data for 1790 to 1870, inclusive:
y = 8,287,700-5,300,270x + 795,540x2 + 15,778,000 log x (v) Predicted population in 1910 = 91,201,000. Deviation of prediction from actual, 1910 = - 771,000.
Percentage error = 0.8%. Data for 1790 to 1880 inclusive:
y = 7,981,100-4,971,040x + 764,896x2 + 14,993,500 log x (vi)
This content downloaded on Wed, 19 Dec 2012 00:34:01 AMAll use subject to JSTOR Terms and Conditions

280 STATISTICS: PEARL AND REED PROC. N. A. S.
Predicted population in 1910 = 89,128,000. Deviation of prediction from actual, 1910 = - 2,844,000. Percentage error = 3%.
Data for 1790 to 1890, inclusive:
y = 9,013,800-6,242,170x + 839,782x2 + 19,744,300 log x (vii) Predicted population in 1910 = 91,573,000. Deviation of prediction from actual, 1910 = - 399,000. Percentage error = 0.4 per cent. Data for 1790 to 1900 inclusive:
y = 8,748,000-5,880,890x + 821,001x2 + 18,232,100 log x (viii) Predicted population in 1910 = 91,148,000. Deviation of prediction from actual, 1910 = -824,000. Percentage error = 0.9%.
Beginning with 1860 (equation (iv)) and coming down to 1900, our
hypothetical statistician would have been only once in error as much as
1% in his prediction of the 1910 population by this logarithmic parabola. The one larger error is for the 1880 curve, where apparently the aberrant counts of 1860 and 1870 exert an undue influence.
Altogether it seems justifiable to conclude that: 1. A logarithmic parabola of the type of equation (ii) describes the
changes which have occurred in the population of the United States in
respect of its gross magnitude, with a higher degree of accuracy than any
empirical formula hitherto applied to the purpose. 2. The accuracy of the graduation given by this logarithmic parabola is
entirely sufficient for all practical statistical purposes.
II
Satisfactory as the empirical equation above considered is from a
practical point of view, it remains the fact that it is an empirical expression solely, and states no general law of population growth. Insofar it is
obviously an undesirable point at which to leave the problem of the mathematical expression of the change of population in magnitude.
It is quite clear on a priori grounds, as was first pointed out by Malthus in non-mathematical terms, that in any restricted area, such as the United
States, a time must eventually come when population will press so closely upon subsistence that its rate of increase per unit of time must be re- duced to the vanishing point. In other words, a population curve may start, as does that shown in figure 1, with a convex face to the base, but
presently it must develop a point of inflection, and from that point on
present a concave face to the x axis, and finally become asymptotic, the
asymptote representing the maximum number of people which can be
supported on the given fixed area.8 Now, while an equation like (ii) can, and will in due time, develop a point of inflection and become con- cave to the base it never can become asymptotic. It, therefore, cannot
This content downloaded on Wed, 19 Dec 2012 00:34:01 AMAll use subject to JSTOR Terms and Conditions

Vol. 6, '920' STATISTICS: PEARL AND REED 281
be regarded as a hopeful line of approach to a true law of population
growth. What we want obviously is a mathematical picture of the whole course
of population in this country. It is not enough to be able to predict twenty or fifty years ahead as our logarithmic parabola is able to do
satisfactorily, in one portion of the whole curve. How absurd equation (iii) would be over a really long time range is shown if we attempt to calculate from it the probable population in, say, 3000 A.D. It gives a value of 11,822,000,000. But this is manifestly ridiculous; it would mean a population density of 6.2 persons per acre or 3968 persons per square mile.
It would be the height of presumption to attempt to predict accurately the population a thousand years hence. But any real law of population growth ought to give some general and approximate indication of the number of people who would be living at that time within the present area of the United States, provided no cataclysmic alteration of circum- stances has in the meantime intervened.
It has seemed worth while to attempt to develop such a law, first by formulating a hypothesis which rigorously meets the logical requirements, and then by seeing whether in fact the hypothesis fits the known facts. The general biological hypothesis which we shall here test embodies as an essential feature the idea that the rate of population increase in a limited area at any instant of time is proportional (a) to the magnitude of the
population existing at that instant (amount of increase already attained) and (b) to the still unutilized potentialities of population support existing in the limited area.
The following conditions should be fulfilled by any equation which is to describe adequately the growth of population in an area of fixed limits.
1. Asymptotic to a line y = k when x = + oo . 2. Asymptotic to a line y = 0 when x = -- o . 3. A point of inflection at some point x = a and y = 3. 4. Concave upwards to left of x = a and concave downward to right
of X = a.
5. No horizontal slope except at x = oo . 6. Values of y varying continuously from 0 to k as x varies from- 0o to
+ 00.
In these expressions y denotes population, and x denotes time. An equation which fulfils these requirements is
beax y 1 + ceax (ix)
when a, b and c have positive values. In this equation the following relations hold:
X +_ +0 oo y=ll. (b X= + CO y =- b(x) C
This content downloaded on Wed, 19 Dec 2012 00:34:01 AMAll use subject to JSTOR Terms and Conditions

282 STATISTICS: PEARL AND REED PROC. N. A. S.
X - 0 y =0 (xi) Relations (x) and (xi) define the asymptotes. The point of inflection is given by 1--ceax = 0, or
1 b x = - log c y (xii)
a 2c
ab The slope at the point of inflection is -.
4c Expressing the first derivative of (xi) in terms of y, we have
dy ay(b-cy (xiii)
dx b Putting the equation in this form shows at once that it is identical
C ~ ~ ~ ~2Y Y
t.S
...
b - s f s wr^ x.
FIG. 2
General form of curve given by equation (ix).
with that describing an autocatalyzed chemical reaction, a point to which we shall return later.
The general form of the curve is shown in figure 2. The question now is how well does (ix) represent the known historical
facts as to the growth in population of the United States, and to what
legitimate deductions as to the future course of population in this country does it lead?
It is obvious that equation (ix) as it stands cannot be fitted to ob- servational data by the method of least squares. It is possible to write momental equations and fit by the method of moments, but at this tim we do not care to develop that method because, as will presently appear,,
This content downloaded on Wed, 19 Dec 2012 00:34:01 AMAll use subject to JSTOR Terms and Conditions
VOL. 6, 1920 STATISTICS: PEARL AND REED 283
we do not regard equation (ix) as the final development of this type of
equation for representing population, and we have no desire to encumber the literature with a mathematical discussion which we expect later to discard.
For present purposes it will be sufficient to fit (ix) to the observations
by passing it through three points. Given three equally spaced ordinates, yl, y2 and ys, the necessary equations are:
b 2yly2ya-y22(y, + y3) (xiv) c yiya - y22
Y2 - yl
a=loglo (b ) . h logo e (xv) Yl -- Y2
where h is the abseissal distance in years between y\ and y2, or Y2 and y3.
c = 1Y - _ (y) (xvi) y-2 y ea(-+ h)
where a is the abscissal distance in years from the origin to yl. Putting xi at 1790, x2 at 1850, and x3 at 1910, and taking origin at 1780
we have
yl = 3,9290 a = 10
y2 = 23,192 h = 60
y3 = 91,972 and taking (ix) in the form
b y =
-a , (xvii)
we find these values for the constants:
2,930.3009 y 0--- (xviii).
e-'0313395x + 0.014854
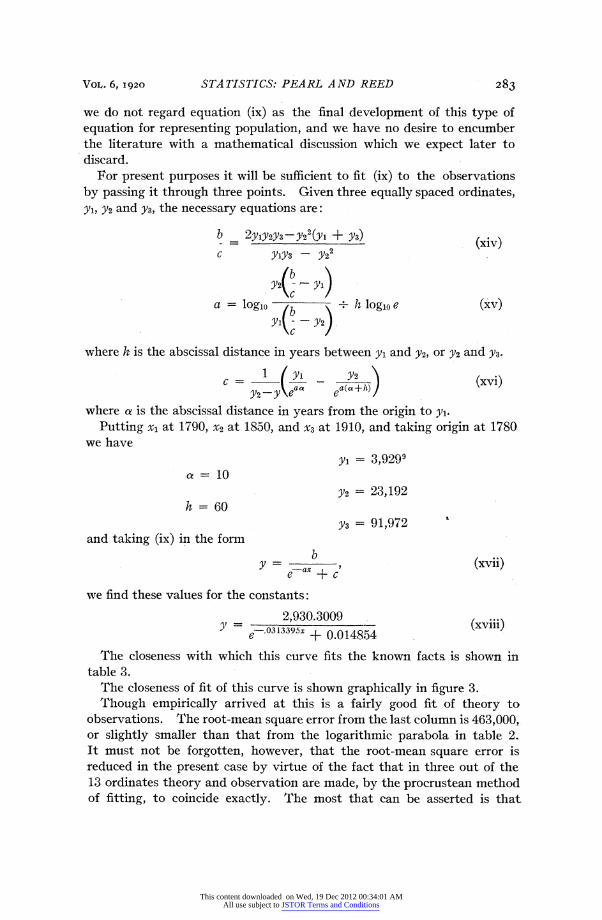
The closeness with which this curve fits the known facts is shown in table 3.
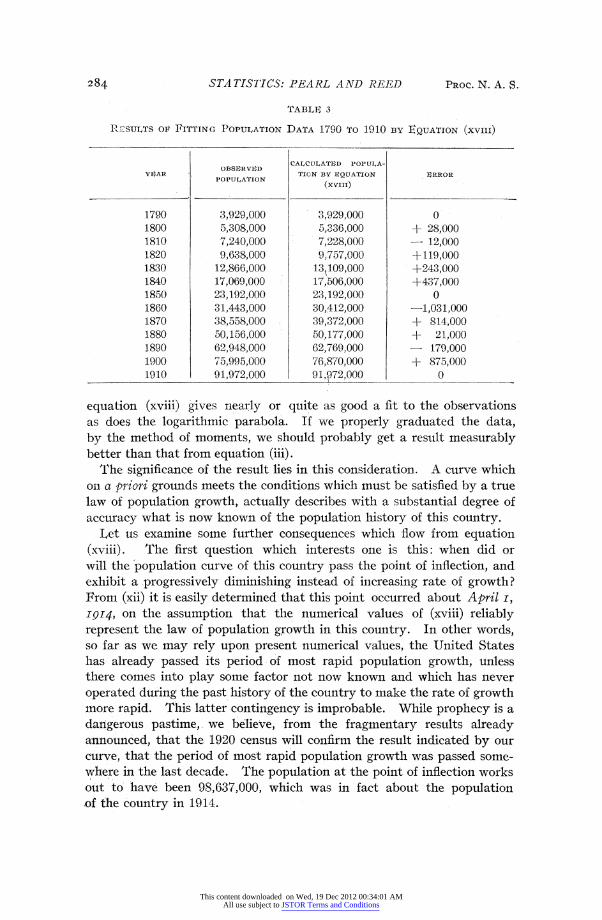
The closeness of fit of this curve is shown graphically in figure 3.
Though empirically arrived at this is a fairly good fit of theory to observations. The root-mean square error from the last column is 463,000, or slightly smaller than that from the logarithmic parabola in table 2. It must not be forgotten, however, that the root-mean square error is reduced in the present case by virtue of the fact that in three out of the 13 ordinates theory and observation are made, by the procrustean method of fitting, to coincide exactly. The most that can be asserted is that
VOL. 6, 1920 STATISTICS: PEARL AND REED 283
we do not regard equation (ix) as the final development of this type of
equation for representing population, and we have no desire to encumber the literature with a mathematical discussion which we expect later to discard.
For present purposes it will be sufficient to fit (ix) to the observations
by passing it through three points. Given three equally spaced ordinates, yl, y2 and ys, the necessary equations are:
b 2yly2ya-y22(y, + y3) (xiv) c yiya - y22
Y2 - yl
a=loglo (b ) . h logo e (xv) Yl -- Y2
where h is the abseissal distance in years between y\ and y2, or Y2 and y3.
c = 1Y - _ (y) (xvi) y-2 y ea(-+ h)
where a is the abscissal distance in years from the origin to yl. Putting xi at 1790, x2 at 1850, and x3 at 1910, and taking origin at 1780
we have
yl = 3,9290 a = 10
y2 = 23,192 h = 60
y3 = 91,972 and taking (ix) in the form
b y =
-a , (xvii)
we find these values for the constants:
2,930.3009 y 0--- (xviii).
e-'0313395x + 0.014854
The closeness with which this curve fits the known facts is shown in table 3.
The closeness of fit of this curve is shown graphically in figure 3.
Though empirically arrived at this is a fairly good fit of theory to observations. The root-mean square error from the last column is 463,000, or slightly smaller than that from the logarithmic parabola in table 2. It must not be forgotten, however, that the root-mean square error is reduced in the present case by virtue of the fact that in three out of the 13 ordinates theory and observation are made, by the procrustean method of fitting, to coincide exactly. The most that can be asserted is that
This content downloaded on Wed, 19 Dec 2012 00:34:01 AMAll use subject to JSTOR Terms and Conditions
284 STATISTICS: PEARL AND REED PROC. N. A. S.
TABLE 3
R:ESULTS OF FITTING POPULATION DATA 1790 TO 1910 BY EQUATION (XVIII)
CALCULATED POPULA- OBSERV D
YTAR TION BY EQUATION RROR POPULATION
(xvini)
1790 3,929,000 3,929,000 0 1800 5,308,000 5,336,000 + 28,000 1810 7,240,000 7,228,000 -- 12,000 1820 9,638,000 9,757,000 +119,00 1830 12,866,000 13,109,000 +243,000 1840 17,069,000 17,506,000 +437,000 1850 23,192,000 23,192,000 0 1860 31,443,000 30,412,000 -1,031,000 1870 38,558,000 . 39,372,000 + 814,000 1880 50,156,000 50,177,000 + 21,000 1890 62,948,000 62,769,000 - 179,000 1900 75,995,000 76,870,000 + 875,000 1910 91,972,000 91,972,000 0
equation (xviii) gives nearly or quite as good a fit to the observations as does the logarithmic parabola. If we properly graduated the data, by the method of moments, we should probably get a result measurably better than that from equation (iii).
The significance of the result lies inl this consideration. A curve which on a priori grounds meets the conditions which must be satisfied by a true law of population growth, actually describes with a substantial degree of
accuracy what is now known of the population history of this country. Let us examine some further consequences which flow from equation
(xviii). The first question which interests one is this: when did or will the population curve of this country pass the point of inflection, and exhibit a progressively diminishing instead of increasing rate of growth? From (xii) it is easily determined that this point occurred about April I, I914, on the assumption that the numerical values of (xviii) reliably represent the law of population growth in this country. In other words, so far as we may rely upon present numerical values, the United States has already passed its period of most rapid population growth, unless there comes into play some factor not now known and which has never
operated during the past history of the country to make the rate of growth more rapid. This latter contingency is improbable. While prophecy is a
dangerous pastime, we believe, from the fragmentary results already announced, that the 1920 census will confirm the result indicated by our curve, that the period of most rapid population growth was passed some- where in the last decade. The population at the point of inflection works out to have been 98,637,000, which was in fact about the population ,of the country in 1914.
This content downloaded on Wed, 19 Dec 2012 00:34:01 AMAll use subject to JSTOR Terms and Conditions

Vol. 6, 1920 STATISTICS: PEARL AND REED 285
The upper asymptote given by (xviii) has the value 197,274,000 roughly. This means that according to equation (xviii) the 'maximum population which continental United States, as now areally limited, will ever have will be roughly twice the present population. We fear that some will condemn at once the whole theory because the magnitude of this number is not sufficiently imposing. It is so easy, and most writers on population have been so prone, to extrapolate population by geometric series, or by a parabola or some such purely empirical curve, and arrive at stupendous figures, that calm consideration of real probabilities is most difficult to obtain. While, as will appear from the next section of this
POPULATION OF UN/TE-D STATES /00000 000
eooQ 000 i __
,000 -ooooooo - - - --- - ---- - C-- ....
, ooo - Loo ... -
40000000
/790 1800 /810 /160 /830 1/80 1850 16;.0 7 88 90/60 /. 1900 JICO
YEAR FIG. 3
Showing result of fitting equation (xviii) to population data.
paper, we have no desire to defend the numerical results of this section, and indeed ourselves regard them only as a rough first approximation, it remains a fact that if anyone will soberly think of every city, every village, every town in this country having its present population multi- plied by 2, and will further think of twice as many persons on the land in
agricultural pursuits, he will be bound, we think, to conclude that the
country would be fairly densely populated. It would have about 66 persons per square mile of land area.
It will at once be pointed out that many European countries have a much greater density of population than 66 persons to the square mile,
This content downloaded on Wed, 19 Dec 2012 00:34:01 AMAll use subject to JSTOR Terms and Conditions

.286 STATISTICS: PEARL AND REED PROC. N. A. S.
as for example Belgium with 673, Netherlands with 499, etc. But it must not be forgotten that these countries are far from self-supporting in
respect of physical means of subsistence. They are economically self-
supporting, which is a very different thing, because by their industrial
development at home and in their colonies they produce money enough to buy physical means of subsistence from less densely populated portions of the world. We can, of course, do the same thing, provided that by the time our population gets so dense as to make it necessary there still
remain portions of the globe where food, clothing material, and fuel are
produced in excess of the needs of their home population. But in this, and in any other scientific discussion of population, it is necessary to
limit sharply the area one is to talk about. This paper deals with popula-
tion, and by direct implication the production of physical means of sub-
sistence, within the present area of continental United States. Now 197,000,000 people will require, on the basis of our present food
habits,?1 about 260,000,000,000,000 calories per annum. The United States, during the seven years 1911-1918, produced as an annual average, in the form of human food, both primary and secondary (i.e., broadly vegetable and animal), only 137,163,606,000,000 calories per year."l So that unless our food habits radically change, and a man is able to do with less than 3000 to 3500 calories per day, or unless our agricultural pro- duction radically increases,l2 it will be necessary when our modest figure for the asymptotic population is reached, to import nearly or quite one- half of the calories necessary for that population. It seems improbable that the population will go on increasing at any very rapid rate after such a condition is reached. And is it at all reasonable to suppose that at such
time, with all the competition for means of subsistence which the already densely populated countries of Europe will be putting up, there can be
found any portion of the globe producing food in excess of its own needs to
an extent to make it possible for us to find the calories we shall need to
import?
Altogether, we believe it will be the part of wisdom for anyone disposed to criticise out asymptotic value of a hundred and ninety-seven and a
quarter millions because it is thought too small, to look further into all the relevant facts.
III
With the above numerical results in hand it is desirable to discuss a little further the general theory of population growth set forth in the
preceding section. At the outstart let it be said that we are convinced
that equation (ix) represents no more than a first approximation to a
true law of population growth. There are several characteristics of this
curve which are too rigid and inelastic to meet the requirements of such a
law. In (ix) the point of inflection must of necessity lie exactly half-way
between the two asymptotes. Furthermore the half of the curve lying
This content downloaded on Wed, 19 Dec 2012 00:34:01 AMAll use subject to JSTOR Terms and Conditions

VoL. 6, 1920 STATISTICS: PEARL AND REED 287
to the right of the point of inflection is an exact reversal of the half lying to the left of that point. This implies that the forces which during the latter part of the population history of an area act to inhibit the rate of population growth are equal in magnitude, and exactly similarly dis- tributed in time, to the forces which in the first half of the history operate to accelerate growth. We do not believe that such rigid and inelastic postulates as these are, in fact, realized in population growth.
The same objections apply to the use of the equation of an autocatalytic reaction to the representation of organic growth in the individual. This fact has been noted by Robertson'3 who was the first to discover that, in general, growth follows much the same curve as that of autocatalysis. What needs to be done is to generalize (ix) in some such form as will free it from the two restrictive features (location of point of inflection and
symmetry) we have mentioned, and will at the same time retain its other essential features. We are working along this line now and hope presently to reach a satisfactory solution.
We attach no particular significance to the numerical results of the
preceding section. They obviously can give only the roughest approxima- tion to probable future values of the population of the United States. Our only purpose in presenting them at all at this time is to demonstrate that the hypothesis here advanced as to the law of population growth, even when fitted by a rough and inadequate method, so closely describes the known facts regarding the past history of that growth, as to make it
potentially profitable to continue the mathematical development and re- finement of this hypothesis further. There is much that appeals to the reason in the hypothesis that growth of population is fundamentally a
phenomenon like autocatalysis. In a new and thinly populated country the population already existing there, being impressed with the apparently boundless opportunities, tends to reproduce freely, to urge friends to come from older countries, and by the example of their well-being, actual or po- tential, to induce strangers to immigrate. As the population becomes more dense and passes into a phase where the still unutilized potentialties of subsistence, measured in terms of population, are measurably smaller than those which have already been utilized, all of these forces tending to the increase of population will become reduced.
Papers from the Department of Biometry and Bital Statistics, School of Hygiene and Public Health, Johns Hopkins University, No. 13.
2 Cf. for a discussion on the relation of curve fitting to true organic laws of change, Pearl, R. "Some Recent Studies on Growth," Amer. Nat., 43, 1909 (302-316).
3 Perrin, E., "On Some Dangers of Extrapolation," Biometrika, 3, 1904 (99-103). 4 Pritchett, A. S., "A Formula for Predicting the Population of the United States,"
Quart. Publ. Amer. Statistical Assoc., 2, 1891 (278-286). 5 Pearl, R., "Variation and Differentiation in Ceratophyllum," Carnegie Inst. Waih-
ington, Publ. 58, 1907 (136). 6 Cf. the following papers:
This content downloaded on Wed, 19 Dec 2012 00:34:01 AMAll use subject to JSTOR Terms and Conditions

288 STATISTICS: PEARL AND REED PROC. N. A. S.
Curtis, M. R., 1914, "A Biometrical Study of Egg Production in the Domestic Fowl. IV. Factors Influencing the Size, Shape, and Physical Constitution of Eggs," Arch. Entwicklungsmech. Organ., B. 39, Heft 2/3, pp. 217-327.
Pearl, R., 1909, "Studies on the Physiology of Reproduction in the Domestic Fowl. I. Regulation in the Morphogenetic Activity of the Oviduct," J. Exp. Zool., 6, No. 3, pp. 339-359.
Pearl, R., 1914, "On the Law Relating Milk Flow to Age in Dairy Cattle," Proc. Soc. Expt. Biol. Med., 12, No. 1, pp. 18-19.
7 Donaldson, H. H., 1908, "A Comparison of the Albino Rat with Man in Respect to the Growth of the Brain and of the Spinal Cord," J. Compar. Neurol. Psych., 18, No. 4, pp. 345-389.
Donaldson, H. H., 1909, "On the Relation of the Body Length to the Body Weight and to the Weight of the Brain and of the Spinal Cord in the Albino Rat (Mus nor- vegicus var. albus)," Ibid., 19, No. 2, pp. 155-167.
Donaldson, H. H., 1910, "On the Percentage of Water in the Brain and in the Spinal Cord of the Albino Rat," Ibid., 20, No. 3, pp. 119-144.
Donaldson, H. H., 1911, "On the Regular Seasonal Changes in the Relative Weight of the Central Nervous System of the Leopard Frog," J. Morph., 22, pp. 663-694.
Donaldson and Hatai, Shinkishi, 1911, "A Comparison of the Norway Rat with the Albino Rat in Respect to Body Length, Brain Weight, Spinal Cord Weight, and the Percentage of Water in Both the Brain and the Spinal Cord," J. Compar. Neurol. Psych., 21, pp. 417-458.
Hatai, Shinkishi, 1909, "Note on the Formulas Used for Calculating the Weight of the Brain in the Albino Rats," Ibid., 19, No. 2, pp. 169-173.
Hatai, Shinkishi, 1911, "A Formula for Determining the Total Length of the Leopard Frog (R. pipiens) for a Given Body Weight," Anat. Rec., 5, No. 6, pp. 309-312.
Hatai, Shinkishi, 1911, "An Interpretation of Growth Curves from a Dynamical Standpoint," Ibid., 5, No. 8, pp. 373-382.
8 Always, be it clearly understood, on the assumption that the average standard of living, method of agricultural production, etc., either do not further change at all in the period between the end of historical past record of fact and the time when dy/dx be- comes negligibly small as the asymptote is approached, or that the net effective magni- tude of any such changes as do occur will be relatively so small as to be negligible in comparison with the effect of such factors as reproduction and immigration in deter- mining the relation between population and time in an area of fixed limits. In any math- ematical treatment of the subject these factors of standard of living, methods of agri- culture, etc., represent essentially constant (and hence omitted) parameters of any assumed functional relation between population and time.
9 Omitting 000 here and in the subsequent calculations till the end. 10 Cf. Pearl, R., The Nation's Food, Philadelphia (W. B. Saunders Company), 1920
(247). 11 Pearl, R., loc. cit., p. 76. 12 As a matter of fact East, in his able presidential address on "Population," before
the American Society of Naturalists has shown that the United States has already entered upon the era of diminishing returns in agriculture in this country.
13 Robertson, T. Brailsford, "On the Normal Rate of Growth of an Individual and Its Biochemical Significance," Arch. Entwickmech. Organ., 25, pp. 581-614.
Robertson, T. Brailsford, "Further Remarks on the Normal Rate of Growth of an Individual, and Its Biochemical Significance," Ibid., 26, pp. 108-118.
This content downloaded on Wed, 19 Dec 2012 00:34:01 AMAll use subject to JSTOR Terms and Conditions