Peak Oil and China haze - cup.edu.cn
18
Peak Oil and China haze Yingchao Chen a , Lianyong Feng a , Jianliang Wang a , Ke Wang a , Xiaowen Ao a , Pei He a , Jingxuan Feng a , Willam X. Wei b a School of Business Administration, China University of Petroleum, Beijing 102249, China b Grant MacEwan University, Edmonton, Alberta, Canada Abstract: The outbreaks of haze in most cities of China is mainly due to the excessive consumption of coal and oil, while the changing of coal and oil recent years have driven partly by the approaching peak of China conventional crude oil. We used a generalized Weng model to predict the peak of China conventional crude oil and summarized some literature related, we found the production of China conventional crude oil has been in the peak period and the peak oil of China is approaching. The implicit impacts of peak oil on China haze mainly include two parts: (1) the domestic oil supply is shortage and China’ s oil import is limited in part, this has stimulated the rapid growth of coal consumption to some extent; (2) China’ s oil import grows swift but poor quality oil accounts for a large proportion, meanwhile, China has produced more poor quality crude oil, that is to say, China has consumed much more poor quality oil. China haze is just one of the impacts of peak conventional oil, the economic growth, net energy for society and carbon emission maybe worse and worse in the near future. Keywords: China; Peak oil; Haze; Weng model. 1. Introduction Serious haze has appeared in China since the beginning of 2013, which almost normalization [1], affecting the public life, environment and economic activity [2].The main component of haze is the aerosol which is consisted of minerals, sulfate, organic carbon, nitrate, ammonium and elemental carbon [3]. From the composition point of view, the outbreaks of haze in most cities of China recent years is mainly due to the excessive consumption of coal and oil [4, 5, 6]. The haze in Britain was caused by the excessive consumption of coal [7] and the haze in Los Corresponding author.Tel.: +86 13911236801 E-mail address: [email protected] (L.Feng).
Transcript of Peak Oil and China haze - cup.edu.cn

Peak Oil and China haze
Yingchao Chena , Lianyong Feng
a, Jianliang Wanga, Ke Wang
a, Xiaowen Ao
a, Pei
Hea, Jingxuan Feng
a, Willam X. Wei
b
aSchool of Business Administration, China University of Petroleum, Beijing 102249, China
bGrant MacEwan University, Edmonton, Alberta, Canada
Abstract: The outbreaks of haze in most cities of China is mainly due to the excessive
consumption of coal and oil, while the changing of coal and oil recent years have driven partly by
the approaching peak of China conventional crude oil. We used a generalized Weng model to
predict the peak of China conventional crude oil and summarized some literature related, we
found the production of China conventional crude oil has been in the peak period and the peak oil
of China is approaching. The implicit impacts of peak oil on China haze mainly include two parts:
(1) the domestic oil supply is shortage and China’s oil import is limited in part, this has stimulated
the rapid growth of coal consumption to some extent; (2) China’s oil import grows swift but poor
quality oil accounts for a large proportion, meanwhile, China has produced more poor quality
crude oil, that is to say, China has consumed much more poor quality oil. China haze is just one of
the impacts of peak conventional oil, the economic growth, net energy for society and carbon
emission maybe worse and worse in the near future.
Keywords: China; Peak oil; Haze; Weng model.
1. Introduction
Serious haze has appeared in China since the beginning of 2013, which almost normalization
[1], affecting the public life, environment and economic activity [2].The main component of haze
is the aerosol which is consisted of minerals, sulfate, organic carbon, nitrate, ammonium and
elemental carbon [3]. From the composition point of view, the outbreaks of haze in most cities of
China recent years is mainly due to the excessive consumption of coal and oil [4, 5, 6].
The haze in Britain was caused by the excessive consumption of coal [7] and the haze in Los
Corresponding author.Tel.: +86 13911236801 E-mail address: [email protected](L.Feng).

Angeles was mainly due to the large auto emissions [8], but we cannot stop at the surface when
analyzing the causes. The Britain haze appeared in the industrial revolution era. Stimulated by the
rapid development of the economy, the energy demand soared. This eventually led the excessive
consumption of coal which was the main energy resource. The Los Angeles haze happened in the
times of Pacific War, so many people and plants appeared in a short term. With 2.5 million cars at
the time, Los Angeles consumed about 11 million tons gasoline per day. In addition, there are
many emission sources such as refinery plant and oil supply station. The development of
automobile industry consumed so much petroleum, which eventually result in the haze. So what’s
the background and the deep-rooted causes of China haze? From oil age point of view, we tried to
find the implicit impacts of peak oil on China haze. Furthermore, we tried to reveal the possible
influence of peak oil on China.
2. Peak oil of China
Peak oil was proposed by Hubbert in 1949. He thought “the production curve of any given
species of fossil fuel will rise, pass through one or several maxima, and then decline
asymptotically to zero” [9], that is “Bell curve law”. The essence of peak oil theory is the
production of non-renewable energy cannot grow without restriction, but affected by resource
constraints, in a moment, the production reaches maxima and cannot continue to grow or decline.
In 1956, Hubbert predicted the 48 states of America successfully using the theory [10]. From then
on, more and more researchers have begun to study peak oil.
The production of crude oil in China showed a trend of rapid growth before 1979, but after
1979, the growth rate has slowed down significantly although the production continued to
maintain a growth trend as a whole, as shown in fig. 1, the production transformed from
exponential growth to linear growth after 1979. From the perspective of growth rate, the average
annual growth rate has almost been flat and close to 0, as shown in fig. 1. The important reason for
this phenomenon is that the oil production of China has been limited by the resource. In this case,
peak oil of China maybe earlier than we expected.
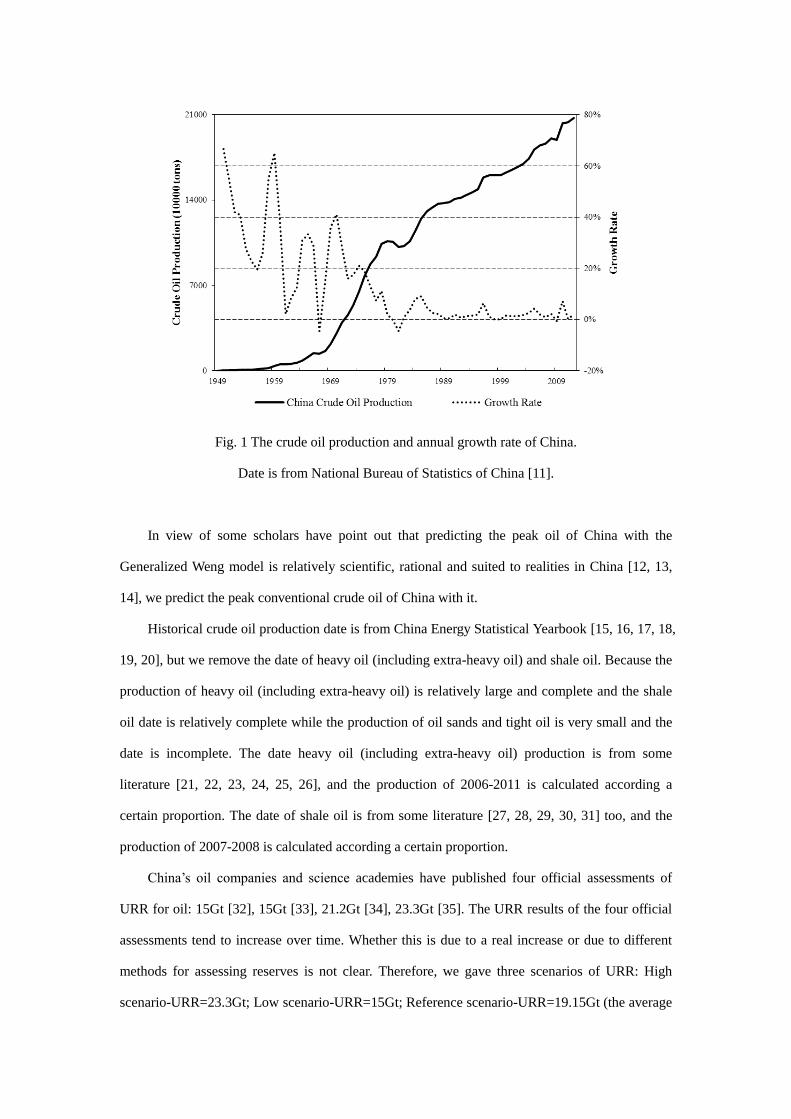
Fig. 1 The crude oil production and annual growth rate of China.
Date is from National Bureau of Statistics of China [11].
In view of some scholars have point out that predicting the peak oil of China with the
Generalized Weng model is relatively scientific, rational and suited to realities in China [12, 13,
14], we predict the peak conventional crude oil of China with it.
Historical crude oil production date is from China Energy Statistical Yearbook [15, 16, 17, 18,
19, 20], but we remove the date of heavy oil (including extra-heavy oil) and shale oil. Because the
production of heavy oil (including extra-heavy oil) is relatively large and complete and the shale
oil date is relatively complete while the production of oil sands and tight oil is very small and the
date is incomplete. The date heavy oil (including extra-heavy oil) production is from some
literature [21, 22, 23, 24, 25, 26], and the production of 2006-2011 is calculated according a
certain proportion. The date of shale oil is from some literature [27, 28, 29, 30, 31] too, and the
production of 2007-2008 is calculated according a certain proportion.
China’s oil companies and science academies have published four official assessments of
URR for oil: 15Gt [32], 15Gt [33], 21.2Gt [34], 23.3Gt [35]. The URR results of the four official
assessments tend to increase over time. Whether this is due to a real increase or due to different
methods for assessing reserves is not clear. Therefore, we gave three scenarios of URR: High
scenario-URR=23.3Gt; Low scenario-URR=15Gt; Reference scenario-URR=19.15Gt (the average

of high scenario and low scenario).
The result of predict is show in Fig. 2 and Tab. 1:
Fig. 2 Forecasted result of China’s conventional crude oil production with three scenarios.
Tab.1 The peak year and peak production of the three forecasted result
Scenario Peak year Peak production (Mt)
Low scenario 2013 164.95
Reference scenario 2021 183.11
High scenario 2028 200.62
The forecasted results of three scenarios are quite different, but we can find that the
production of China conventional crude oil has been in the peak period.
There are many literatures about the peak oil of China, for example, Feng thought the peak
year was 2011 and the peak production was 197.76 Mt [12]; Zhao thought the peak year was 2017
and the peak production was 185.38 Mt [13]; Tao thought the peak year was 2019-2022 and the
peak production was 199.5-228.0 Mt [36]; Hu thought the peak year was 2020 and the peak

production was 205 Mt [37].
In total, we came to the conclusion from the forecasted results in this paper and the current
literatures: the production of China conventional crude oil has been in the peak period and peak
conventional crude oil of China is approaching.
3. The implicit impacts of peak oil on China haze
The emergence of haze is an ongoing process of accumulation of emissions coming from
fossil fuel consumption. The endowments of China’s fossil energy resource determine that China
is “short of oil, less of gas and rich in coal” [38]. It’s in the last two years that China haze outbreak,
so the cause of China haze is not the big energy background but the changing of fossil energy
consumption recent years. Of course, the main cause of China haze is the increasing absolute
amount of fossil energy consumption, but we cannot ignore the implicit impacts of peak oil on the
changing of China fossil energy consumption: (1) The peak oil has stimulated the rapid growth of
coal consumption to some extent; (2) The peak oil results in that China has consumed much more
poor quality oil.
3.1 The peak oil stimulates the coal consumption to some extent
The World Bank date shows that the GDP growth rate of China gradually rises after China’s
accession to WTO in December 2001, even in 2009, the China’s GDP has maintained a growth
rate of 9.20% [39]. The energy demand in China grows quickly with the rapidly development of
enonomy. BP statistics shows that the average annual growth rate of primary energy consumption
in China is 9.45% during 2002-2012 while 3.91% during 1991-2001 [40], that is to say, energy
consumption rate in China has increased by 1.42 times.
It is worth nothing that the growth rate of coal is outstanding among all of the energy
consumption growth. As shown in Fig. 3, the average annual growth rate of coal consumption is
9.46% during 2002-2012 while 2.84% during 1991-2001, the coal consumption reaching 1.87
billion toe in 2012 is 2.7 times of that in 2001. Besides, the ratio of China’s coal consumption
accounts for the world’s has increased from 29.46% in 2001 to 50.22% in 2012 [40].

Fig.3 The changing of primary energy consumption in China.
Date is from BP statistics [40].
Admittedly, coal consumption surged mainly due to the rapid increasing energy demand, but
if we analyze further, we can find that the increasing coal consumption in China has been driven
by peak oil partly.
What can meet the huge energy needs of China effectively in near-time are only coal and oil.
Oil is more efficient and cleaner than coal. The calorific value of oil is 1.58-3.55 times of coal
while carbon emission factor is only 72.46%-74.64% of coal [41]. China became a net oil importer
in 1993, and from then on, as shown in Fig. 4, the net oil imports of China has kept an average
annual growth ratio of 29.27%, and the oil external dependency reaches 58.98% in 2013. But the
average annual growth rate of oil consumption has been almost unchanged, as shown in Fig. 3,
7.06% during 2002-2012 while 6.62% during 1991-2001, rising only 0.44%. The analysis above
maybe reveals a fact that China needs much more oil than they have consumed and China’s oil
imports may be limited partly.
In fact, although China’s oil imports accounts for only 13.63% of world’s total trade in 2013
[40], EIA date [38] shows that the growth amount of China’s crude oil net imports from 2001 to

2010 accounts for 96.52% of the growth amount of world’s total crude oil trade and BP statistics
date [40, 42] shows the ratio of 2001-2013 is 114.41%, furthermore, the growth amount of China’s
oil imports from 2001 to 2013 accounts for 47.05% of the growth amount of world’s total oil trade
[40]. The growth part of world’s oil (crude oil) trade mainly exports to China, especially crude oil.
Besides, the oil price has increased rapidly after 2002, as shown in Fig. 4, but the oil imports
amount and its growth rate show that China’s net oil import was little affected by the increasing
oil price. That is to say China has bought oil from the world without thinking about the price and
the important is China has bought almost all of the growth part of world’s crude oil during
2001-2013. The analysis above confirms the truth: China needs much more oil than they have
consumed and China’s oil import has been limited partly.
Fig. 4 The oil consumption and production in China and the trend of Brent oil price.
Date is from BP statistics [40]
Under the background of that coal and oil are the only two options for meeting the huge
energy demand in near-time, the peak conventional crude oil is approaching and China’s oil
import is limited, so this stimulates the increasing coal consumption. Although the surging coal
consumption in China is not mainly resulting from peak oil, we should recognize that the

approaching of peak conventional crude oil has stimulated the coal consumption in China.
3.2 The peak oil results in China consuming much more poor quality oil.
The oil China has consumed comes from two parts: (1) The domestic production; (2) The
imports. With the approaching of conventional crude oil, China has produced more poor quality
oil than before, at the same time, the oil imported mainly came from the country whose oil quality
is poor and some oil imported affected by the development of unconventional oil.
The oil quality standard is from “World Oil and Gas Review 2013” [43], API level equal to or
greater than 10° and less than 26° and sulphur content equal to or greater than 1% are both poor
quality oil. Consuming poor quality oil means more emissions (such as sulfur dioxide) which is
related to the formation of haze directly.
The sulphur crude oil produced in China accounts for a small proportion of the total, as
shown in Tab. 2, the ratio is about 1% but increasing. The heavy crude oil produced in China has
increased from 110 thousand barrels per day in 1995 to 712 thousand barrels per day and the ratio
heavy oil accounts for total crude oil has increased form 3.68% to 17.21% as well, as shown in
Tab. 2. In addition, some literatures also show that the production of heavy oil (including
extra-heavy) has increase from 14.31 million tons in 2005 to 23.93 million tons in 2012 [44, 45].
In total, China has produced much more poor quality crude oil than before.
Tab. 2 The production of poor quality crude oil in China from 1995 to 2012.
Year
Heavy Sour
Production
(Thousand barrels per day)
Ratio
(%)
Production
(Thousand barrels per day) Ratio (%)
1995 110 3.68 17 0.57
2000 267 8.21 17 0.52
2005 463 12.76 19 0.52
2010 773 18.87 53 1.29
2012 712 17.21 53 1.28
Date is from “World Oil and Gas Review 2013” [43]
The quality of crude oil imported is poor, as shown in Tab. 3. Generally, the crude oil quality
in a country changes little, so we estimated that the poor quality crude oil accounts for about 60%
of the accumulation crude oil imported during 2000-2013. Besides, the growth of crude oil

imported mainly came from countries whose crude oil quality is poor, we estimated that the poor
quality crude oil accounts for about 70% of the growth crude oil imported during 2000-2013.
Tab. 3 The crude oil imported of China during 2000-2013.
Country
Cumulative imports Growth of imports Ratio of poor
quality (%)
Amount (Ten
thousand tons)
Ratio
(%)
Import Growth (Ten
thousand tons)
Ratio
(%) 2012 2000
Saudi Arabia 41172.56 18.08 4816.88 22.73 97.22 97.49
Angola 32312.96 14.19 3137.67 14.81 16.20 8.19
Iran 24268.41 10.66 1444.07 6.82 100.00 100.00
Oman 20047.12 8.80 982.10 4.64 100.00 100.00
Russia 17502.45 7.69 2296.90 10.84 90.57 97.64
Sudan 10176.61 4.47 -- -- 8.85 0.00
Iraq 8226.04 3.61 2033.06 9.60 100.00 100
Venezuela 7292.39 3.20 1574.78 7.43 100.00 83.21
Kazakhstan 7145.85 3.09 1125.64 5.31 0.00 0.00
Kuwait 6539.95 2.87 891.35 4.21 100.00 100.00
Congo 5864.41 2.58 562.36 2.65% 0.00 0.00
Yemen 5467.89 2.40 -- -- 0.00 0.00
United Arab 5147.57 2.26 984.53 4.65 46.81 50.27
Brazil 4095.90 1.80 501.30 2.37% 72.44 72.12
Date is from some literature [43, 46, 47, 48, 49].
Driven by peak oil of the world, unconventional oil has been developed rapidly [50]. The
production of extra-heavy crude oil in Venezuela has increased from 0.16 million barrels per day
in 2000 to 0.81 million barrels per day at an annual speed of 15.9% [51]. At the same time, the
crude oil imported from Venezuela has increased from 55.6 thousand tons in 2001 to 15.75 million
tons in 2012 [46, 48, 52]. Although not all of the crude oil imported from Venezuela is extra-heavy
crude oil, the rapid development of extra-heavy crude oil in Venezuela and the increasing crude oil
imported from Venezuela largely reflect that the crude oil quality consumed in China is declining.
4. The impacts of peak oil are more than China haze.
Throughout the major oil-consuming countries and regions of the world, the rapid
development of shale resource in American has greatly eased its oil supply shortage state [53, 54,

55]; Europe is transforming to low-carbon society [56], the oil consumption has declined
significantly since the conventional crude oil in 2006 [40, 57]; The oil consumption in Japan is
small relatively [40]. The oil dependency in those countries and regions has dropped or low
relatively, this has eased the impacts of peak oil. On the contrary, energy intensive industries in
China and India, especially in China, have developed rapidly [58]. With the rapidly increasing oil
consumption in China, the oil dependency is higher and higher [59]. The impacts of peak oil are
more than China haze, as shown in the following:
(1) Economy of China is affected by the oil price severely.
IEA predicted that, in the new policy scenario, the oil demand in China during 2011-2035
will increase at an annual ratio of 2.20% while the production will decline at an annual ratio of
1.70%, and the oil imported will increase from 4.9 million barrels per day in 2011 to 12.3 million
barrels per day in 2035, the oil external dependency of China will reach 82% in 2035 [59].
The huge oil imported and high oil external dependency make the economy of China subject
to the international oil price. There exists a significant unidirectional Granger-Causality from
change rate of international oil prices to inflation rate of China, but no significant unidirectional
Granger-Causality from inflation rate of China to change rate of international oil prices, China can
only accept changes in the international oil prices passively and have no say in international oil
prices [60]. If international oil prices rose 10 dollar per barrel, the price index rose 0.46%, real
GDP reduced 0.53%; the real disposable income of rural residents and urban residents reduced
0.78% and 1.16%, the consumer spending of rural residents and urban residents reduced 0.33%
and 0.72%, respectively [61]. World crude oil prices rose by 1% would result in 0.188% decline in
GNP [62]. According to the Supply Shocks theory of Rasch and Tatom [63], Barro [64], Brown
and Yucel [65] and the Income Transfer theory of Fried and Schulze [66], the rise in world oil
price will lower the importers’ demand for Chinese export products and improve the production
cost of domestic goods in China, which reduces the competitiveness of China’s export products; In
addition, textile industry, light industry, agricultural and sideline products and processing trade
which are labour-intensive industries are the main export products of China. The profit margins of
those industries is small and the risk-resisting ability is week, in that case, export profits and trade
surplus decline because of the increasing production cost and transportation cost driven by high oil
price.

(2) EROI of oil and gas industry in China declines.
EROI (Energy Return on Investment) is a method to calculate the energy returned to the
economy and society compared to the energy required to obtain that energy [67, 68]. The
declining EROI of oil and gas industry is one of impacts of peak conventional oil in China. There
is a certain dependency between the peak EROI of oil and peak production of oil [69], peak
production of oil occurs earlier than the peak net energy [70]. In terms of fossil energy resources,
it is net energy that has the real significance [70], while EROI is the method measuring net energy.
The EROI of production of crude oil and natural gas for the Daqing oil field, the largest oil
field in China, was 10:1 in 2001 but has declined to 6.5:1 in 2009, and will decline to 4.7:1 in
2015 [71]. China’s oil and natural gas extraction declined from a maximum value of 14:1 in 1996
to 10:1 in 2010, an annual rate of decline of 2.6%, and the average EROI will be about 10:1 in
2015, 9:1 in 2020 [37].
The value of EROI of China’s oil and gas industry has been declining [37] and this decline is
irreversible [72]. The most direct impact of the declining EROI is that the energy consumed in
production process increases and the net energy for economic system decreases, which means the
net energy from the production of oil and gas in China is declining. The sustained and stable
economic growth requires the security of energy supply, otherwise it will inevitably lead to
restrictions and limitations on economic growth [73]. The impact of declining EROI of oil and gas
in China on economic growth cannot be ignored [74]. The economic growth rate of China will be
5.71% and 3.66% during the Thirteenth Five-year Plan and Fourteenth Five-year Plan period
because of the declining EROI, which means China’s economic growth will break down [73]. In
addition, the declining EROI also means that the transformation ability for products and service of
per unit thermal equivalent of oil and gas falls. The declining EROI of oil and gas will worsen the
energy consumption in China.
(3) The carbon emission problem will be more prominent.
The average annual growth rate of carbon dioxide emissions from fossil energy consumption
was 9.18% during 2002-2012 while 3.51% during 1991-2001, as shown in Fig. 5, the growth rate
has changed a lot after 2002. China has been the country emitting more carbon than any other
country.

Fig. 5 The carbon dioxide from fossil energy consumption of main counties and regions
Date is from BP Statistics [40]
The application of EOR (Enhanced Oil Recovery) and the development of coal-to-liquids and
unconventional oil are the main measures for improving the oil production in China. The EOR has
been applied in many oilfields in China [75], the oil increment results from EOR was 12 million
tons in 1995 while 30 million tons in 2010 [76, 77]; The coal-to-liquids industry has developed
rapidly recently, coal-to-liquids capacity is expanding and reached1.6 MT/year in2009, Capacity is
forecast to reach12 MT/year in2015, 50 MT/year in 2020, and expand further after 2020 [78]. In
terms of the unconventional oil production in China, shale oil was 755 thousand tons in 2011 [30],
oil sands oil was 500 thousand tons in 2010 [79], heavy oil (including extra-heavy oil) was 23.93
million tons in 2012 [21], and tight oil will reach 1-2 million tons in 2015 [80]. Besides, with the
increase of oil imports, China will consume much more unconventional oil in the future because
of the development of unconventional oil. The carbon emission factor of different kinds of oil is
shown in Fig. 6, and it is easy to find that the conventional oil is much cleaner than others. In this
case, the carbon emission problem will be more prominent in China.
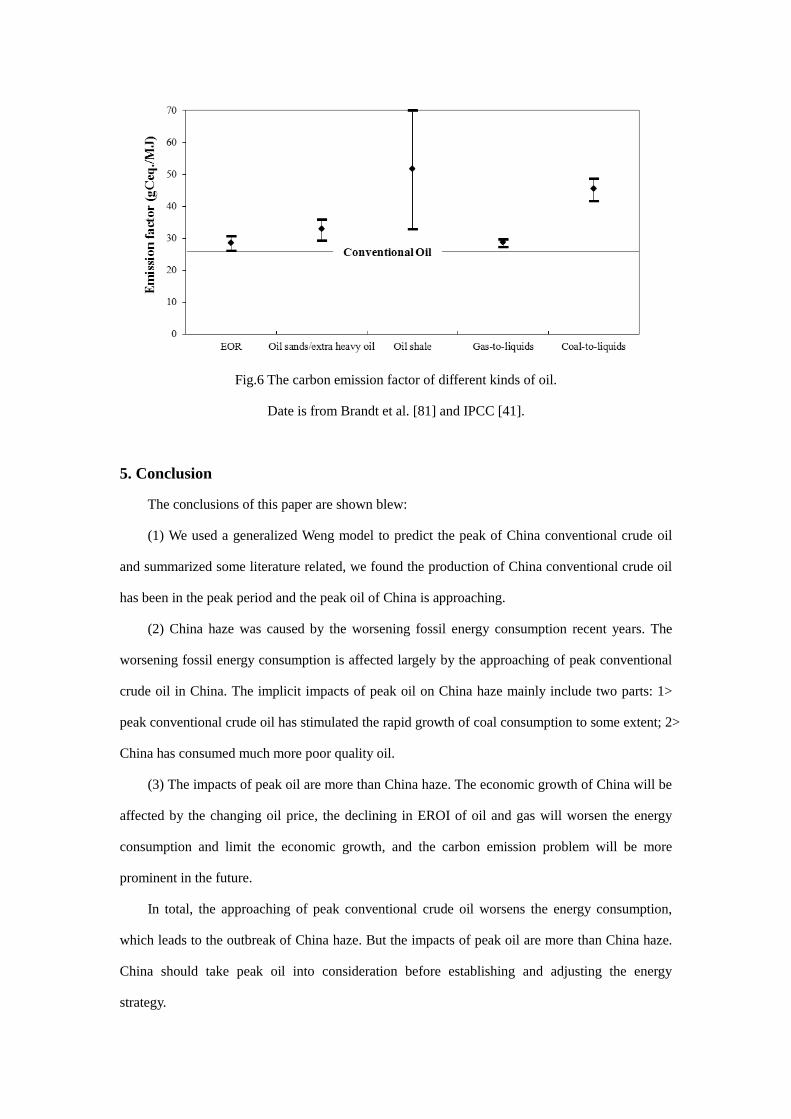
Fig.6 The carbon emission factor of different kinds of oil.
Date is from Brandt et al. [81] and IPCC [41].
5. Conclusion
The conclusions of this paper are shown blew:
(1) We used a generalized Weng model to predict the peak of China conventional crude oil
and summarized some literature related, we found the production of China conventional crude oil
has been in the peak period and the peak oil of China is approaching.
(2) China haze was caused by the worsening fossil energy consumption recent years. The
worsening fossil energy consumption is affected largely by the approaching of peak conventional
crude oil in China. The implicit impacts of peak oil on China haze mainly include two parts: 1>
peak conventional crude oil has stimulated the rapid growth of coal consumption to some extent; 2>
China has consumed much more poor quality oil.
(3) The impacts of peak oil are more than China haze. The economic growth of China will be
affected by the changing oil price, the declining in EROI of oil and gas will worsen the energy
consumption and limit the economic growth, and the carbon emission problem will be more
prominent in the future.
In total, the approaching of peak conventional crude oil worsens the energy consumption,
which leads to the outbreak of China haze. But the impacts of peak oil are more than China haze.
China should take peak oil into consideration before establishing and adjusting the energy
strategy.

Acknowledgements
This research has been supported by National Natural Science Foundation of China (No.
71373285). We wish to thank the anonymous reviewers and editor for their helpful suggestions.
Reference
[1] 记者 龙金光 实习生 严巧. 中国雾霾天气几乎常态化[N]. 南方日报,2013-11-06A06.
(http://news.sina.com.cn/c/2013-11-06/085028633759.shtml)
[2] 刘鸿志. 雾霾影响及其近期治理措施分析[J]. 环境保护,2013,15:30-32
[3] Zhang X Y, Wang Y Q, Niu T, et al. Atmospheric aerosol compositions in China: spatial/temporal variability,
chemical signature, regional haze distribution and comparisons with global aerosols[J]. Atmospheric
Chemistry and Physics, 2012, 12(2): 779-799
[4] 张小曳,孙俊英,王亚强,李卫军,张蔷,王炜罡,权建农,曹国良,王继志,杨元琴,张养梅. 我国雾-霾成因及其
治理的思考[J]. 科学通报,2013,13:1178-1187
[5] Cao, G. L., An, X. Q., Zhou, C. H., Ren, Y. Q., and Tu, J.: Emission inventory of air pollutants in china,
China Environmental Science, 30, 900–906, 2010
[6] Lu, Z., Streets, D. G., Zhang, Q., Wang, S., Carmichael, G. R.,Cheng, Y. F., Wei, C., Chin, M., Diehl, T., and
Tan, Q.: Sulfur dioxide emissions in China and sulfur trends in East Asia since 2000, Atmos. Chem. Phys.,
10, 6311–6331, doi:10.5194/acp-10-6311-2010, 2010.
[7] 若英. 国外治理雾霾有何招数?[J]. 红旗文稿,2013,04:39.
[8] 郑权,田晨. 美国洛杉矶雾霾之战的经验和启示[J]. 中国财政,2013,11:70-71.
[9] Hubbert,M.K.1949.“Energy from Fossil Fuels”,Science,109(2823):103-109
[10] Hubbert. M. K. 1956. Nuclear Energy and the Fossil Fuels. Meeting of the Southern District, Division of
Production, American Petroleum Institute, San Antonio, Texas, Shell Development Company.
[11] National Bureau of Statistics of China, National date. http://data.stats.gov.cn/index
[12] Feng L, Li J, Pang X. China's oil reserve forecast and analysis based on peak oil models[J]. Energy Policy,
2008, 36(11): 4149-4153.
[13] 赵林,冯连勇,赵庆飞,庞雄奇. 中国石油峰值理论及中国石油峰值预测[A]. 中国石油大学(北京)中国
能源战略研究中心.第一届中国能源战略国际论坛论文集[C].中国石油大学(北京)中国能源战略研究
中心:,2006:7.
[14] 李君臣,曲会,徐文钦. 基于广义翁氏模型的中国石油峰值预测及分析[A]. 中国石油大学(北京)中国
能源战略研究中心.第二届中国能源战略国际论坛论文集[C].中国石油大学(北京)中国能源战略研究
中心:,2007:8.
[15] 中国能源统计年鉴[M]. 中国统计出版社, 1989.
[16] 中国能源统计年鉴[M]. 中国统计出版社, 1991.
[17] 中国能源统计年鉴[M]. 中国统计出版社, 1997-1999.
[18] 中国能源统计年鉴[M]. 中国统计出版社, 2005.
[19] 中国能源统计年鉴[M]. 中国统计出版社, 2011.
[20] 中国能源统计年鉴[M]. 中国统计出版社, 2013.
[21] Liu W.Z. Thermal Recovery Status and Development Prospect for Heavy Oil in China. 7th unitar
international conference on heavy crude and tar sands. Heavy oil-A major energy source for the 21st century.
Paper number 1998-198. 1998, 2: 1843-1856
[22] Shouliang Z, Yitang Z, Shuhong W, et al. Status of Heavy Oil Development in China. SPE/PS-CIM/CHOA
International Thermal Operations and Heavy Oil Symposium, 1-3 November 2005, Calgary, Alberta,
Canada.
[23] Li W., Gu W.W. Heavy Oil - The Future of Global Energy?——focus on the first World Heavy Oil
Conference. International Petroelum Economics, 2006,14(12):42-46 (in Chinese)
[24] Wang X. China and the World Amidst the Heat of Heavy Oil Development. Petroleum & Equipment, 2010a,
(5):41-43 (in Chinese)
[25] Jin F. Developing and utilization prospect of unconventional oil resources, Petroleum & Chemical,
2007,(6):48-54 (in Chinese)
[26] Yu H., Ling W., Zhao M., Wang J.X., Liu Y.M. Reaction of dielectric barrier discharge plasma with crude oil.
Nuclear Fusion and Plasma Physics, 2012, 32(3):271-277 (in Chinese)
[27] 胡文瑞,翟光明,李景明. 中国非常规油气的潜力和发展[J]. 中国工程科学,2010,05:25-29+63.
[28] 钱家麟,王剑秋,李术元. 世界油页岩开发利用动态——记美国第 27 届国际油页岩会议[J]. 中外能
源,2008,01:11-15.
[29] 李术元,岳长涛,钱家麟. 世界油页岩开发利用现状——并记 2009 年国内外三次油页岩会议[J]. 中外能
源,2010,02:21-28
[30] 李术元,马跃,钱家麟. 世界油页岩研究开发利用现状——并记 2011 年国内外三次油页岩会议[J]. 中外
能源,2012,02:8-17
[31] 李术元,唐勋,何继来,钱家麟. 世界油页岩开发利用的近况——并记2012年国外两次油页岩国际会议[J].
中外能源,2013,01:3-11.
[32] Li JM, Liu SZ, Li DX, Ma SP. Exploratory situation and development tendency of China’s natural gas.
Natural Gas Industry 2004;24(12):1e4 [in Chinese].
[33] Chinese Academy of Engineering (CAE). The report of strategy research on the sustainable development of
China’s oil and gas resources (unpublicized print);2004 [in Chinese].
[34] The Journal Editor. The result of 3rd national oil and gas resource assessment. Henan Land & Resources
2008;;9:42 [in Chinese].
[35] Huang XF. The dynamic assessment of national oil and gas resources. Economic Daily News; 2011 [in
Chinese]
[36] Tao Z, Li M. System dynamics model of Hubbert Peak for China's oil[J]. Energy Policy, 2007, 35(4):
2281-2286
[37] Hu Y, Hall C A S, Wang J, et al. Energy Return on Investment (EROI) of China's conventional fossil fuels:
Historical and future trends[J]. Energy, 2013, 54: 352-364.
[38] EIA. International Energy Statistics. http://www.eia.gov/cfapps/ipdbproject/IEDIndex3.cfm
[39] The World Bank, World Bank Open Data. http://data.worldbank.org/
[40] Petroleum B. BP statistical review of world energy [J]. 2014.
[41] Change I P O C. 2006 IPCC Guidelines for National Greenhouse Gas Inventories[J], Institute for Global
Environmental Strategies, Hayama, Kanagawa, Japan, 2006.
[42] Petroleum B. BP statistical review of world energy[J]. 2002.
[43] Eni, World Oil and Gas Review, 2013.
http://www.eni.com/world-oil-gas-review-2013/wogr.shtml?home_2010_it_tab=altri_temi_interesse
[44] Li W., Gu W.W. Heavy Oil - The Future of Global Energy?——focus on the first World Heavy Oil
Conference. International Petroelum Economics, 2006,14(12):42-46 (in Chinese)
[45] Zou C.N., Zhang G.S., Yang Z., et al. Concepts, characteristics, potential and technology of unconventional
hydrocarbons: On unconventional petroleum geology. Petroleum Exploration and Development, 2013a,
40(4): 413-428.
[46] 田春荣. 2013 年中国石油和天然气进出口状况分析[J]. 国际石油经济,2014,03:29-41.
[47] 田春荣. 2010 年中国石油进出口状况分析[J]. 国际石油经济,2011,03:15-25+104-105.
[48] 田春荣. 2005 年中国石油进出口状况分析[J]. 国际石油经济,2006,03:1-7+70.
[49] 田春荣. 2003 年中国石油进出口状况分析[J]. 国际石油经济,2004,03:9-15+71.
[50] AGO F Y, SAW M O I L E. Peak oil production may already be here[J]. Science, 2005: 1106.
[51] Laherrere J, 2012. Production of crude less extra-heavy oil in Venezuela.
http://aspofrance.viabloga.com/files/JL_Venezuela2012.pdf
[52] 田春荣. 2012 年中国石油和天然气进出口状况分析[J]. 国际石油经济,2013,03:44-55+109.
[53] 孔祥永. 美国“页岩气革命”及影响———兼论对中国页岩气开发的启示[J]. 国际论坛,2014,01:71-76.
[54] 华迎. 页岩气革命及其影响[J]. 国际经济合作,2013,08:67-68.
[55] 杨挺,孙小涛. 美国页岩气开发对世界天然气和石油化工产业的影响[J]. 化工进展,2013,03:717-720
[56] 陈俊荣. 从“欧盟 2020 战略”看欧洲低碳经济发展[J]. 环境保护,2011,Z1:87-89.
[57] IEA, 2010. World Energy Outlook 2010.International Energy Agency, Paris.
[58] 邓伟根. 20 世纪的中国产业转型:经验与理论思考[J]. 学术研究,2006,08:17-24+147.
[59] IEA, 2012. World Energy Outlook 2012.International Energy Agency, Paris.
[60] 王风云.国际石油价格波动对中国通货膨胀影响的实证分析[J].价格月刊,2007,(7): 6-8.
[61] 魏一鸣,焦建玲,梁强,范英. 油价长期高位对我国社会经济的影响与对策[J]. 中国科学院院
刊,2008,01:11-15.
[62] 何念如,朱闰龙.世界原油价格上涨对中国经济的影响分析[J].世界经济研究,2006,(02):47-53.
[63] Rasche R H,Tatom J A.Energy resources and potential GNP[J].Federal Reserve Bank of St.Louis Review,
1977,59(6):10-24.
[64] Barro R J. Macroeconomics [M]. New York:John Wiley & Sons, 1984.
[65] Brown S P A,Yucel M K.Oil prices and U.S.aggregate economic activity: a question of
neutrality[J].Economic and Financial Review,1999,(2):16-23.
[66] Fried E R, C.L. Schultze. Overview, Hingher Oil Prices and the World Economy[M]. Washington D.C.: The
Brookings Institution, 1975.
[67] Leena G, Hall C. A.S, Höök M. Energy Return on Investment for Norwegian Oil and Gas from 1991 to 2008.
Sustainability, 2011, 3:2050-2070.
[68] King C W, Hall C A S. Relating Financial and Energy Return on Investment. Sustainability, 2011, 3:
1810-1832.
[69] Heun M.K., Wit M.D. Energy return on (energy) invested (EROI), oil prices, and energy transitions. Energy
Policy, 2012(40): 147–158.
[70] Odum H.T. Energy, Ecology, and Economics. Ambio, 1973, 2: 220–227.
[71] Hu Y, Feng L, Hall C, et al. Analysis of the energy return on investment (EROI) of the huge Daqing Oil Field
in China[J]. Sustainability, 2011, 3(12): 2323-2338.
[72] Gagnon N, Hall C A S, Brinker L. A preliminary investigation of energy return on energy investment for
global oil and gas production [J]. Energies, 2009, 2(3): 490-503.
[73] 胡燕, 冯连勇, 齐超, 等. 能源回报趋势对我国经济增长的影响分析[J]. 技术经济与管理研究, 2014 (2)
[74] Murphy D J, Hall C A S. Energy return on investment, peak oil, and the end of economic growth[J]. Annals
of the New York Academy of Sciences, 2011, 1219(1): 52-72.
[75] 沈平平, 袁士义, 韩冬, 等. 中国陆上油田提高采收率潜力评价及发展战略研究[J]. 石油学报, 2001,
22(1): 45-48.
[76] Dakuang H. [5] 4 The Achievements and Challenges of EOR Technology for Onshore Oil Fields in
China[C]//15th World Petroleum Congress. World Petroleum Congress, 1997.
[77] 王友启, 周梅, 聂俊. 提高采收率技术的应用状况及发展趋势[J]. 断块油气田, 2010 (5): 628-631.
[78] 杨敏英. 论我国煤制油的战略发展方向[J]. 煤炭经济研究, 2010, 30(4): 20-24.
[79] 国土资源部,国家发改委,财政部.新一轮全国油气资源评价——油砂资源评价报告.2006 年 6 月.
[80] 邹才能,陶士振,杨智,袁选俊,朱如凯,侯连华,贾进华,王岚,吴松涛,白斌,高晓辉,杨春. 中国非常规油气勘
探与研究新进展[J]. 矿物岩石地球化学通报,2012,04:312-322.

[81] Brandt A R, Farrell A E. Scraping the bottom of the barrel: greenhouse gas emission consequences of a
transition to low-quality and synthetic petroleum resources[J]. Climatic Change, 2007, 84(3-4): 241-263.