PEABODY WILPINJONG COAL GROUNDWATER … Mining...5.4 Groundwater Users 15 6 Groundwater Monitoring...
44
PEABODY WILPINJONG COAL GROUNDWATER MANAGEMENT PLAN (WI-ENV-MNP-0041) AUGUST 2017
Transcript of PEABODY WILPINJONG COAL GROUNDWATER … Mining...5.4 Groundwater Users 15 6 Groundwater Monitoring...

PEABODY WILPINJONG COAL GROUNDWATER MANAGEMENT PLAN
(WI-ENV-MNP-0041) AUGUST 2017
Wilpinjong Coal – Groundwater Management Plan Document Number: WI-ENV-MNP-0041 Uncontrolled when printed
Document Owner Document Approver
Environmental Representative Environment and Community Manager
Version Approval Date Approver Name
3 xx Kieren Bennetts
General Description of Changes from Previous Version
Document No. Version Date Prepared/Reviewed By Distribution Description of Change
GWMP-R01 G February
2006 WCPL, Resource Strategies,
Mr Ian Callow (AGE) DNR, DP&I
Original plan - developed for initial development phase of
the project
GWMP-R01 H 6 March 2006 WCPL, Resource Strategies,
Mr Ian Callow (AGE) DP&I
Amended to address DP&I comments. This version was
approved by DP&I.
GWMP-R02 B March 2009 WCPL, Resource Strategies NSW Office
of Water (NOW)
Periodic review
GWMP-R02 C December
2010
WCPL, Mr Andrew Durick (AGE), Dr Steve Perrens
(Evans and Peck)
OEH, NOW and DP&I
Revision following the August 2010 Modification and to address NOW comments
WI-ENV-MNP-0006
1 20 June 2014 WCPL, Palaris, Dr Noel
Merrick (HydroSimulations), Resource Strategies
OEH, NOW
Revised following approval of Mod 5 (PA 05-0021). Also
incorporates requirements of groundwater licences, ML
1573 and Exploration Licences (EL) 7091 and 6169.New format. Forms appendix (Appendix 6) to Water Management Plan
(WMP). Submitted to OEH and NOW for consultation
WI-ENV-MNP-0006
1.1 30 June 2014 WCPL, Palaris DP&E, OEH and NOW
Minor amendments to address comments by Resource
Strategies prior to submission to DP&E.
WI-ENV-MNP-0006
2 November
2014 WCPL, Palaris
DP&E, OEH and NOW
Minor amendments to address comments by DP&E and
NOW.
WI-ENV-MNP-0041
1 June 2016 WCPL DP&E Change of Document number match SAWOL MS number
WI-ENV-MNP-0041
2 October 2016 WCPL DP&E MOD 7
WI-ENV-MNP-0041
3 August 2017 WCPL, HydroSimulations DP&E, DPI Water and
EPA
Updated to reflect Development Consent
(SSD-6764)

Wilpinjong Coal – Groundwater Management Plan Document Number: WI-ENV-MNP-0041 Uncontrolled when printed i of ii
CONTENTS
1 Introduction 1
2 Statutory and Project Approval Requirements 2
2.1 Specific Development Consent Requirements 2 2.2 General Management Plan Requirements 3 2.3 Specific Guidance from Regulatory Agencies 3
3 Existing Groundwater Conditions 5
3.1 Alluvial Aquifers 5 3.2 Unconsolidated Tertiary Deposits 6 3.3 Groundwater Recharge 6
4 Baseline Data 9
4.1 Historical Groundwater Investigations 9 4.2 Baseline Groundwater Monitoring 9 4.3 Wilpinjong Creek Alluvial Investigations 12 4.4 Cumbo Creek Geotechnical Site Assessment 12 4.5 Private Groundwater Bores 12
5 Groundwater Predictions 14
5.1 Mine Inflows and Groundwater Licensing 14 5.2 Porous Rock Groundwater System 14 5.3 Alluvial Groundwater System 15 5.4 Groundwater Users 15
6 Groundwater Monitoring Program 16
6.1 Groundwater Levels and Quality 16 6.2 Groundwater Testwork 19 6.3 Final Landform Monitoring 19 6.4 Groundwater Modelling Review 19 6.5 Groundwater Dependent Ecosystems 19
7 Trigger levels 21
7.1 Groundwater Levels 21 7.1.1 Mining Effect 21 7.1.2 Water Supply Borefield Effect 22 7.1.3 Private Landholders and Wollar Public School 22
7.2 Groundwater Quality 23
8 Groundwater Response Plan 26
8.1 Groundwater Levels 26 8.1.1 Mining Effect 26 8.1.2 Groundwater Predictions 27 8.1.3 Water Supply Borefield 27 8.1.4 Private Landholders and Wollar Public School 28
8.2 Groundwater Quality 28 8.3 Groundwater Dependent Ecosystems 28
9 Annual Review and Improvement of Environmental Performance 32
10 Responsibilities 33
11 References 34

Wilpinjong Coal – Groundwater Management Plan Document Number: WI-ENV-MNP-0041 Uncontrolled when printed ii of ii
TABLES
Table 1 Specific GWMP Requirements
Table 2 General Management Plan Requirements
Table 3 Specific Regulatory Agency Requirements
Table 4 Baseline Groundwater Monitoring Sites
Table 5 Typical Baseline EC and pH Values by Aquifer Type
Table 6 Estimated Groundwater Licensing Requirements
Table 7 Groundwater Monitoring Network
Table 8 Groundwater Quality Monitoring
Table 9 Alluvial Monitoring Bore Details and Water Level Triggers
Table 10 Water Supply Borefield – Cease to Pump Trigger Levels
Table 11 Baseline Water Quality EC Statistics per Lithology
Table 12 Baseline Water Quality pH Statistics per Lithology
Table 13 Baseline Water Quality EC Statistics per Bore
Table 14 Baseline Water Quality pH Statistics per Bore
Table 15 Groundwater Levels – Mining Effect TARP
Table 16 Groundwater Levels – Groundwater Predictions TARP
Table 17 Groundwater Levels – Water Supply Borefield TARP
Table 18 Groundwater Quality TARP
Table 19 Responsibilities
FIGURES
Figure 1 Interpreted Extent of Unconsolidated Sediments
Figure 2 Groundwater Monitoring Network
ATTACHMENTS
Attachment 1 Baseline Monitoring Data

Wilpinjong Coal – Groundwater Management Plan Document Number: WI-ENV-MNP-0041 Uncontrolled when printed 1 of 34
1 Introduction The Wilpinjong Coal Mine (the Mine) is owned and operated by Wilpinjong Coal Pty Limited (WCPL), a wholly owned subsidiary of Peabody Energy Australia Pty Ltd (Peabody). The Mine is an existing open cut coal mining operation situated approximately 40 kilometres (km) north-east of Mudgee, near the Village of Wollar, within the Mid-Western Regional Local Government Area, in central New South Wales (NSW). The mine produces thermal coal products which are transported by rail to domestic customers for use in electricity generation and to port for export. Open cut mining operations are undertaken 24 hours per day, seven days per week. The Wilpinjong Coal Mine originally operated under Project Approval (PA 05-0021) that was granted by the Minister for Planning under Part 3A of the NSW Environmental Planning and Assessment Act 1979 (EP&A Act) on 1 February 2006. Modification of the Project Approval subsequently occurred six times1 with the most recent modification (Modification 7) approved in August 2016. The existing Site Water Management Plan (including an Erosion and Sediment Control Plan, Surface Water Management and Monitoring Plan and Surface and Ground Water Response Plan) was developed in accordance with NSW Project Approval 05-0021 and the last revision was approved on 20 March 2017. On 24 April 2017, WCPL was granted Development Consent (SSD-6764) for the Wilpinjong Extension Project that provides for the continued operation of the Mine at rates of up to 16 million tonnes per annum (Mtpa) of run-of-mine (ROM) out to 2033, and access to approximately 800 hectares (ha) of open cut extensions. Development Consent (SSD-6764) has superseded the Project Approval (Project Approval 05-0021). This Groundwater Management Plan (GWMP) has been prepared to satisfy the relevant conditions in Development Consent (SSD-6764). Where relevant, this GWMP builds on the relevant components of the existing/approved Site Water Management Plan, including previous feedback from consultees and where relevant trigger levels that have already been previously agreed. The Secretary of the NSW Department of Planning and Environment (DP&E) approved Dr Noel Merrick as a suitably qualified and experienced person for the preparation/review of the GWMP on 24 May 2017. This GWMP was prepared in consultation with Dr Noel Merrick.
1 Mod 2 was withdrawn.

Wilpinjong Coal – Groundwater Management Plan Document Number: WI-ENV-MNP-0041 Uncontrolled when printed 2 of 34
2 Statutory and Project Approval Requirements
2.1 Specific Development Consent Requirements This GWMP has been prepared in accordance with Condition 30(d)(iv), Schedule 3 of Development Consent (SSD-6764). Table 1 presents these requirements and indicates where they are addressed within this GWMP.
Table 1 Specific GWMP Requirements
Development Consent (SSD-6764) Condition GWMP Section
Water Management Plan
30. Prior to carrying out any development under this consent, unless the Secretary agrees otherwise, the Applicant must prepare a Water Management Plan for the development to the satisfaction of the Secretary...
(d) … this plan must include a:
(iv) Ground Water Management Plan that includes:
detailed baseline data of groundwater levels, yield and quality in the region that could be affected by the development, including privately-owned groundwater bores and groundwater dependent ecosystems;
Section 4
groundwater assessment criteria including trigger levels for investigating any potentially adverse groundwater impacts;
Section 7
a program for accurately delineating the boundary of the Wilpinjong Creek alluvial aquifer in any areas intersected by mining;
Section 4.3
a program to monitor and report on: Section 6
o impacts of the development on:
groundwater supply of potentially affected landowners;
regional and local (including alluvial) aquifers;
groundwater dependent ecosystems and riparian vegetation;
o connectivity and groundwater leakage to/from Cumbo Creek following relocation;
Section 6
o the seepage/ leachate from water storages and emplacements; Section 6
o groundwater inflows into open cut/ voids and transfers to the water management system;
Section 6
o ground water levels and/or pressure and quality in the alluvial, coal seam, and inter-burden aquifers; and
Section 6
a program to review and validate the groundwater model for the development, including independent expert review; and
Section 5
a plan to respond to any exceedances of the trigger levels and/or performance criteria, and mitigate and/or offset any adverse groundwater impacts of the development, including measures to provide compensatory water supply to any affected groundwater users under condition 24 of this schedule;
Section 8

Wilpinjong Coal – Groundwater Management Plan Document Number: WI-ENV-MNP-0041 Uncontrolled when printed 3 of 34
2.2 General Management Plan Requirements Condition 3, Schedule 5 of Development Consent (SSD-6764) outlines general management plan requirements that are applicable to the preparation of the GWMP. Table 2 presents these requirements and indicates where they are addressed within this GWMP.
Table 2 General Management Plan Requirements
Development Consent (SSD-6764) Condition GWMP Section
Management Plan Requirements
3. The Applicant must ensure that the management plans required under this consent are prepared in accordance with any relevant guidelines, and include:
(a) detailed baseline data; Section 4
(b) a description of:
the relevant statutory requirements (including any relevant approval, licence or lease conditions);
Section 2
any relevant limits or performance measures/criteria; Section 7
the specific performance indicators that are proposed to be used to judge the performance of, or guide the implementation of, the development or any management measures;
Section 7
(c) a description of the measures that would be implemented to comply with the relevant statutory requirements, limits, or performance measures/criteria;
Section 8
(d) a program to monitor and report on the: Sections 6, 8 and 9
impacts and environmental performance of the development;
effectiveness of any management measures (see c above);
(e) a contingency plan to manage any unpredicted impacts and their consequences;
Section 7
(f) a program to investigate and implement ways to improve the environmental performance of the development over time;
Sections 6.4 and 9
(g) a protocol for managing and reporting any: WMP
incidents
complaints
non-compliances with statutory requirements; and
exceedances of the criteria and/or performance criteria; and
(h) a protocol for periodic review of the plan. WMP
2.3 Specific Guidance from Regulatory Agencies The approved Site Water Management Plan (including the relevant sub-plans) was prepared in consultation with the EPA and DPI Water, as required by Condition 28, Schedule 3 of the previous Project Approval for the Wilpinjong Coal Mine (Project Approval 05-0021). Consultation was also undertaken with a variety of regulators throughout the assessment and approval of the Wilpinjong Extension Project. A number of additional, specific requirements and commitments for this GWMP that arose from this consultation programme were subsequently reflected in Condition 30(d)(iv), Schedule 3 of Development Consent (SSD-6764). Table 3 presents these additional requirements/commitments and indicates where they are addressed in this GWMP.

Wilpinjong Coal – Groundwater Management Plan Document Number: WI-ENV-MNP-0041 Uncontrolled when printed 4 of 34
Table 3 Specific Regulatory Agency Requirements
Regulator Requirement GWMP Section
DPI Water Make good provisions for Wollar State School bore. Sections 7.1.3 and 8.1.4
Metering of water used for pastoral activities on Peabody-owned land.
Section 5.1
IESC A plan for the conduct of additional core testwork as mining advances.
Section 6.2
Solubility studies of arsenic, selenium and molybdenum in waste and reject material.
Section 6.2
Install additional groundwater bores in backfill areas. Section 6.3
Include analyses for molybdenum in the groundwater sampling program.
Section 6.1
Monthly and event based metals monitoring. Section 6.1
Resume monitoring at four piezometers in the vicinity of the existing Tailings Dams (PZ13, PZ20, PZ21 and PZ26). Describe the screened intervals of the relevant piezometers.
Section 6.1

Wilpinjong Coal – Groundwater Management Plan Document Number: WI-ENV-MNP-0041 Uncontrolled when printed 5 of 34
3 Existing Groundwater Conditions The key geological features in the vicinity of the Wilpinjong Coal Mine of relevance to hydrogeological processes are: elevated sandstone plateaus of the Narrabeen Group;
a thin veneer of recent alluvium/colluvium along Wilpinjong Creek and alluvium along Cumbo Creek and Wollar Creek (with alluvial bodies being quite narrow);
unconsolidated deposits in western portions of the Wilpinjong Coal Mine and extending into the Moolarben Coal Complex tenements with coarse-grained lithology up to almost 60 m deep;
overburden, consisting of the Permian Illawarra Coal Measures (including the Moolarben Coal Member, which is a secondary economic coal resource);
the Ulan Coal Seam (the primary economic coal resource);
the Marrangaroo Conglomerate and underlying Nile Sub-Group; and
the Shoalhaven Group and older units acting as the ‘basement’. There is no evidence of major faulting over the Wilpinjong Coal Mine, although faults have been observed and mapped by WCPL. There are minor intrusions, dykes and sills in parts of the Wilpinjong Coal Mine area. Alluvial deposits are associated with Wilpinjong and Cumbo Creeks in the vicinity of the Wilpinjong Coal Mine, along Wollar Creek to the east of Pit 8 (Figure 1) and along Moolarben Creek (to the south-west of the Wilpinjong Coal Mine). Colluvial deposits are also evident along the north of Wilpinjong Creek below the escarpments of the Goulburn River National Park, which adjoins Peabody-owned land north of Wilpinjong Creek. A prior drainage system and/or some other process has resulted in coarse-grained deposits which are located in areas of Pits 5 and 6 and extend to the west in the approved Moolarben Coal Complex tenements. There are two distinct groundwater systems in the Wilpinjong Coal Mine area: Alluvial groundwater system – associated primarily with Wilpinjong Creek and Wollar Creek.
Porous rock groundwater system – primarily the Illawarra Coal Measures. None of the identified groundwater systems are significant aquifers. The most permeable units are the Ulan Coal Seam, alluvium and Marrangaroo Formation (Marrangaroo Conglomerate), while the sandstones of the Narrabeen Group are of lower permeability. The Illawarra Coal Measures also include layers of low permeability mudstones and siltstones.
3.1 Alluvial Aquifers Alluvial deposits are associated with Wilpinjong and Cumbo Creeks in the Wilpinjong Coal Mine area, and Wollar Creek to the east of Pit 8.

Wilpinjong Coal – Groundwater Management Plan Document Number: WI-ENV-MNP-0041 Uncontrolled when printed 6 of 34
Detailed field investigations (Section 4.3) indicate the extent of alluvial deposits are generally much narrower than the previous regional geological mapping, with long thin deposits along Wilpinjong Creek, Cumbo Creek, and in the northern part of Slate Gully. This interpretation is supported by analysis of bore logs from the NSW Pinneena database. The interpreted extent of unconsolidated sediments in the vicinity of the Wilpinjong Coal Mine is shown on Figure 1. DPI Water has identified a portion of the alluvial aquifer associated with Wilpinjong Creek and lower Wollar Creek as ‘highly productive’. It is noted that in the vicinity of the Wilpinjong Coal Mine this ‘highly productive’ aquifer is largely confined to Peabody-owned land. In addition, HydroSimulations (2015) concluded that on the basis of the available data, including NSW Pinneena database records and water quality data, that it is unlikely that the current ‘highly productive’ classification for this area of the alluvial water source is valid. This conclusion was made in the context of recorded lithology and thickness of alluvium; the fact that no bores intersecting the declared ‘highly productive’ alluvium along Wollar Creek or Wilpinjong Creek have a recorded bore yield of greater than 5 litres per second in the Pinneena bore database; and also the distribution of groundwater salinity.
3.2 Unconsolidated Tertiary Deposits Unconsolidated Tertiary deposits (i.e. a prior drainage system) have been interpreted as a Palaeochannel at the Moolarben Coal Complex, with the extent of these features being mapped by RPS Aquaterra (2011) and TEM surveys at Wilpinjong Coal Mine (Groundwater Imaging Pty Ltd, 2014). In addition, these features have been identified in Pit 5 of the Wilpinjong Coal Mine where channel like deposits can be observed in the pit wall. Bore logs support the presence of such a feature, extending between the Moolarben Coal Complex and Wilpinjong Coal Mine, which has been filled with sandy unconsolidated material, with some bores showing greater than 20 m of sands and/or gravel. These sediments are generally not coincident with modern drainage lines and when encountered in Pit 5 at the Wilpinjong Coal Mine have typically been dry.
3.3 Groundwater Recharge Recharge to the groundwater systems occurs from rainfall and runoff infiltration and lateral groundwater flow, especially from the elevated Narrabeen Group to the alluvium of Wilpinjong Creek. Seepage faces would be expected along the cliff faces bordering Wilpinjong Creek after rainfall events, and perched water tables might be sustained at high elevations due to the presence of occasional lower permeability beds between the sandstone layers. Although groundwater levels are sustained by rainfall infiltration, they are controlled by topography, geology and surface water levels in local drainages. Local groundwater tends to mound beneath hills but mounding is expected to be slight to the south of the Wilpinjong Coal Mine, because sub-cropping coal seams are dry there. Wilpinjong Creek and Cumbo Creek are conceptualised by HydroSimulations as gaining systems under natural conditions. During short events of high surface flow, streams would lose water to the host aquifer, but during recession, the aquifer would discharge water slowly back into the stream from bank storage.

Ulan-Wollar Road
Mogo
Road
Cree
kW
olla
r
Munghorn GapNature Reserve
Goulburn RiverNational Park
Wollar Road
Cree
kW
olla
r
Cum
bo
ML 1573
Creek
Wilpinjong
MLA 1
MLA
1
MLA 1
MLA 2
MLA 2
MLA 1
MLA 3
MLA 2
MLA 1
MLA 1
MOOLARBENCOAL COMPLEX
OPEN CUTMINING AREA
Creek
CreekSpring
Planters
WOLLARWollar Road
Uppe
r Cu
mbo
Roa
d
Barig
an
Road
Wilpi
njong
Roa
d
Robin
sons
Road
Ulan-Wollar Road
Alluvium associatedwith Wollar Creek
Thin channel of sand and soil(approximately 2 – 3 metres thick)
Alluvium associatedwith Cumbo Creek
(approved to be divertedwithin the Open Cut)
Alluvium associatedwith Wilpinjong Creek
Goulburn RiverNational Park
Munghorn GapNature Reserve
Creek
Cum
bo
Wilpinjong
Creek
Cree
k
SANDY HOLLOW GULGONG RAILWAY
770000
7700
00
775000
7750
006415000 6415000
6420000 6420000
WIL-12-11_GWMP 2017_202A
Interpreted Extent ofUnconsolidated Sediments
Figure 1
0 2
KilometresMGA 94 ZONE 55
W I L P I N J O N G C O A L M I N E±
Source: WCPL (2017); NSW Dept of Industry (2015);Orthophoto: WCPL (Dec 2015)
LEGENDMining Lease BoundaryMining Lease Application BoundaryApproved/Existing Open Cut and Contained Infrastructure AreaRelocated Block Bank and Cumbo CreekDisturbance AreaEnhancement and Conservation Area
DRAFT
* Unconsolidated sediments located within the open cut andcontained infrastructure area are not shown on this figure.
Interpreted Extent of Unconsolidated Sediments*

Wilpinjong Coal – Groundwater Management Plan Document Number: WI-ENV-MNP-0041 Uncontrolled when printed 8 of 34
Groundwater, under natural conditions, is expected to discharge upwards from the Permian rocks to the alluvium associated with Wilpinjong Creek. Loss by evapotranspiration is likely along the creek corridors where the water table is near the ground surface (generally 2 to 3 m below ground level). In the main open cut areas associated with the Wilpinjong Coal Mine the depth to groundwater can be as shallow as 5 m below ground but is more typically 10 to 50 m below ground. The direction of groundwater flow in the vicinity of the Wilpinjong Coal Mine is generally northward and down dip of the coal seams. A groundwater divide is present around the Moolarben Coal Complex, with flow in that area occurring to the north and north-west as well as to the east. This divide is primarily caused by a reversal of groundwater flow in some areas due to mining at the Ulan Mine Complex.

Wilpinjong Coal – Groundwater Management Plan Document Number: WI-ENV-MNP-0041 Uncontrolled when printed 9 of 34
4 Baseline Data
4.1 Historical Groundwater Investigations In 2001 the Department of Infrastructure, Planning and Natural Resources (DIPNR) (now DPI Water) conducted field surveys and groundwater assessments in the greater Wollar Creek catchment. The field survey components were primarily conducted in 2001 and methodology included field measurements of groundwater levels and salinities in private bores, wells, dams and sections of creeks in the greater Wollar Creek catchment (DIPNR, 2003). A hydrogeological study including a drilling and sampling program was undertaken for the Mine in 2004 (Geoterra, 2004). The groundwater testwork program included two 24 hour pumping tests and falling/rising head tests. A pumping test to determine the potential drawdown effects of developing a production bore was conducted from July to October 2005 (Geoterra, 2005). The pumping test involved the installation of a test production bore (PB1) and associated monitoring piezometers. The test bore was pumped for a period of 42 days and the response/change in the aquifer was observed. Since the Wilpinjong Coal Project EIS, Merrick (2005) assessed alluvial-rock leakance by using the HotSpots analytical model to interpret the data acquired in the 42 day pumping test by Geoterra (2005). Over that limited period of time, no observable response was found in the alluvial aquifer due to pumping from the Ulan Coal Seam.
4.2 Baseline Groundwater Monitoring A groundwater monitoring network has been in place at the Mine since April 2006. The previous version of the Water Management Plan (approved on 20 March 2017) established the baseline data set for the Wilpinjong Coal Mine as comprising data from pre-mining (2004) to the end of 2009 (prior to approval being granted for an increased mining rate in early 2010). The baseline period for this GWMP has been kept consistent with this previously agreed baseline period. The details of monitoring bores in the WCPL baseline monitoring network are summarised in Table 4 and shown on Figure 2. Field pH and EC readings have been taken at the same time as monthly water level readings at GWa1-GWa8 in alluvium and at GWc1 to GWc5 in coal. The existing groundwater level and water quality data recorded during the previous studies/reports (Section 4.1) has been augmented over time. Baseline groundwater quality and level monitoring has been undertaken at the locations summarised in Table 4. Monitoring has also been undertaken at selected landholder bores, wells and waterholes. Baseline groundwater level and quality data is provided in Attachment 1. Typical baseline electrical conductivity (EC) and pH values are provided in Table 5.

Wilpinjong Coal – Groundwater Management Plan Document Number: WI-ENV-MNP-0041 Uncontrolled when printed 10 of 34
Table 4 Baseline Groundwater Monitoring Sites
Monitoring Site Lithology Start Date End Date Frequency Location
GWa1, GWa2, GWa3, GWa4
Alluvium 20 April 2006 - monthly Wilpinjong Creek
GWa7 Alluvium 14 April 2008 - monthly Wilpinjong Creek
GWa5, GWa6 Alluvium 20 April 2006 - monthly Cumbo Creek
GWa8 Alluvium 20 April 2006 - monthly Wollar Creek
GWa10, GWa11, GWa12, GWa14, GWa15
Alluvium May-June 2007 - 15 minutes Wilpinjong Creek
GWc1, GWc2, GWc3 Ulan Coal 20 April 2006 - monthly Wilpinjong Creek
GWc4, GWc5 Ulan Coal 20 April 2006 - monthly Wollar Creek
GWc10, GWc11, GWc12, GWc14, GWc15
Ulan Coal 20 April 2006 - 15 minutes Wilpinjong Creek
DB1, DB21 Ulan Coal 23 May 2006 1 April 2007 monthly Pit 1
DB6, DB71 Ulan Coal 30 July 2006 1 April 2007 monthly Pit 1
DB3, DB4, DB51 Ulan Coal 30 July 2006 1 April 2007 monthly Pit 2 - Pit 4 1 A network of production bores was drilled for dewatering (DB1-DB7) and water supply (WSB1 to WSB15). Five of the DB-series bores were
pumped in May-June 2006 and all were used for water level measurement from July 2006 to April 2007. Of the WSB-series bores, only five were ever pumped (WSB10-WSB15) and then only for a few months (March to June 2007).
Table 5
Typical Baseline EC and pH Values by Aquifer Type
Aquifer Type
EC (µS/cm) pH
Average Maximum Recorded
Minimum Recorded
Maximum Recorded
Alluvium ~2,3501 4,100 6.9 8.4
Mesozoic Laccolith Intrusion ~2,2251 2,550 6.5 6.9
Illawarra Coal Measures ~3,200 6,1761 5.62 8.32
Nile Subgroup / Shoalhaven Group ~5,7001 6,470 7.13 7.13 1 Average calculated using ratio of 0.68 EC/TDS. 2 Range does not include two alkaline sites (EW5049 and EW5052), which were affected by cement seals at the base of the piezometers and
two excessively acidic sites (EW2004 and EW2005). 3 There is only one pH record for the Nile subgroup.
Additional expansions/augmentations to the monitoring network since the baseline data period (end of 2009) are summarised in Section 6.1.

ECA-B
ECA-A
ECA-C
!(
!(")
")
")")")")")")")")")")")")")")")")")")")")")")")")
")")")") ")
")
")
")")
!.!.!. !.!.
!.!. !. !. !.
!.!.
!.
!.
!.
!. !.
#*
#*
#*
!(
!( !(
!( !(!(
!(
!(
!(
!(
!(
!(
!(
!(
!(
!(
!(!(
!( !(
!( !(!(
!(!(
!(
!(
!(
!(
!(
!(
!(!(
!(
!(
!(
!(
!(
!(
!(
!(
!(
!(
!(
!(
!.
!.
!.!. !.
!(
!(
Mogo
Road
Cree
k
Wol
lar
Munghorn GapNature Reserve
Goulburn RiverNational Park
Wollar Road
Cree
kW
olla
r
Cum
bo
ML 1573
Creek
Wilpinjong
Pit 6
Pit 5
Pit 1 Pit 2
Pit 3
Pit 4
Pit 7
Pit 8
MLA 1MLA 1
MLA 1
MLA 2
MLA 2
MLA 1MLA 3
MLA 2
MLA 1
MLA 1
MOOLARBENCOAL COMPLEX
OPEN CUTMINING AREA
Refer Inset
SANDY HOLLOW
GWf1
Slate G
ully Ro
ad
Ulan-Wollar Road
Wollar Road
Uppe
r Cu
mbo
Roa
d
Barig
an
Road
Wilpi
njong
Roa
d
Robin
sons
Road
Ulan-Wollar Road
WOLLAR
GWf2
Goulburn RiverNational Park
Munghorn GapNature Reserve
Creek
Cum
bo
Planters
Wilpinjong
Spring Creek
Creek
Cree
k
Creek
GULGONG RAILWAY
GWa1
GWa2GWa3
GWa4
GWa5
GWa6
GWa7
GWa8
GWa9GWa12
GWa14
GWa15
GWa16
GWa22
GWa32
GWc1GWc2
GWc3
GWc4
GWc5
GWc12GWc14
GWc15
GWc16GWc17
GWc18
GWc19GWc20
GWc21
GWc22
GWc24
GWc25
GWc26
GWc27
GWc28
GWc29
GWc30
GWc31
GWc32
GWc33
GWs10 GWs12GWs14 GWs15
GWc35
PZ29 PZ30
PZ32PZ31-b
PZ31-a
WSB1
WSB2
WSB4 WSB5WSB6
WSB7
WSB8
WSB9
WSB13
CCGSD
WILGSU
WILGSD
770000
7700
00
775000
7750
006415000 6415000
6420000 6420000
WIL-12-11_GWMP 2017_201AFigure 2
0 2
KilometresMGA 94 ZONE 55
±
LEGENDMining Lease BoundaryMining Lease Application BoundaryApproved/Existing Open Cut and Contained Infrastructure AreaRelocated Block Bank and Cumbo CreekDisturbance AreaEnhancement and Conservation AreaDPI Water - Mapped Highly Productive Alluvial AquiferGroundwater Monitoring Sites
Hard Rock Groundwater MonitoringAlluvial Groundwater Monitoring!(
!(
Piezometer
Dewatering Bore
")
Water Supply Bore!.
!.
")")")")")
")")")")
")")
") ")")
") ") ") ") ") ") ") ") ") ")")
")")
")
!. !. !.!. !.
!.!.
!( !(!( !(
!.
DB5DB4
DB3DB2
DB1
Wilpinjong Creek
PZ28
PZ01PZ02
PZ03
PZ04
PZ05PZ06
PZ07
PZ08
PZ18
PZ19
PZ25 PZ
26PZ13PZ14
PZ09
PZ10
PZ11
PZ12
PZ15
PZ16
PZ17
PZ20 PZ21 PZ22 PZ23 PZ24
PZ27
DB6
DB7
GWa10GWa11
GWc10 GWc11
GWs11
Source: WCPL (2017); DPI Water (2015); NSW Dept of Industry (2015)Orthophoto: WCPL (Dec 2015)
Dewatering Bore - Never used,now a Monitoring BoreWater Supply Bore - Never used!.
!.
#* Surface Water Gauging StationSurface Water Monitoring Sites
INSET
0 110 m
Spoil Monitoring!(
Groundwater Monitoring NetworkW I L P I N J O N G C O A L M I N E
DRAFT

Wilpinjong Coal – Groundwater Management Plan Document Number: WI-ENV-MNP-0041 Uncontrolled when printed 12 of 34
4.3 Wilpinjong Creek Alluvial Investigations A number of investigations into the nature and extent of the alluvium associated with Wilpinjong Creek has been undertaken at the Wilpinjong Coal Mine. These investigations include: A transient electromagnetic (TEM) survey in 2011 by (Groundwater Imaging, 2011).
An investigative drilling program in 2013 (Groundwater Exploration Services Pty Ltd, 2013).
A supplementary TEM survey in 2014 (Groundwater Imaging, 2014). These investigations suggest that the actual alluvial deposits are generally much narrower than the regional mapping, with long thin deposits along Wilpinjong Creek, Cumbo Creek, and in the northern part of Slate Gully.
4.4 Cumbo Creek Geotechnical Site Assessment In April 2014, 80 boreholes were excavated along a section of Cumbo Creek as part of a geotechnical site assessment for the proposed Cumbo Creek relocation (Barnson, 2014). The boreholes were excavated to a depth of 3 m in nine transects across the creek. Bulk samples were taken from the boreholes at various depths for laboratory testing (i.e. Atterberg Limit [Plasticity Index] testing). Topsoil of approximately 0.1-0.5 m depth was encountered at most boreholes. The topsoil was classified as sandy silts and silty sands of firm to stiff consistency. Alluvial soils were encountered at all 80 boreholes. The depth of alluvial soils ranged from beneath the topsoil to maximum depths of 3m at all boreholes. The alluvial profiles comprised of silts, sands and clays with varying amounts of gravel. There are areas of possible weathered sandstone of low strength at some borehole locations and refusal was encountered at these locations. Coal was encountered in four of the boreholes; BH4 at 2.6m, BH6 at 2.7m, BH79 at 1.6m and BH80 at 2.3m.The coal was noted to be of low strength. Refusal was not encountered within any of these layers. Groundwater was encountered in five boreholes; BH23 at 2.6m, BH39 at 2.6m, BH40 at 2.6m, BH41 at 2.6m and BH50 at 2.6m.
4.5 Private Groundwater Bores In consultation with landowners, a bore census (WCPL, 2005a) was conducted by WCPL in February 2005 to collect additional data on local registered and known bores/wells, known springs and spring-fed dams. The information collected was used to supplement the data from the above studies, all of which was collated for the groundwater assessment included in the Wilpinjong Coal Project EIS (WCPL, 2005b).

Wilpinjong Coal – Groundwater Management Plan Document Number: WI-ENV-MNP-0041 Uncontrolled when printed 13 of 34
Since that time, Peabody has acquired most of the land in the vicinity of the Wilpinjong Coal Mine. Accordingly, WCPL undertook a contemporary investigation of private groundwater bore locations and use in 2015 to support the Wilpinjong Extension Project Groundwater Assessment (HydroSimulations, 2015). This investigation found that bores on private or public land in the vicinity of the Wilpinjong Coal Mine are limited to: one bore at Wollar Public School that is used for watering recreational areas and gardens; and
one privately-owned bore (GW063717) to the south west of the Wilpinjong Coal Mine for stock and domestic use. This land has subsequently been purchased by MCO.
The Wollar Public School bore is screened in the Shoalhaven Group, which is relatively low-yielding. The bore is 60 m deep, with approximately 40 to 50 m of available drawdown. The maximum predicted drawdown is 6 m, meaning that the bore is unlikely to go dry as a result of the Wilpinjong Coal Mine (HydroSimulations, 2015).

Wilpinjong Coal – Groundwater Management Plan Document Number: WI-ENV-MNP-0041 Uncontrolled when printed 14 of 34
5 Groundwater Predictions Contemporary groundwater modelling of the effects of the Wilpinjong Coal Mine was undertaken for the Wilpinjong Extension Project Groundwater Assessment (HydroSimulations, 2015). The key outcomes of this groundwater modelling are provided in the following sub-sections.
5.1 Mine Inflows and Groundwater Licensing The average predicted pit inflows (combined) over the life of the Wilpinjong Coal Mine are predicted to generally range from approximately 0.7 ML/day to 4.5 ML/day and average approximately 1.9 ML/day (712 ML/year), with the majority derived from the porous rock groundwater system. The predicted annual groundwater volumes required to be licensed over the life of the Wilpinjong Coal Mine and post-mining are summarised in Table 6.
Table 6 Estimated Groundwater Licensing Requirements
Groundwater Source
Existing Peabody /WCPL Licences
(units)
Total Licensing Requirement (units)
During Mining Post-Mining (2033-2045)
Post-Mining (2045-2100)
Wollar Creek Alluvium1 474 171 143 147
Goulburn River Alluvium2 511 <10* <10* <10*
Porous Hard Rock3 2,021 1,099 Nil Nil
Source: After HydroSimulations (2015). 1 Wollar Creek Water Source under the Water Sharing Plan Sharing Plan for the Hunter Unregulated and Alluvial Sources, 2009. 2 Goulburn River Water Source under the Water Sharing Plan Sharing Plan for the Hunter Unregulated and Alluvial Sources, 2009. 3 Sydney Basin – North Coast Water Source under the Water Sharing Plan for the North Coast Fractured and Porous Rock Groundwater
Sources 2016. * Groundwater modelling results indicate that the take from the Goulburn River alluvium will be small, with a maximum take of some 10 ML/a.
Given the groundwater model overestimates drawdown in the Ulan Seam north of the mine, it is considered that the take in practice would be much less than the modelled maximum take of 10 ML/a, probably less than 1-2 ML/a, which for licensing purposes is considered to be negligible (HydroSimulations, 2016). Notwithstanding, DPI Water has requested that the full 10 ML/a amount is licensed.
WCPL will meter water used under WCPL water access licences for pastoral practices so that the combined water take from mining and pastoral activities remains below the licensed volume.
5.2 Porous Rock Groundwater System As mining operations progress, each open cut acts as a localised groundwater sink. This will cause a change in groundwater flow direction and, in some places, a localised reversal of flow direction. There will also be a change in hydraulic properties where the waste rock is subsequently used to backfill the mine voids. As waste rock will have a higher permeability than natural rock material (associated with the porous rock groundwater system), there will be associated reductions in localised hydraulic gradients. Numerical modelling predicts a substantial reduction in potentiometric head in the deeper porous rock groundwater system (Illawarra Coal Measures) in the near vicinity of the Wilpinjong Coal Mine as a result of cumulative mining activities.

Wilpinjong Coal – Groundwater Management Plan Document Number: WI-ENV-MNP-0041 Uncontrolled when printed 15 of 34
Recovery of the groundwater water table and pressures within the porous rock groundwater system is predicted to occur over many decades following the cessation of mining. The Pit 2 and Pit 6 final void lakes will remain as permanent and localised groundwater sinks. At equilibrium, natural groundwater flow direction is expected to be restored to a dominant northerly direction through the mine footprint toward Wilpinjong Creek, with the exception of around the Pit 2 and Pit 6 final voids. There will be no discernible deterioration in groundwater quality in the porous rock groundwater system as a result of mining, including in the long term.
5.3 Alluvial Groundwater System The numerical modelling conducted for the Wilpinjong Coal Mine predicts minimal drawdown (approximately 1 m) in the aquifers of the shallow alluvial groundwater system along Wilpinjong Creek. Drawdowns are predicted to be even less pronounced in the more distant alluvial aquifers associated with Wollar Creek. There will be no discernible deterioration in groundwater quality in the alluvial groundwater system as a result of mining, including in the long term.
5.4 Groundwater Users No groundwater drawdown exceeding the NSW Aquifer Interference Policy (NSW Government, 2012) minimal harm criterion of 2 m at a sub-surface water supply construction such as a bore or well is predicted to occur on any privately owned land. Drawdown exceeding the NSW Aquifer Interference Policy (NSW Government, 2012) minimal harm criterion of 2 m is however predicted at one bore in the porous rock aquifer located on Crown land at the Wollar Public School. The Wollar Public School bore is screened in the Shoalhaven Group, which is relatively low-yielding. The bore is 60 m deep, with approximately 40 to 50 m of available drawdown. The maximum predicted drawdown is 6 m, meaning that the bore is unlikely to go dry as a result of the Wilpinjong Coal Mine. Consistent with the requirements of the NSW Aquifer Interference Policy (NSW Government, 2012), WCPL will continue to implement appropriate contingency measures for Wilpinjong Coal Mine related drawdown greater than 2 m at any relevant private bore or the Wollar Public School bore. Appropriate contingency measures for an impact on a groundwater supply user may include: deepening the affected groundwater supply;
construction of a new groundwater supply; or
provision of a new alternative water supply. WCPL met with the Wollar Public School in April 2016 to discuss the groundwater drawdown predictions at the school bore and the future availability of make good provisions, should these be required.

Wilpinjong Coal – Groundwater Management Plan Document Number: WI-ENV-MNP-0041 Uncontrolled when printed 16 of 34
6 Groundwater Monitoring Program
6.1 Groundwater Levels and Quality The historical and baseline groundwater monitoring networks (Sections 4.1 and 4.2) have been progressively updated to include additional monitoring bores as mining progresses (Figure 2). Key updates to the groundwater monitoring program include: 28 monitoring bores (PZ01 to PZ28) were installed adjacent to Pit 1 and Pit 2 to monitor tailings
dam seepage from tailings dams TD1, TD2 and TD3.
Four monitoring bores (PZ29 to PZ32) were installed adjacent to Pits 3 and 4 in 2012.
WCPL converted 20 exploration boreholes into monitoring bores 2013 – 2014 (GWc16 to GWc35).
WCPL also developed some alluvial holes specifically for groundwater monitoring in 2013 – 2014 (GWa162, GWa22 and GWa33).
Two bores were installed into backfilled material in Pits 1 and 5 in 2014 (GWf1 and GWf2). The first 14 tailings dam piezometers (PZ01 to PZ14) were monitored for water level, pH and electrical conductivity (EC) from April 2008 to December 2011. The second group (PZ15 to PZ28) were monitored for water level, pH and EC from November 2009 to December 2011. Additional bores (PZ29 to PZ32) were installed in 2012 adjacent to Cumbo Creek. Tailings dams TD1 to TD5 have been decommissioned and are being progressively capped and rehabilitated. As a result, WCPL discontinued monitoring at these locations. Following installation of belt press filters, TD6 is only used as an emergency storage. However, as recommended by the IESC, WCPL will resume monitoring at four piezometers in the vicinity of the tailings dams (PZ13, PZ20, PZ21 and PZ26). The exploration bores being converted to groundwater monitoring bores, or developed specifically for groundwater monitoring in 2013 – 2014 have been installed with real time dataloggers and subject to hydraulic testing and water quality and level monitoring (Groundwater Exploration Services Pty Ltd, 2013). A summary of the complete Wilpinjong Coal Mine groundwater monitoring network is provided in Table 7, including the frequency at which groundwater levels are monitored. A summary of historical water quality monitoring and planned ongoing water quality monitoring is provided in Table 8. The planned ongoing water quality monitoring has considered the following recommendations from IESC: Include analyses for molybdenum in the groundwater sampling program.
Monthly and event based metals monitoring. The incorporation of monthly metals monitoring will assist with identifying seepage from nearby backfilled open cut pits and decommissioned tailings dams.
2 GWa16 is being re-drilled in 2017 due to operational reasons.

Wilpinjong Coal – Groundwater Management Plan Document Number: WI-ENV-MNP-0041 Uncontrolled when printed 17 of 34
Table 7 Groundwater Monitoring Network
Monitoring Site Geology Start Date End Date Frequency
(levels) Location
GWa1, GWa2, GWa3, GWa4
Alluvium 20 April 2006 - 12 hours Wilpinjong Creek
GWa7 Alluvium 14 April 2008 - monthly Wilpinjong Creek
GWa5, GWa6 Alluvium 20 April 2006 - monthly Cumbo Creek
GWa8 Alluvium 20 April 2006 - monthly Wollar Creek
GWa10, GWa11, GWa12, GWa14,
GWa15
Alluvium May-June 2007
- 15 minute Wilpinjong Creek
GWc1, GWc2, GWc3
Ulan Coal 20 April 2006 - monthly Wilpinjong Creek
GWc4, GWc5 Ulan Coal 20 April 2006 - monthly Wollar Creek
GWc10, GWc11, GWc12, GWc14,
GWc15
Ulan Coal 20 April 2006 - 15 minute Wilpinjong Creek
DB1, DB2 Ulan Coal 23 May 2006 1 April 2007 monthly Pit 1
DB6, DB7 Ulan Coal 30 July 2006 1 April 2007 monthly Pit 1
DB3, DB4, DB5 Ulan Coal 30 July 2006 1 April 2007 monthly Pit 2 - Pit 4
PZ01 – PZ14 Coal Measures 28 April 2008 30 Dec 2011 monthly Pit 1
PZ15 – PZ28 Coal Measures 12 Nov 2009 30 Dec 2011 monthly Pit 1 - Pit 2
PZ29 – PZ32 Coal Measures 19 Nov 2012 - - adjacent Pits 3 and 4
GWa16 Alluvium Nov-Dec 2013 - 12-hourly Wilpinjong Creek
GWc16 Ulan Coal Nov-Dec 2013 - daily Wilpinjong Creek
GWc17, GWc18 Ulan Coal Nov-Dec 2013 - daily Pit 6
GWc22 Ulan Coal Nov-Dec 2013 - daily Pit 4
GWa22 Alluvium Nov-Dec 2013 - 12-hourly Cumbo Creek/Pit 4
GWc23 Marrangaroo Formation Nov-Dec 2013 - 12-hourly Pit 7
GWc24 Ulan Coal Nov-Dec 2013 - daily Pit 7
GWc25 Ulan Coal Nov-Dec 2013 - daily Pit 5
GWc26 Permian overburden Nov-Dec 2013 - daily Wilpinjong Creek North of Pit 6
GWc27 Permian overburden Nov-Dec 2013 - daily South of Pit 2
GWc28, GWc29 Ulan Coal Nov-Dec 2013 - daily Pit 8 - north
GWc30, GWc31 Ulan Coal Nov-Dec 2013 - daily Pit 8 - south
GWa32, GWa34 Alluvium Nov-Dec 2013 - 12-hourly Wollar Creek
GWc32 Moolarben Coal Nov-Dec 2013 - daily Wollar Creek
GWc34 Shoalhaven Group Nov-Dec 2013 - daily Wollar Creek - south
GWf1 Spoil (final landform) 2014 - daily (logger) Pit 1
GWf2 2014 - monthly Pit 5

Wilpinjong Coal – Groundwater Management Plan Document Number: WI-ENV-MNP-0041 Uncontrolled when printed 18 of 34
Table 8 Groundwater Quality Monitoring
Monitoring Locations Historical Monitoring Planned Monitoring
Frequency Parameters Frequency Parameters
Water Supply Bores
GWs10, GwS11, GWs12, GWs14, GWs15
Monthly (During Extraction)
Water level, field pH and EC.
Volume of water extracted.
Monthly (During Extraction)
Water level, field pH and EC.
Volume of water extracted.
Alluvial Bores GWa1, GWa2, GWa3, GWa4, GWa5, GWa6, GWa7, GWa8, GWa10, GWa11, GWa12, GWa14, GWa15, GWa16, GWa22, GWa32, GWa33
Monthly Water level, temperature field pH and EC.
Monthly Water level, temperature field pH and EC.
TDS, Na, K, Mg, Ca, Cl, HCO3, CaCO3, SO4 and Metals (Copper, Zinc, Iron, Aluminium, Nickel, Manganese, Barium, Strontium, Lead, Arsenic, Selenium and Molybdenum.
Quarterly TDS, Na, K, Mg, Ca, Cl, HCO3, CaCO3, SO4 and Metals (Copper, Zinc, Iron, Aluminium, Nickel, Manganese, Barium, Strontium, Lead, Arsenic and Selenium).
Coal Measures Bores
GWc1, GWc2, GWc3, GWc4, GWc5, GWc10, GWc11, GWc12, GWc14, GWc15, GWc16, GWc17, GWc18, GWc19, GWc20, GWc22, GWc23, GWc24, GWc25, GWc26, GWc27, GWc28, GWc29, GWc30, GWc31, GWc33, GWc32,GWc345, GWc35
Monthly Water level, temperature, field pH and EC.
Monthly Water level, temperature field pH and EC.
TDS, Na, K, Mg, Ca, Cl, HCO3, CaCO3, SO4 and Metals (Copper, Zinc, Iron, Aluminium, Nickel, Manganese, Barium, Strontium, Lead, Arsenic, Selenium and Molybdenum.
Quarterly TDS, Na, K, Mg, Ca, Cl, HCO3, CaCO3, SO4 and Metals (Copper, Zinc, Iron, Aluminium, Nickel, Manganese, Barium, Strontium, Lead, Arsenic and Selenium).
Tailings Dam Bores
PZ13, PZ20, PZ21 and PZ26
Nov 2009 to Dec 2011.
Discontinued after 2011.
Water level, pH and EC.
Monthly Water level, temperature field pH and EC.
TDS, Na, K, Mg, Ca, Cl, HCO3, CaCO3, SO4 and Metals (Copper, Zinc, Iron, Aluminium, Nickel, Manganese, Barium, Strontium, Lead, Arsenic, Selenium and Molybdenum.
Landholder bores, wells and waterholes As required To be determined As required To be determined

Wilpinjong Coal – Groundwater Management Plan Document Number: WI-ENV-MNP-0041 Uncontrolled when printed 19 of 34
6.2 Groundwater Testwork Consistent with the IESC’s recommendation, WCPL would opportunistically undertake core sampling and testing during exploration drilling within or near the Wilpinjong Coal Mine. Where practicable, aquifer properties such as effective porosity, horizontal permeability and vertical permeability would be determined. Core samples would be obtained and tested from a minimum of two boreholes annually until the end of 2020. The outcomes of testwork would be incorporated into progressive groundwater model reviews that would be undertaken every three years (Section 6.4). WCPL would create and maintain a database of testing data, which would be used to constrain and validate model parameters and guide any future groundwater assessments. Consistent with the IESC’s recommendation, core testing would also include solubility studies of waste and reject material for key metals identified in past geochemistry assessments at the Wilpinjong Coal Mine (i.e. arsenic, selenium and molybdenum).
6.3 Final Landform Monitoring WCPL has installed two bores in backfilled open cuts in 2014 (GWf1 in Pit 1 and GWf2 in Pit 5). These bores will continued to be monitored in order to provide data for future groundwater modelling (e.g. recharge rates through spoil, spoil permeabilities, and to validate modelling assumptions and predictions. WCPL will also install and monitor an additional bore in the Pit 8 final landform (assuming GWc31 is removed by mining as planned).
6.4 Groundwater Modelling Review The numerical model developed and used for the Wilpinjong Extension Project Groundwater Assessment (HydroSimulations, 2015) would be used as a management tool for the periodic review and calibration of predicted groundwater impacts through the life of the Wilpinjong Coal Mine. Consistent with Dr Frans Kalf’s recommendation in his Peer Review of the Wilpinjong Extension Project Groundwater Assessment, this review would be undertaken at least every five years after commencement of the Wilpinjong Extension Project, over the life of the Wilpinjong Coal Mine. WCPL will undertake numerical groundwater model reviews every three years and will include any available data obtained from testwork undertaken in accordance with Section 6.2. The results of the groundwater monitoring program would inform progressive refinement of the numerical model as each of the open cut mining areas is developed. Revised outputs from the numerical model would be reported in the Annual Review, as relevant over the life of the Wilpinjong Coal Mine and used to inform regular site water balance reviews (refer to Site Water Balance for additional information).
6.5 Groundwater Dependent Ecosystems There are no ‘high priority groundwater dependent ecosystems identified in the relevant water sharing plans in the vicinity of the Wilpinjong Coal Mine.
Wilpinjong Coal – Groundwater Management Plan Document Number: WI-ENV-MNP-0041 Uncontrolled when printed 20 of 34
There is potential for groundwater dependent ecosystems to occur on the plateaus in the vicinity of the Wilpinjong Coal Mine. However, any groundwater dependent ecosystems on these plateaus would be accessing perched groundwater systems associated with the Narrabeen Group and would not be affected by mining in the deeper strata (HydroSimulations, 2015). Wilpinjong Creek is considered to be a groundwater dependent ecosystem (i.e. the stream and associated riparian vegetation). Groundwater interaction between Wilpinjong Creek and the underlying alluvium varies with time. Wilpinjong Creek is generally a gaining stream, however, there have been occasions when in some sections there has been a brief reversal of gradient between the stream water level and the water table level (WRM Water and Environment, 2015). The alluvial groundwater monitoring described in Section 6.1 would assist with monitoring for potential mine-related effects on the stream. Annual stream health monitoring (described in the SWMP) would monitor for effects on the riparian vegetation in Wilpinjong Creek.

Wilpinjong Coal – Groundwater Management Plan Document Number: WI-ENV-MNP-0041 Uncontrolled when printed 21 of 34
7 Trigger levels
7.1 Groundwater Levels
7.1.1 Mining Effect Numerical modelling predicts a substantial reduction in potentiometric head in the deeper porous rock groundwater system (Illawarra Coal Measures) in the near vicinity of the Wilpinjong Coal Mine as a result of cumulative mining activities (Section 5.2). Accordingly, trigger levels for water levels in the coal measures are not considered to be warranted. The numerical modelling conducted for the Wilpinjong Coal Mine predicts minimal drawdown (approximately 1 m) in the aquifers of the shallow alluvial groundwater system along Wilpinjong Creek. Drawdowns are predicted to be even less pronounced in the more distant alluvial aquifers associated with Wollar Creek. Trigger levels are required for alluvial monitoring bores to monitor for potentially adverse groundwater impacts and effects beyond those predicted in the groundwater modelling. Accordingly, trigger levels are proposed to be established for alluvial monitoring bores at 1 m below the previous minimum recorded water level in the bore. The alluvial deposits along Wilpinjong Creek are very thin in places (Section 4.3). Therefore, some of the alluvial bores are not deep enough to be used for trigger levels. The relevant details and proposed trigger levels for the alluvial monitoring bores are presented in Table 9. Three successive monthly exceedances (or two successive quarterly exceedances) of the lower thresholds will trigger an investigation.
Table 9 Alluvial Monitoring Bore Details and Water Level Triggers
Monitoring Site Depth (mbgl)
Screened Interval (mbgl)
Deepest Observed SWL in Baseline Period
Trigger Level
mbgl mAHD mbgl mAHD
GWa1 5.0 1.5 – 5.0 DRY DRY N/A N/A
GWa2 9.0 3.0 – 8.5 2.8 373.4 3.8 372.4
GWa3 4.5 2.0 – 4.5 3.9 360.5 DRY* DRY*
GWa4 4.5 2.6 – 4.1 3.3 353.8 DRY* DRY*
GWa5 4.3 2.4 – 3.9 1.6 372.8 2.6 371.4
GWa7 4.6 2.7 – 4.2 DRY DRY N/A N/A
GWa8 3.6 2.1 – 3.6 2.8 353.3 DRY* DRY*
GWa10 5.3 3.4 – 4.9 3.5 367.1 4.5 366.1
GWa11 3.9 2.0 – 3.5 3.5 365.2 DRY* DRY*
GWa12 4.7 2.8 – 4.3 3.3 362.3 4.3 361.3
GWa14 4.1 2.2 – 3.7 3.3 358.0 DRY* DRY*
GWa15 3.5 1.6 – 3.1 2.9 355.0 DRY* DRY* * Historical observations at these groundwater bores have indicated SWLs that represent less than 1 m of head in the bore.
Therefore, these bores could go dry without indicating a mining effect that exceeds the predicted 1 m drawdown. For these bores, a statistical analysis will be performed on the number of dry days to determine whether there are significantly more than could be expected under natural conditions.

Wilpinjong Coal – Groundwater Management Plan Document Number: WI-ENV-MNP-0041 Uncontrolled when printed 22 of 34
7.1.2 Water Supply Borefield Effect WCPL commissioned AGE to investigate and determine reporting and cease-to-pump triggers for licensed production bores WSB10, WSB11, WSB12, WSB14 and WSB15 (Section 4.2.2.2) (AGE, 2005). Triggers have been determined based on the expected maximum drawdown, as a result of the development of the open cut and water supply borefield. Importantly, WCPL has not pumped water from the production bores since June 2007 (WCPL has used the water stored in mine water storages and open cut pits for operational water requirements). Notwithstanding, cease to pump levels for the water supply bores are presented in Table 10.
Table 10 Water Supply Borefield – Cease to Pump Trigger Levels
Production Bore Groundwater Bore Cease-to-Pump Trigger
Level (m AHD) Expected Maximum
Drawdown Level (m AHD)
WSB10 GWs10 346 341
WSB11 GWs11 348.5 344
WSB12 GWs12 332.5 327
WSB14 GWs14 319.5 311
WSB15 GWs15 314.5 305
In addition, WCPL has installed a monitoring bore in the alluvium at a site located between the bores authorised by WCPL’s water supply licences and Wilpinjong Creek (GWa16)3. The water level in GWa16 will be recorded at daily intervals during pumping from the water supply borefield.
7.1.3 Private Landholders and Wollar Public School Bores on private or public land in the vicinity of the Wilpinjong Coal Mine are limited to (Section 4.5): one bore at Wollar Public School that is used for watering recreational areas and gardens; and
one formerly privately-owned bore (GW063717) to the south west of the Wilpinjong Coal Mine for stock and domestic use. This land has subsequently been purchased by MCO.
Drawdown exceeding the NSW Aquifer Interference Policy (NSW Government, 2012) minimal harm criterion of 2 m is predicted at one bore in the porous rock aquifer located on Crown land at the Wollar Public School (HydroSimulations, 2015). The Wollar Public School bore is screened in the Shoalhaven Group, which is relatively low-yielding. The bore is 60 m deep, with approximately 40 to 50 m of available drawdown and will be monitored by WCPL on a quarterly basis. The maximum predicted drawdown is 6 m, meaning that the bore is unlikely to go dry as a result of the Wilpinjong Coal Mine (HydroSimulations, 2015).
3 GWa16 is being re-drilled in 2017 due to operational reasons.

Wilpinjong Coal – Groundwater Management Plan Document Number: WI-ENV-MNP-0041 Uncontrolled when printed 23 of 34
Should WCPL receive notice from the Wollar Public School that they have observed a decrease in water level and/or reduction in yield from the bore, WCPL would initiate an investigation to determine whether the Wilpinjong Coal Mine has resulted in greater than 2 m drawdown at the bore. If the investigation indicates that a greater than 2 m drawdown effect has occurred as a result of the Wilpinjong Coal Mine, WCPL would implement the contingency measures described in Section 8.1.4.
7.2 Groundwater Quality The baseline monitoring results indicate that despite fluctuations in some water quality parameters, groundwater quality has remained relatively consistent at each coal monitoring location throughout the period of monitoring. However, some alluvial monitoring bores have recorded very high salinities and very large fluctuations in salinity. The groundwater monitoring program has indicated that baseline concentrations of EC in the aquifers are always outside of the ANZECC and ARMCANZ (2000) default trigger values, while pH deviations from the default range are uncommon. Water quality records have been examined for baseline data collected from 2004 to 2009 (i.e. the established baseline data period) and grouped according to lithology. The means, standard deviations, 80th percentiles and maxima are presented in Table 11 for EC and Table 12 for pH.
Table 11 Baseline Water Quality EC Statistics per Lithology
Aquifer Type
EC (µS/cm)
Mean Standard Deviation
80th percentile Maximum
Alluvium 4,610 3,830 8,800 15,340
Coal 2,740 1,250 3,600 7,500
Coal Measures 3,340 1,560 5,240 2,380
Table 12
Baseline Water Quality pH Statistics per Lithology
Aquifer Type
pH
Mean Standard Deviation
80th percentile Maximum
Alluvium 7.0 0.4 7.3 8.4
Coal 7.1 0.5 7.3 11.9
Coal Measures 6.5 1.5 7.1 11.3
For trigger purposes, the water quality statistics for April 2006 to December 2009 have been analysed for EC and pH at the alluvium and coal monitoring sites. The means, standard deviations, 80th percentiles and maxima are presented in Table 13 for EC. Although ANZECC and ARMCANZ (2000) recommend using the 80th percentile values as being suitable for trigger values, a trigger would be initiated 20 percent of the time due to natural causes.

Wilpinjong Coal – Groundwater Management Plan Document Number: WI-ENV-MNP-0041 Uncontrolled when printed 24 of 34
For the trigger to be a meaningful indicator of a possible mining effect, an investigation should not be triggered unless the 80th percentile value is exceeded on either of: Three consecutive monthly monitoring events; or
Two consecutive quarterly monitoring events.
Table 13 Baseline Water Quality EC Statistics per Bore
Monitoring Site Aquifer Type
EC (µS/cm)
Mean Standard Deviation
80th percentile
Criteria
Maximum
GWa1 Alluvium 8,409 3,721 12,272 12,730
GWa2 Alluvium 1,816 602 2,280 3,300
GWa3 Alluvium 1,577 398 1,970 2,050
GWa4 Alluvium 2,409 340 2,596 3,100
GWa5 Alluvium 10,634 3,204 13,926 15,340
GWa6 Alluvium 5,592 1,604 6,720 10,140
GWa7 Alluvium 9,130 2,575 10,126 10,490
GWa8 Alluvium 2,342 580 2,898 3,700
GWc1 Coal 2,341 476 2,844 3,260
GWc2 Coal 1,134 159 1,290 1,400
GWc3 Coal 3,144 248 3,304 3,800
GWc4 Coal 2,314 213 2,412 2,800
GWc5 Coal 4,665 574 4,798 6,030
The minima, 20th percentiles, 80th percentiles and maxima are presented in Table 14 for pH. In accordance with the previous version of the Water Management Plan (approved in October 2016), the ANZECC and ARMCANZ (2000) default trigger values (6.5 - 8.0) will be used at all sites rather than using slightly different values at individual bores, as the default range captures all 20th and 80th percentile values.

Wilpinjong Coal – Groundwater Management Plan Document Number: WI-ENV-MNP-0041 Uncontrolled when printed 25 of 34
Table 14 Baseline Water Quality pH Statistics per Bore
Monitoring Site Aquifer Type pH
Minimum 20th percentile 80th percentile Maximum
GWa1 Alluvium 6.8 6.9 7.2 7.6
GWa2 Alluvium 6.0 6.6 7.0 7.8
GWa3 Alluvium 6.3 6.6 7.3 7.8
GWa4 Alluvium 6.1 6.8 7.1 7.4
GWa5 Alluvium 6.4 6.7 7.1 7.9
GWa6 Alluvium 7.1 7.3 7.6 7.8
GWa7 Alluvium 6.6 6.7 7.0 7.7
GWa8 Alluvium 6.6 7.0 7.4 7.7
GWc1 Coal 6.2 6.8 7.2 7.7
GWc2 Coal 6.8 7.1 7.7 8.0
GWc3 Coal 6.4 6.6 7.3 7.8
GWc4 Coal 6.5 6.7 7.1 8.0
GWc5 Coal 6.5 6.8 7.0 7.9

Wilpinjong Coal – Groundwater Management Plan Document Number: WI-ENV-MNP-0041 Uncontrolled when printed 26 of 34
8 Groundwater Response Plan This section outlines WCPL’s Trigger Action Response Plans (TARPs) in the event that trigger conditions established in Section 7 are exceeded. Where applicable, these response protocols remain consistent with the approved protocols previously agreed with DP&E and the relevant consultees in the previous version of the Water Management Plan (approved in October 2016). 8.1 Groundwater Levels 8.1.1 Mining Effect Trigger levels for alluvial monitoring bores have been set based on the predicted impacts of the Wilpinjong Coal Mine (incorporating the Wilpinjong Extension Project) (Section 7.1.1). Three successive monthly exceedances (or two successive quarterly exceedances) of the lower thresholds will trigger an investigation. In the event that one of the trigger levels is exceeded, the response protocol in Table 15 would be implemented.
Table 15 Groundwater Levels – Mining Effect TARPs
TARP
Trigger Three consecutive water monitoring results cause trigger to be exceeded (Section 6.1). Action 1. Notify the WCPL ECM.
2. Check and validate the data which indicates an exceedance of the trigger conditions. 3. Notify DP&E, EPA, DPI Water and other relevant agencies as soon as practicable that an
exceedance of the trigger level has occurred and investigation will be undertaken. 4. Check and validate the data which indicates an exceedance of the trigger conditions. 5. Identify plausible and possible causative mechanisms and assess/quantify these against
all relevant data and information to identify most likely causes. 6. Conduct a preliminary investigation with a review of the monitoring results in conjunction
with site activities being undertaken at the time, baseline groundwater monitoring results, groundwater results at nearby locations, the prevailing and preceding meteorological and streamflow conditions and changes to the landuse/activities being undertaken in the contributing hydrogeological regime, including mining activities.
7. Review groundwater modelling (Section 6.4). 8. Provide a preliminary investigation report to DP&E, EPA DPI Water and relevant agencies
within 7 days of identifying the non-compliance.
Wilpinjong Coal – Groundwater Management Plan Document Number: WI-ENV-MNP-0041 Uncontrolled when printed 27 of 34
Table 15 (continued) Groundwater Levels – Mining Effect TARP
TARP
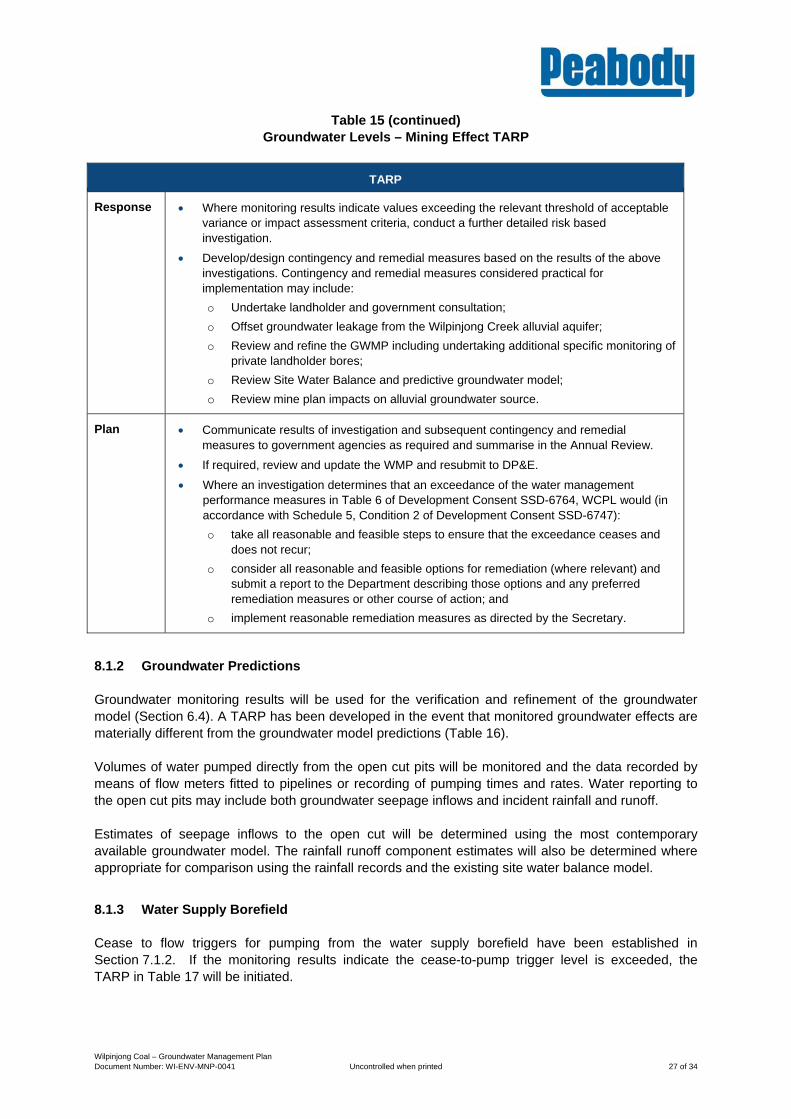
Response Where monitoring results indicate values exceeding the relevant threshold of acceptable variance or impact assessment criteria, conduct a further detailed risk based investigation.
Develop/design contingency and remedial measures based on the results of the above investigations. Contingency and remedial measures considered practical for implementation may include:
o Undertake landholder and government consultation;
o Offset groundwater leakage from the Wilpinjong Creek alluvial aquifer;
o Review and refine the GWMP including undertaking additional specific monitoring of private landholder bores;
o Review Site Water Balance and predictive groundwater model;
o Review mine plan impacts on alluvial groundwater source.
Plan Communicate results of investigation and subsequent contingency and remedial measures to government agencies as required and summarise in the Annual Review.
If required, review and update the WMP and resubmit to DP&E.
Where an investigation determines that an exceedance of the water management performance measures in Table 6 of Development Consent SSD-6764, WCPL would (in accordance with Schedule 5, Condition 2 of Development Consent SSD-6747):
o take all reasonable and feasible steps to ensure that the exceedance ceases and does not recur;
o consider all reasonable and feasible options for remediation (where relevant) and submit a report to the Department describing those options and any preferred remediation measures or other course of action; and
o implement reasonable remediation measures as directed by the Secretary.
8.1.2 Groundwater Predictions Groundwater monitoring results will be used for the verification and refinement of the groundwater model (Section 6.4). A TARP has been developed in the event that monitored groundwater effects are materially different from the groundwater model predictions (Table 16). Volumes of water pumped directly from the open cut pits will be monitored and the data recorded by means of flow meters fitted to pipelines or recording of pumping times and rates. Water reporting to the open cut pits may include both groundwater seepage inflows and incident rainfall and runoff. Estimates of seepage inflows to the open cut will be determined using the most contemporary available groundwater model. The rainfall runoff component estimates will also be determined where appropriate for comparison using the rainfall records and the existing site water balance model.
8.1.3 Water Supply Borefield Cease to flow triggers for pumping from the water supply borefield have been established in Section 7.1.2. If the monitoring results indicate the cease-to-pump trigger level is exceeded, the TARP in Table 17 will be initiated.
Wilpinjong Coal – Groundwater Management Plan Document Number: WI-ENV-MNP-0041 Uncontrolled when printed 28 of 34
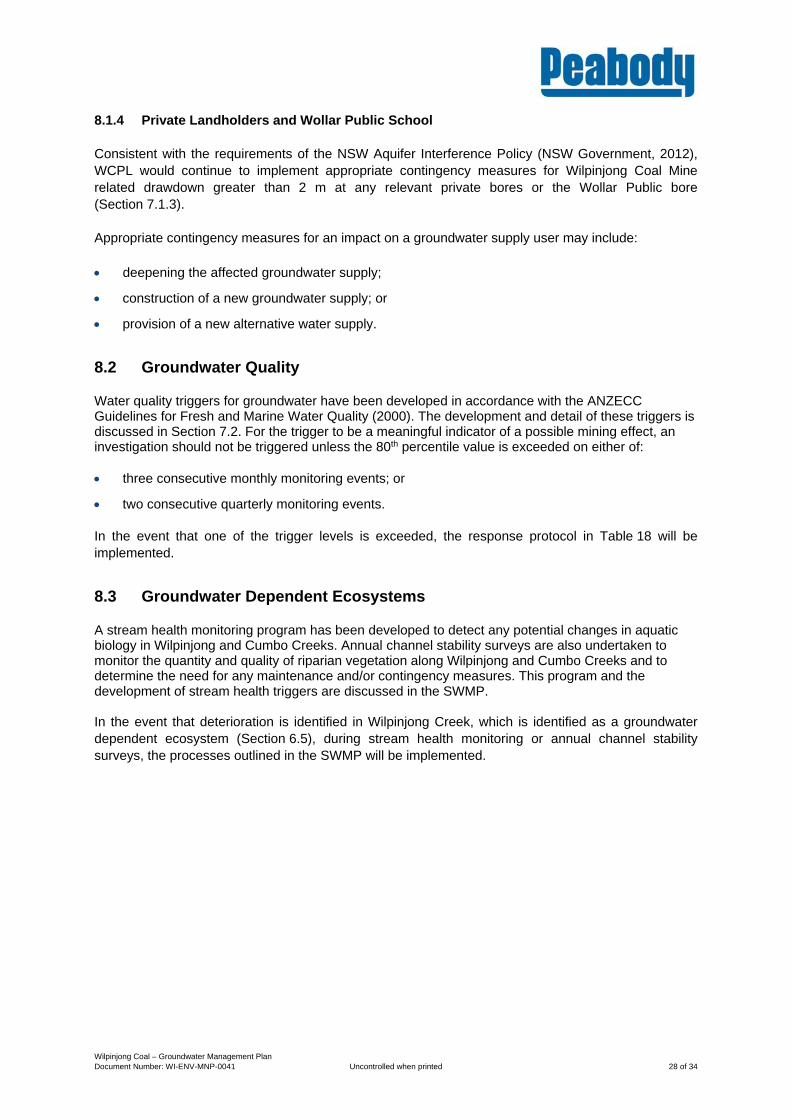
8.1.4 Private Landholders and Wollar Public School Consistent with the requirements of the NSW Aquifer Interference Policy (NSW Government, 2012), WCPL would continue to implement appropriate contingency measures for Wilpinjong Coal Mine related drawdown greater than 2 m at any relevant private bores or the Wollar Public bore (Section 7.1.3). Appropriate contingency measures for an impact on a groundwater supply user may include: deepening the affected groundwater supply;
construction of a new groundwater supply; or
provision of a new alternative water supply.
8.2 Groundwater Quality Water quality triggers for groundwater have been developed in accordance with the ANZECC Guidelines for Fresh and Marine Water Quality (2000). The development and detail of these triggers is discussed in Section 7.2. For the trigger to be a meaningful indicator of a possible mining effect, an investigation should not be triggered unless the 80th percentile value is exceeded on either of: three consecutive monthly monitoring events; or
two consecutive quarterly monitoring events. In the event that one of the trigger levels is exceeded, the response protocol in Table 18 will be implemented.
8.3 Groundwater Dependent Ecosystems A stream health monitoring program has been developed to detect any potential changes in aquatic biology in Wilpinjong and Cumbo Creeks. Annual channel stability surveys are also undertaken to monitor the quantity and quality of riparian vegetation along Wilpinjong and Cumbo Creeks and to determine the need for any maintenance and/or contingency measures. This program and the development of stream health triggers are discussed in the SWMP. In the event that deterioration is identified in Wilpinjong Creek, which is identified as a groundwater dependent ecosystem (Section 6.5), during stream health monitoring or annual channel stability surveys, the processes outlined in the SWMP will be implemented.

Wilpinjong Coal – Groundwater Management Plan Document Number: WI-ENV-MNP-0041 Uncontrolled when printed 29 of 34
Table 16 Groundwater Levels – Groundwater Predictions TARP
TARP
Trigger Monitored maximum groundwater drawdowns deviate by more than 50% from predictions made in the EA.
Increased groundwater make in the open cut workings compared to predictions made in the EA or any other subsequent assessment.
Consecutive pressure monitoring data from the regional monitoring network, over a period of six months, shows an unexpected effect from the previous data or groundwater model predictions; or
Annual review of the depressurisation of the coal measures shows an unexpected effect from the previous data or groundwater model predictions.
Action 1. Notify the WCPL ECM. 2. Check and validate the data which indicates an exceedance of the trigger conditions. 3. Notify DP&E, EPA and other relevant agencies as soon as practicable that an exceedance of
the trigger level has occurred and investigation will be undertaken. 4. Conduct a preliminary investigation with a review of the monitoring results in conjunction with
site activities being undertaken at the time, baseline groundwater monitoring results, groundwater results at nearby locations, the prevailing and preceding meteorological and streamflow conditions and changes to the landuse/activities being undertaken in the contributing hydrogeological regime, including mining activities.
5. Engage a qualified groundwater consultant to review monitoring data against the groundwater model and confirm if the model assumptions are correct/ reflect what is occurring in the mine.
6. Provide a preliminary investigation report to DP&E, EPA and relevant agencies within 7 days of identifying the exceedance.
Response Develop/design contingency and remedial measures based on the results of the above investigations. Contingency and remedial measures considered practical for implementation may include: o review and refine this GWMP; o identify if the installation of additional piezometers is required; o review and refine the Site Water Balance and predictive groundwater model; o review mine plan impacts on alluvial groundwater source; o consult with relevant government agencies on investigation and outcomes; o repair, replace, or construct new water management infrastructure.
Plan Communicate results of investigation and subsequent contingency and remedial measures to government agencies as required and summarise in the Annual Review.
If required, review and update the WMP and resubmit to DP&E. Where an investigation determines that an exceedance of the water management
performance measures in Table 6 of Development Consent SSD-6764, WCPL would (in accordance with Schedule 5, Condition 2 of Development Consent SSD-6747): o take all reasonable and feasible steps to ensure that the exceedance ceases and does
not recur; o consider all reasonable and feasible options for remediation (where relevant) and
submit a report to the Department describing those options and any preferred remediation measures or other course of action; and
o implement reasonable remediation measures as directed by the Secretary.

Wilpinjong Coal – Groundwater Management Plan Document Number: WI-ENV-MNP-0041 Uncontrolled when printed 30 of 34
Table 17 Groundwater Levels – Water Supply Borefield TARP
TARP
Trigger Monitoring results exceed the relevant reporting trigger or cease-to-pump trigger in Section 7.1.2.
Action 1. Notify the WCPL ECM. 2. Turn off the relevant production bore until the investigation under this protocol is
completed. Pumping from the relevant production bore will not recommence until such time as it can be determined that the predicted maximum drawdown is unlikely to be exceeded within the next six months or the groundwater level recovers to a level above the relevant cease-to-pump trigger.
3. Check and validate the data which indicates an exceedance of the trigger conditions. 4. Notify DP&E, EPA, DPI Water and other relevant agencies as soon as practicable that an
exceedance of the trigger level has occurred and investigation will be undertaken. 5. Conduct a preliminary investigation with a review of the monitoring results in conjunction
with baseline groundwater monitoring results, groundwater monitoring at nearby locations, the prevailing and preceding meteorological and streamflow conditions and changes to the landuse/ activities being undertaken in the contributing hydrogeological regime including mining activities.
6. Provide a preliminary investigation report to DP&E, EPA, DPI Water and relevant agencies within 7 days of identifying the non-compliance.
Response Develop contingency and remedial measures based on the results of the above investigations. Contingency and remedial measures considered practical for implementation may include: o Source alternative water supply whilst affected bore is offline; o Inspect affected bore to ensure it is operating effectively and the monitoring
equipment is providing reliable results; o Undertake landholder and government consultation; o Review and refine the GWMP; o Review Site Water Balance and predictive groundwater model; o Review mine plan impacts on alluvial groundwater source.
Plan Communicate results of investigation and subsequent contingency and remedial measures to government agencies as required and summarise in the Annual Review.
If required, review and update the WMP and resubmit to DP&E. Where an investigation determines that an exceedance of the water management
performance measures in Table 6 of Development Consent SSD-6764, WCPL would (in accordance with Schedule 5, Condition 2 of Development Consent SSD-6747): o take all reasonable and feasible steps to ensure that the exceedance ceases and
does not recur; o consider all reasonable and feasible options for remediation (where relevant) and
submit a report to the Department describing those options and any preferred remediation measures or other course of action; and
o implement reasonable remediation measures as directed by the Secretary.

Wilpinjong Coal – Groundwater Management Plan Document Number: WI-ENV-MNP-0041 Uncontrolled when printed 31 of 34
Table 18 Groundwater Quality TARP
TARP
Trigger Three consecutive monthly water monitoring results, or Two consecutive quarterly monitoring results, cause water quality impact triggers to be
exceeded. Action 1. Notify the WCPL ECM.
2. Check and validate the data which indicates an exceedance of the trigger conditions. 3. In the event of an apparently anomalous groundwater monitoring result, conduct a
resample/retest. 4. Notify DP&E, EPA and other relevant agencies as soon as practicable that an exceedance
of the trigger level has occurred and investigation will be undertaken. 5. Conduct a preliminary investigation with a review of the monitoring results in conjunction
with site activities being undertaken at the time, baseline groundwater monitoring results, groundwater results at nearby locations, the prevailing and preceding meteorological and streamflow conditions and changes to the landuse/ activities being undertaken in the contributing hydrogeological regime, including mining activities.
6. Provide a preliminary investigation report to DP&E, EPA and relevant agencies within 7 days of identifying the exceedance.
Response Where monitoring results indicate values exceeding the relevant threshold of acceptable variance or impact assessment criteria, conduct a further detailed risk based investigation.
Develop/design contingency and remedial measures based on the results of the above investigations. Contingency and remedial measures considered practical for implementation may include: o Notification to local licensed bore water users likely to be impacted; o Provide an alternative water source during the duration of the breach; o Review and refine the GWMP including undertaking additional specific monitoring of
private landholder bores; o Review Site Water Balance and predictive groundwater model; o Review mine plan impacts on alluvial groundwater source; o Repair, replace, or construct new water management infrastructure.
Plan Communicate results of investigation and subsequent contingency and remedial measures to government agencies as required and summarise in the Annual Review.
If required, review and update the WMP and resubmit to DP&E. Where an investigation determines that an exceedance of the water management
performance measures in Table 6 of Development Consent SSD-6764, WCPL would (in accordance with Schedule 5, Condition 2 of Development Consent SSD-6747): o take all reasonable and feasible steps to ensure that the exceedance ceases and
does not recur; o consider all reasonable and feasible options for remediation (where relevant) and
submit a report to the Department describing those options and any preferred remediation measures or other course of action; and
o implement reasonable remediation measures as directed by the Secretary.

Wilpinjong Coal – Groundwater Management Plan Document Number: WI-ENV-MNP-0041 Uncontrolled when printed 32 of 34
9 Annual Review and Improvement of Environmental Performance
The results of groundwater monitoring and groundwater modelling reviews are reported in the Annual Review. Further reporting details are provided in the WMP. Monitoring parameters and locations will be reviewed and may be altered or discontinued as a result of changes to operations. Any revisions to the monitoring program will also be described in the Annual Review and in future revisions of this GWMP.

Wilpinjong Coal – Groundwater Management Plan Document Number: WI-ENV-MNP-0041 Uncontrolled when printed 33 of 34
10 Responsibilities Specific responsibilities for personnel in relation to this GWMP are provided in Table 19. General responsibilities for water management are contained within the WMP.
Table 19 Responsibilities
Responsibility Task Timing
Environment and Community Manager
Ensure appropriate resources are available for the monitoring of all groundwater parameters to meet regulatory and operational requirements.
As required
Continue to develop and refine suitable triggers for water quality and level in conjunction with suitably quality experts.
As required
Review production bore trigger levels prior to the reinstatement of the production bores and on a 12 monthly basis if operational. If necessary adjust the triggers in consultation with DPI Water.
Prior to the reinstatement of the production bores and on a 12 monthly once operational
Oversee installation of new groundwater bores and licence in consultation with DPI Water.
As required
Comply with conditions of existing groundwater licences, including reporting requirements.
At all times
Ensure a coal measure monitoring bore and alluvial monitoring bore are constructed for each additional production bore.
As required
Maintain sufficient groundwater licences. As required
Environmental Representative
Coordinate groundwater monitoring program. Refer Section 6
Maintain monitoring records in accordance with the WMP. At all times
Review monitoring results against triggers in Section 7. Implement Groundwater Response Plan (Section 8) as required.
Refer Section 6 and 7
Upon receiving a complaint from a landholder, review the relevant data set to determine whether a mine-related impact greater than 2 m has occurred.
Following a complaint
Ensure cease to pump limits are adhered to (Section 7.1.2). During pumping
Coordinate updates, refinements and augmentation of the groundwater model.
Refer Section 6.4

Wilpinjong Coal – Groundwater Management Plan Document Number: WI-ENV-MNP-0041 Uncontrolled when printed 34 of 34
11 References Australasian Groundwater and Environmental Consultants Pty Limited (2005) Wilpinjong Coal Project
Groundwater Impact Assessment.
Australian and New Zealand Environment and Conservation Council and Agriculture and Resource Management Council of Australia and New Zealand (2000) National Water Quality Management Strategy: Australian and New Zealand Guidelines for Fresh and Marine Water Quality.
Barnson Pty Ltd (2014) Geotechnical Site Assessment Report, Proposed Cumbo Creek Diversion, Wilpinjong Coal Mine, Ulan NSW.
Geoterra Pty Limited (2004) Hydrogeological Assessment of the Proposed Wilpinjong Open Cut Coal Mine, Wilpinjong, NSW.
Geoterra Pty Limited (2005) Cumbo Homestead Production Bore (PB1) Test Program, Wilpinjong, NSW.
Groundwater Exploration Services Pty Ltd (2013) Groundwater Field Investigation - A Groundwater Investigation Status Report for the Wilpinjong Coal Project for Wilpinjong Coal Limited, March 2014.
Groundwater Imaging (2014) Cumbo and Wilpinjong Creeks groundwater connection investigation geophysics.
HydroSimulations (2013) Wilpinjong Coal Mine Modification Groundwater Assessment.
HydroSimulations (2015) Wilpinjong Extension Project Groundwater Assessment.
HydroSimulations (2016) Wilpinjong Extension Project – Response to Residual Matters Raised by DPI Water.
Merrick, N.P. (2005) Pumping Test Simulation – Wilpinjong Coal Project. Access UTS Pty Ltd. Report for Wilpinjong Coal Pty Ltd, Project No. C04/44/007, October 2005, 12p.
Murray Darling Basin Commission (1997) Murray Darling Basin Groundwater Quality Sampling Guidelines.
WCPL (2005) Wilpinjong Coal Project Environmental Impact Statement.
WCPL (2006) WCPL Baseline Channel Stability Survey for Wilpinjong and Cumbo Creeks.
WCPL (2015) Wilpinjong Extension Project Environmental Impact Statement.
WRM Water and Environment (2015) Wilpinjong Extension Project Surface Water Assessment.

Wilpinjong Coal – Groundwater Management Plan Document Number: WI-ENV-MNP-0041 Uncontrolled when printed
Table A1-1 Baseline Water Quality 2004-2005
Site Bore Type
Site Depth
(mbGL) Landholder Aquifer System
Field pH
Field EC (µS/cm)
GW078107 Well 5.3 Conden Cumbo Creek Alluvium (Nile Subgroup) 6.9 1300
GW080121 Bore 60+ Rheinberger Illawara Coal Measures 6.3 2890
GW080122 Well 4 Rheinberger Illawara Coal Measures (Wollar Creek Alluvium) 8.3 2400
GW080123 Well 3.7 Rheinberger Illawara Coal Measures (Wollar Creek Alluvium) 7.2 4100
GW024774 Bore 91.1 Ulan Coal Mines Illawarra Coal Measures 0 to 500
GW052937 Bore 42.7 King Illawarra Coal Measures 6.35 5300
WP109 Bore 33.5 McDermott Illawarra Coal Measures 6.45 5450
WP118 Well 10 WCPL Illawarra Coal Measures 8.25 1630
WP120 Bore 16.7 Woolford Illawarra Coal Measures 7.2 5400
GW063717 Well Illawarra Coal Measures (below Ulan Seam) 0 to 500
GW073038 Bore 42 Batty Illawarra Coal Measures (below Ulan Seam) 6.65 1600
EW1005 Piezo 49 WCPL Illawarra Coal Measures (Marrangaroo Conglomerate) 6.35 2500
EW2007 Piezo 51.5 WCPL Illawarra Coal Measures (Marrangaroo Conglomerate) 5.44 5400
EW4001 Well 48.1 WCPL Illawarra Coal Measures (Marrangaroo Conglomerate) 7 2700
EW5001 Piezo 33.5 WCPL Illawarra Coal Measures (Marrangaroo Conglomerate) 5.61 3900
EW5032 Piezo 20 WCPL Illawarra Coal Measures (Marrangaroo Conglomerate) 6.3 3600
EW5049 Piezo 17 WCPL Illawarra Coal Measures (Marrangaroo Conglomerate) 11.25 7000
EW5053 Piezo 14 WCPL Illawarra Coal Measures (Marrangaroo Conglomerate) 6.08 2200
EW1001 Open 79.4 WCPL Illawarra Coal Measures (Overburden / Ulan Seam / Marrangaroo Conglomerate) 6.63 3000
EW1002 WCPL Illawarra Coal Measures (Overburden / Ulan Seam / Marrangaroo Conglomerate) 6.14 3400
EW1003 WCPL Illawarra Coal Measures (Overburden / Ulan Seam / Marrangaroo Conglomerate) 6.25 2800
EW2004 WCPL Illawarra Coal Measures (Overburden / Ulan Seam / Marrangaroo Conglomerate) 3.34 2800
EW2005 WCPL Illawarra Coal Measures (Overburden / Ulan Seam / Marrangaroo Conglomerate) 3.59 823

Wilpinjong Coal – Groundwater Management Plan Document Number: WI-ENV-MNP-0041 Uncontrolled when printed
Site Bore Type
Site Depth
(mbGL) Landholder Aquifer System
Field pH
Field EC (µS/cm)
EW2009 WCPL Illawarra Coal Measures (Overburden / Ulan Seam / Marrangaroo Conglomerate) 6.35 3010
GW024775/ERUL27 Open 45.1 WCPL Illawarra Coal Measures (Overburden / Ulan Seam / Marrangaroo Conglomerate) 8 1020
EW1020 Open 27.4 WCPL Illawarra Coal Measures (Overburden / Ulan Seam) 6.97 2800
EW1021 Open 18.4 WCPL Illawarra Coal Measures (Overburden / Ulan Seam) 6.51 3000
GW024779/ERUL77 Open 44.4 WCPL Illawarra Coal Measures (Overburden / Ulan Seam) 7.6 2630
EW2011 Piezo 12 WCPL Illawarra Coal Measures (Overburden) 6.3 5200
EW4002 Well 27.6 WCPL Illawarra Coal Measures (Ulan Seam / Marrangaroo Conglomerate) 7.3 3720
DMCM12 Illawarra Coal Measures (Ulan Seam) 6.6 3390
EW4003 Well 36 WCPL Illawarra Coal Measures (Ulan Seam) 6.8 2470
EW5052 Piezo 16 WCPL Illawarra Coal Measures (Ulan Seam) 11.92 7500
GW024776/ERUL59 Open 48.8 WCPL Illawarra Coal Measures (Ulan Seam) 7.5 1550
GW024777/ERUL67 Open 26.1 WCPL Illawarra Coal Measures (Ulan Seam) 7.4 2330
GW024778/ERUL72 Open 31.8 WCPL Illawarra Coal Measures (Ulan Seam) 6.6 1380
WP099 Bore 15 Fields Mesozoic Laccolith Intrusion / Illawarra Coal Measures 6.5 1900
WP110 Bore 20+ Batey Mesozoic Laccolith Intrusion / Illawarra Coal Measures 6.9 2550
GW078130 Well 4.7 Parker Nile Subgroup (Cumbo Creek Alluvium) 5.4 1630
GW080128 Well 4 Robinson Nile Subgroup (Cumbo Creek Alluvium) 7.15 2830
WP117 Well 2.5 Smith Wilpinjong Creek Alluvium 8.36 400
WP125 Well 2.5 Patullo 7.09 6470
WP126 Bore 30+ Asmus 6.42 5900

Wilpinjong Coal – Groundwater Management Plan Document Number: WI-ENV-MNP-0041 Uncontrolled when printed
Table A1-2 Baseline EC (µS/cm) 2006-2009
ALLUVIUM COAL
Date GWa1 GWa2 GWa3 GWa4 GWa5 GWa6 GWa7 GWa8 GWc1 GWc2 GWc3 GWc4 GWc5
20/04/2006 1500 2420 1140 2470 8700 4000 2340 2170 1000 3100 2070 5900
8/05/2006 2600 1000 2600 2600 3300 2400 2100 1000 3000 2100 4600
23/05/2006 2300 1100 2500 4600 3400 2200 2000 1000 3000 2200 3800
10/06/2006 2200 1100 2200 5200 3000 2100 1900 1000 2600 2100 3800
1/07/2006 3000 1500 3100 8300 4400 3100 2700 1400 3800 2700 5400
16/07/2006 3100 1400 2900 9600 4100 2900 2600 1300 3600 2700 5300
30/07/2006 3300 1500 3100 10800 4200 1870 3260 500 2200 2700 6030
26/08/2006 3000 1400 2700 10800 4700 3700 2600 1300 3400 2700 5500
24/09/2006 2600 1300 2800 11100 4400 3600 2300 1300 3600 2700 5300
28/10/2006 2200 1400 2700 8100 3100 3200 2000 1300 3100 2600 4800
26/11/2006 1700 1300 2600 6200 4100 2400 1900 1200 3000 2800 3400
31/12/2006 2000 1300 2400 6300 5200 2800 2300 1400 3200 2500 4500
27/01/2007 1900 1200 2300 6100 5000 2600 2000 1300 2800 2300 4400
1/03/2007 2100 1400 2500 6200 5300 2900 2200 1300 2800 2700 3900
23/04/2007 2010 1250 2420 6590 2950 2020 970 3000 2190 4780
23/05/2007 2190 1270 2410 7910 6960 2890 2120 980 2950 2150 4740
25/06/2007 1790 810 2360 9640 4780 2690 2120 980 3070 2130 4750
20/07/2007 2200 630 2280 10590 6720 1470 2600 2090 950 3020 2120 4680
22/08/2007 2170 830 2290 11550 9340 2910 2080 960 3080 2140 4760
20/09/2007 2390 1300 2910 11700 10140 2940 2120 980 3080 2170 4740
24/10/2007 2100 1780 2400 9630 5870 2470 2270 980 3090 2160 4720
22/11/2007 1890 2410 11710 5930 2560 2250 3160 2150 4030
20/12/2007 1660 1100 1720 12980 5540 2380 2210 880 3150 2150 2430
16/01/2008 1540 1800 1410 12990 5260 2470 2270 1050 3120 1860 4750

Wilpinjong Coal – Groundwater Management Plan Document Number: WI-ENV-MNP-0041 Uncontrolled when printed
ALLUVIUM COAL
Date GWa1 GWa2 GWa3 GWa4 GWa5 GWa6 GWa7 GWa8 GWc1 GWc2 GWc3 GWc4 GWc5
15/02/2008 1510 1860 2430 11480 8530 2220 2430 1090 3170 2110 4240
19/03/2008 1390 1990 2040 14200 8800 2100 2470 1130 3180 1990 4730
14/04/2008 2560 2020 2370 9640 5420 9700 2550 1280 1160 3190 2150 4790
8/05/2008 7880 1260 1970 2270 9200 4450 8940 2290 2620 1150 3130 2170 4610
19/06/2008 1160 1970 2500 15030 5950 9800 2920 2880 1180 3200 2290 4800
16/07/2008 8010 1150 1910 2430 15200 6030 9760 2750 2880 1170 3140 2330 4730
13/08/2008 8010 1290 2020 2410 15340 6420 9850 2620 3100 1180 3160 2310 4720
3/09/2008 8020 1420 2050 1940 14750 4510 9640 2240 3050 1200 3100 2300 4720
9/10/2008 6280 1470 1260 2230 13720 6810 9710 1870 3070 1210 3100 2320 4680
6/11/2008 6490 1390 1730 2210 13870 6760 10290 1760 3200 1220 3120 2350 4780
4/12/2008 6560 1320 1950 1320 13940 7580 10050 1680 3160 1220 3070 2300 4730
8/01/2009 3560 1260 2050 2090 13480 7950 10130 1280 3170 1150 3080 2340 4730
19/02/2009 1020 1250 2000 2520 10910 6300 10040 1750 3230 1130 3120 2290 4730
11/03/2009 9890 1280 1980 2350 10040 4300 9970 1680 2520 1140 3180 2250 4660
22/04/2009 10760 1210 1940 2560 9240 6150 1000 1700 2230 1150 3330 2370 4730
12/05/2009 11130 1200 1870 2640 8870 5030 9800 1700 2120 1150 3250 2310 4660
19/06/2009 1210 1830 2460 9370 4100 9880 1650 1760 1160 3280 2330 4500
8/07/2009 11900 1260 1810 2490 11240 5150 9880 1710 1750 1170 3330 2340 4720
12/08/2009 12560 1320 1840 2510 14870 5610 10180 1840 1860 1190 3370 2310 4550
7/09/2009 12520 1270 1920 2460 14870 5610 10110 1850 1840 1190 3340 2380 4780
13/10/2009 12540 1230 1970 2410 13980 5290 9910 1890 1920 1220 3280 2350 4730
10/11/2009 12730 1280 1920 2520 14440 5380 10490 2070 1940 1300 3410 2420 4980
4/12/2009 1300 1850 2580 12220 6370 10260 990 1960 1290 3310 2370 4940

Wilpinjong Coal – Groundwater Management Plan Document Number: WI-ENV-MNP-0041 Uncontrolled when printed
Table A1-3 Baseline pH 2006-2009
ALLUVIUM COAL
Date GWa1 GWa2 GWa3 GWa4 GWa5 GWa6 GWa7 GWa8 GWc1 GWc2 GWc3 GWc4 GWc5
20/04/2006 7.6 6.6 7.0 7.1 6.5 7.8 6.6 6.7 7.4 6.8 6.8 6.7
8/05/2006 6.8 7.3 6.9 6.9 7.6 7.2 7.0 7.4 6.6 6.8 6.5
23/05/2006 6.6 6.9 7.0 7.1 7.4 7.1 6.8 7.3 6.7 6.9 7.1
10/06/2006 6.8 7.5 7.2 7.3 7.8 7.3 7.0 7.5 6.8 7.1 6.6
1/07/2006 6.5 7.3 7.4 6.8 7.6 6.8 7.1 7.1 6.4 6.8 6.8
16/07/2006 6.9 7.2 7.3 6.9 7.6 7.1 6.9 6.9 7.1 6.7 6.9
30/07/2006 7.0 7.1 7.4 7.1 7.4 7.2 6.8 6.9 7.0 7.2 7.1
26/08/2006 6.9 7.4 6.9 7.1 7.4 7.0 7.0 7.6 7.3 7.1 6.6
24/09/2006 7.4 7.3 7.0 7.2 7.8 7.6 7.3 7.7 7.6 7.1 6.6
28/10/2006 7.8 7.5 7.3 7.8 7.3 7.6 7.6 8.0 7.8 7.3 6.8
26/11/2006 7.7 7.3 7.4 7.7 7.8 7.6 7.7 7.8 7.6 7.2 6.7
31/12/2006 6.7 7.3 6.9 6.7 7.4 7.3 7.2 7.8 7.2 6.8 7.0
27/01/2007 7.4 7.8 7.2 6.9 7.7 7.6 7.5 7.9 7.5 7.3 7.4
1/03/2007 7.3 7.7 7.0 6.8 7.7 7.5 7.4 7.7 7.3 7.2 6.9
23/04/2007 7.1 7.3 7.0 7.9 7.2 6.8 7.3 7.3 7.1 7.0
23/04/2007 7.1 7.3 7.0 7.9 7.2 6.8 7.3 7.3 7.1 7.0
23/05/2007 6.8 7.1 6.8 6.4 7.2 7.2 7.2 7.2 6.9 7.0 6.9
25/06/2007 7.5 7.3 6.5 7.0 7.1 7.4 7.7 7.2 7.1 7.0 7.9
20/07/2007 6.4 7.2 6.8 7.3 7.5 7.7 7.4 7.0 7.1 7.0 7.0 6.8
22/08/2007 6.0 7.6 6.9 7.2 7.6 7.3 6.7 7.5 7.4 7.0 6.8
20/09/2007 6.6 7.2 6.9 7.0 7.5 7.3 7.0 7.4 7.3 7.0 6.9
24/10/2007 6.6 7.2 6.9 6.9 7.4 7.3 6.7 7.6 7.3 7.1 6.8
22/11/2007 6.3 7.0 7.0 7.3 7.7 6.2 6.6 7.0 7.0
20/12/2007 6.6 6.9 6.9 6.9 7.3 7.1 7.0 7.5 6.7 7.1 6.9
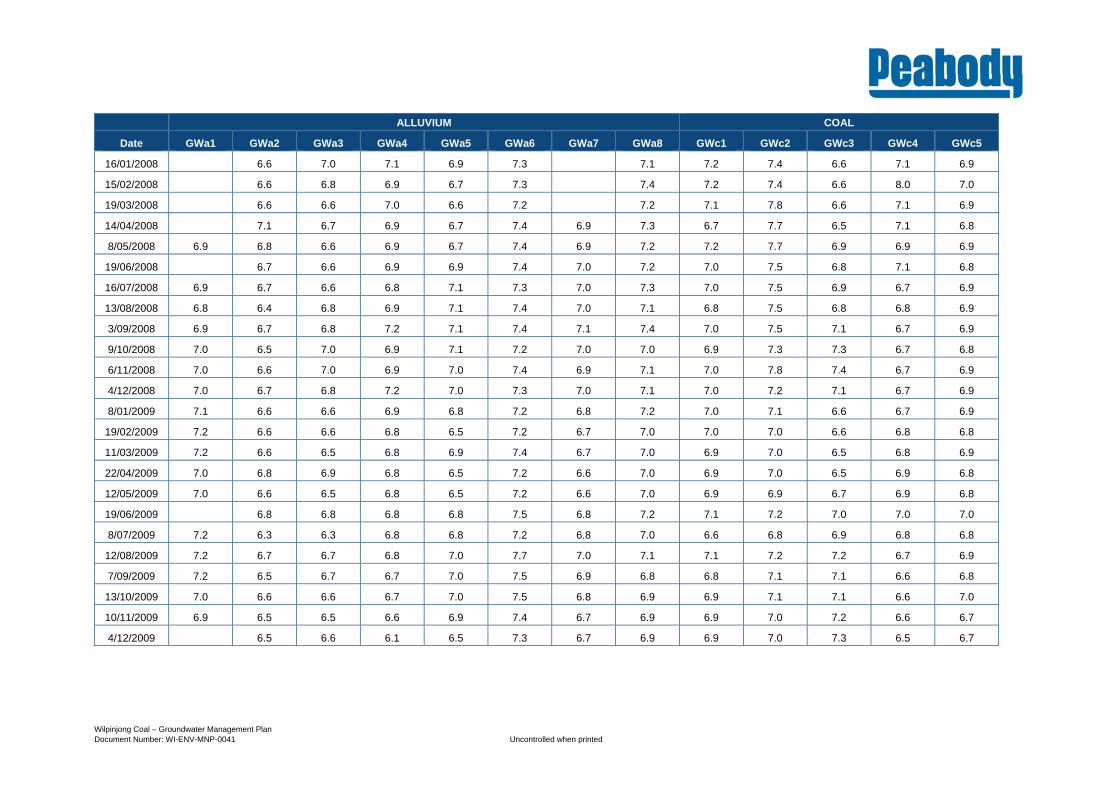
Wilpinjong Coal – Groundwater Management Plan Document Number: WI-ENV-MNP-0041 Uncontrolled when printed
ALLUVIUM COAL
Date GWa1 GWa2 GWa3 GWa4 GWa5 GWa6 GWa7 GWa8 GWc1 GWc2 GWc3 GWc4 GWc5
16/01/2008 6.6 7.0 7.1 6.9 7.3 7.1 7.2 7.4 6.6 7.1 6.9
15/02/2008 6.6 6.8 6.9 6.7 7.3 7.4 7.2 7.4 6.6 8.0 7.0
19/03/2008 6.6 6.6 7.0 6.6 7.2 7.2 7.1 7.8 6.6 7.1 6.9
14/04/2008 7.1 6.7 6.9 6.7 7.4 6.9 7.3 6.7 7.7 6.5 7.1 6.8
8/05/2008 6.9 6.8 6.6 6.9 6.7 7.4 6.9 7.2 7.2 7.7 6.9 6.9 6.9
19/06/2008 6.7 6.6 6.9 6.9 7.4 7.0 7.2 7.0 7.5 6.8 7.1 6.8
16/07/2008 6.9 6.7 6.6 6.8 7.1 7.3 7.0 7.3 7.0 7.5 6.9 6.7 6.9
13/08/2008 6.8 6.4 6.8 6.9 7.1 7.4 7.0 7.1 6.8 7.5 6.8 6.8 6.9
3/09/2008 6.9 6.7 6.8 7.2 7.1 7.4 7.1 7.4 7.0 7.5 7.1 6.7 6.9
9/10/2008 7.0 6.5 7.0 6.9 7.1 7.2 7.0 7.0 6.9 7.3 7.3 6.7 6.8
6/11/2008 7.0 6.6 7.0 6.9 7.0 7.4 6.9 7.1 7.0 7.8 7.4 6.7 6.9
4/12/2008 7.0 6.7 6.8 7.2 7.0 7.3 7.0 7.1 7.0 7.2 7.1 6.7 6.9
8/01/2009 7.1 6.6 6.6 6.9 6.8 7.2 6.8 7.2 7.0 7.1 6.6 6.7 6.9
19/02/2009 7.2 6.6 6.6 6.8 6.5 7.2 6.7 7.0 7.0 7.0 6.6 6.8 6.8
11/03/2009 7.2 6.6 6.5 6.8 6.9 7.4 6.7 7.0 6.9 7.0 6.5 6.8 6.9
22/04/2009 7.0 6.8 6.9 6.8 6.5 7.2 6.6 7.0 6.9 7.0 6.5 6.9 6.8
12/05/2009 7.0 6.6 6.5 6.8 6.5 7.2 6.6 7.0 6.9 6.9 6.7 6.9 6.8
19/06/2009 6.8 6.8 6.8 6.8 7.5 6.8 7.2 7.1 7.2 7.0 7.0 7.0
8/07/2009 7.2 6.3 6.3 6.8 6.8 7.2 6.8 7.0 6.6 6.8 6.9 6.8 6.8
12/08/2009 7.2 6.7 6.7 6.8 7.0 7.7 7.0 7.1 7.1 7.2 7.2 6.7 6.9
7/09/2009 7.2 6.5 6.7 6.7 7.0 7.5 6.9 6.8 6.8 7.1 7.1 6.6 6.8
13/10/2009 7.0 6.6 6.6 6.7 7.0 7.5 6.8 6.9 6.9 7.1 7.1 6.6 7.0
10/11/2009 6.9 6.5 6.5 6.6 6.9 7.4 6.7 6.9 6.9 7.0 7.2 6.6 6.7
4/12/2009 6.5 6.6 6.1 6.5 7.3 6.7 6.9 6.9 7.0 7.3 6.5 6.7