PE and Sport Survey 2009/10 - UCL Institute of …dera.ioe.ac.uk/846/1/DFE-RR032.pdf · Research...
98
Research Report DFE-RR032 PE and Sport Survey 2009/10 Susannah Quick, Aline Simon and Alex Thornton TNS-BMRB
Transcript of PE and Sport Survey 2009/10 - UCL Institute of …dera.ioe.ac.uk/846/1/DFE-RR032.pdf · Research...

Research Report DFE-RR032
PE and Sport
Survey 2009/10
Susannah Quick, Aline Simon and
Alex Thornton
TNS-BMRB

This research report was written before the new UK Government took office on 11 May 2010. As a result the content may not reflect current Government policy and may make reference to the Department for Children, Schools and Families (DCSF) which has now been replaced by the Department for Education (DFE).
The views expressed in this report are the authors’ and do not necessarily
reflect those of the Department for Education

Content 1. Summary of main findings ................................................................................. 2
2. Background and objectives................................................................................ 5 2.1 Policy background ........................................................................................5 2.2 Research objectives .....................................................................................5 2.3 Methodological approach .............................................................................6 2.4 New questions on gender.............................................................................7 2.5 Validation exercise .......................................................................................8 2.6 Reporting......................................................................................................8
3. Participation in PE and school sport .................................................................. 9 3.1 Curriculum time spent on PE......................................................................18 3.2 Participation in 120 minutes or more of curriculum time PE – gender
patterns ..................................................................................................................22
4. Participation in intra and inter-school competitive activities............................. 23 4.1 Intra-school competitive activities...............................................................23 4.2 Sports Days................................................................................................27 4.3 Inter-school competition .............................................................................27
5. Sports provision ............................................................................................... 32
6. Club links ......................................................................................................... 35
7. Community sports and multi-skill clubs............................................................ 37
8. Gifted and talented pupils ................................................................................ 39
9. Sports volunteering and leadership ................................................................. 41
10. Summary of gender patterns in participation in PE and school sport .............. 45
11. Further Education ............................................................................................ 47 11.1 Sporting events and activities organised....................................................47 11.2 Sports participation.....................................................................................48 11.3 Sports provision and club links...................................................................49 11.4 Sports volunteering and leadership............................................................51
12. Conclusions ..................................................................................................... 52 Appendix A – Detailed tables of results for individual Partnerships and Local Authorities Appendix B – Schools questionnaire Appendix C – FE questionnaire

2
1. Summary of main findings
TNS-BMRB, an independent research company, has been responsible for conducting a series of seven annual surveys on behalf of the Department for Education (formerly Department for Children, Schools and Families). The surveys aimed to collect information about participation in PE and out of hours school sport, and took place between 2003/04 and 2009/10. The most recent survey comprised a census of all schools in England, and achieved a response rate of 99.8% (21,436 schools), with data collection taking place during May – July 2010. In addition, a separate survey was also conducted among FE colleges in both 2008/09 and in 2009/10: the most recent of these surveys had a response rate of 99.4% (357 colleges). Participation in PE and school sport
• The latest survey found that across Years 1 – 13, 55% of pupils participated in at least three hours of high quality PE and out of hours school sport during the 2009/10 academic year. This means that when compared to the previous survey (2008/09) there has been an encouraging increase of five percentage points in terms of the proportion of pupils in Years 1 – 13 taking part in three hours of PE and out of hours school sport.
• Participation levels are highest in Years 4 – 6, and also reasonably high in Years 1 – 3 and Years 7 – 8. They are at their lowest in Years 12 and 13. The greatest improvements over the last year have been in Years 1 – 3, while the smallest improvements have been for Years 12 and 13.
• Participation rates do not vary much between the different regions of the country, but they do vary in terms of urban and rural areas, with those in rural areas being more likely to participate in at least three hours of PE and school sport (60% v. 54%). However, the gap has closed slightly over the last year.
• There is some link between high levels of participation in at least three hours of PE and out of hours school sport, and the proportion of pupils who are eligible for Free School Meals (FSM). Highest performing schools tend to have fewer pupils who are eligible for FSM than do lower performing schools. There is, however, an indication that over the last year performance has increased at a faster rate in schools with a higher proportion of children who are eligible for FSM.
• Data collected for the first time on differences in participation levels between girls and boys shows that overall boys (58%) are more likely than girls (52%) to take part in at least three hours of PE and school sport. There are small differences in participation levels between girls and boys in Years 1 – 7. However, after Year 7 the gap grows bigger.
Curriculum time spent on PE
• Pupils across Years 1 - 13 spent an average of 117 minutes taking part in PE in a typical week.
• Looking back across the series of surveys, and focusing just on Years 1 – 11 (for which consistent data is available), the latest results mean that in each of the surveys there has been an increase in the average number of minutes that pupils take part in PE each week. In 2004/05 the average number of minutes for Years 1 – 11 was 107, compared to 123 in the latest survey.
• Across Years 1 – 13, 79% of pupils participated in 120 minutes or more per week of curriculum PE – up from 77% in 2008/09. Looking at the longer term trend which is based on Years 1 - 11, there has been an increase from 44%

3
of pupils in Years 1 – 11 participating in at least 120 minutes of curriculum PE in 2003/04, up to the current level of 84%.
• Across the seven surveys there have been increases in all year groups in terms of the proportion of pupils participating in at least 120 minutes of curriculum PE. These increases have been most marked in Years 1 – 6.
• The latest survey reveals that 78% of girls in Years 1 – 13 took part in at least 120 minutes of curriculum PE, compared to 80% of boys. In Years 1 – 6 there is no difference at all on this measure, but on entry to secondary school a difference begins to emerge, rising gradually to reach a four or five percentage point differential in each of Years 10, 11, 12 and 13.
Participation in intra- and inter-school competitive activities
• The 2009/10 survey found a very large increase in the proportion of pupils participating in intra-school competitive activities during the academic year – up from 69% (of Years 1 – 11) in 2008/09 to 78% in 2009/10.
• This increase is apparent in each and every year group, with the largest increase being in Year 1.
• 77% of boys participated in intra-school competition, compared to 73% of girls. This difference is not very apparent in Key Stages 1 and 2, but by Year 10 it has risen to five percentage points, and in Years 11 – 13 the difference is much greater than this.
• Like participation in intra-school competition in general, regular participation has also increased substantially over the last year – up from 28% of Years 3 – 13 in 2008/09 to 39% in 2009/10.
• 99% of schools held at least one sports day or equivalent during the academic year.
• 49% of pupils in Years 1 – 11 participated in inter-school competition during the 2009/10 academic year. This continues the upwards trend, with a five percentage point increase in the last year.
• There are some differences in participation in inter-school competition between boys (50%) and girls (44%), based on Years 1 - 13. The difference in participation levels only become apparent at Year 4, and then increases year on year until by Year 10 - 13 the discrepancy is very large.
• 21% of pupils across Years 3 – 13 regularly participated in inter-school competition during 2009/10, a small increase from 19% in 2008/09.
Sports provision • Schools provided on average 19.0 different sports from a pre-specified list.
This is a small increase over the average number of sports provided in 2008/09 (18.6).
• Football once again is the most widely provided sport. • On average, an equal number of sports were available to both girls and boys.
However, while at a primary level there were no differences at all in terms of the actual sports available, at a secondary level the survey reveals that boys and girls are often offered different sports. Specifically secondary level girls were more likely than boys to be offered dance, gymnastics, rounders, netball, hockey, trampolining, cheerleading, yoga and equestrian, while boys were more likely to be offered cricket, basketball, rugby union, golf, rugby league, table tennis, softball, boxing and baseball.
4
Club links • Schools had links to an average of 9.1 listed clubs. When compared to the
2008/09 survey, this represents an increase from 8.2, continuing the upwards trend.
• Football, cricket, dance, rugby union, swimming, athletics and tennis are the most widespread clubs.
• The main increases in club links over the last year have been for dance, swimming and tennis.
Community sports and multi-skill clubs
• While the 2008/09 survey appeared to show that progress on participation in community sports, dance or multi-skill clubs had stalled, the latest survey indicates that participation has increased from 31% in 2008/09 to 33% in 2009/10.
Gifted and talented pupils
• 8% of pupils across Years 5 – 13 were registered as gifted and talented because of their ability in PE and/or school sport. This is a slight increase over the levels recorded in the three previous surveys.
• Boys (8%) are slightly more likely than girls (7%) to be registered. This small difference exists in all year groups, although it is slightly more exaggerated in Years 5 and 6 and in Years 11, 12 and 13.
Sports volunteering and leadership
• Since the 2008/09 survey, the proportion of pupils from Years 1 – 13 who have been actively involved in sports volunteering and leadership during the academic year has increased from 19% to 24%.
• Active involvement in sports volunteering and leadership varied by gender, with girls being marginally more likely than boys to be involved (25% compared to 23%). However, this pattern varies by year group, and although in Years 2 – 10 this pattern holds true, in Years 12 and 13 boys are in fact more likely than girls to be involved in sports volunteering and leadership.
Further Education
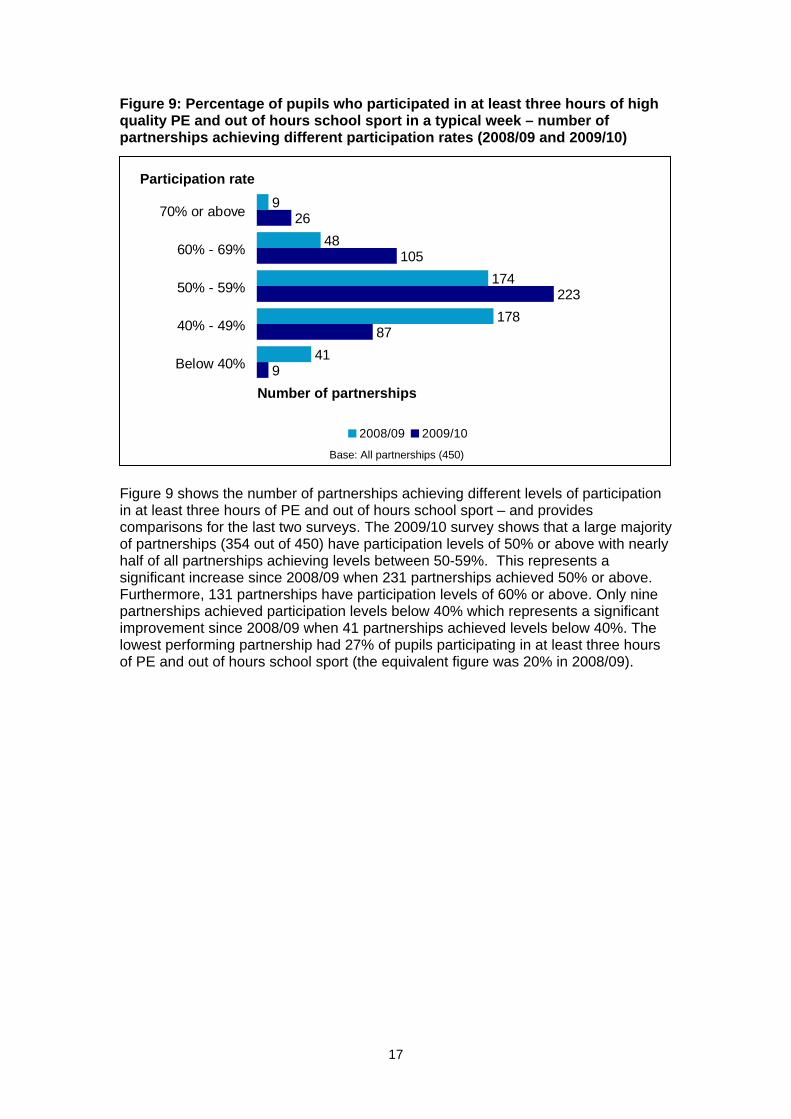
• FESCos (Further Education Sport Co-ordinators) estimated that they or someone else had organised a total of 154 different events during the academic year – up from 92 events in the previous academic year. The largest proportion of these were participation sessions/clubs, of which FESCos had organised an average of 94.
• FESCos indicated that 23% of all full-time pupils aged 16 – 19 had taken part in at least one of the sporting events they had organised during the year. This is up by seven percentage points on the 2008/09 figure.
• 12% of full-time students aged 16 – 19 had taken part in intra-college competitive activities during the academic year, which represents a big increase from the 7% recorded in 2008/09. There was also a small increase in the proportion of students who had participated in inter-college competitive activities, from 5% in 2008/09 to 7% in 2009/10.
• Colleges provided an average of 19.3 of the listed sports, an increase of just over three sports per college when compared to 2008/09. FESCos also reported a substantial increase in the average number of schools/educational establishments that they had links with – up from 25 to 37 per college.

5
2. Background and objectives
2.1 Policy background The PE and Sport Strategy for Young People aims to get more young people taking part in high quality PE and sport. The strategy was originally set up in 2003. To deliver this, the Government has created a network of 450 School Sport Partnerships across England. In the 2009/10 academic year there were 21,486 schools and 357 FE colleges within the PE and Sport Strategy for Young People, arranged into these partnerships. Partnerships are ‘families’ of schools which typically comprise a Specialist Sports College linked to a set of secondary schools, each of which has a further group of primary and special schools clustered around it. The Partnership Development Manager (PDM) is at the core of the Strategy and is responsible for managing the partnership; in every secondary school there is a School Sport Co-ordinator (SSCo), and in every primary or special school there is a Primary Link Teacher (PLT) or Special School Link Teacher (SSLT) who is responsible for leading the strategy at that particular school. Staff are funded by the Strategy to allow them to do this. There is also a national network of 225 Competition Managers which was set up to create more and better opportunities for a wider range of young people to take part in competitive sport. In 2008, the Strategy was expanded to cover Further Education (FE) colleges. In April 2008, a first wave of Further Education Sport Co-ordinators (FESCos) was put in place in partnerships, with a remit to increase opportunities for young people aged 16 -19 years to participate, lead and volunteer in sport. Between 2003/04 and 2007/08 TNS-BMRB (formerly TNS), an independent research company, conducted five annual surveys of schools to measure progress towards increasing participation in PE and sport by 5 – 16 year olds.
In 2008/09 and 2009/10 TNS-BMRB was commissioned to conduct two further surveys of schools which measured take up of PE and sport by young people in schools and colleges. At this point the survey was also extended to cover Years 12 and 13; hence long term trend analysis is often limited to Years 1-11.
2.2 Research objectives
The main aim of this research was to provide very robust and reliable information from partnership schools on:
• the proportion of pupils receiving 2 hours of curriculum PE1 • and the proportion of pupils participating in at least 3 hours of high
quality2 PE and school sport3 in a typical week
1 PE is the planned teaching and learning programme in curriculum time that meets the requirements of the national curriculum for physical education. 2 High quality is defined as ‘producing young people with the skills, understanding, desire and commitment to continue to improve and achieve in a range of PE, sport and health-enhancing physical activities, in line with their abilities’. Learning through PE and Sport – A guide to the PE, School Sport and Club Links Strategy.

6
In addition, the research sought to collect further information on:
• the proportion of pupils involved in intra-school sport competitive activities • the proportion of pupils involved in inter-school competitions • the range of sports offered • the proportion of pupils participating in clubs linked to the schools • the proportion of pupils registered as gifted and talented because of their
ability in PE and/or school sport • the proportion of pupils actively involved in sports volunteering and leadership • the number of schools that run a sports day
For the first time in 2009/10, the survey aimed to examine how participation in sport varied by gender. In addition to ‘top level’ information, the survey also sought to provide information to help gauge the performance of individual partnerships and to track how performance has changed over time. Finally, the survey also aimed to collect information from Further Education (FE) colleges about sports provision and participation.
2.3 Methodological approach
The 2009/10 survey aimed to collect information from all partnership schools in the maintained sector in England (a total of 21,486 schools) and from all FE colleges (a total of 357). It also collected information from a small number of independent schools, but this information is not included in this report. The main schools survey required schools to provide answers to 12 questions – while for the FE survey, FESCos were required to answer 11 questions. For the first time in the 2009/10 survey, these questions could only be answered online by schools, and not on paper (this also applied to FE colleges) – although for the schools survey, schools were provided with a paper copy of all the documentation, including the questionnaire, to help in the collation of the information. All partnerships were required to have active involvement in the survey process and PDMs were asked to take responsibility for data collection within their partnership. TNS-BMRB sent paper documents in bulk to PDMs for distribution to their schools; PDMs were then responsible for tracking responses, and ensuring that responses were submitted online to TNS-BMRB. A survey website was developed which not only provided access to the online questionnaire, but also to other materials to assist with the survey. The website also provided a ‘PDM area’ where each PDM could log on and track which of the schools in their partnership had submitted their responses and download a copy of the actual data submitted. Both an online and a telephone helpline were made available to support partnerships during the process. Survey packs were sent to PDMs at the end of April 2010. Each pack contained a covering letter, a set of survey instructions for PDMs, a list of schools and FE colleges in the partnership, a pre-printed questionnaire and a step-by-step guide to 3 School sport includes any activity that requires physical skilfulness and is part of the school’s planned formal, semi-formal, supervised or led provision. School sport typically takes place out of school hours.

7
the survey. The final date for schools/colleges to submit their returns was 1 July 2010, about 10 weeks after the initial mail out of questionnaires. Returns were carefully monitored on a daily basis at TNS-BMRB, and all PDMs in partnerships with zero returns were sent an email shortly before the completion deadline, reminding them to check that everything was in order. By the final deadline, a total of 21,436 usable responses had been received for the main schools survey, which represents an overall response rate of 99.8%. This is in line with the 2008/09 survey, when both an online and a paper method of response were offered, which means that the removal of the paper means of data collection did not have any perceptible impact on the overall level of response. It is a condition of grant for partnerships that they take part in the survey. Nine out of ten of all partnerships achieved a 100% response rate and only four partnerships achieved a response rate below 95%. For the FE survey, by the final deadline, responses had been received from 355 of the 357 FESCos, representing a response rate of 99.4%. This project was carried out in compliance with ISO 20252 – the market research quality standard.
2.4 New questions on gender
As has already been mentioned, for the first time in 2009/10, the survey collected information separately for boys and girls – this was for almost all of the schools survey questions. To assist with this process a selection of around forty PDMs and SSCOs were approached and asked for their views on this new approach. Twenty six interviews were conducted in October 2009 to explore PDMs’ and SSCOs’ opinions on the proposed changes to the survey. Overall, PDMs’ and SSCOs’ views were positive and they could see the value of collecting information separately for boys and girls. As a result of these interviews DfE decided to go ahead with the new approach and the questionnaire was reviewed to collect information separately for boys and girls for most of the questions. To ensure the changes were implemented in the best manner, the new questionnaire was tested prior to mainstage fieldwork. In February 2010, fourteen PDMs and SSCOs were sent a draft version of the questionnaire with questions split by gender and the updated survey guide. Subsequently, depth interviews were carried out by telephone with these PDMs and SSCos to evaluate the content, comprehensiveness and clarity of these documents. As a result of these interviews a few minor changes were made to the questionnaire and survey guide. These included the addition of a total column to the online questionnaire such that the respondents could enter answers separately for boys and girls but see a total calculation alongside to help them check that their answers were correct. A new data collection tool was also provided with the survey documentation to support schools in collecting information by gender.

8
2.5 Validation exercise
In addition to the main data collection, a validation exercise took place to verify the accuracy of the answers to four of the key questions within the survey. These questions were:
• Q1. What is the total curriculum time in minutes that all pupils in each year group spend taking part in PE in a typical week?
• Q2. What is the total number of pupils in each year group who participate in at least three hours of high quality PE and out of hours school sport in a typical week?
• Q10. What is the total number of pupils in each year group who have participated in one or more community sports, dance or multi-skill clubs with links to the school during this academic year?
• Q12. What is the total number of pupils in each year group actively involved in sports volunteering and leadership this academic year?
The validation exercise comprised visits to 20% of the 450 partnerships which were selected at random (90 in total). At each partnership a face-to-face interview was carried out with the PDM and with eight randomly selected schools/FE colleges. The exercise was conducted in June and July 2010. As in previous years, TNS-BMRB concluded that the results of the survey were robust and there was no evidence of systematic misreporting. Written evidence provided by schools and verbal accounts of data collection supported the findings of the main survey. Consistent with previous years, TNS-BMRB concluded that there are still minor difficulties with some of the terminology used in the survey, including what constitutes a club link (as highlighted in 2008/09) and what should be included in sports volunteering and leadership. Overall, the exercise suggested that the survey had run smoothly and PDMs, SSCos, PLTs and FESCos remain adept at conducting the survey. It is worth noting that most PDMs indicated that the inclusion of separate questions for boys and girls was a good way of maximising the value of the survey. In many cases they were already asking schools to collect data by gender for their own purposes anyway. No problems were reported to have occurred as a result of the removal of the option to complete the survey on paper.
2.6 Reporting
This report presents the findings from the 2009/10 survey. Where appropriate, comparisons are made with the previous six waves of data collection. For simplicity, the figures shown in the text and charts in this report have been rounded to the nearest percentage point. The appendices to this report contain detailed tables which list results on key questions for all partnerships and Local Authorities, together with a copy of both the schools and the FE questionnaires.

9
3. Participation in PE and school sport
For the first five surveys, schools were asked to indicate the number of pupils in each year group who participated in at least two hours of high quality PE and out of hours school sport in a typical week. By 2007/08, 90% of pupils across Years 1 - 11 in partnership schools achieved this level of participation. As a result of this it was decided that the bar should be raised and that for subsequent surveys schools should be asked to provide information about participation in at least three hours of high quality PE and out of hours school sport. Figure 1 shows the responses to this question, analysed by year group and by school type – comparing the results from 2008/09 with the latest survey results. Figure 1: Percentage of pupils who participated in at least three hours of high quality PE and out of hours school sport in a typical week – analysis by year group and school type (2008/09 and 2009/10)
51 50 4752
5559
63 65
5350
44 4237
21 19
57
42
5755 5761 63 66 69 70
5954
4945
40
23 21
64
46
6457
All pup
ils Y
ears
1 - 11
All pup
ils Y
ears
1 - 13
Year 1
Year 2
Year 3
Year 4
Year 5
Year 6
Year 7
Year 8
Year 9
Year 1
0
Year 1
1
Year 1
2
Year 1
3
Primary
Secon
dary
Specia
l
%
2008/09 2009/10
Base: All pupils in Years 1 - 13 where information given (2008/09: 6,557,890 ; 2009/10: 6,565,106) Looking across the total of Years 1 – 13, 55% of all pupils participated in at least three hours of high quality PE and out of hours school sport in 2009/10. This has increased by five percentage points from the 2008/09 survey, when 50% had participated in at least three hours of PE and out of hours school sport. If Years 12 and 13 are excluded and the focus is solely on Years 1 – 11, then the figure is slightly higher at 57% in 2009/10 (an increase of six percentage points from 51% in 2008/09). Both the 2008/09 and the 2009/10 surveys display similar patterns in terms of participation levels by age group (and this was also the case for the previous five surveys, when the measure was two hours of PE/school sport). Participation levels are highest in Years 4 – 6, and also reasonably high in Years 1 - 3 and Years 7 – 8.

10
They decrease steadily in the secondary phase, reaching 40% in Year 11, and then dropping off significantly in Years 12 and 13, to just 23% and 21% respectively. The greatest improvements between the two surveys in terms of participation in at least three hours of PE and out of hours school sport are for Years 1 – 3, while the smallest improvements are for Years 12 and 13, both showing increases of two percentage points. Around two thirds (64%) of pupils in primary schools and special schools participated in at least three hours of PE and out of hours school sport – both up from 57% in the 2008/09 survey. In secondary schools the figure was lower at 46%, and the increase more modest (up four percentage points from 42% in 2008/09). Figure 2: Percentage of pupils who participated in at least three hours of high quality PE and out of hours school sport in a typical week – analysis by region (2008/09 and 2009/10)
50 52 52 51 50 49 48 47 50 4856
4855 58 57 57 56 55 55 54 53 53
6054
All pup
ils in
Yea
rs 1 -
13
North W
est
South
Wes
t
North E
ast
East M
ids
Lond
on
Yorks &
Hum
ber
South
East
East
Wes
t Mids Rura
l
Urban
%
2008/09 2009/10
Base: All pupils in Years 1 - 13 where information given (2008/09: 6,557,890 ; 2009/10: 6,565,106) Participation rates did not vary much between the different regions of the country, with rates in the North West (58%) being the highest, and rates in the West Midlands and the East (53%) being the lowest. All regions have shown improvements on the 2008/09 rates, and these improvements are spread relatively consistently across the regions. Both the 2008/09 and the 2009/10 surveys showed that participation rates in at least three hours of PE and out of hours school sport were higher in rural areas than in urban areas. However, the gap has narrowed slightly by two percentage points since 2008/09, with 60% of pupils in rural areas now participating compared with 54% in urban areas.

11
Figure 3: Percentage of pupils who participated in at least three hours of high quality PE and out of hours school sport in a typical week – analysis by percentage of children eligible for free school meals (2008/09 and 2009/10)
29%
33%
25%
30%
37%
40%
32%
34%
37%
39%
35%
36%
40%
33%
38%
31%
27%
23%
2008/09
2009/10
2008/09
2009/10
2008/09
2009/10
High % FSM
Medium % FSM
Low % FSM
Base: All schools (21,436)
% of children eligible for FSM
Level of participation in three hoursPE and school sport
Schools achieving 70% participation
or more
Schools achieving 40% - 70% participation
Schools achieving 40% participation
or less
Figure 3 shows the relationship between the performance of schools in regard to the proportion of pupils participating in at least three hours of PE and out of hours school sport and the proportion of pupils who are eligible for Free School Meals (FSM)4. It shows that in the schools which perform highest in terms of their pupils’ participation in three hours of PE / school sport there tend to be fewer pupils who are eligible for FSM than in schools where there are lower levels of participation in the three hour PE / school sport target (33% were defined as high % FSM compared to 40%).This pattern has been observed in previous surveys; in 2008/09, for example, the respective figures were 29% and 37%. Conversely schools which perform highest in terms of their pupils’ participation were more likely to be categorised as low % FSM than schools with lower levels of participation (33% compared to 23%). Changes since 2008/09 largely reflect the changing profile of schools between the two survey periods. Since 2008/09 the percentage of schools with a high proportion of pupils who are eligible for FSM has increased by three percentage points from 30% to 33%, while the percentage of schools with a low proportion of pupils who are eligible for FSM has decreased by five percentage points from 35% to 30%. However, the changes shown in Figure 3 are not uniform and, most specifically, the increases in the proportion of high and medium performing schools that are defined as high % FSM are above the average national 3% increase (4% and 5% respectively). Conversely, the decreases in the proportion of high and medium performing schools that are defined as low % FSM are greater than the average national 5% decrease (7% in both cases). This suggests that performance on this three hour measure has increased at a faster rate in schools with a high proportion of pupils who are eligible for FSM than it has in schools with a low proportion.
4 High FSM is defined as more than 20% of children eligible; medium as 7%-19% of children; low as less than 7% of children

12
Figure 4: Percentage of pupils who participated in at least three hours of high quality PE and out of hours school sport in a typical week – analysis by Index of Multiple Deprivation (2008/09 and 2009/10)
27%
28%
26%
26%
36%
35%
33%
32%
32%
33%
31%
30%
40%
39%
42%
41%
33%
34%
2008/09
2009/10
2008/09
2009/10
2008/09
2009/10
Deprived
Medium
Affluent
Base: All schools (21,436)
Level of participation in three hoursPE and school sport
Schools achieving 70% participation
or more
Schools achieving 40% - 70% participation
Schools achieving 40% participation
or less
Index of Multiple
Deprivation
Figure 4 provides a comparison of performance of schools on achieving three hours participation in PE/school sport in terms of the schools’ Index of Multiple Deprivation (IMD). This shows a relationship between levels of participation in PE/school sport and IMD. Schools in deprived areas are over-represented amongst the lowest performing schools in terms of their participation in PE/school sport and schools in affluent areas are over-represented in high and medium performing schools. This is consistent with previous surveys and in line with variations in levels of participation by FSM. As the chart shows, there have been no changes in the pattern on this measure over the last year.

13
Figure 5: Percentage of pupils who participated in at least three hours of high quality PE and out of hours school sport in a typical week – analysis by Ethnic Minority background (2008/09 and 2009/10)
38%
37%
42%
42%
49%
50%
36%
35%
37%
36%
33%
31%
26%
28%
21%
22%
18%
18%
2008/09
2009/10
2008/09
2009/10
2008/09
2009/10
High (12%+)
Medium (4-11%)
Low (0-3%)
Base: All schools (21,436)
Level of participation in three hoursPE and school sport
Schools achieving 70% participation
or more
Schools achieving 40% - 70% participation
Schools achieving 40% participation
or less
% of children with Ethnic Minority
background
Looking at performance of schools on achieving three hours participation in PE/school sport by ethnic minority background (see Figure 5), confirms the patterns we have seen on FSM and IMD. Schools achieving the lowest levels of participation in three hours PE/school sport tend to have a relatively high proportion of children from an ethnic minority background. Conversely those achieving the highest levels of participation tend to have a relatively low proportion of children from an ethnic minority background. This is consistent with previous surveys and there has been very little change since 2008/09. Figure 6: Percentage of pupils who participated in at least three hours of high quality PE and out of hours school sport in a typical week – analysis by Special Educational Needs (2008/09 and 2009/10)
34%
36%
32%
35%
41%
42%
36%
36%
38%
39%
36%
35%
30%
28%
29%
26%
23%
22%
2008/09
2009/10
2008/09
2009/10
2008/09
2009/10
High (23%+)
Medium (14-22%)
Low (0-13%)
Base: All schools (21,436)
Level of participation in three hoursPE and school sport
Schools achieving 70% participation
or more
Schools achieving 40% - 70% participation
Schools achieving 40% participation
or less
% of children with SEN

14
Continuing this series of analysis, Figure 6 shows the relationship between the proportion of pupils with Special Educational Needs (SEN) and the performance of the school in terms of participation in three hours of PE/school sport. The findings are consistent with patterns previously observed in relation to FSM, IMD and ethnic minority background. In the lowest performing schools there are a higher proportion of pupils with SEN than is the case in higher performing schools. And, in the highest performing schools there are a lower proportion of pupils with SEN. As noted in relation to FSM, the changes since 2008/09 are associated with a change in the profile of schools between the two survey periods. Since 2008/09 the percentage of schools with a high proportion of pupils with SEN increased by one percentage point from 36% to 37%, while the percentage of schools with a low proportion of pupils with SEN has decreased by two percentage points from 28% to 26%. While this represents only a moderate shift, once again the changes shown in Figure 6 are not uniform. Notably, the increases in the percentage of high and medium performing schools with a high proportion of pupils with SEN are above the average national 1% increase (2% and 3% respectively). Also, the decrease in the proportion of medium performing schools with a low proportion of pupils with SEN (3%) is greater than the average national decrease (2%). This suggests that performance on the three hour measure has improved at a slightly faster rate in schools with a high proportion of pupils with SEN than it has at schools with a low proportion.

15
Figure 7: Percentage of pupils who participated in at least three hours of high quality PE and out of hours school sport in a typical week – analysis by school type (2008/09 and 2009/10)
50
49
33
50
53
37
56
55All
Boys only
Girls only
Mixed
%
2008/09 2009/10
Base: All pupils in Years 1 - 13 where information given (2008/09: 6,557,890 ; 2009/10: 6,565,106) Throughout the survey series, the only analysis by gender which has been possible is a comparison of results for boys only, girls only and mixed schools. This has consistently shown that pupils in boys only schools and mixed schools are more likely to participate in PE and out of hours school sport than is the case for pupils in girls only schools. The latest survey shows that 53% of boys in boys only schools take part in at least three hours of PE and school sport, compared to just 37% of girls in girls only schools, and that the gap has remained the same between the last two surveys. However, only a very small proportion (c.5% of pupils) are taught in single sex schools, and so this information is of limited use. As a result of this, for the first time the 2009/10 survey collected information for girls and boys separately, and Figure 8 shows these results by gender within individual year group and by school type.

16
Figure 8: Percentage of pupils who participated in at least three hours of high quality PE and out of hours school sport in a typical week – analysis by gender (2009/10)
52 5560 61
64 67 68
5650
4439
33
17 15
62
41
615863 65 67
71 73
6157
53 5146
29 28
66
50
66
58
All pup
ils Y
ears
1 - 13
Year 1
Year 2
Year 3
Year 4
Year 5
Year 6
Year 7
Year 8
Year 9
Year 1
0
Year 1
1
Year 1
2
Year 1
3
Primary
Secon
dary
Specia
l
%
Girls Boys
Base: All pupils in Years 1 - 13 where information given (6,565,106) The results show that there is a difference between the proportion of girls and boys participating in at least three hours of PE and out of hours school sport and that this difference is apparent across all year groups. Around half (52%) of girls participated in at least three hours of PE/school sport, compared to 58% of boys. In terms of individual year groups the smallest differences by gender were in Years 1 – 7. After Year 7, the gap between the sexes widened as pupils got older, until by Year 11 the difference was 13 percentage points (33% participation for girls and 46% for boys). This difference was also apparent in Years 12 and 13. In terms of school type, there was a gap of four percentage points in participation levels between the sexes in primary schools, five percentage points in special schools, and nine percentage points in secondary schools.
17
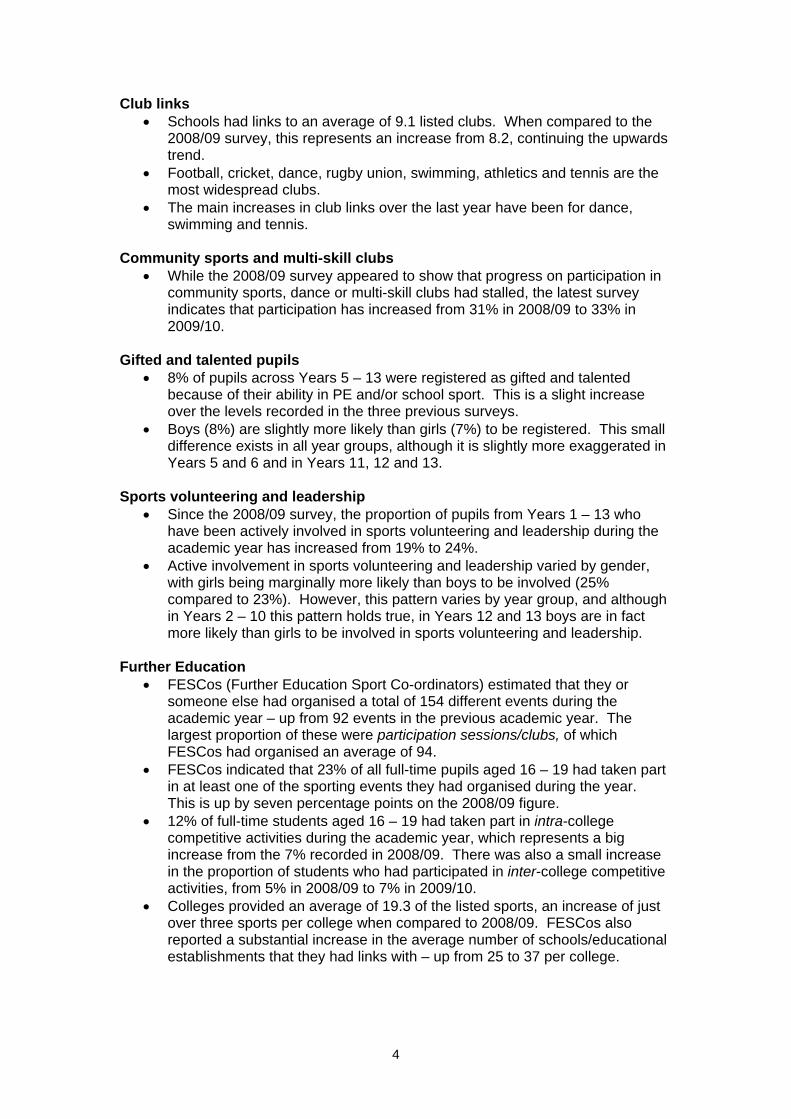
Figure 9: Percentage of pupils who participated in at least three hours of high quality PE and out of hours school sport in a typical week – number of partnerships achieving different participation rates (2008/09 and 2009/10)
9
48
174
178
41
26
105
223
87
9
70% or above
60% - 69%
50% - 59%
40% - 49%
Below 40%
2008/09 2009/10
Participation rate
Number of partnerships
Base: All partnerships (450)
Figure 9 shows the number of partnerships achieving different levels of participation in at least three hours of PE and out of hours school sport – and provides comparisons for the last two surveys. The 2009/10 survey shows that a large majority of partnerships (354 out of 450) have participation levels of 50% or above with nearly half of all partnerships achieving levels between 50-59%. This represents a significant increase since 2008/09 when 231 partnerships achieved 50% or above. Furthermore, 131 partnerships have participation levels of 60% or above. Only nine partnerships achieved participation levels below 40% which represents a significant improvement since 2008/09 when 41 partnerships achieved levels below 40%. The lowest performing partnership had 27% of pupils participating in at least three hours of PE and out of hours school sport (the equivalent figure was 20% in 2008/09).

18
3.1 Curriculum time spent on PE
In addition to information about the numbers of pupils participating in at least three hours of high quality PE and out of hours school sport, schools were also asked to provide information about the total curriculum time (in minutes) that all pupils spend taking part in PE in a typical week. This question has been asked consistently over the seven surveys, and so provides a robust measure of trends over time. The chart below, however, looks firstly at the latest results, analysed by year group and school type. Figure 10: Total average curriculum time that all pupils in each year group spend taking part in PE in a typical week – analysis by year group and school type (2009/10)
Base: All pupils in Years 1 - 13 where information given (6,565,106)
123117
126 126 127 127 127 127 131 129 125
104 101
32 28
127
107
145
All pup
ils Y
ears
1 - 11
All pup
ils Y
ears
1 - 13
Year 1
Year 2
Year 3
Year 4
Year 5
Year 6
Year 7
Year 8
Year 9
Year 1
0
Year 1
1
Year 1
2
Year 1
3
Primary
Secon
dary
Specia
l
%
Looking across Years 1 – 13, pupils spent an average of 117 minutes taking part in PE in a typical week during the 2008/09 academic year – or 123 minutes across Years 1 – 11. Rates were similar across Years 1 – 9, but were significantly lower in Years 10 and 11, and in Years 12 and 13. Reflecting this, on average, pupils in secondary schools spent 107 minutes in curriculum PE, compared to 127 minutes in primary schools and 145 minutes in special schools.

19
Figure 11: Total curriculum time that all pupils in each year group spend taking part in PE in a typical week – analysis over time by year group
107
96 96
103
103
104
104
124
123
118
101
98
107
107 11
1
112
113
112
125
124
120
97 94
115
115
116
118
119
119
118 12
6
124
120
97 94
118 121
121
123
123
123
123 12
8
126
123
99 96
121 124
124
125
126
126
126 129
128
123
101
99
123 126
126
127
127
127
127 13
1
129
125
104
10111
1
All pupilsYears 1 -
11
Year 1 Year 2 Year 3 Year 4 Year 5 Year 6 Year 7 Year 8 Year 9 Year 10 Year 11
%
2004/05 2005/06 2006/07 2007/08 2008/09 2009/10
Base: All pupils in Years 1 - 11 where information given (2004/05 - 3,574,969 : 2005/06 - 5,058,169: 2006/07 - 6,300,142: 2007/08 – 6,231,927: 2008/09 – 6,172,948 -
2009/10: 6,159,830)
+30 +3+3+7+6+7+23+23+24+24+30+16
Number of minutes increase 2004/05 – 2009/10
+30 +3+3+7+6+7+23+23+24+24+30+16
Number of minutes increase 2004/05 – 2009/10
Figure 11 shows that the improvement which has been observed in each of the surveys has continued in the latest 2009/10 survey. Based on Years 1 – 11 (for which consistent data is available), the average number of minutes spent on curriculum PE has increased from 107 minutes in 2004/05 to the current 123 minutes, and in the last year has increased from 121 minutes to 123 minutes. The latest survey shows that in the last year there has been an increase in all year groups, even Years 10 and 11 which had previously shown little or no increase. The survey provides a measure of the proportion of pupils who have participated in 120 minutes or more per week of curriculum PE. This has traditionally been based purely on questioning about the number of minutes of curriculum PE that all pupils in a particular year group spend on this activity. However, while in any one year group, pupils up to Year 9 will all be participating in the same amount of curriculum PE, from Year 10 onwards, it is likely that pupils in a year group will be doing varying amounts of PE. Therefore for these year groups a question which refers to the amount of time that all pupils in the year group spend on curriculum PE is a demanding standard, as pupils may participate in varying amounts of PE – with some taking part in significant amounts and others very little. As a result of this, in 2008/09 for the first time an additional question was included for Years 10 – 13 as follows: where the total amount of time that all pupils took part in curriculum PE was less than 120 minutes, schools were asked to indicate the actual number of pupils who participated in at least 120 minutes of PE in a typical week. From this additional information, we can provide revised results for the proportion of those in Years 10 – 13 who participate in at least 120 minutes of curriculum PE each week, for both 2008/09 and 2009/10.

20
Figure 12 shows the original results – which provides consistency over time. Figure 13 shows the revised results.
Figure 12: Proportion of pupils participating in 120 minutes or more of curriculum PE per week – analysis over time
Base: All pupils in Years 1 - 13 where information given (6,565,106)
+59+68+2* +67 +1*+1*+18+18+15+12+14+59+58+61+40
Number of percentage points increase 2003/04 – 2009/10* Year 12, 13 and Years 1-13: comparison between 2008/09 and 2009/10
+59+68+2* +67 +1*+1*+18+18+15+12+14+59+58+61+40
Number of percentage points increase 2003/04 – 2009/10* Year 12, 13 and Years 1-13: comparison between 2008/09 and 2009/10
44
25 25
34 36 37 36
50
34 34
44 45 47 4754 55
63 65 66 6570 72 73
8
79 79 79
3539
81
90
43
8 8
79
5147
9 9
67
2933
767670
3538
777872
79
34
38
81
61
75
38
818478
44
8587888989898685
7880
939391
46
869393
77
8982
8890
959595959392
84
Allpupils
Years 1- 11
Allpupils
Years 1- 13
Year 1 Year 2 Year 3 Year 4 Year 5 Year 6 Year 7 Year 8 Year 9 Year 10 Year 11 Year 12 Year 13
%
2003/04 2004/05 2005/06 2006/07 2007/08 2008/09 2009/10
Figure 12 shows that the proportion of pupils in Years 1 – 11 participating in 120 minutes or more of curriculum PE has increased from 44% in 2003/04 to 84% in the latest survey, with a three percentage point increase being achieved in the last year. In each year group from Years 1 – 6, the overwhelming majority of pupils (92% or more) participate in at least 120 minutes of curriculum PE. In each of Years 7, 8 and 9 more than four in five pupils participate in at least 120 minutes of curriculum PE. This falls to about half of those in Years 10 and 11, and just one in ten of those in Years 12 and 13. It should be noted that looking across the seven surveys there have been increases in all year groups in terms of the proportion of pupils participating in at least 120 minutes of curriculum PE. These increases have been most marked in Years 1 – 6. Figure 13 shows the revised results, which gives higher figures for Years 10 – 12 (Year 10 – 66%; Year 11 – 62%; Year 12 – 25%; Year 13 – 22%). These higher figures result in a slightly increased overall result of 86% of pupils across Years 1 – 11 participating in at least 120 minutes of curriculum PE – up by two percentage points on the comparable figure for 2008/09.

21
Figure 13: Proportion of pupils participating in 120 minutes or more of curriculum PE per week – revised result
Base: All pupils in Years 1 - 13 where information given (6,565,106)
8490
60
23 20
82
6662
2522
80
939391
63
869393
81
8982
8890
95959595939286
Allpupils
Years 1- 11
Allpupils
Years 1- 13
Year 1 Year 2 Year 3 Year 4 Year 5 Year 6 Year 7 Year 8 Year 9 Year 10 Year 11 Year 12 Year 13
%
2008/09 2009/10
Figure 14: Analysis of how three hours of PE and out of hours school sport has been achieved (2009/10)
Base: All pupils in Years 1 - 13 where information given (6,565,106)
Participation in at least 3 hours of PE/out of hours school sport (%)
6 6 7 7 7 7 7 7 9 8 6
51 49 50 54 56 59 62 6350
46 43 42 37
22 20
57 55 57 61 63 66 69 7059
5449 45
40
23 21
1133
AllpupilsYears1 - 11
AllpupilsYears1 - 13
Year 1 Year 2 Year 3 Year 4 Year 5 Year 6 Year 7 Year 8 Year 9 Year10
Year11
Year12
Year13
'Top up' of out ofhours school sport(%)Participation in atleast 3 hours ofcurriculum PE (%)
From Figure 1 we know that 55% of pupils across Years 1 - 13 (or 57% across Years 1 - 11) participate in at least three hours of PE and out of hours school sport. Figure 14 above shows that for most of those achieving this, that this is done through ‘topping up’ the curriculum PE with out of hours school sport, rather than through curriculum PE alone. Indeed only 6% of all those in Years 1 – 13 achieve three hours through curriculum PE alone, and the survey suggests that in Years 10 – 13 there is an even greater reliance on out of hours school sport, as very few pupils have at least three hours of curriculum PE.

22
3.2 Participation in 120 minutes or more of curriculum time PE – gender patterns
The new information collected on gender provides us with an opportunity to examine whether there are any differences by gender in the proportion of pupils participating in 120 minutes or more of curriculum PE. This information is presented below, analysed by individual year group and school type. Figure 15: Total curriculum time that all pupils in each year group spend taking part in PE in a typical week – proportion participating in 120 minutes or more – analysis by gender (2009/10)
Overall 78% of girls in Years 1 – 13 participated in at least 120 minutes of curriculum PE, compared with 80% of boys, and so the difference is very small (the equivalent figures based just on Years 1 – 11 are 83% for girls, 84% for boys). Indeed in each of Years 1 – 6 there is no difference at all in the proportion of pupils participating in at least 120 minutes of curriculum PE. On entry to secondary school, a difference in participation levels by gender starts. At Year 7 this difference is only two percentage points (89% of girls participate in at least two hours of curriculum PE, compared to 91% of boys), rising gradually to reach a four or five percentage point differential in Years 10, 11, 12 and 13. These subtle patterns by year group mean that overall in secondary schools 62% of girls participate in at least 120 minutes of curriculum PE, compared to 66% of boys, while in both primary and special schools there is no difference at all.
8378
92 93 95 95 95 9589 87
81
4945
7 7
94
62
88
80
92 93 95 95 95 9591 90
83
5350
11 11
94
66
8884
All pupil
s Years
1 - 11
All pupil
s Years
1 - 13
Year 1
Year 2
Year 3
Year 4
Year 5
Year 6
Year 7
Year 8
Year 9
Year 1
0
Year 1
1
Year 1
2
Year 1
3
Primary
Secon
dary
Specia
l
%
Girls BoysBase: All pupils in Years 1 - 13 where information given (6,565,106)

23
4. Participation in intra and inter-school competitive activities
All seven surveys in the series have collected information on competitive sporting activities – covering both intra and inter school competition. Over time the number of such questions has increased to reflect the growing importance of this issue.
4.1 Intra-school competitive activities Two questions were asked about intra-school competitive activities (i.e. within the school):
• The first replicated a question that had been used for the previous three years, and asked about the number of pupils involved in intra-school competitive activities during the academic year (excluding sports days, which are covered in a separate question).
• The second question, which was introduced in the 2008/09 survey, asked about regular participation in intra-school competition to provide a more ambitious measure of levels of participation.
Figure 16: Percentage of pupils involved in intra-school competitive activities during this academic year – analysis over time
5866 69
78 77 79
2006/07 2007/08 2008/09 Total Girls Boys
%
Base: All pupils in Years 1 - 11 where information given(2006/07 - 6,299,952: 2007/08 – 6,230,817: 2008/09 – 6,172,543 - 2009/10: 6,159,830)
2009/10
The 2009/10 survey reveals that over the last year there has been a very large increase in the proportion of pupils participating in intra-school competitive activities – up from 69% in 2008/09 to 78% in 2009/10 (based on Years 1 – 11). This represents a continuation of the trend that started in 2006/07 when the question was introduced, and now means that over a period of four years participation in intra-school competition has increased by 20 percentage points from a baseline of 58%. It should also be noted that, based on Years 1 – 13, the comparable figure for 2009/10 is 75%.

24
Figures 17 and 18 show how levels of participation in intra-school competition vary by year group and gender. Trend data is available for year group, but not for gender. The data shows that the very large improvement noted at the total level has been brought about by increases in each and every year group over the last year, with the very largest increase of fourteen percentage points being observed in Year 1. It is particularly pleasing to note that Years 7 – 11, which previously recorded only modest increases between 2007/08 and 2008/09, have this year shown much larger increases. Analysis by gender shows that there is some difference in levels of participation in intra-school competition between boys and girls: 77% of boys had participated during the academic year, compared to 73% of girls. This difference is not apparent at all (see Figure 18) in Year 1 (70% of both girls and boys participate in intra-school competition), and in each of Years 2 – 6 there is only a one or two percentage point difference. However, by Year 10 this difference has risen to five percentage points (67% v. 72%) and at Years 11 (53% v. 60%), 12 (21% v. 32%) and 13 (18% v. 29%) it is much higher than this. Figure 17: Percentage of pupils involved in intra-school competitive activities during this academic year – analysis by year group (2007/08 – 2009/10)
Base: All pupils in Years 1 - 13 where information given (2007/08 – 6,230,817: 2008/09 - 6,557,898 –
2009/10: 6,565,106)
%
66
4955
6670
75 77 80 7772
59
48
66
5662
7174
78 80 78
20 18
78 75 7377
7074
82 84 86 88 86 84 81
69
57
2723
69
80
49
60
74
All pup
ils Y
ears
1 - 11
All pup
ils Y
ears
1 - 13
All girls
Yea
rs 1 -
13
All boy
s Yea
rs 1 -
13
Year 1
Year 2
Year 3
Year 4
Year 5
Year 6
Year 7
Year 8
Year 9
Year 1
0
Year 1
1
Year 1
2
Year 1
3
2007/08 2008/09 2009/10
Base: All pupils in Years 1 - 13 where information given (2007/08 – 6,230,817: 2008/09 - 6,557,898 – 2009/10: 6,565,106)
%

25
Figure 18: Percentage of pupils involved in intra-school competitive activities during this academic year – analysis by year group and gender (2009/10)
Regular intra-school competition was defined as 3 times or more during the academic year for Key Stage 2, and 12 times or more for Key Stages 3 and 4 (note that schools were not asked to supply data for Years 1 and 2). Figure 19 shows that, like participation in intra-school competition in general, regular participation has also increased very substantially over the last year. More specifically it has increased from 28% among Years 3 – 13 in 2008/09 up to 39% in the latest survey. This increase has been driven by very large increases in Years 3 – 6, and good increases, although more modest, in Years 7 – 11. As with general participation in intra-school competition, boys (41%) were slightly more likely than girls (36%) to be regularly taking part in intra-school competition. This difference is apparent in all year groups, but tends to increase as pupils grow older. For example, in Year 3 there is a difference of two percentage points between girls and boys (46% v. 48%); by Year 6 this has increased to a four percentage point difference (58% v. 62%); and by Year 13 it stands at six percentage points (5% v. 11%).
7773
7074
81 8386 87 86
8380
67
53
2118
80
6764
7770
7582
85 87 88 87 85 83
72
60
3229
81
7267
79
All pupil
s Years
1 - 11
All pupil
s Years
1 - 13
Year 1
Year 2
Year 3
Year 4
Year 5
Year 6
Year 7
Year 8
Year 9
Year 1
0
Year 1
1
Year 1
2
Year 1
3
Primary
Secon
dary
Specia
l
%
Girls Boys
Base: All pupils in Years 1 - 13 where information given (6,565,106)

26
Figure 19: Percentage of pupils who regularly participated in intra-school competition during the academic year
28 3034
4145
28 27 2520
16
7 6
3641
4751
5760
38 36 34
2723
9 8
39
All pup
ils Y
ears
3 - 13
All girls
Yea
rs 3-1
3
All boy
s Yea
r 3-13
Year 3
Year 4
Year 5
Year 6
Year 7
Year 8
Year 9
Year 1
0
Year 1
1
Year 1
2
Year 1
3
%
2008/09 2009/10Base: All pupils in Years 3 - 13 where information given (2008/09: 5,472,339 – 2009/10: 5,443,332)
Figure 20: Percentage of pupils who regularly participated in intra-school competition during the academic year - analysis by year group and gender (2009/10)
36
4650
56 58
35 33 31
2419
5 5
4852
5962
40 39 3731
26
12 11
41
AllpupilsYears3 - 13
Year 3 Year 4 Year 5 Year 6 Year 7 Year 8 Year 9 Year10
Year11
Year12
Year13
%
Girls Boys
Base: All pupils in Years 3 - 13 where information given (2008/09: 5,472,339 – 2009/10: 5,443,332)

27
4.2 Sports Days
As in the previous surveys, the latest research shows that 99% of schools once again held at least one sports day or equivalent event during the academic year. 99% of primary schools reported having a sports day, 98% of secondary schools and 96% of special schools.
4.3 Inter-school competition In a similar manner to the questions on intra-school competition, the survey also included two questions on inter-school competition (ie. between schools). Figure 21: Percentage of pupils involved in inter-school competitive activities during this academic year – analysis over time
3541
4449
4652
2006/07 2007/08 2008/09 Total Girls Boys
%
Base: All pupils in Years 1 - 11 where information given (2006/07 - 4,659,409: 2007/08 – 4,615,140: 2008/09 – 6,172,836 - 2009/10: 6,159,830)
2009/10
The latest survey data reveal that half (49%) of pupils across Years 1 – 11 (47% across Years 1 – 13) participated in inter-school competition during the academic year. This continues the upwards trend, with a five percentage point increase in the last year, and a 14 percentage point increase over the last four years.

28
Figure 22: Percentage of pupils involved in inter-school competitive activities during this academic year – analysis by year group (2007/08 – 2009/10)
41
26
39 37
46
55
63
4441
3732
26
44 4237
4845
5358
65
43 4137
32
26
16 16
4744
50 48
5754
6164
70
4643
39
33
26
18 17
49
All pup
ils in
Years
1 - 11
All pup
ils in
Years
1 - 13
All girls
in Y
ears
1 - 13
All boy
s in Y
ears
1 - 13
Year 1
Year 2
Year 3
Year 4
Year 5
Year 6
Year 7
Year 8
Year 9
Year 1
0
Year 1
1
Year 1
2
Year 1
3
2007/08 2008/09 2009/10
Base: All pupils in Years 1 - 13 where information given (2007/08 – 6,230,852: 2008/09 - 6,558,191 – 2009/10: 6,565,106 )
%
An analysis of the information on inter-school competition by year group shows that participation gradually increases year on year until it peaks at 70% in Year 6. It then declines year on year until it reaches a low point in Year 13 at 17%. Over the last year, increases have been achieved for almost all year groups on this measure of participation in inter-school competition. These increases are particularly noteworthy in Year 1 (up from 37% to 48%), Year 2 (up from 48% to 57%), Year 3 (up from 45% to 54%), Year 4 (up from 53% to 61%), Year 5 (up from 58% to 64%) and Year 6 (up from 65% to 70%). Increases in Key Stages 3 and 4 were much smaller.

29
Figure 23: Percentage of pupils involved in inter-school competitive activities during this academic year – analysis by year group and gender (2009/10)
In terms of gender, there is some difference in participation levels in inter-school competition between girls and boys. Half (50%) of boys participated in inter-school competition in the last year, compared to 44% of girls. As was the case with intra-school competition, the difference in participation levels in inter-school competition between girls and boys is not apparent at all at Year 1 (both at 48%), and it only really becomes apparent at Year 4 (60% v. 62%). It then increases year on year until it reaches a large difference at Years 10 (28% v. 38%), 11 (21% v. 32%), 12 (11% v. 24%) and 13 (10% v. 24%).
46 4448
5753
60 6268
43 4035
2821
11 10
58
30
4650 48
57 54
6266
73
49 47 4438
32
24 24
60
40
5052
All pup
ils Y
ears
1 - 11
All pup
ils Y
ears
1 - 13
Year 1
Year 2
Year 3
Year 4
Year 5
Year 6
Year 7
Year 8
Year 9
Year 1
0
Year 1
1
Year 1
2
Year 1
3
Primary
Secon
dary
Specia
l
%
Girls Boys
Base: All pupils in Years 1 - 13 where information given (6,565,106)

30
Turning now to regular inter-school competition, this was defined as 3 times or more during the year for Key Stage 2, and 9 times or more for Key Stages 3 and 4 (the question was not asked of Years 1 and 2). Figure 24: Percentage of pupils who regularly participated in inter-school competition during the academic year
19
10
15
27
36
21 21 2017
14
9 9
18
25
16
22
32
42
22 2119
1613
9 9
21
All pup
ils Y
ears
3 - 13
All girls
Yea
rs 3 -
13
All boy
s Yea
rs 3 -
13
Year 3
Year 4
Year 5
Year 6
Year 7
Year 8
Year 9
Year 1
0
Year 1
1
Year 1
2
Year 1
3
%
2008/09 2009/10
Base: All pupils in Years 3 - 13 where information given (2008/09: 5,472,635 – 2009/10: 5,443,332) Around one in five (21%) of pupils across Years 3 - 13 regularly participated in inter-school competition during the 2009/10 academic year. This represents a small increase over the 2008/09 survey when 19% of Year 3 -13 pupils regularly participated. This improvement has been driven by increases in Years 3 – 6, while in Key Stages 3 and 4 there have been no perceptible changes. Consistent with other questions, boys (25%) were more likely than girls (18%) to regularly take part in inter-school competition (See Figure 25). This difference is perceptible from Year 4 (23% v. 20%) and becomes increasingly noticeable as pupils grow older.

31
Figure 25: Percentage of pupils who regularly participated in inter-school competition during the academic year – analysis by year group and gender (2009/10)
18 1620
29
37
19 17 15 139
5 4
1723
35
46
25 24 23 20 1713 13
25
All pup
ils Y
ears
3 - 13
Year 3
Year 4
Year 5
Year 6
Year 7
Year 8
Year 9
Year 1
0
Year 1
1
Year 1
2
Year 1
3
%
Girls Boys
Base: All pupils in Years 1 - 13 where information given (6,565,106)

32
5. Sports provision
Since the first survey in 2003/04, schools have been asked to indicate from a list which of a range of sports they provide. This year, for the first time, schools were asked to indicate which sports they offered for girls and which for boys. Looking first at sports provided for both girls and boys, schools provided an average of 19.0 of the listed sports. This represents a small increase over the 18.6 sports recorded in the 2008/09 survey. In terms of school type, the latest survey shows that an average of 25.6 sports are provided in secondary schools, 17.6 in primary schools, and 21.5 in special schools. There was no difference in the number of sports provided in areas of different levels of deprivation of the country – those living in more affluent areas had access to the same number of sports as did those living in deprived areas. This was also the case for schools with a high proportion of pupils with an ethnic minority background v. those with a low proportion; schools with a high proportion of children with a Special Educational Need (SEN) v. those with a low proportion; and also for rural v. urban areas. In terms of region, there were some very minor differences, with the average number of sports in the South East being slightly lower than in the North East. Figure 26: Sports and activities provided during this academic year5 (2009/10)
’03 /04
’04 /05
’05 /06
’06 /07
’07 /08
’08 /09
’09 /10
’03 /04
’04 /05
’05 /06
’06 /07
’07 /08
’08 /09
’09 /10
% % % % % % % % % % % % % % Football 97 97 98 98 98 98 98 Volleyball 27 25 28 30 30 29 29 Dance 94 95 96 96 96 95 96 Canoeing 17 20 24 29 30 28 29 Athletics 90 91 92 93 93 93 93 Archery 7 12 16 22 24 25 27 Gymnastics 94 93 95 95 94 92 91 Softball 16 16 17 17 17 17 16 Cricket 85 85 89 90 90 89 89 Martial arts 4 7 9 11 14 14 15 Rounders 86 85 87 88 87 86 85 Mountaineering 7 9 10 12 13 11 14 Swimming 84 83 84 85 85 85 84 Judo 8 6 3 1 1 1 13 Tennis 70 71 76 79 79 79 80 Boccia 5 6 7 8 9 11 12 Netball 84 81 81 81 81 81 79 Rowing 2 3 4 7 9 11 12 Multi-skill clubs 26 39 56 66 74 74 76 Sailing 8 8 9 11 11 11 11 Hockey 77 74 77 78 77 75 73 Karate 4 5 6 8 9 11 11 Outdoors/advent 68 67 71 75 75 74 72 Boxing 1 2 3 4 6 9 10 Fitness 58 66 73 76 77 73 71 Lacrosse 4 4 5 6 7 7 8 Basketball 65 63 67 69 69 70 69 Squash 5 5 6 7 7 8 7 Rugby union (inc tag rugby) 67 71 74 66 68 66 66 Bowls 2 3 4 5 6 6 6
Orienteering 46 48 55 59 62 61 59 Equestrian 3 3 4 5 5 5 6 Cycling 21 27 34 42 46 50 55 Triathlon 1 2 2 3 4 3 5 Golf 14 19 23 31 38 42 44 Skateboarding 1 1 2 2 3 3 4 Badminton 31 32 35 37 39 40 41 Angling 1 1 2 3 3 3 3 Table tennis 26 25 29 31 34 35 36 Goalball 2 2 2 2 2 2 3 Rugby league (inc tag rugby) 12 11 12 33† 34 37 35 Kabaddi * 1 1 1 1 2 2
Base: All schools (2003/04 - 6,574: 2004/05 - 11,498: 2005/6 - 16,898: 2006/07 - 21,745: 2007/08 – 21,631: 2008/09 – 21,464:
2009/10 – 21,436)† surveys prior to 2006/07 did not include ‘tag rugby’ in definition
5 The additional sports added in 2007/08 and 2008/09 have not been included in this table. Latest (2009/10) figures for the new sports are: cheerleading – 37%; trampolining – 22%; yoga – 22%; circus skills – 18%; handball – 15%; fencing – 12%; baseball – 7%)

33
Figure 26 shows the proportion of schools providing each of the listed sports, and includes trends from all seven surveys. Football heads the list once again. Any changes in the proportion of schools providing a particular sport are generally small (usually a percent or two), but of particular note is the increase in the provision of cycling (up from 50% in 2008/09 to 55% in 2009/10) and judo (up from 1% to 13%). Looking at the longer term, many sports have shown dramatic increases over the last seven years – the following have all shown increases of at least ten percentage points over the last seven years:
• Tennis (up from 70% in 2003/04 to 80% in 2009/10) • Multi-skill clubs (up from 26% to 76%) • Fitness (58% to 71%) • Orienteering (46% to 59%) • Cycling (21% to 55%) • Golf (14% to 44%) • Badminton (31% to 41%) • Table tennis (26% to 36%) • Rugby league (12% to 35%) • Canoeing (17% to 29%) • Archery (7% to 27%) • Martial arts (4% to 15%) • Rowing (2% to 12%).
In terms of gender, on average, an equal number of sports were available to both boys and girls. This was true both at a primary and a secondary level. However, while at a primary level there are no differences at all in terms of the sports available to boys and girls, at a secondary level there are a number of differences which are masked by the fact that the overall number of sports offered is the same – i.e. girls in secondary schools are more likely than boys to be offered some sports, and boys are more likely than girls to be offered other sports. Figure 27 shows an analysis of the sports offered in both primary and secondary schools. For secondary schools the table also shows those sports which are offered to boys and those which are offered to girls. There are large differences between primary and secondary schools in terms of the provision for some sports. Swimming, multi-skill clubs and cycling are much more common in primary schools than in secondary schools. In contrast, there are a very large number of sports that are much more commonly offered by secondary schools than by primary schools – rounders, netball, hockey, fitness, basketball, rugby union, orienteering, golf, badminton, table tennis, volleyball, canoeing, softball, martial arts, mountaineering, sailing, boccia, rowing, boxing, squash, lacrosse, cheerleading, trampolining, yoga, handball, baseball and equestrian all fall into this category. In terms of sports offered to girls as opposed to boys at a secondary level (and vice versa), the key differences are as follows: Sports more likely to be offered to girls than to boys in secondary schools:
• Dance (97% v. 86%) • Gymnastics (92% v. 89%) • Rounders (97% v. 85%) • Netball (96% v. 58%) • Hockey (82% v. 78%) • Trampolining (78% v. 73%)

34
• Cheerleading (64% v. 37%) • Yoga (35% v. 23%) • Equestrian (13% v. 10%)
Sports more likely to be offered to boys than to girls in secondary schools: • Cricket (96% v. 85%) • Basketball (97% v. 94%) • Rugby union (85% v. 70%) • Golf (66% v. 59%) • Rugby league (38% v. 30%) • Table tennis (86% v. 83%) • Softball (73% v. 57%) • Boxing (37% v. 33%) • Baseball (21% v. 14%)
Figure 27: Sports and activities provided during this academic year – analysis by school type and gender (2009/10)
Primary Secondary Primary Secondary
Provided to any
Provided to any Girls Boys Provided
to any Provided
to any Girls Boys
% % % % % % % % Football 98 99 98 99 Trampolining 9 77 78 73 Dance 97 97 97 86 Yoga 18 35 35 23 Athletics 92 100 99 99 Circus skills 19 13 13 12 Gymnastics 91 93 92 89 Softball 4 72 57 73 Cricket 88 97 85 96 Martial arts 12 27 26 25 Rounders 84 96 97 85 Handball 10 40 .36 39 Swimming 88 67 66 65 Mountaineering 12 23 22 22 Tennis 80 88 87 86 Judo 13 19 18 18 Netball 80 94 96 58 Boccia 7 22 22 22 Multi-skill clubs 83 49 48 47 Fencing 12 16 15 15 Hockey 72 84 82 78 Rowing 6 42 40 40 Outdoors/advent 70 76 74 74 Sailing 7 22 21 21 Fitness 65 98 97 97 Karate 12 11 10 10 Basketball 62 98 94 97 Boxing 5 38 33 37 Rugby union (inc tag rugby) 64 86 70 85
Lacrosse 5 22 21 19
Orienteering 57 71 70 69 Squash 4 21 19 21 Cycling 57 42 40 41 Baseball 4 20 14 21 Golf 39 66 59 66 Bowls 5 8 8 8 Badminton 29 96 95 95 Equestrian 2 13 13 10 Table tennis 25 86 83 86 Triathlon 3 11 10 11 Cheerleading 33 62 64 37 Skateboarding 3 11 9 10 Rugby league (inc tag rugby) 35 39 30 38
Angling 1 9 8 9
Volleyball 19 78 75 74 Goalball 2 5 5 5 Canoeing 26 37 35 36 Kabaddi 1 7 6 6 Archery 26 28 27 27
Base: All schools (2003/04 - 6,574: 2004/05 - 11,498: 2005/6 - 16,898: 2006/07 - 21,745: 2007/08 – 21,631: 2008/09 – 21,464:
2009/10 – 21,436)† surveys prior to 2006/07 did not include ‘tag rugby’ in definition

35
6. Club links
On average schools indicated that they had links to clubs for 9.1 of the listed sports. This compares favourably to the average of 8.2 clubs recorded in the 2008/09 survey. As in the previous study, the 2009/10 survey found that the average number of clubs was higher in secondary schools (13.8) than in primary (8.3) or special (6.8) schools: all of these figures represent increases on the 2008/09 levels. Again, as in 2008/09, it is apparent that those schools located in areas of relatively high deprivation and those with a relatively high proportion of children from an ethnic minority background tend to have slightly lower numbers of club links than do other schools. There is also some small regional variation with those schools in the North East, Yorkshire and Humberside and the East of England having relatively high numbers of club links. Figure 28: Club links during this academic year6 (2009/10)
’03 /04
’04 /05
’05 /06
’06 /07
’07 /08
’08 /09
’09 /10
’03 /04
’04 /05
’05 /06
’06 /07
’07 /08
’08 /09
’09 /10
% % % % % % % % % % % % % %
Football 73 75 78 78 79 78 79 Outdoors/adventurous 9 8 10 10 10 11 12
Cricket 45 46 52 56 57 58 61 Boxing 2 1 4 5 7 9 11
Dance 28 32 40 45 49 50 55 Orienteering 5 5 7 7 8 9 10
Swimming 26 29 37 42 45 46 51 Sailing 8 4 5 5 6 7 8 Rugby union (inc tag rugby) 39 41 46 44 48 47 50 Equestrian 2 2 4 6 7 7 8
Tennis 27 30 36 39 40 42 47 Archery 2 3 3 4 6 6 8
Athletics 32 33 38 40 43 43 46 Canoeing 5 4 5 6 6 6 7
Gymnastics 24 26 31 35 40 40 44 Squash 3 3 4 5 6 7 7
Netball 26 26 29 30 32 32 34 Volleyball 3 2 2 3 4 5 6
Basketball 27 25 28 28 30 30 34 Rowing 2 2 3 3 4 4 6
Multi-skill clubs 7 11 22 28 31 30 32 Bowls 1 1 2 3 4 4 5
Golf 9 11 14 18 22 26 30 Rounders 5 4 4 4 4 4 4
Hockey 20 19 22 23 25 24 27 Triathlon 1 1 2 2 3 3 4 Rugby league (inc tag rugby) 10 9 10 18† 20 21 22 Lacrosse 1 1 2 2 2 2 3
Badminton 10 10 12 14 17 17 20 Mountaineering 4 1 2 2 2 2 2
Martial arts 6 7 11 14 17 17 19 Boccia 1 1 1 1 1 2 2
Fitness 11 12 15 16 19 17 19 Angling 1 1 1 2 2 2 2
Karate 7 8 11 14 17 16 18 Skateboarding 1 1 1 1 1 1 2
Judo 8 10 12 13 13 15 16 Softball * 1 * * 1 1 1
Table tennis 8 7 8 10 11 13 15 Kabaddi * * * * * * *
Cycling 4 5 6 8 10 12 15 Goalball * * * * * * 1
Base: All schools (2003/04 - 6,574: 2004/05 - 11,498: 2005/6 - 16,898: 2006/07 - 21,745: 2007/08 – 21,631: 2008/09 – 21,464 : 2009/10 – 21,436) † surveys prior to 2006/07 did not include ‘tag rugby’ in definition
6 A number of ‘new’ sports were added to the questionnaire in 2007/08 and in 2008/09 – these are not included in this table. Latest (2009/10) figures for the new sports are: cheerleading – 20%; trampolining – 16%; yoga – 6%; circus skills – 3%; handball – 2%; fencing – 7%; baseball – 1%)

36
Figure 28 shows the proportion of schools with links to clubs, presenting data for all seven surveys (note that the additional sports added in 2007/08 and 2008/09 are not included). It shows that football, cricket, dance, rugby union, swimming, athletics and tennis have consistently featured at the top of the list. The main increases in club links over the last year have been for:
• Dance (up from 50% to 55%) • Swimming (46% to 51%) • Tennis (42% to 47%)
There were no significant decreases in club links for specific sports either since 2008/09 or since the first survey 2003/04.

37
7. Community sports and multi-skill clubs
The survey provides a measure of the proportion of pupils who have participated in community sports, dance or multi-skill clubs with links to the school during the academic year. There has been a question on this issue in all seven of the surveys in the series, although the definition of which year groups are asked the question has changed over time7. Figure 29: Percentage of pupils participating in one or more community sports, dance or multi-skill clubs with links to the school during this academic year – analysis over time
1922
2729
32 3133
2003/04 2004/05 2005/06 2006/07 2007/08 2008/09 2009/10
%
Base: All pupils in Years 2 - 11 where information given (2003/04 - 1,838,265: 2004/05 - 3,198,024: 2005/06 - 4,605,170: 2006/07 - 5,764,781:
2007/08 – 5,698,515: 2008/09 – 5,621,273: 2009/10 – 5,591,218) The 2008/09 results appeared to show that progress on this measure had stalled at around 30%. However the latest information suggests otherwise and shows a healthy increase of two percentage points on the 2008/09 findings. This now means that over the last seven years there has been an increase from 19% of pupils in Years 2 – 11 participating in community sports, dance or multi-skill clubs with links to their school, up to the current 33%. Looking more widely at Years 2 – 13, the 2009/10 surveys shows that 32% of these pupils took part in community sports, dance and multi-skill clubs – up from 30% in the previous year when the new question definition was introduced. Figure 30 shows the results for the last three years by individual year group. It shows that participation in community sports, dance or multi-skill clubs increases as children progress through their primary years, peaking at Years 5 and 6. It then drops sharply on entry to Key Stage 3, and declines each and every year after that.
7 In the last two surveys this question was asked about all those in Years 2 – 13, while in previous surveys it concentrated just on those in Years 2 – 11.

38
However, encouragingly, the latest survey shows that since the 2008/09 survey progress has been made (albeit often very small) in every year group. Figure 30: Percentage of pupils participating in one or more community sports, dance or multi-skill clubs with links to the school during this academic year – analysis by year group
3235
3841
43 44
3028
2523
19
31 3034
3740 41 42
2927
2522
19
14 13
3236
3841
43 43
3229
2724
2016 15
33
AllpupilsYears2 - 11
AllpupilsYears2 - 13
Year 2 Year 3 Year 4 Year 5 Year 6 Year 7 Year 8 Year 9 Year10
Year11
Year12
Year13
2007/08 2008/09 2009/10Base: All pupils in Years 2 - 13 where information given (2007/08 – 5,698,515: 2008/09 – 6,006,628:2009/10 –
5,996,494) It should be noted that information was not collected separately for girls and boys on this question, due to the potential complexity of collecting this data, and the additional burden that this would place on schools.

39
8. Gifted and talented pupils
Schools were asked to provide the numbers of pupils who are currently registered as gifted and talented because of their ability in PE and/or school sport. Responses were collected for Years 5 – 13, as before this it is difficult to identify pupils in this way. Trend data, however, are only available for Years 5 – 11, as shown below. Figure 31: Percentage of pupils registered as gifted and talented because of their ability in PE and/or school sport – analysis over time
Base: All pupils in Years 5 - 11 where information given (2003/04 - 1,339,603: 2004/05 - 2,284,366: 2005/06 - 3,254,461: 2006/07 - 4,092,737:
2007/08 – 4,051,754: 2008/09 – 4,022,617:2009/10 - 3967618 )
3
5
6
7 7 7
8
2003/04 2004/05 2005/06 2006/07 2007/08 2008/09 2009/10
%
During the 2009/10 academic year, 8% of pupils across Years 5 – 11 were registered as gifted and talented because of their ability in PE and/or school sport (extending the coverage to include Years 5 – 13 also results in a figure of 8% registration). This is a slight increase over the levels recorded in the last three surveys, and means that since the start of survey series levels of registration have nearly tripled from 3% to 8%.

40
Figure 32: Percentage of pupils currently registered as gifted and talented because of their ability in PE and/or school sport – analysis by gender within year group and school type (2009/10)
7 78
7 78
76
54
87
5
9
11
8 89
8 87 7
10
8
6
8
All pup
ils Y
ears
5 - 13
Year 5
Year 6
Year 7
Year 8
Year 9
Year 1
0
Year 1
1
Year 1
2
Year 1
3
Primary
Secon
dary
Specia
l
%
Girls Boys
Base: All pupils in Years 5 - 13 where information given (4,372,894) The 2009/10 survey provides the opportunity to evaluate whether there are differences in numbers of registrations between girls and boys. Figure 32 shows the relevant data by gender within year group and school type. In general registrations are lower in Years 12 and 13, and reflecting this they are lower in secondary schools than in primary schools (they are also lower in special schools). However, in terms of gender, there is very little difference in terms of numbers of registrations – overall 7% of girls in Years 5 – 13 are registered compared to 8% of boys. This small difference exists in all year groups although it is slightly more exaggerated in Years 5 and 6, and then again in Years 11, 12 and 13. The difference by gender is also slightly more pronounced in primary schools compared with secondary and special schools.

41
9. Sports volunteering and leadership
This section looks at the final question from the main survey, namely the number of pupils who are actively involved in sports volunteering and leadership during the academic year. Since the 2007/08 survey, this question has covered all Years (1 – 13). Prior to this, the question focused on a smaller range of year groups. As shown in Figure 33, trend data are therefore only presented for the last three surveys. However, we are able to track this measure over all seven surveys for Years 10 – 13. Figure 33: Percentage of pupils actively involved in sports volunteering and leadership this academic year – analysis by year group and school type (2007/08 – 2009/10)
16
4
97
10
27
34
12 13
17
26
19
13
9
19
5
108
12
29
38
16 1720
29
21
14
10
24
10
1513
17
36
45
2224
28
34
25
16
12
AllpupilsYears1 - 13
Year 1 Year 2 Year 3 Year 4 Year 5 Year 6 Year 7 Year 8 Year 9 Year10
Year11
Year12
Year13
2007/08 2008/09 2009/10Base: All pupils in Years 1 - 13 where information given (2007/08 – 6,597,117: 2008/09 - 6,557,171: 2009/10 –
6,565,106) Since the 2008/09 survey, the proportion of pupils from Years 1 – 13 who have been actively involved in sports volunteering and leadership during the academic year has increased from 19% to 24%. This increase is substantially higher than the three percent increase observed between 2007/08 and 2008/09. As observed in previous years, involvement varied by year group, with those in Years 5, 6 and 10 being the most likely to be involved. Consistent with the overall increase in involvement, since 2008/09, increases can be observed for every year group (Years 1-13). The largest increases can be seen for Years 5, 6, 7, 8 and 9.

42
Figure 34: Percentage of pupils actively involved in sports volunteering and leadership this academic year – analysis by gender within year group and school type (2009/10)
25
10
1613
18
38
48
23 24
29
35
25
1410
24 25
1210
1513
17
34
43
22 2327
33
25
1815
2225
13
23
All pup
ils Y
ears
1 - 13
Year 1
Year 2
Year 3
Year 4
Year 5
Year 6
Year 7
Year 8
Year 9
Year 1
0
Year 1
1
Year 1
2
Year 1
3
Primary
Secon
dary
Specia
l
%
Girls Boys
Base: All pupils in Years 1 - 13 where information given (6,565,106) Active involvement in sports volunteering and leadership during the academic year varied by gender with girls being marginally more likely to have been involved (25% compared with 23% across Years 1 – 13). As we might expect this difference varies by year group and is at its largest for Years 5 and 6. Conversely, in Years 12 and 13, boys are more likely to have been involved in sports volunteering and leadership during the academic year than girls. These differences by year group are reflected in the variation between primary and secondary schools.

43
Figure 35: Percentage of pupils actively involved in sports volunteering and leadership this academic year – analysis over time (Years 10 – 13 only)
Base: All pupils in Years 10 -13 where information given (2003/04 - 533,302: 2004/05 - 807,264: 2005/06 - 2,197,167: 2006/07 - 1,556,506:
2007/08 – 1,550,990: 2008/09 -1,548,006: 2009/10 – 1,558,769)
2522
2017
1311
9
2009/102008/092007/082006/072005/062004/052003/04
%
As discussed it is also possible to look at longer-term trends for Years 10 to13 (presented in Figure 35). Since the start of the survey series in 2003/04, levels of involvement in volunteering and leadership have increased consistently, year on year. Starting at just 9% in 2003/04, levels of involvement have increased to 25% in the latest survey based on these year groups. There has been an increase of three percentage points on this measure since 2008/09.

44
Figure 36: Percentage of pupils actively involved in sports volunteering and leadership this academic year – analysis by region (Years 1 – 13 – 2009/10)
1921 20
1821 20 19 18
15 15
2427 27 26 25 25
23 2220 20
All pup
ils ye
ars 1-
13Eas
t
North W
est
Lond
on
Yorks &
Hum
ber
North E
ast
South
Wes
t
South
East
Wes
t Mids
East M
ids
%
2008/09 2009/10
Base: All pupils in Years 1- 13 where information given (2008/09- 6,557,171: 2009/10 6,565,106) As shown in Figure 36, there are some interesting variations in active involvement in sports volunteering and leadership by region. Involvement levels are highest in the East, the North West, London, Yorkshire and Humberside and the North East (all of which have involvement levels of 25% or above). Despite these regional variations, the overall increase in levels of active involvement in sports volunteering and leadership since 2008/09 can be observed in all regions - with increases of at least four percent in each and every region. The largest increases can be seen in London and the North West. In all regions 20% or more of all pupils in Years 1 – 13 were reported to have been actively involved in sports volunteering and leadership in the last academic year.

45
10. Summary of gender patterns in participation in PE and school sport
As has already been stated, the 2009/10 survey provided for the first time separate data on girls’ and boys’ participation in PE and school sport. These differences have been highlighted throughout this report. In this chapter, however, we draw together the key findings from this new element of the survey. The measures on gender are summarised in the table below. Figure 37: Summary of gender patterns
Total
Primary
Secondary
Base sizes Girls Boys Girls Boys Girls Boys
% of pupils who participate in at least 3 hours of PE and out of hours school sport (Years 1-13)
6,565,106
52 58 62 66 41 50
% of pupils who participate in at least 120 minutes of curriculum PE (Years 1-13)
6,565,106 78 80
94
94
62
66
% of pupils involved in intra-school competitive activities in the academic year (Years 1-13)
6,565,106 73 77
80
81
67
72
% of pupils regularly involved in intra-school competitive activities (Years 3-13)
5,443,332 36 41
53
56
26
32
% of pupils involved in inter-school competitive activities in the academic year (Years 1-13)
6,565,106 44 50
58
60
30
40
% of pupils regularly involved in inter-school competitive activities (Years 3-13)
5,443,332 18 25
26
30
14
21
% of pupils registered as gifted and talented because of ability in PE/school sport (Years 5-13)
4,372,894 7 8
8
10
7
8
% of pupils involved in sport volunteering and leadership (Years 1-13)
6,565,106 25 23
24
22
25
25
Average number of sports provided in schools 21,436 18.7 18.6
17.5
17.4
24.5
24.1
From the table above, it is clear that despite having access to the same number and variety of sports, girls are slightly less likely than boys to participate in PE and sport. This is apparent – to a lesser or greater extent - in all of the survey measures. However, an analysis of the information by primary v. secondary reveals a more complex pattern. It shows that the differences between the genders are much less marked in primary schools than in secondary schools. Indeed at primary level girls are (just about) as likely as boys to participate in 120 minutes of curriculum PE; to take part in intra-school competitive activities; to take part in inter-school competitive activities; to be registered as gifted and talented because of their ability in PE/school sport; and to be involved in sport volunteering and leadership. However, it is interesting and important to note that even at primary level girls are less likely than

46
boys to participate in at least three hours of PE and out of hours school sport. This difference is apparent (albeit in a small way) at Year 1 (see Figure 8) where 55% of girls take part in at least three hours, compared to 58% of boys, and it becomes more and more exaggerated as pupils become older. At secondary level there are quite large differences between the sexes on most of the survey measures – with the exceptions of the proportion of pupils who are registered as gifted and talented, and the proportion who take part in sport volunteering and leadership. However, on participation in at least 3 hours of PE and out of hours school sport; participation in 120 minutes of curriculum PE; taking part in intra-school competitive activities (both regularly or in the last year); and taking part in inter-school competitive activities (both regularly or in the last year), it is clear that boys are much more likely to be involved than are girls. It is also the case that these differences tend to increase as pupils progress though Key Stages 3 and 4.
47
11. Further Education
The Further Education Sport Co-ordinators (FESCos) element of the survey was introduced in 2008/09, and was repeated in the 2009/10 survey. This part of the study aimed to provide some general feedback on Further Education (FE) colleges and how the strategy was being implemented in these. Please note that all the results presented in this chapter relate to 16 – 19 year old FE students, studying full-time. 8 Also note that FE colleges are generally large, with students working on hugely varying timetables. Because of this it was not possible to include questions about total numbers of students participating in set amounts of sport, as the infrastructure is not available to collect this information.
11.1 Sporting events and activities organised Figure 38: Number of sporting events/activities organised at FE college during academic year
Base: All colleges with full-time FE pupils where information given (2008/09- 352; 2009/10 - 355)
6%
46%41%
76%66%
39%20%
37%32%
57%
75%59%
47%48%
20%27%
8%
56%78%
28%36%
20%33%
19%38%
7%11%
4%6%
92%98%
3%
3%
10%
5%
36%32%
15%
2%
64%
2008/092009/10
2008/092009/10
2008/092009/10
2008/092009/10
2008/092009/10
2008/092009/10
2008/092009/10
None 1 - 9 10 +
Average number of events
94
18
15
13
5
10
154
2009/102008/09
57
11
10
7
4
4
92
Participation sessions/clubs
British College of Sport (BCS) events
Other local leagues/ competitions
One-off festivals/events
Other national leagues/ competitions
All types of event
Other
FESCos were asked to indicate the numbers of sporting events and activities which they had organised during the academic year, using a number of different categories. Overall, FESCos reported that they had organised an average of 154 events – up from 92 events in the previous academic year. The largest proportion of these events were participation sessions/clubs – of which FESCos had organised an average of 94, up from 57 in the previous year. British College of Sports events, other local leagues/competitions, and one-off festivals/events also showed considerable increases in the numbers organised when compared to the 2008/09 8 Around 68% of 16-18 year olds in 2009 were in full-time education; 15% were in some form of education and training (ie. Work Based Learning, Employer Funded Training); 8% were in work; and 9% were Not in Education, Employment or Training (NEET). (Source: DfE (2010). Statistical First Release: Participation in education, training and employment by 16 – 18 year olds. SFR 18/2010)

48
results. Other national leagues/competitions showed the smallest growth in numbers organised (five up from four in 2008/09), with two in five FESCos not organising any of these events. As was the case in 2008/09, medium sized and larger colleges (with 1,300 or more full-time students aged 16 – 19) once again tended to organise more events.
11.2 Sports participation FESCos estimated that 23% of all full-time pupils aged 16 – 19 had taken part in at least one of the sporting events that they had organised during the academic year. This represents an increase of seven percentage points on the figure reported in the 2008/09 survey. In smaller colleges (with less than 1,300 full-time students aged 16 – 19) reported participation levels were higher at 31%, while in the largest colleges (with 2,100 students or more) reported levels of participation were lower at 19%. These patterns mirror those observed in the 2008/09 survey. As shown in Figure 39 below, FESCos indicated that, on average, 12% of students had taken part in intra-college competitive activities during the academic year. This represents a substantial increase over the 7% reported in the 2008/09 survey. Furthermore 5% of students regularly participated in such events (defined as 12 times or more during the year) – up from 3% in the previous survey. There was also an increase in the proportion of students who had participated in inter-college competitive activities, although the increase was not as marked as for intra-college activities. Specifically 7% participated in inter-college events, representing an increase of two percentage points over the 2008/09 figures. Again those in the largest colleges were less likely to have participated (5%). FESCos indicated that 5% of students regularly took part in inter-college activities (defined as 9 times or more during the year). Figure 39: Percentage of FE students who participated in sporting activities during academic year
23
12
7
5
5
%
16
7
5
3
4
Participate in FE sportevents/activities
Participate intra collegecompetitive activities
Participate in inter collegecompetitive activities
%
Total involved
Regularly participated
Base: All full-time FE pupils where information given (2008/09- 731,712; 2009/10- 739482)
2008/09 2009/10

49
11.3 Sports provision and club links
FESCos were asked to provide information on the sports and activities that were provided by the college during the academic year – distinguishing between those provided on the college site and those provided elsewhere. They were also asked to indicate for which sports they had links to clubs.
Figure 40: Sports/activities provided by college and links to clubs during the academic year
Available On site Clubs links Available On site Clubs links
% % % % % % % % % % % %
08/09 09/10 08/09 09/10 08/09 09/10 08/09 09/10 08/09 09/10 08/09 09/10 Football 99 99 72 77 74 80 Rowing 16 30 9 22 10 11
Basketball 89 94 72 76 49 64
Rugby league
(inc tag rugby) 26 28 18 20 19 21
Fitness 87 94 75 82 38 45 Boccia 17 28 14 25 4 5
Badmington 84 89 67 74 23 36 Cycling 19 27 6 8 6 8
Dance 81 89 76 84 32 41 Mountaineering 18 26 1 3 5 6
Table tennis 72 81 65 74 17 23 Archery 14 20 9 11 7 10
Netball 71 78 57 65 36 43 Handball 12 19 9 16 1 1
Rugby Union
(inc tag rugby) 68 70 44 43 56 60
Sailing 12 18 1 1 5 10
Cricket 62 69 37 47 32 46 Equestrian 12 16 6 8 4 8
Outdoors/adv
ent 51 66 8 12 16 19
Judo 8 16 6 12 8 13
Volleyball 53 65 47 55 15 21 Softball 10 14 8 11 1 3
Athletics 53 59 17 23 32 38 Karate 9 14 6 12 8 12
Tennis 47 56 26 29 23 31 Gymnastics 11 12 8 7 11 12
Swimming 42 56 7 7 21 22 Fencing 10 12 7 10 6 9
Rounders 43 54 32 46 3 4 Lacrosse 6 11 5 9 2 3
Yoga 39 54 36 50 11 14 Circus skills 5 7 4 6 2 1
Golf 42 49 6 10 24 30 Triathlon 4 7 1 3 4 5
Marital arts 34 48 28 41 20 35 Goalball 3 7 2 6 1 1
Hockey 40 45 21 26 26 29 Angling 4 6 1 2 3 3
Trampolining 41 44 27 31 13 18 Bowls 4 6 1 4 2 3
Boxing 28 43 22 32 19 30 Skateboarding 4 6 2 1 1 3
Canoeing 29 37 3 4 11 12 Baseball 3 6 3 5 1 3
Orienteering 28 37 8 11 6 8 Kabaddi 2 4 1 4 0 -
Squash 21 32 8 6 7 14 Other 42 49 28 34 10 15
Cheerleading 26 31 21 27 12 13 None 0 0 5 3 4 4
Base: All colleges with full-time FE pupils where information given (2008/09- 352; 2009/10 - 355)
Colleges provided an average of 19.3 of the listed sports, which represents an average increase of just over 3 sports per college when compared to the 2008/09 results. Smaller colleges had slightly fewer sports available at 17.1. The most commonly available sports were football, basketball, fitness, badminton, dance, table tennis and netball. Large increases in availability were recorded for

50
many of the sports, but the following all recorded increases of more than ten percentage points when compared to the 2008/09 survey:
• Volleyball increased from 53% to 65% • Outdoors and adventurous activities increased from 51% to 66% • Rounders increased from 43% to 54% • Swimming increased from 42% to 56% • Yoga increased from 39% to 54% • Martial arts increased from 34% to 48% • Canoeing increased from 29% to 37% • Boxing increased from 28% to 43% • Squash increased from 21% to 32% • Boccia increased from 17% to 28% • Rowing increased from 16% to 30%
No sports displayed a decrease in availability. Out of the average of 19.3 sports provided in each college, 12.7 were provided on site. This compares to 10.4 sports being provided on site in the 2008/09 survey. Dance, fitness, football, basketball, badminton, and table tennis were again the most widely available sports on site. As with general provision, many of the sports showed increases in availability on site when compared to the 2008/09 survey – in particular the following achieved increases of eight percentage points or more:
• Dance – up from 76% to 84% • Table tennis – up from 65% to 74% • Netball – up from 57% to 65% • Volleyball – up from 47% to 55% • Yoga – up from 36% to 50% • Cricket – up from 37% to 47% • Rounders – up from 32% to 46% • Martial arts – up from 28% to 41% • Boxing – up from 22% to 32% • Boccia – up from 14% to 25% • Rowing – up from 9% to 22%
Colleges had links to an average of 9.4 different clubs, compared to 7.4 clubs in the 2008/09 survey. The largest increases in terms of club links (all of eight percentage points of more) were for:
• Basketball – up from 49% to 64% • Cricket – up from 32% to 46% • Dance – up from 32% to 41% • Badminton – up from 23% to 36% • Martial arts – up from 20% to 35% • Tennis – up from 23% to 31% • Boxing – up from 19% to 30%
It is possible to compare these findings with the number of sports available in secondary schools (as measured by the main school survey). Overall the figures for FE colleges are much lower. Secondary schools have an average of 25.6 listed sports available and have links to an average of 13.8 different clubs.

51
Figure 41: Numbers of local schools/educational institutions college has sports related links with
31%25%
21%10%
11%
47%37%
35%25%
5%
39%36%
56%55%
62%
52%62%
65%74%
26%18%
30%39%
23%
19%27%
1%1%
0%1%
69%81%1%
18% 62%
35%
2008/092009/10
2008/09
2009/10
2008/092009/10
2008/092009/10
2008/09
2009/10
2008/092009/10
None 1 - 9 10 +
Average number of sport related links
10
7
5
1
1
25
Primary schools
FE colleges
Secondary schools
Special schools
HE institutions
Total
2009/102008/09
15
11
7
2
37
2
Base: All colleges with full-time FE pupils where information given (2008/09- 352; 2009/10 - 355) During the 2009/10 academic year, colleges had sports related links to an average of 37 different schools/educational establishments, which represents a very large increase on the average of 25 recorded in the previous 2008/09 study. The 37 links were, on average, made up of 15 primary schools, 11 FE colleges, 7 secondary schools, 2 special schools and 2 HE institutions. All of these have shown increases in the last year – thereby driving the increase in total average number. In 2009/10, only 1% of colleges had no such sporting links, and 81% of colleges had more than ten.
11.4 Sports volunteering and leadership The survey estimates that 4% of full-time students aged 16 – 19 are actively involved in sports volunteering, an increase of one percentage point over the 2008/09 figure. This compares with 15% of pupils in Years 12 -13 being involved in sports volunteering and leadership, as recorded in the schools survey.

52
12. Conclusions
This is the seventh in the series of PE and sport surveys which have been conducted annually since 2003/04 in schools across England. The surveys have provided a valuable means of tracking changes in participation in PE and sport in schools (and more recently FE colleges) across the country. It is clear that considerable progress has been made across the seven year period, and that this progress has taken place bit by bit, year by year. Indeed the results of the seven surveys are very unusual in that on almost all measures there have been improvements each and every time the survey has been conducted. The 2008/09 survey laid down a new baseline for participation in three hours of PE and out of hours school sport – prior to that the research had looked at two hours. The latest results show there has been an increase of five percentage points on this baseline, with participation in three hours of PE and out of hours school sport now standing at 55% of pupils in maintained schools across England. There is, however, still scope for improvement on this measure (participation in two hours of PE and out of hours school sport was first measured in 2003/04 at 62% and rose over a five year period to 90% in 2007/08) and it will be important to continue to monitor it in the future. All seven surveys have collected information on competitive activities – at both an intra- and inter-school level. A major finding from this year’s survey has been the very considerable increase in intra- school competition, up from 69% across Years 1 - 11 in 2008/09 to the current level of 78%. This increase is also apparent in the FE survey. This represents very considerable progress, which has also been echoed in the big increase in regular participation in intra-school competition (up from 28% in 2008/09 among Years 3 – 13 to 39%). There was also an increase (though smaller) in levels of inter-school competition. Over the seven years the surveys have provided insight into the variations in patterns of participation by year group. As a broad statement, participation levels tend to be highest in Years 1 - 6, and this is also where the most progress has been made. On entry to Key Stage 3, participation starts to decline, and although considerable progress has been made in both Key Stage 3 and Key Stage 4, take up here remains lower. In particular the widening of the survey in 2008/09 to encompass Years 12 and 13 highlighted the much lower levels of participation among this group. The collection of information on differences between the sexes in terms of participation in PE and school sport has added a new dimension to the survey. It has shown that on the whole, boys score more highly on most (but not all) of the survey measures, and that this difference between the sexes really starts to show on entry to Key Stage 3, and becomes more exaggerated as pupils progress through Key Stage 3 into Key Stage 4. However, on the key measure of participation in at least three hours of PE and school sport, the difference in the sexes is apparent even in Year 1, although at this stage it is only quite small. There is an exception to the general rule that boys score more highly on the survey measures than do girls. Specifically, girls are marginally more likely than boys to be actively involved in sports volunteering and leadership.

53
The 2009/10 data on differences between the sexes gives us a baseline on this issue, which will allow partnerships to understand how they compare to other partnerships on this issue. The FE element of the study was introduced in 2008/09 and while of necessity the scope of it is more limited (precise information on levels of student participation are not provided through this source), it has nonetheless yielded useful data which the 2009/10 study has tracked. The latest survey results highlighted a large number of improvements on many of the FE measures. The numbers of events organised has increased very substantially (from an average of 92 in 2008/09 to 154 in 2009/10); FESCos’ estimates of the proportion of full-time students aged 16 – 19 who have taken part in events they have organised have increased from 16% to 23% over a period of one year; and intra-college activity has also increased substantially.

54
Appendix A – Detailed tables of results for individual Partnerships and Local Authorities

55
Table 1: Percentage of pupils who participated in at least three hours of high quality PE and out of hours school sport in a typical week – analysis by Partnership
% pupils in each Key Stage group who participate in at least 3 hours of HQ PE/ School sport in typical week - School Sport Partnership
Years 1 - 11
Years 1 - 13
GIR
LS Y
ears 1 - 13
BO
YS
Years 1 - 13
Years 1 - 2
Years 3 - 6
Years 7 – 9
Years 10 - 11
Years 12 - 13
Years 1 - 11
Years 1 - 13
GIR
LS Y
ears 1 - 13
BO
YS
Years 1 - 13
Years 1 - 2
Years 3 - 6
Years 7 – 9
Years 10 - 11
Years 12 - 13
Abraham Guest 62 61 58 64 56 65 66 55 21 Blakeston Community 54 54 52 56 54 67 43 45 100
Aireville 65 63 62 64 51 68 72 62 44 Blessed George Napier 45 43 38 48 36 48 53 35 17 Alderman Peel 47 46 42 49 50 57 39 40 14 Blessed Trinity 62 61 57 65 64 74 54 50 33 Alderman White 56 54 50 58 70 65 48 39 26 Bognor Regis 52 50 47 53 54 62 48 39 23 All Hallows 58 58 52 64 41 65 65 54 - Borden Grammar 39 38 33 43 43 50 28 32 25 All Saints 52 50 46 53 48 61 47 44 23 Boston Spa 50 47 43 52 42 58 57 34 12 All Saints (Dunstable) 47 44 42 47 47 52 50 33 19 Bosworth 51 49 45 53 52 57 50 39 19 Angley 53 50 44 55 41 62 58 41 32 Bracknell Forest 49 47 43 51 51 69 31 35 16 Angmering 58 57 55 59 59 66 54 47 28 Bridgemary 61 60 56 64 66 66 66 42 19 Anthony Gell 77 74 72 76 81 81 79 65 45 Bridlington 65 62 60 64 87 89 42 39 23 Archbishop Beck 58 54 48 61 54 66 63 34 21 Brighton Hill 78 78 74 81 94 85 69 59 45 Archbishop Lanfranc 62 60 55 65 78 80 39 35 10 Broad Oak / Bury 76 76 75 78 63 80 83 75 60 Arrow Vale 58 55 52 58 68 68 52 38 19 Brookfield (Derbyshire) 62 59 57 60 75 86 44 39 17 Ash Manor 57 57 53 61 61 71 47 42 26 Brooksbank 52 50 46 54 64 63 46 33 26 Ashington I (Ashington) 63 59 56 61 77 56 56 71 15 Brownedge St Marys 58 58 50 67 62 74 52 38 45 Ashington II (Blyth & Bedlington) 55 53 49 57 49 61 54 47 28 Buckingham 67 62 61 63 73 78 54 50 18 Ashington III (Cramlington & Seaton Valley) 69 65 64 65 73 72 80 48 27 Bulmershe 54 52 49 56 45 60 59 46 29
Ashton Park 57 57 52 61 65 63 50 45 36 Burleigh 56 53 49 56 64 66 54 35 18 Ashton on Mersey 60 58 54 61 58 66 66 43 25 Burnage 52 51 46 55 51 68 40 30 15 Astley 52 52 49 54 49 67 45 42 21 Burnham 55 53 48 59 50 58 59 48 36 Astor of Hever 50 47 39 55 44 55 55 38 25 Burnholme 56 52 50 55 55 65 51 45 10 Avon Valley 55 54 51 57 50 64 53 47 36 Buxton 56 54 51 57 52 58 67 42 15 Aylesford 87 85 86 85 89 95 75 71 53 Caistor 64 62 59 64 87 90 45 44 39 Bacons 62 62 60 64 61 69 62 48 46 Callington 65 63 60 65 72 76 62 45 31 Balby Carr 60 59 56 63 56 64 62 54 52 Calthorpe 31 31 27 35 15 29 54 27 25 Barking Abbey 56 54 49 60 59 62 55 44 31 Canterbury 56 51 44 58 56 72 55 31 21 Barlby 47 45 43 48 60 64 42 15 - Capital City Academy 76 72 67 77 80 80 77 64 25 Barnet East 63 60 55 64 75 79 55 37 18 Cardinal Heenan 53 50 43 57 57 69 52 31 17 Barnet South 53 48 46 49 57 65 53 23 11 Cardinal Langley 54 53 50 55 62 64 46 42 21 Barnhill 60 56 50 61 65 72 58 32 18 Carisbrooke 50 50 48 51 56 52 47 45 47 Basildon 55 54 52 56 42 60 58 53 9 Carr Manor 52 49 44 54 43 54 59 45 16 Baverstock 40 40 33 46 30 49 36 40 26 Carres 68 65 61 69 86 87 53 44 29 Baysgarth 47 46 44 48 59 59 39 25 12 Carshalton 54 51 45 57 52 64 56 37 27 Beacon/North Wealdon 58 54 52 55 58 67 56 42 16 Castle (Kent) 69 64 62 66 86 91 54 45 22 Bebington 63 60 56 64 59 69 66 51 29 Castle (Somerset) 55 54 51 57 45 62 58 46 16 Beckfoot 52 49 47 50 61 60 50 35 18 Caterham 63 57 51 63 79 76 50 34 16 Benfield 56 55 54 57 58 63 53 43 39 Cavendish 48 45 41 48 48 58 46 32 18 Benfield II (Newcastle) 59 55 51 58 66 72 49 44 22 Central Technology 70 67 63 71 88 84 63 39 21 Berry Hill 42 41 37 45 40 49 40 35 8 Chadsgrove 61 60 55 64 64 72 52 50 44 Bexley 40 38 34 42 30 46 49 24 5 Charlton 63 62 57 66 57 71 61 51 1 Biddenham 53 52 49 54 39 65 59 37 33 Charters 42 39 37 41 50 49 40 27 13 Biddick 71 69 67 71 80 84 70 39 27 Chasetown 55 52 47 57 55 66 56 37 27 Biddulph 65 64 61 66 71 77 57 51 41 Cherry Willingham 72 69 67 71 94 92 58 39 29 Birchwood 59 55 51 58 40 62 74 43 31 Cheslyn Hay 61 58 55 60 87 79 42 40 22 Bishop Barrington 59 58 54 61 56 66 59 50 29 Chessington 54 50 45 55 52 65 54 38 18 Bishop Challoner 57 54 51 58 37 62 76 38 24 Chesterfield/Sefton 65 63 58 67 63 72 67 53 33 Bishop Wand 61 59 57 61 68 72 54 39 13 Chesterton 46 45 42 47 41 54 44 38 13 Bishops 56 54 51 57 61 61 55 44 35 Childwall 64 58 51 66 81 79 57 38 12 Bitterne Park 59 59 51 67 68 66 57 44 100 Chipping Norton 52 49 47 52 51 57 51 41 29 Blacon 59 56 52 59 54 66 65 44 23 Christ College 56 52 48 57 53 67 54 40 19

56
% pupils in each Key Stage group who participate in at least 3 hours of HQ PE/ School sport in typical week - School Sport Partnership
Years 1 - 11
Years 1 - 13
GIR
LS Years 1 - 13
BO
YS
Years 1 - 13
Years 1 - 2
Years 3 - 6
Years 7 – 9
Years 10 - 11
Years 12 - 13
Years 1 - 11
Years 1 - 13
GIR
LS Years 1 - 13
BO
YS
Years 1 - 13
Years 1 - 2
Years 3 - 6
Years 7 – 9
Years 10 - 11
Years 12 - 13
Churchill Community 56 54 50 56 61 66 48 40 28 Freman 60 57 55 59 58 67 61 46 25
Cirencester Kingshill 60 57 56 59 65 69 59 45 21 Furness 72 72 70 74 80 86 68 48 60
City Academy (Bristol) 31 30 27 32 32 36 28 21 6 Glenburn 63 62 61 63 68 77 54 45 13
City Academy Norwich 46 42 39 45 49 53 45 31 7 Golden Hillock 76 76 72 81 80 87 61 58 100
City of Lincoln 62 58 55 60 61 67 67 47 22 Grange (Dorset) 67 63 62 65 78 80 59 47 30
Cliff Park 52 52 49 54 48 54 54 47 57 Grange (South Gloucestershire) 51 48 45 50 62 63 42 30 11
Collegiate / Palatine 55 55 52 57 53 61 54 48 13 Granville 53 51 46 55 63 66 42 34 17
Colmers 63 62 57 66 54 73 63 57 29 Great Baddow 53 49 48 51 53 62 54 37 18
Colne 45 43 42 45 35 50 42 51 15 Great Torrington 78 77 77 78 97 97 62 50 36
Comberton Village 56 56 54 57 51 59 55 56 38 Greenacre 62 57 50 63 78 78 56 35 18
Consett 54 53 52 54 52 62 50 47 17 Hackney Free & Parochial 44 43 36 50 36 58 40 24 6
Coopers Company and Coborn 51 51 51 52 55 51 49 52 48 Hagley Park 58 55 53 57 62 67 50 47 10
Copeland 58 55 51 58 72 77 38 39 13 Hailsham 36 36 34 38 38 38 38 27 35
Copleston 55 51 48 54 64 67 45 39 15 Hamble 60 60 58 61 73 68 51 47 -
Corby 51 48 45 52 48 58 50 39 26 Hammersmith & Fulham 80 79 75 84 94 97 65 54 56
Corpus Christi 55 55 53 57 56 69 44 41 - Hamstead Hall 54 52 49 55 54 70 47 36 15
Coseley 56 56 52 60 52 62 63 41 19 Handsworth Grange 46 45 41 49 48 58 43 27 20
Countesthorpe 53 50 46 55 46 62 53 41 26 Hanson 49 46 41 50 50 62 43 22 7 Counthill 55 54 48 60 58 67 51 34 30 Harefield 60 55 52 58 69 80 50 38 15 Crown Hills 49 48 42 53 45 63 41 35 12 Harlington 56 53 47 59 51 67 48 41 19 Cumberland (Newham) 46 46 39 55 48 64 33 29 - Harris (Warwickshire East) 53 50 48 52 45 58 57 44 16 Davenant 55 54 49 58 54 66 53 38 28 Harris Academy Merton 60 58 52 65 61 72 56 37 13 Dayncourt 62 57 55 59 63 75 63 34 12 Harris Girls Academy 67 66 58 76 87 97 37 19 16 Deanes 53 52 50 55 57 64 48 41 20 Harrogate 58 52 49 55 64 65 58 42 19 Denbigh 58 58 54 60 53 65 57 53 27 Harrow High 51 49 45 54 46 61 51 36 15 Derby Moor 62 59 55 62 74 78 49 34 8 Hartford 60 59 57 61 53 76 56 44 31 Devizes 64 63 61 65 52 65 72 61 49 Hartismere 63 60 56 63 64 72 61 52 20 Dorothy Stringer 60 59 57 61 67 62 62 49 23 Hartlepool SSP 52 51 48 54 49 64 42 47 23 Dr Challoners 62 58 60 56 67 74 62 42 30 Harvey Grammar 52 48 44 52 37 46 68 54 11 Droitwich Spa 55 55 53 56 49 64 52 46 46 Haverstock 61 56 51 62 59 77 61 36 22 Durham Gilesgate 68 63 59 67 73 74 71 50 36 Haydock 64 62 57 66 71 77 56 41 18
Dyson Perrins 65 63 61 65 76 78 57 45 30 Haydon Bridge II (North Northumberland) 65 62 59 65 64 78 67 40 30
Easington 46 45 42 48 43 55 39 36 3 Haydon Bridge III (Morpeth & Ponteland) 73 68 64 71 73 83 76 48 32
Eastwood 68 64 57 70 81 96 52 35 23 Haydon Bridge/Tynedale 58 55 53 57 69 60 47 60 33 Ellis Guilford 51 49 47 52 61 65 36 26 6 Hayesbrook 61 58 53 63 58 66 64 51 29 Ellowes Hall 46 46 44 47 46 50 43 44 31 Henry Cort 58 58 56 59 68 67 51 40 - Eltham Green 59 54 51 58 55 61 67 50 10 Herne Bay 57 54 51 56 74 76 42 27 13 Emerson Park 52 50 46 55 39 57 58 43 8 Heysham 63 62 58 65 65 73 62 35 37 Enfield 66 62 57 66 84 88 45 34 22 Heywood 59 58 54 61 64 60 57 57 27 Epsom & Ewell 50 48 43 54 53 57 50 35 19 Hinchingbrooke 46 44 42 47 41 49 53 37 20 Evesham 59 56 53 58 66 68 55 39 27 Hipperholme & Lightcliffe 63 60 54 66 65 71 58 53 19 Failsworth 55 55 52 58 56 60 51 51 41 Holgate 47 47 47 48 54 64 43 22 - Farnborough 51 50 46 54 63 80 32 23 10 Holmfirth High 57 57 55 60 72 69 46 37 - Farringdon 47 46 38 53 56 54 46 28 20 Holy Cross 55 55 53 57 65 78 42 28 100 Fearns 51 48 44 51 56 67 40 35 14 Houghton Kepier 56 56 54 58 55 60 54 52 100 Featherstone 61 58 54 62 67 66 59 43 8 Howard 44 42 39 46 43 48 48 33 16 Feltham 83 75 73 76 95 94 79 57 14 Hurstmere 48 45 38 51 44 51 50 42 15 Fleetwood 57 56 54 57 64 72 49 36 32 Idsall 55 52 48 55 66 73 43 42 19 Flixton Girls 52 51 50 52 60 65 39 40 25 Isleworth & Syon 61 56 54 59 67 74 52 45 17 Framingham Earl 54 52 50 53 59 64 44 43 13 Islington 71 71 70 72 75 85 63 45 65

57
% pupils in each Key Stage group who participate in at least 3 hours of HQ PE/ School sport in typical week - School Sport Partnership
Years 1 - 11
Years 1 - 13
GIR
LS Years 1 - 13
BO
YS
Years 1 - 13
Years 1 - 2
Years 3 - 6
Years 7 – 9
Years 10 - 11
Years 12 - 13
Years 1 - 11
Years 1 - 13
GIR
LS Y
ears 1 - 13
BO
YS
Years 1 - 13
Years 1 - 2
Years 3 - 6
Years 7 – 9
Years 10 - 11
Years 12 - 13
Ivybridge Community 65 61 58 64 71 83 46 52 29 Lyng Hall 58 54 51 57 66 78 46 33 15 John Fisher 61 54 48 61 69 75 64 35 16 Madeley 69 67 62 71 76 68 76 54 43 John Madejski 56 53 45 61 63 62 48 36 20 Mandeville 51 48 41 54 64 60 39 40 22 John Spence 64 62 59 64 60 74 66 48 35 Manor (Nottinghamshire) 46 44 39 48 53 53 39 39 18 Joseph Whitaker 62 59 56 61 70 68 60 43 22 Manor (Raunds) 58 56 52 59 60 61 60 46 24 Kelsey Park 58 53 49 58 61 66 56 41 18 Mark Hall 53 52 49 55 43 62 56 44 16 Kenilworth 55 51 48 53 60 72 46 33 15 Marriotts 52 49 46 52 47 59 56 41 16 Kineton 54 51 49 54 38 60 61 46 22 Mayfield 45 40 35 46 54 57 37 27 10 King Alfreds (Oxfordshire) 53 50 48 52 45 63 55 36 24 Meopham 51 47 42 52 61 56 52 30 15 King Alfreds (Somerset) 57 56 54 59 60 69 51 44 29 Middlecott 63 61 56 66 74 75 54 46 41 King Arthurs 46 45 43 48 49 58 40 30 20 Minster (Herefordshire) 64 63 58 68 59 73 64 49 43 King Edward VI 63 60 57 63 71 71 63 46 30 Mortimer I 69 66 63 69 82 88 59 47 17 King Edward VI Aston 41 40 35 45 21 43 55 47 26 Mortimer II 78 78 78 78 88 97 67 45 - King Edward VII (Kings Lynn) 53 51 48 55 36 53 55 64 33 Mountbatten 59 59 55 63 61 70 57 42 70 King Edward VII (Leicestershire) 56 54 51 56 61 68 50 36 27 Mounts Bay 51 51 45 56 51 63 45 36 100 Kingdown Community 71 68 65 71 64 70 87 62 30 Mowbray 67 70 69 71 91 65 76 49 95 Kings 64 61 59 62 77 87 44 41 22 Netherhall (Cambridgeshire) 46 45 42 48 41 49 50 38 30 Kings Manor 59 58 53 63 53 68 61 45 27 Netherhall (Cumbria) 64 60 58 62 73 80 53 47 19 Kingsbury 52 47 42 50 55 60 50 31 3 New Charter 42 42 37 47 43 57 27 31 - Kingsbury (Birmingham) 36 35 32 39 36 35 35 39 21 Newmarket 61 57 56 59 68 62 59 52 10 Kirk Hallam 63 59 58 61 87 77 44 44 11 Newsome High 68 67 65 70 76 73 63 58 34 Kirkby 53 52 47 57 48 61 62 28 4 Nicholas Breakspear 54 51 47 55 54 67 52 39 22 Kirkby (Nottinghamshire) 64 63 60 66 78 79 51 46 43 Ninestiles 49 47 42 51 33 50 58 44 10 Kirkby Stephen 61 59 59 60 52 64 67 55 43 Norden 57 55 52 57 54 67 48 53 12 Kirkley 74 69 68 70 100 88 63 38 14 Norlington Boys 66 67 60 73 65 81 59 51 100 Knights Academy 52 51 46 55 37 63 53 47 25 North Stoke 56 56 56 56 69 71 45 30 - Knights Templar 43 40 36 44 39 51 44 31 14 Northampton Academy 45 43 38 47 45 54 37 37 15 Knottingley 60 58 53 64 61 71 58 42 24 Northfield 57 56 52 59 58 65 54 45 26 Lacon Childe 56 56 52 59 59 70 47 45 10 Oakbank 59 56 55 57 55 70 59 41 20 Lady Lumleys 55 52 47 57 45 65 60 41 31 Oasis Academy Wintringham 61 60 57 63 67 70 54 47 33 Lakelands 51 50 47 52 51 61 44 43 15 Oldbury 47 45 41 48 48 45 49 45 14 Lakes 58 54 52 57 47 68 62 44 26 Our Lady (Manchester) 64 62 58 67 77 83 43 35 2 Lancaster 47 47 44 49 42 49 55 41 8 Our Lady and St Chad 68 65 61 68 79 85 56 30 20 Langdon Park 52 51 52 50 41 67 53 33 8 Our Ladys Lancashire 55 51 46 55 51 68 56 38 21 Langdon School 56 55 51 57 52 59 63 44 8 Outwood Grange 57 55 52 59 61 72 46 42 20 Laurence Jackson 78 77 77 78 94 95 65 60 22 Paignton 62 60 58 62 59 71 68 43 37 Lea Valley 69 66 62 69 76 80 60 53 26 Park High 64 61 59 63 68 75 59 43 21 Lees Brook 64 61 61 62 87 70 63 35 18 Park House 63 62 60 64 47 62 80 56 51 Leon 51 50 45 54 46 55 57 41 26 Parklands 59 56 51 60 63 69 58 41 21 Lewisham 45 44 38 50 38 57 40 33 13 Pendle 48 48 43 53 41 58 46 38 - Leytonstone 53 53 48 59 51 65 41 50 - Penryn 57 56 52 60 52 68 55 46 25 Lode Heath 53 52 48 56 55 60 51 43 6 Pensby 53 48 43 54 60 66 51 28 15 London Nautical/Lambeth 55 54 49 59 45 62 62 40 18 Perins 66 66 64 67 63 75 65 53 - Longfield 42 41 37 45 43 47 40 31 6 Phoenix 62 62 58 65 64 68 58 54 22 Longfield Melton 62 60 58 62 32 53 90 67 33 Pindar 58 58 57 59 66 70 51 41 - Longslade 56 53 48 58 64 68 55 32 17 Plymstock 56 51 48 54 52 65 58 44 18 Lord William's 29 27 23 31 14 34 34 29 8 Poltair 61 60 56 63 53 71 58 54 40 Lordswood Boys 50 48 42 54 41 53 51 48 26 Portchester Boys 56 54 51 56 43 68 58 41 28 Lowton 58 58 55 60 57 67 53 50 73 Priesthorpe 53 51 46 55 55 71 37 32 18 Lymm 71 68 66 69 66 69 83 64 22 Priestnall 55 55 53 57 59 61 55 37 -

58
% pupils in each Key Stage group who participate in at least 3 hours of HQ PE/ School sport in typical week - School Sport Partnership
Years 1 - 11
Years 1 - 13
GIR
LS Years 1 - 13
BO
YS
Years 1 - 13
Years 1 - 2
Years 3 - 6
Years 7 – 9
Years 10 - 11
Years 12 - 13
Years 1 - 11
Years 1 - 13
GIR
LS Years 1 - 13
BO
YS
Years 1 - 13
Years 1 - 2
Years 3 - 6
Years 7 – 9
Years 10 - 11
Years 12 - 13
Priory (Barnsley) 67 65 62 68 80 78 55 47 16 Smiths Wood 50 48 43 53 55 54 46 48 25 Priory (Bromley) 57 53 47 59 56 65 57 45 28 South Dartmoor 75 70 66 74 89 91 63 49 19
Priory (Portsmouth) 54 54 51 57 64 61 42 45 100 South Hunsley 55 52 48 55 50 62 62 37 14
Queen Elizabeth (Northern Warwickshire) 58 58 54 61 63 67 55 45 24 South Wigston 55 52 53 52 45 64 56 48 33 Queen Elizabeths (Dorset) 55 53 49 57 50 60 59 45 30 Southfield 52 49 50 48 49 67 49 30 16 Queen Elizabeths Girls 59 54 40 67 57 60 61 54 26 Southfields / Ernest Bevin 53 49 46 52 54 68 45 32 12 Queens 54 50 47 53 52 60 58 36 24 Spalding High 66 61 57 65 99 99 37 32 10 Radcliffe 64 62 58 66 62 64 62 71 39 Spen Valley 53 49 46 52 60 65 46 37 12 Ramsey 54 54 50 57 55 65 47 40 48 St Ambrose Barlow 62 62 56 67 59 71 60 50 29 Rawlett 60 59 58 59 68 76 48 38 39 St Andrews 61 59 55 62 60 73 55 48 36 Rawmarsh 55 54 51 56 72 75 42 30 19 St Bedes (Bristol) 56 53 49 57 56 63 59 34 10
Redborne 63 60 55 65 58 70 65 51 32 St Bedes/Blackburn with Darwen 66 65 63 67 74 83 55 40 22
Redbridge 55 55 52 59 55 57 60 45 - St Edmunds 75 71 68 74 73 80 72 69 31 Retford Oaks 60 58 56 59 67 74 53 40 13 St James 57 51 45 58 70 73 37 28 4 Richard Rose 63 59 58 60 68 76 52 41 16 St John Fisher 56 55 48 61 68 73 34 32 2 Rickmansworth 45 43 41 45 35 47 49 46 21 St Josephs 53 53 48 57 37 57 64 48 17
Risedale 61 59 55 62 60 72 54 48 24 St Lawrence Academy 67 67 64 70 70 71 70 53 100
Roade 57 54 50 57 60 62 55 46 18 St Lukes (Exeter) 66 64 62 67 66 80 60 48 11 Robert Sutton 67 64 60 68 81 82 53 52 30 St Lukes (Swindon) 54 53 50 56 56 61 51 43 14 Rodillian 62 60 57 62 72 83 46 35 11 St Marys (Hull) 72 72 70 73 85 87 61 52 50 Roseberry 68 63 61 65 80 75 56 60 12 St Marys (Leeds) 57 54 50 57 58 68 60 36 17 Rossington 56 53 47 59 65 69 47 37 16 St Pauls 62 60 57 63 71 79 49 44 19 Rossmore 63 60 58 62 64 67 67 49 35 St Thomas More 69 65 65 65 62 74 73 57 20
Roundwood Park 55 50 49 52 63 69 46 37 16 Stafford 54 50 47 53 52 67 46 41 14
Royal Alexandra & Albert 53 51 48 54 54 67 47 34 13 Stanground 60 56 54 59 70 77 44 39 18
Rush Croft 69 64 63 66 73 79 63 51 10 Stanley 56 54 50 58 51 64 59 41 28 Ruskin 62 61 59 63 56 76 64 40 20 Staunton Park 66 65 63 67 83 77 52 50 1 Rutland 60 60 54 65 58 68 57 52 - Stockport 57 56 57 56 71 71 40 42 24 Rye Hills 67 66 61 71 86 80 59 43 22 Stopsley 56 56 49 62 64 62 50 40 - Saffron Walden 49 46 43 49 46 68 38 26 21 Stourport 67 64 63 66 63 66 72 65 39 Saints Peter & Paul (Halton) 67 66 66 67 80 71 64 50 51 Stowmarket 70 66 65 68 95 74 70 38 18 Samuel Cody 58 57 55 59 62 64 57 44 3 Streetly 41 39 34 43 33 48 43 34 18 Sandbach 56 55 53 56 48 60 61 50 32 Sudbury 65 61 57 65 72 68 68 45 20 Sandown 56 54 49 59 41 52 67 61 28 Sundorne 44 44 41 47 42 52 39 38 37 Sandy Upper 64 61 58 64 87 72 47 46 31 Sutton High 59 58 55 60 58 72 53 44 26 Sedgefield 61 61 59 63 66 77 56 37 13 Swadelands 53 50 47 54 54 62 47 45 21 Sele 69 66 65 68 62 74 74 60 45 Swan Valley 69 65 56 74 62 73 75 57 31 Shaftesbury 64 59 56 61 62 78 57 49 17 Swanwick Hall 73 69 66 71 88 84 66 51 25 Sharnbrook Upper 72 67 64 71 76 90 71 38 33 Taverham 56 55 52 58 64 61 51 49 25 Shelfield 57 54 50 57 48 67 57 40 14 Testwood 61 59 56 62 57 67 61 53 16 Shenfield 55 52 45 59 54 68 55 42 26 Theale Green 54 50 48 52 43 61 60 42 16 Shoeburyness 76 71 67 75 78 81 77 66 21 Therfield 52 49 47 50 57 69 41 36 16 Siddal Moor 78 77 75 78 74 84 84 58 35 Thirsk 56 52 48 56 46 64 55 51 19 Sion-Manning 80 77 74 79 79 89 76 58 28 Thomas Bennett 43 40 36 44 52 49 34 34 15 Sir Frederic Osborn 49 48 46 51 33 61 50 42 34 Thomas Keble 58 55 52 58 58 73 55 36 12 Sir John Hunt 56 51 47 55 65 75 40 28 7 Thornleigh Salesian 57 57 52 60 53 63 60 47 42 Sir William Borlase 59 58 52 62 58 66 59 47 48 Thornton Grammar 50 47 40 54 56 63 35 31 15 Sirius Academy 70 70 66 73 75 85 60 48 - Thorpe St Andrew 50 48 45 50 51 62 45 31 15 Skegness Grammar 65 62 58 65 79 78 56 45 30 Thurstable 77 75 74 76 79 82 77 66 40 Smestow 52 48 44 53 60 66 43 36 15 Tibshelf 77 77 74 79 96 97 63 43 -

59
% pupils in each Key Stage group who participate in at least 3 hours of HQ PE/ School sport in typical week - School Sport Partnership
Years 1 - 11
Years 1 - 13
GIR
LS Years 1 - 13
BO
YS
Years 1 - 13
Years 1 - 2
Years 3 - 6
Years 7 – 9
Years 10 - 11
Years 12 - 13
Tongs 66 64 62 66 64 78 55 54 31 Tower Hamlets 48 46 37 55 44 64 40 30 15 Toynbee 60 60 57 63 71 79 49 37 53 Tupton Hall 76 73 70 76 98 97 58 45 45 Turnford 58 56 53 59 61 69 53 43 33 University of Chester Academy 72 69 68 70 81 82 71 45 36 Ursuline 52 49 46 51 68 75 29 32 16 Vandyke Upper 61 58 58 58 72 70 60 36 21 Wallingford 59 56 50 62 56 72 57 41 20 Wayland 53 51 47 54 63 62 47 39 35 Weald 63 61 65 58 60 71 66 43 11 Wellsway (5) 59 57 55 59 69 74 44 45 27 Wellsway (9) 55 51 49 53 47 71 56 37 17 Wentworth 49 48 45 51 43 61 44 37 21 West London Academy 62 58 53 63 52 62 72 59 19 Westbourne 53 53 48 57 59 62 51 37 36 Westcroft 90 86 84 88 92 97 94 70 38 Westfield (Points Sheffield) 55 53 50 56 58 68 55 29 17 Westminster 54 50 47 53 48 61 57 39 12 Wexham 46 43 40 46 37 52 50 40 10 Wey Valley 58 55 52 58 64 71 52 41 17 Wheldon 58 55 52 57 59 65 61 41 8 Whickham East 44 42 38 45 47 55 38 27 11 Whickham West 51 48 45 52 47 61 49 34 23 Whitecross 54 53 50 57 55 66 46 45 32 Whitton (Richmond) 63 63 60 67 59 69 66 52 43 Wickersley 45 43 40 47 41 46 41 53 20 Willenhall 47 45 41 48 46 53 39 47 18 William Beamont 62 61 56 66 72 75 49 47 19 William Edwards 48 48 46 49 48 55 48 32 100 William Parker 57 56 57 55 58 67 52 46 32 William de Ferrers 56 54 51 55 66 73 42 37 20 Wilmslow 67 62 58 65 73 75 64 49 22 Wilson Stuart 63 58 53 64 69 78 52 44 23 Windsor (Dudley) 64 64 59 68 54 63 69 67 64 Windsor Boys and Girls 65 64 59 67 55 65 73 63 51 Winston Churchill 56 54 49 59 54 67 53 44 19 Wisewood (Arches) 51 50 47 52 71 65 35 23 - Witchford 50 49 45 53 47 57 49 44 10 Wood Green (Sandwell) 47 45 42 49 40 51 50 40 20 Woodcote 49 48 43 53 42 58 52 35 22 Woodhey 77 77 76 79 77 83 79 68 - Woodlands 49 47 44 49 42 61 50 33 12 Woodside High 54 53 50 56 51 63 52 38 21 Worden 56 56 52 59 42 66 55 50 - Wright Robinson 64 63 60 66 56 71 65 57 24 Wye Valley 52 50 43 57 36 51 67 53 32 Wyvern 60 58 56 61 64 65 63 46 25 Yate International 47 44 41 46 54 59 35 35 6 York High 47 46 42 50 43 55 47 37 25

60
Table 2: Percentage of pupils who participated in at least three hours of high quality PE and out of hours school sport in a typical week - analysis by Local Authority
% pupils in each Key Stage group who participate in at least 3 hours of HQ PE/ School sport in typical week - analysis by local authority
Years 1 - 11
Years 1 - 13
GIR
LS Years 1 - 13
BO
YS
Years 1 - 13
Years 1 - 2
Years 3 - 6
Years 7 – 9
Years 10 - 11
Years 12 - 13
Years 1 - 11
Years 1 - 13
GIR
LS Y
ears 1 - 13
BO
YS
Years 1 - 13
Years 1 - 2
Years 3 - 6
Years 7 – 9
Years 10 - 11
Years 12 - 13
Barking and Dagenham 56 54 49 60 59 62 55 44 31 Harrow 51 49 45 54 46 61 51 36 15
Barnet 58 53 47 59 66 70 51 35 14 Hartlepool 52 51 48 54 49 64 42 47 23
Barnsley 57 56 55 58 67 72 48 32 16 Havering 51 51 48 53 46 54 55 46 30
Bath and North East Somerset 57 54 52 56 59 73 51 40 20 Herefordshire 58 58 53 62 57 69 54 47 36
Bedford 60 57 53 60 50 73 64 36 30 Hertfordshire 53 50 47 53 48 61 54 40 24
Bexley 44 42 36 47 38 49 50 34 12 Hillingdon 58 55 50 59 61 73 52 37 17
Birmingham 52 51 46 55 45 59 54 44 24 Hounslow 70 64 61 67 79 83 63 50 16
Blackburn with Darwen 66 65 63 67 74 83 55 40 22 Isle of Wight 53 52 48 55 49 52 56 52 37
Blackpool 55 55 52 57 53 61 54 48 13 Isles Of Scilly 67 67 61 74 42 70 88 54 -
Bolton 55 55 50 59 45 60 62 47 35 Islington 71 71 70 71 75 84 63 45 65
Bournemouth 56 54 52 56 44 69 58 41 28 Kensington and Chelsea 80 77 74 79 79 89 76 58 28
Bracknell Forest 49 47 43 51 51 69 31 35 16 Kent 57 54 50 59 60 68 53 42 24
Bradford 55 52 49 55 57 67 48 36 18 Kingston upon Hull City of 71 71 69 73 81 86 61 50 48
Brent 62 57 53 61 67 68 61 45 11 Kingston upon Thames 54 50 45 55 52 65 54 38 18
Brighton and Hove 60 59 57 61 67 62 62 49 23 Kirklees 59 57 53 61 70 70 47 41 14
Bristol City of 48 47 43 51 51 54 46 33 12 Knowsley 53 52 47 57 48 62 62 28 4
Bromley 58 53 48 59 59 66 56 43 23 Lambeth 55 54 49 59 45 62 62 40 18
Buckinghamshire 57 54 51 58 57 64 56 46 31 Lancashire 57 55 52 58 58 70 49 41 23
Bury 77 76 75 78 67 80 81 72 60 Leeds 55 52 48 56 54 67 53 37 15
Calderdale 58 55 50 60 64 67 51 43 22 Leicester 48 47 43 51 43 57 47 38 10
Cambridgeshire 50 49 46 51 46 54 52 43 21 Leicestershire 55 52 49 55 53 62 55 41 24
Camden 62 57 52 63 59 78 61 36 22 Lewisham 49 47 42 53 38 60 47 40 20
Central Bedfordshire 58 55 52 58 62 64 56 45 29 Lincolnshire 66 63 59 66 83 84 53 42 25
Cheshire East 62 59 56 62 60 70 63 47 25 Liverpool 58 54 48 61 64 70 57 36 17
Cheshire West and Chester 63 61 59 63 62 75 64 44 29 Luton 57 56 51 61 60 63 53 45 27
City of London 100 100 100 100 100 10
0 - - - Manchester 60 59 55 63 60 73 51 42 16
Cornwall 60 58 55 62 58 70 57 47 32 Medway 52 49 44 54 57 59 52 34 17
Coventry 53 50 47 53 52 68 48 33 14 Merton 60 58 52 65 61 72 56 37 13
Croydon 57 55 51 59 60 70 49 39 26 Middlesbrough 59 58 53 63 53 68 61 45 27
Cumbria 63 60 58 62 67 76 57 45 25 Milton Keynes 58 56 52 60 54 59 60 57 34
Darlington 42 41 37 45 43 47 40 31 6 Newcastle upon Tyne 58 55 52 58 62 68 51 43 26
Derby 62 59 57 61 79 74 55 35 12 Newham 52 51 46 56 50 61 50 37 8
Derbyshire 67 64 62 67 80 81 57 45 26 North East Lincolnshire 61 60 57 63 67 70 54 47 33
Devon 70 67 65 69 80 88 56 48 23 Norfolk 51 50 47 53 51 58 48 45 21
Doncaster 59 57 52 62 60 67 56 47 39 North Lincolnshire 57 56 54 59 65 65 54 39 14
Dorset 61 57 55 60 63 72 57 45 22 North Somerset 60 58 56 61 64 65 63 46 25
Dudley 56 56 52 59 51 58 59 51 43 North Tyneside 60 57 54 60 60 70 57 44 32
Durham 58 57 54 59 60 67 55 45 27 North Yorkshire 57 54 51 57 57 67 56 42 24
Ealing 61 58 53 62 59 64 66 51 16 Northamptonshire 53 50 47 53 53 60 50 41 19
East Riding of Yorkshire 60 57 54 59 68 76 52 38 18 Northumberland 63 60 57 62 66 68 62 52 28
East Sussex 48 47 46 48 49 54 47 37 22 Nottingham 51 50 47 53 62 70 34 25 8
Enfield 67 64 59 68 80 84 52 43 24 Nottinghamshire 58 55 52 58 66 69 54 40 20
Essex 56 54 52 57 55 66 53 45 24 Oldham 55 54 50 59 57 64 51 42 31
Gateshead 47 45 41 48 47 58 43 30 18 Oxfordshire 47 45 41 49 40 54 50 36 19
Gloucestershire 57 55 51 58 59 66 56 44 24 Peterborough 59 55 53 58 69 76 44 39 18
Greenwich 61 58 53 62 56 66 65 50 9 Plymouth 56 51 48 54 59 69 51 37 14
Hackney 44 43 36 50 36 58 40 24 6 Poole 61 58 56 60 61 64 65 49 35
Halton 67 66 66 67 80 71 64 50 51 Portsmouth 54 54 51 57 64 61 42 45 100
Hammersmith and Fulham 80 79 75 84 94 97 65 54 56 Pre LGR (2009) Cheshire 68 68 69 68 66 69 - - -
Hampshire 63 63 60 65 70 72 58 47 13 Reading 56 53 45 61 63 62 48 36 20
Haringey 61 59 58 60 56 69 62 47 20 Redbridge 54 49 43 55 67 68 43 30 13

61
% pupils in each Key Stage group who participate in at least 3 hours of HQ PE/ School sport in typical week - analysis by local authority
Years 1 - 11
Years 1 - 13
GIR
LS Years 1 - 13
BO
YS
Years 1 - 13
Years 1 - 2
Years 3 - 6
Years 7 – 9
Years 10 - 11
Years 12 - 13
Redcar and Cleveland 73 72 69 75 90 88 62 52 22 Richmond upon Thames 63 63 60 67 59 69 66 52 43 Rochdale 66 65 63 67 69 75 64 49 25 Rotherham 50 48 45 51 55 60 41 41 20 Rutland 59 59 54 65 55 70 57 52 - Salford 54 53 49 58 43 63 54 44 17 Sandwell 47 45 41 48 44 48 49 42 17 Sefton 61 59 55 64 58 69 62 48 31 Sheffield 51 49 46 53 57 63 44 31 17 Shropshire 50 49 46 52 52 61 43 42 17 Slough 46 43 40 46 37 52 50 40 10 Solihull 52 50 46 55 55 57 49 46 22 Somerset 52 51 49 54 51 63 48 39 22 South Gloucestershire 48 45 43 48 58 60 39 33 8 South Tyneside 73 72 70 73 86 93 62 46 17
Southampton 57 57 52 62 59 60 59 45 100
Southend-on-Sea 72 67 61 72 79 89 63 50 22 Southwark 65 64 59 69 74 82 49 33 33 St. Helens 62 60 56 63 65 75 55 42 21 Staffordshire 58 56 53 59 65 71 50 43 25 Stockport 56 55 54 57 64 65 49 39 24 Stockton-on-Tees 56 55 52 58 57 67 50 45 38 Stoke-on-Trent 50 49 47 51 55 61 42 33 7 Suffolk 62 59 56 61 74 71 58 42 19 Sunderland 59 57 53 62 66 68 58 38 25 Surrey 55 53 49 56 58 67 49 38 16 Sutton 57 53 47 59 60 68 60 36 20 Swindon 54 53 50 56 56 61 51 43 14 Tameside 48 47 44 51 46 62 37 37 21 Telford and Wrekin 65 64 60 68 70 68 67 54 41 Thurrock 48 48 46 49 48 55 48 32 100 Torbay 62 60 58 62 59 71 68 43 37 Tower Hamlets 50 49 45 52 42 66 47 32 12 Trafford 57 55 52 57 59 66 55 42 25 Wakefield 58 57 52 61 61 71 53 42 22 Walsall 48 45 41 49 43 56 45 40 17 Waltham Forest 64 62 58 67 64 76 56 51 23 Wandsworth 53 49 46 52 54 68 45 32 12 Warrington 67 65 62 68 69 72 67 57 22 Warwickshire 56 53 50 56 53 64 55 42 19 West Berkshire 58 55 53 57 45 61 68 48 32 West Sussex 56 54 52 56 59 66 50 42 20 Westminster 54 50 47 53 48 61 57 39 12 Wigan 60 59 57 62 57 66 59 52 48 Wiltshire 65 63 61 66 59 69 71 58 38 Windsor and Maidenhead 50 47 44 50 52 55 51 39 23 Wirral 59 56 51 60 63 70 58 39 20 Wokingham 54 52 49 56 45 60 59 46 29 Wolverhampton 66 62 58 66 74 80 59 40 20 Worcestershire 61 59 56 61 63 69 58 48 34 York 52 50 47 53 50 60 50 42 15

62
Table 3: Percentage of pupils who have taken part in inter-school competition during this academic year – analysis by Partnership
% of pupils involved in inter-school competition during this academic year - analysis by partnership
Years 1 - 11
Years 1 - 13
GIR
LS Y
ears 1 - 13
BO
YS
Years 1 - 13
Years 1 - 11
Years 1 - 13
GIR
LS Y
ears 1 - 13
BO
YS
Years 1 - 13
Years 1 - 11
Years 1 - 13
GIR
LS Y
ears 1 - 13
BO
YS
Years 1 - 13
Abraham Guest 65 64 61 67 Blessed George Napier 51 49 45 53 City Academy Bristol 26 25 22 29
Aireville 57 52 48 56 Blessed Trinity 54 53 52 53 City Academy Norwich 34 32 29 35
Alderman Peel 41 39 36 43 Bognor Regis 45 43 40 46 City of Lincoln 41 39 36 41
Alderman White 62 58 57 59 Borden Grammar 55 51 46 55 Cliff Park 43 43 41 45
All Hallows 46 46 40 51 Boston Spa 36 34 30 38 Collegiate Palatine 73 72 69 74
All Saints 49 47 45 50 Bosworth 47 44 41 48 Colmers 56 55 52 57
All Saints (Dunstable) 40 38 35 42 Bracknell Forest 56 54 50 57 Colne 36 34 33 36
Angley 52 50 43 55 Bridgemary 70 68 64 71 Comberton Village 60 60 57 62
Angmering 42 41 39 44 Bridlington 59 56 53 58 Consett 51 50 47 53
Anthony Gell 60 58 54 62 Brighton Hill 54 54 50 57 Coopers Company and Coborn 54 53 54 52
Archbishop Beck 32 31 26 37 Broad Oak / Bury 47 47 45 49 Copeland 58 56 51 61
Archbishop Lanfranc 54 52 47 58 Brookfield (Derbyshire) 55 52 51 52 Copleston 42 39 35 42
Arrow Vale 69 66 65 66 Brooksbank 46 43 40 47 Corby 37 34 30 39
Ash Manor 71 70 68 72 Brownedge St Marys 59 58 57 60 Corpus Christi 36 36 33 38
Ashington I (Ashington) 44 43 40 45 Buckingham 44 41 39 44 Coseley 53 52 48 56 Ashington II (Blyth & Bedlington) 45 43 41 45 Bulmershe 55 53 50 55 Countesthorpe 46 44 42 46
Ashington III (Cramlington & Seaton Valley)
63 59 57 61 Burleigh
37 35 32 39 Counthill
50 48 45 52
Ashton Park 58 58 56 60 Burnage 57 56 55 57 Crown Hills 29 29 26 31
Ashton on Mersey 61 58 56 60 Burnham 43 41 38 44 Cumberland Newham 82 82 80 83
Astley 61 60 55 65 Burnholme 60 57 56 58 Davenant 48 47 44 51
Astor of Hever 42 40 33 46 Buxton 41 40 39 41 Dayncourt 44 41 39 43
Avon Valley 41 40 36 43 Caistor 59 56 53 59 Deanes 50 48 47 49
Aylesford 77 74 71 76 Callington 58 55 52 58 Denbigh 55 54 52 55
Bacons 61 59 58 60 Calthorpe 56 55 54 55 Derby Moor 43 41 39 42
Balby Carr 61 59 55 63 Canterbury 61 56 49 63 Devizes 38 37 34 40
Barking Abbey 57 54 51 57 Capital City Academy (Brent) 71 66 61 72 Dorothy Stringer 41 41 38 43
Barlby 41 39 37 41 Cardinal Heenan 34 33 29 37 Dr Challoners 58 53 52 54
Barnet East 59 55 53 57 Cardinal Langley 53 52 49 55 Droitwich Spa 57 57 56 58
Barnet South 62 56 61 53 Carisbrooke 46 45 43 46 Durham Gilesgate 67 59 56 63
Barnhill 49 45 40 50 Carr Manor 28 27 23 31 Dyson Perrins 59 57 55 60
Basildon 34 33 31 36 Carres 42 40 36 44 Easington 37 36 32 40
Baverstock 62 60 57 63 Carshalton 41 39 35 42 Eastwood 64 59 58 60
Baysgarth 36 35 34 37 Castle (Kent) 37 35 31 38 Ellis Guilford 44 43 40 47
Beacon/North Wealdon 51 47 44 50 Castle (Somerset) 60 59 56 62 Ellowes Hall 39 38 37 40
Bebington 58 55 52 59 Caterham 26 25 22 27 Eltham Green 56 51 46 57
Beckfoot 41 39 38 39 Cavendish 63 59 56 62 Emerson Park 76 74 71 78
Benfield 57 55 55 56 Central Technology 43 41 36 46 Enfield 47 44 43 46
Benfield II Newcastle 55 50 50 51 Chadsgrove 59 56 54 59 Epsom & Ewell 52 49 47 51
Berry Hill 56 55 53 56 Charlton 44 43 40 46 Evesham 51 49 47 51
Bexley 32 30 29 32 Charters 49 46 45 46 Failsworth 41 41 36 44
Biddenham 42 40 37 44 Chasetown 46 43 39 47 Farnborough 41 40 36 43
Biddick 62 61 59 62 Cherry Willingham 33 32 29 34 Farringdon 36 35 31 38
Biddulph 58 56 55 58 Cheslyn Hay 66 63 60 65 Fearns 64 59 58 61
Birchwood 51 48 44 52 Chessington 51 47 41 53 Featherstone 38 37 36 38
Bishop Barrington 52 50 45 55 Chesterfield/Sefton 64 60 58 63 Feltham 42 39 37 40
Bishop Challoner 61 57 43 72 Chesterton 51 49 46 53 Fleetwood 47 47 45 48
Bishop Wand 54 53 51 55 Childwall 44 41 34 47 Flixton Girls 62 60 62 58
Bishops 43 41 38 45 Chipping Norton 61 58 55 61 Framingham Earl 46 45 42 47
Bitterne Park 49 49 47 50 Christ College 52 50 47 53 Freman 84 80 77 82
Blacon 59 56 53 59 Churchill Community 57 54 51 57 Furness 58 58 55 61
Blakeston Community 48 47 45 50 Cirencester Kingshill 56 54 51 57 Glenburn 61 60 59 61

63
% of pupils involved in inter-school competition during this academic year - analysis by partnership
Years 1 - 11
Years 1 - 13
GIR
LS Y
ears 1 - 13
BO
YS
Years 1 - 13
Years 1 - 11
Years 1 - 13
GIR
LS Y
ears 1 - 13
BO
YS
Years 1 - 13
Years 1 - 11
Years 1 - 13
GIR
LS Y
ears 1 - 13
BO
YS
Years 1 - 13
Golden Hillock 39 38 35 41 John Madejski 51 48 42 55 Madeley 51 48 43 53
Grange (Dorset) 48 46 43 48 John Spence 59 55 51 58 Mandeville 35 34 29 38 Grange (South Gloucestershire) 59 55 53 57 Joseph Whitaker 51 47 44 50 Manor (Nottinghamshire) 43 40 34 45
Granville 33 31 28 34 Kelsey Park 54 49 44 55 Manor (Raunds) 50 49 46 52
Great Baddow 53 50 47 52 Kenilworth 39 37 34 40 Mark Hall 42 42 39 45
Great Torrington 66 65 63 66 Kineton 41 39 36 43 Marriotts 49 46 44 47
Greenacre 37 34 29 39 King Alfreds (Oxfordshire) 38 36 33 39 Mayfield 57 50 47 53 Hackney Free & Parochial 34 33 29 38 King Alfreds (Somerset) 44 44 41 46 Meopham 43 40 36 44
Hagley Park 56 54 51 57 King Arthurs 45 44 42 46 Middlecott 52 51 48 53
Hailsham 39 39 36 42 King Edward VI 57 53 50 55 Minster Herefordshire 64 63 57 69
Hamble 38 38 37 39 King Edward VI Aston 25 24 19 29 Mortimer I 54 52 50 54
Hammersmith & Fulham 44 43 38 48 King Edward VII (Kings Lynn) 40 39 35 43 Mortimer II 58 58 59 58
Hamstead Hall 53 51 45 56 King Edward VII (Leicestershire) 47 44 42 46 Mountbatten 48 48 45 50
Handsworth Grange 43 42 40 45 Kingdown Community 44 42 38 46 Mounts Bay 39 38 34 43
Hanson 38 36 33 38 Kings 56 54 51 57 Mowbray 62 62 53 65
Harefield 41 37 32 42 Kings Manor 44 43 40 46 Netherhall (Cambridgeshire) 61 60 58 63
Harlington 37 36 31 40 Kingsbury 50 45 42 49 Netherhall (Cumbria) 71 68 67 69 Harris (Warwickshire East) 47 44 41 48 Kingsbury (Birmingham) 56 54 52 57 New Charter 63 63 57 69
Harris Academy Merton 75 73 75 72 Kirk Hallam 33 31 29 34 Newmarket 41 39 35 43
Harris Girls Academy 42 41 35 49 Kirkby 40 40 34 45 Newsome High 76 74 73 76
Harrogate 45 41 39 44 Kirkby (Nottinghamshire) 66 63 61 65 Nicholas Breakspear 60 55 51 60
Harrow High 42 39 36 43 Kirkby Stephen 57 55 52 57 Ninestiles 45 44 39 48
Hartford 61 60 59 61 Kirkley 74 69 67 71 Norden 73 70 69 71
Hartismere 59 56 54 59 Knights Academy 32 31 27 34 Norlington Boys 43 43 41 45
Hartlepool SSP 45 45 42 47 Knights Templar 48 45 42 49 North Stoke 35 35 34 36
Harvey Grammar 49 45 42 49 Knottingley 47 46 43 50 Northampton Academy 41 39 35 43
Haverstock 34 31 26 36 Lacon Childe 59 58 54 62 Northfield 44 43 40 46
Haydock 55 53 49 57 Lady Lumleys 53 50 46 54 Oakbank 44 42 39 44 Haydon Bridge II North Northumberland 57 53 51 54 Lakelands 47 45 44 46 Oasis Academy
Wintringham 62 61 58 64
Haydon Bridge III Morpeth & Ponteland 61 58 59 57 Lakes 48 45 42 47 Oldbury 27 26 23 29
Haydon Bridge/Tynedale 48 45 41 48 Lancaster 35 35 31 39 Our Lady (Manchester) 71 69 68 70
Hayesbrook 46 43 39 47 Langdon Park 46 45 42 47 Our Lady and St Chad 56 54 51 56
Henry Cort 65 65 65 65 Langdon School 56 54 53 55 Our Ladys Lancashire 50 46 42 51
Herne Bay 63 59 57 62 Laurence Jackson 53 52 49 56 Outwood Grange 48 47 43 51
Heysham 45 44 39 48 Lea Valley 42 41 38 43 Paignton 54 52 49 56
Heywood 45 44 42 46 Lees Brook 48 46 44 47 Park High 74 72 73 72
Hinchingbrooke 53 50 46 53 Leon 53 52 50 54 Park House 50 49 44 54 Hipperholme & Lightcliffe 48 46 40 50 Lewisham 31 30 24 35 Parklands 39 37 32 41
Holgate 50 50 49 52 Leytonstone 51 51 46 55 Pendle 61 61 59 62
Holmfirth High 79 79 77 81 Lode Heath 54 53 50 57 Penryn 42 41 38 45
Holy Cross 61 61 60 61 London Nautical/Lambeth 40 39 36 42 Pensby 34 33 30 36
Houghton Kepier 65 65 65 65 Longfield 37 37 35 38 Perins 43 43 38 47
Howard 31 30 26 34 Longfield Melton 47 45 42 48 Phoenix 46 46 42 50
Hurstmere 41 38 34 42 Longslade 53 50 45 54 Pindar 44 44 42 45
Idsall 51 48 43 54 Lord William's 37 35 30 39 Plymstock 38 34 30 38
Isleworth & Syon 38 35 32 39 Lordswood Boys 32 31 25 37 Poltair 43 42 39 45
Islington 36 36 34 38 Lowton 56 55 53 57 Portchester Boys 36 35 31 39
Ivybridge Community 40 38 36 41 Lymm 57 55 52 57 Priesthorpe 72 68 67 69
John Fisher 45 41 31 52 Lyng Hall 48 45 41 48 Priestnall 51 51 50 53

64
% of pupils involved in inter-school competition during this academic year - analysis by partnership
Years 1 - 11
Years 1 - 13
GIR
LS Y
ears 1 - 13
BO
YS
Years 1 - 13
Years 1 - 11
Years 1 - 13
GIR
LS Y
ears 1 - 13
BO
YS
Years 1 - 13
Y
ears 1 - 11
Years 1 - 13
GIR
LS Y
ears 1 - 13
BO
YS
Years 1 - 13
Priory (Barnsley) 57 56 53 59 Smiths Wood 44 41 37 45 Tongs 71 68 67 69
Priory (Bromley) 57 53 47 58 South Dartmoor 37 35 30 39 Tower Hamlets 39 37 33 42
Priory (Portsmouth) 51 51 46 55 South Hunsley 42 40 38 42 Toynbee 54 54 51 57 Queen Elizabeth (Northern Warwickshire)
53 53 51 54 South Wigston
44 41 39 42 Tupton Hall
46 43 41 46
Queen Elizabeths (Dorset) 48 45 43 48 Southfield 27 26 24 28 Turnford 50 49 46 52
Queen Elizabeths Girls 67 61 59 63 Southfields / Ernest Bevin 38 35 30 40 University of Chester Academy 46 44 42 46
Queens 52 48 46 50 Spalding High 62 57 54 61 Ursuline 64 59 55 64
Radcliffe 58 54 52 55 Spen Valley 60 56 55 57 Vandyke Upper 61 57 59 55
Ramsey 37 37 32 41 St Ambrose Barlow 64 64 60 68 Wallingford 50 47 43 51
Rawlett 44 43 41 45 St Andrews 54 51 49 52 Wayland 34 33 30 35
Rawmarsh 40 39 36 42 St Bedes (Bristol) 38 36 33 39 Weald 39 39 36 42
Redborne 59 55 51 59 St Bedes/Blackburn with Darwen 36 35 33 38 Wellsway (5) 65 63 61 65
Redbridge 51 51 52 50 St Edmunds 47 45 40 50 Wellsway (9) 48 46 40 52
Retford Oaks 45 43 42 44 St James 73 66 63 69 Wentworth 38 38 34 41
Richard Rose 53 50 48 52 St John Fisher 56 55 48 61 West London Academy 70 64 58 70
Rickmansworth 70 65 63 67 St Josephs 38 38 35 41 Westbourne 36 35 31 39
Risedale 58 55 52 59 St Lawrence Academy 43 43 42 44 Westcroft 78 74 70 76
Roade 38 36 32 40 St Lukes (Exeter) 41 41 37 45 Westfield (Points Sheffield) 34 33 30 36
Robert Sutton 47 45 42 47 St Lukes (Swindon) 34 34 31 37 Westminster 33 31 27 34
Rodillian 34 33 30 35 St Marys (Hull) 48 47 44 51 Wexham 31 30 26 33
Roseberry 63 59 57 62 St Marys (Leeds) 43 41 37 45 Wey Valley 56 52 48 56
Rossington 52 50 46 53 St Pauls 57 55 52 57 Wheldon 43 41 38 44
Rossmore 57 53 50 57 St Thomas More 34 33 30 35 Whickham East 62 59 58 59
Roundwood Park 78 71 69 73 Stafford 57 53 50 56 Whickham West 62 57 56 59 Royal Alexandra & Albert 47 45 42 48 Stanground 47 44 41 46 Whitecross 54 54 50 58
Rush Croft 45 43 42 44 Stanley 61 60 58 62 Whitton (Richmond) 54 54 55 53
Ruskin 68 67 65 68 Staunton Park 43 43 40 45 Wickersley 44 42 39 45
Rutland 59 59 57 61 Stockport 49 48 45 51 Willenhall 24 23 20 26
Rye Hills 61 60 54 66 Stopsley 45 45 41 48 William Beamont 62 61 57 65
Saffron Walden 48 47 44 49 Stourport 64 60 58 62 William Edwards 30 30 29 32 Saints Peter & Paul (Halton) 39 38 37 40 Stowmarket 53 49 48 51 William Parker 38 38 35 41
Samuel Cody 41 40 38 42 Streetly 27 25 21 29 William de Ferrers 45 42 41 44
Sandbach 59 56 57 56 Sudbury 44 41 39 43 Wilmslow 47 44 41 46
Sandown 48 47 44 50 Sundorne 49 49 48 50 Wilson Stuart 61 56 51 61
Sandy Upper 51 49 45 53 Sutton High 41 40 35 44 Windsor (Dudley) 74 73 72 75
Sedgefield 70 69 69 70 Swadelands 59 55 51 58 Windsor Boys and Girls 54 54 47 60
Sele 62 59 54 64 Swan Valley 71 67 63 70 Winston Churchill 39 38 34 42
Shaftesbury 49 46 42 50 Swanwick Hall 42 39 37 42 Wisewood (Arches) 43 42 40 44
Sharnbrook Upper 67 64 60 68 Taverham 54 52 52 52 Witchford 41 40 37 43
Shelfield 28 28 24 32 Testwood 47 46 43 48 Wood Green (Sandwell) 28 28 25 31
Shenfield 53 49 44 55 Theale Green 36 34 31 37 Woodcote 66 64 62 67
Shoeburyness 41 39 37 42 Therfield 57 53 52 54 Woodhey 42 42 39 45
Siddal Moor 50 49 47 51 Thirsk 57 54 51 56 Woodlands 47 44 41 46
Sion-Manning 65 62 59 65 Thomas Bennett 48 45 42 47 Woodside High 28 28 26 29
Sir Frederic Osborn 47 45 41 49 Thomas Keble 49 47 44 50 Worden 46 46 44 48
Sir John Hunt 35 33 30 35 Thornleigh Salesian 45 43 40 46 Wright Robinson (Manchester East) 59 58 55 61
Sir William Borlase 58 54 53 55 Thornton Grammar 32 30 27 33 Wye Valley 38 37 31 43
Sirius Academy 37 37 33 40 Thorpe St Andrew 48 46 44 47 Wyvern 51 49 47 51
Skegness Grammar 35 34 32 36 Thurstable 62 60 57 62 Yate International 57 53 54 52
Smestow 50 46 43 49 Tibshelf 47 47 44 50 York High 32 31 28 34

65
Table 4: Percentage of pupils involved in inter-school competition during this academic year - analysis by Local Authority
% of pupils involved in inter-school competition during this academic year - analysis by Local Authority
Years 1 - 11
Years 1 - 13
GIR
LS Y
ears 1 - 13
BO
YS
Years 1 - 13
Years 1 - 11
Years 1 - 13
GIR
LS Y
ears 1 - 13
BO
YS
Years 1 - 13
Years 1 - 11
Years 1 - 13
GIR
LS Y
ears 1 - 13
BO
YS
Years 1 - 13
Barking and Dagenham 57 54 51 57 Harrow 42 39 36 43 Redcar and Cleveland 57 56 51 61
Barnet 65 60 59 60 Hartlepool 45 45 42 47 Richmond upon Thames 54 54 55 53
Barnsley 54 53 51 55 Havering 66 64 64 65 Rochdale 52 51 48 53 Bath and North East Somerset 56 53 48 58 Herefordshire 59 58 53 63 Rotherham 41 40 36 43
Bedford 47 45 41 49 Hertfordshire 58 54 51 57 Rutland 57 57 55 59
Bexley 37 35 32 38 Hillingdon 42 39 34 44 Salford 41 41 37 46
Birmingham 48 47 42 51 Hounslow 40 37 34 40 Sandwell 28 27 24 30
Blackburn with Darwen 36 35 33 38 Isle of Wight 47 46 43 47 Sefton 63 61 58 64
Blackpool 73 72 69 74 Isles Of Scilly 26 26 17 35 Sheffield 43 41 39 44
Bolton 41 41 37 43 Islington 36 36 34 38 Shropshire 50 49 46 51 Bournemouth 36 35 31 39 Kensington and Chelsea 65 62 59 65 Slough 31 30 26 33 Bracknell Forest 56 54 50 57 Kent 56 52 48 56 Solihull 49 47 43 51 Bradford 45 43 40 45 Kingston upon Hull City of 43 43 39 46 Somerset 49 48 45 50
Brent 59 54 50 58 Kingston upon Thames 51 47 41 53 South Gloucestershire 58 54 54 54
Brighton and Hove 41 41 38 43 Kirklees 68 67 63 69 South Tyneside 56 55 54 56 Bristol City of 41 39 36 42 Knowsley 40 40 34 45 Southampton 50 50 50 50 Bromley 55 51 45 56 Lambeth 40 39 36 42 Southend-on-Sea 53 50 48 51 Buckinghamshire 46 43 40 47 Lancashire 55 53 52 55 Southwark 51 50 45 55 Bury 45 45 43 47 Leeds 40 38 35 41 St. Helens 49 47 43 51 Calderdale 47 44 40 49 Leicester 32 31 28 35 Staffordshire 53 51 48 53 Cambridgeshire 53 52 49 54 Leicestershire 45 43 40 46 Stockport 50 50 48 52 Camden 34 31 26 36 Lewisham 31 30 25 35 Stockton-on-Tees 46 45 42 48 Central Bedfordshire 54 51 49 54 Lincolnshire 46 44 41 47 Stoke-on-Trent 45 45 43 46 Cheshire East 57 54 53 55 Liverpool 37 35 30 40 Suffolk 50 47 44 50 Cheshire West and Chester 55 53 51 56 Luton 48 48 45 50 Sunderland 53 52 50 54 City of London 100 100 100 100 Manchester 62 61 59 62 Surrey 52 50 48 53 Cornwall 46 45 42 48 Medway 34 32 27 36 Sutton 43 40 33 46 Coventry 47 44 41 47 Merton 75 73 75 72 Swindon 34 34 31 37 Croydon 58 56 52 59 Middlesbrough 44 43 40 46 Tameside 62 61 56 67 Cumbria 58 56 53 58 Milton Keynes 55 53 51 54 Telford and Wrekin 48 47 42 51 Darlington 37 37 35 38 Newcastle upon Tyne 56 52 52 53 Thurrock 30 30 29 32 Derby 45 42 41 44 Newham 67 66 66 66 Torbay 54 52 49 56 Derbyshire 45 42 40 45 Norfolk 43 41 39 44 Tower Hamlets 43 41 38 45 Devon 49 47 44 50 North East Lincolnshire 62 61 58 64 Trafford 61 59 59 59 Doncaster 58 55 51 59 North Lincolnshire 40 39 38 40 Wakefield 48 47 43 50 Dorset 51 48 45 52 North Somerset 51 49 47 51 Walsall 26 25 21 29 Dudley 56 56 53 58 North Tyneside 58 54 51 57 Waltham Forest 46 45 43 47 Durham 56 54 50 57 North Yorkshire 50 47 44 50 Wandsworth 38 35 30 40 Ealing 56 52 49 55 Northamptonshire 39 38 34 41 Warrington 59 57 54 61 East Riding of Yorkshire 51 48 45 50 Northumberland 52 49 47 51 Warwickshire 46 44 42 47 East Sussex 41 40 37 44 Nottingham 43 42 39 46 West Berkshire 43 41 37 45 Enfield 45 43 41 45 Nottinghamshire 50 47 45 50 West Sussex 46 44 41 47 Essex 47 45 43 48 Oldham 46 45 41 48 Westminster 33 31 27 34 Gateshead 62 58 57 59 Oxfordshire 47 45 41 48 Wigan 60 59 57 62 Gloucestershire 48 47 43 50 Peterborough 46 43 40 46 Wiltshire 42 41 37 44
Greenwich 50 48 44 52 Plymouth 36 33 30 37 Windsor and Maidenhead 51 48 45 51
Hackney 34 33 29 38 Poole 57 54 50 57 Wirral 54 52 49 55 Halton 39 38 37 40 Portsmouth 51 51 46 55 Wokingham 55 53 50 55 Hammersmith and Fulham 44 43 38 48 Pre LGR Cheshire 60 60 67 54 Wolverhampton 58 54 51 57 Hampshire 50 49 47 51 Reading 51 48 42 55 Worcestershire 60 58 56 60 Haringey 31 30 28 32 Redbridge 41 37 34 39 York 48 46 44 48

66
Table 5: Percentage of pupils participating in one or more community sports, dance or multi-skill clubs with links to the school during this academic year - analysis by Partnership
% of pupils participating in one or more community sports, dance or multi-skill clubs with links to the school during this academic year - analysis by Partnership
Years 2 - 11
Years 2 - 13
Years 2 - 11
Years 2 - 13
Years 2 - 11
Years 2 - 13
Abraham Guest 44 43 Blakeston Community 38 38 Churchill Community 40 38 Aireville 40 37 Blessed George Napier 29 28 Cirencester Kingshill 32 31 Alderman Peel 27 26 Blessed Trinity 40 40 City Academy (Bristol) 11 10 Alderman White 16 15 Bognor Regis 29 28 City Academy Norwich 29 27 All Hallows 46 46 Borden Grammar 25 24 City of Lincoln 39 36 All Saints 23 22 Boston Spa 33 32 Cliff Park 45 45 All Saints (Dunstable) 42 39 Bosworth 31 30 Collegiate / Palatine 32 32 Angley 44 43 Bracknell Forest 13 12 Colmers 28 27 Angmering 41 40 Bridgemary 36 34 Colne 28 27 Anthony Gell 62 60 Bridlington 50 48 Comberton Village 49 49 Archbishop Beck 35 33 Brighton Hill 53 53 Consett 39 38 Archbishop Lanfranc 44 42 Broad Oak / Bury 47 47 Coopers Company and Coborn 18 17 Arrow Vale 38 37 Brookfield (Derbyshire) 19 18 Copeland 44 43 Ash Manor 35 35 Brooksbank 27 26 Copleston 35 33 Ashington I (Ashington) 40 38 Brownedge St Marys 27 26 Corby 35 33 Ashington II (Blyth & Bedlington) 43 41 Buckingham 47 45 Corpus Christi 33 33 Ashington III (Cramlington & Seaton Valley) 59 59 Bulmershe 34 33 Coseley 15 15 Ashton Park 27 27 Burleigh 55 53 Countesthorpe 38 36 Ashton on Mersey 51 49 Burnage 22 22 Counthill 27 26 Astley 35 35 Burnham 31 29 Crown Hills 15 15 Astor of Hever 37 34 Burnholme 47 44 Cumberland (Newham) 36 36 Avon Valley 16 16 Buxton 34 32 Davenant 30 29 Aylesford 50 48 Caistor 47 45 Dayncourt 28 25 Bacons 48 46 Callington 49 47 Deanes 47 46 Balby Carr 24 24 Calthorpe 8 9 Denbigh 44 45 Barking Abbey 29 28 Canterbury 36 33 Derby Moor 20 19 Barlby 40 38 Capital City Academy (Brent) 36 34 Devizes 37 36 Barnet East 31 30 Cardinal Heenan 38 36 Dorothy Stringer 37 36 Barnet South 15 14 Cardinal Langley 40 40 Dr Challoners 19 17 Barnhill 38 35 Carisbrooke 34 35 Droitwich Spa 44 43 Basildon 25 25 Carr Manor 19 19 Durham Gilesgate 43 40 Baverstock 20 20 Carres 45 44 Dyson Perrins 29 28 Baysgarth 26 26 Carshalton 37 34 Easington 38 37 Beacon/North Wealdon 33 31 Castle (Kent) 24 23 Eastwood 31 29 Bebington 38 37 Castle (Somerset) 23 22 Ellis Guilford 35 34 Beckfoot 33 32 Caterham 16 14 Ellowes Hall 23 23 Benfield 31 31 Cavendish 26 24 Eltham Green 30 28 Benfield II (Newcastle) 24 23 Central Technology 48 47 Emerson Park 13 13 Berry Hill 26 26 Chadsgrove 27 26 Enfield 35 34 Bexley 23 22 Charlton 45 45 Epsom & Ewell 22 21 Biddenham 23 22 Charters 20 18 Evesham 41 40 Biddick 37 37 Chasetown 54 51 Failsworth 26 25 Biddulph 55 54 Cherry Willingham 42 42 Farnborough 26 25 Birchwood 33 30 Cheslyn Hay 47 45 Farringdon 34 34 Bishop Barrington 40 39 Chessington 38 35 Fearns 43 41 Bishop Challoner 28 27 Chesterfield/Sefton 56 53 Featherstone 28 27 Bishop Wand 20 20 Chesterton 51 50 Feltham 40 36 Bishops 37 35 Childwall 41 37 Fleetwood 33 34 Bitterne Park 30 30 Chipping Norton 34 33 Flixton Girls 23 23 Blacon 42 40 Christ College 36 33 Framingham Earl 44 43

67
% of pupils participating in one or more community sports, dance or multi-skill clubs with links to the school during this academic year - analysis by Partnership
Years 2 - 11
Years 2 - 13
Years 2 - 11
Years 2 - 13
Years 2 - 11
Years 2 - 13
Freman 38 36 Ivybridge Community 56 54 Lyng Hall 27 25 Furness 58 57 John Fisher 34 30 Madeley 21 19 Glenburn 40 39 John Madejski 18 16 Mandeville 41 41 Golden Hillock 29 29 John Spence 37 35 Manor (Nottinghamshire) 43 40 Grange (Dorset) 30 28 Joseph Whitaker 45 42 Manor (Raunds) 40 38 Grange (South Gloucestershire) 27 25 Kelsey Park 26 24 Mark Hall 29 28 Granville 36 35 Kenilworth 36 33 Marriotts 26 24 Great Baddow 33 31 Kineton 30 28 Mayfield 22 20 Great Torrington 57 57 King Alfreds (Oxfordshire) 31 30 Meopham 22 21 Greenacre 26 23 King Alfreds (Somerset) 40 40 Middlecott 46 45 Hackney Free & Parochial 28 27 King Arthurs 24 23 Minster (Herefordshire) 39 38 Hagley Park 43 42 King Edward VI 46 43 Mortimer I 47 46 Hailsham 17 17 King Edward VI Aston 8 8 Mortimer II 47 47 Hamble 49 49 King Edward VII (Kings Lynn) 34 33 Mountbatten 39 39 Hammersmith & Fulham 46 45 King Edward VII (Leicestershire) 28 27 Mounts Bay 33 33 Hamstead Hall 39 37 Kingdown Community 35 33 Mowbray 40 41 Handsworth Grange 34 34 Kings 63 62 Netherhall (Cambridgeshire) 43 42 Hanson 16 15 Kings Manor 46 45 Netherhall (Cumbria) 48 46 Harefield 42 39 Kingsbury 18 16 New Charter 41 41 Harlington 21 20 Kingsbury (Birmingham) 18 18 Newmarket 38 38 Harris (Warwickshire East) 17 16 Kirk Hallam 19 18 Newsome High 47 47 Harris Academy Merton 59 57 Kirkby 22 22 Nicholas Breakspear 19 18 Harris Girls Academy 26 25 Kirkby (Nottinghamshire) 49 46 Ninestiles 16 16 Harrogate 33 29 Kirkby Stephen 42 40 Norden 37 36 Harrow High 27 25 Kirkley 52 50 Norlington Boys 33 32 Hartford 31 31 Knights Academy 16 16 North Stoke 31 31 Hartismere 52 50 Knights Templar 25 23 Northampton Academy 28 27 Hartlepool SSP 38 38 Knottingley 28 27 Northfield 45 44 Harvey Grammar 10 9 Lacon Childe 43 43 Oakbank 56 54 Haverstock 33 31 Lady Lumleys 40 38 Oasis Academy Wintringham 24 24 Haydock 37 36 Lakelands 35 34 Oldbury 20 20 Haydon Bridge II (North Northumberland) 49 46 Lakes 45 43 Our Lady (Manchester) 22 22 Haydon Bridge III (Morpeth & Ponteland) 47 43 Lancaster 34 33 Our Lady and St Chad 34 32 Haydon Bridge/Tynedale 47 45 Langdon Park 32 31 Our Ladys Lancashire 34 32 Hayesbrook 34 32 Langdon School 48 47 Outwood Grange 48 47 Henry Cort 44 44 Laurence Jackson 36 36 Paignton 42 41 Herne Bay 28 27 Lea Valley 31 30 Park High 41 40 Heysham 34 33 Lees Brook 25 24 Park House 46 45 Heywood 23 22 Leon 33 32 Parklands 23 21 Hinchingbrooke 35 33 Lewisham 18 17 Pendle 32 32 Hipperholme & Lightcliffe 32 31 Leytonstone 39 39 Penryn 32 32 Holgate 23 23 Lode Heath 21 20 Pensby 36 34 Holmfirth High 47 47 London Nautical/Lambeth 23 22 Perins 37 37 Holy Cross 48 48 Longfield 27 26 Phoenix 23 23 Houghton Kepier 33 33 Longfield Melton 38 37 Pindar 32 32 Howard 27 25 Longslade 33 31 Plymstock 33 30 Hurstmere 25 23 Lord William's 14 13 Poltair 44 44 Idsall 36 34 Lordswood Boys 31 31 Portchester Boys 24 23 Isleworth & Syon 22 20 Lowton 35 35 Priesthorpe 35 34 Islington 36 36 Lymm 45 43 Priestnall 36 36

68
% of pupils participating in one or more community sports, dance or multi-skill clubs with links to the school during this academic year - analysis by Partnership
Years 2 - 11
Years 2 - 13
Years 2 - 11
Years 2 - 13
Years 2 - 11
Years 2 - 13
Priory (Barnsley) 38 37 Smiths Wood 23 21 Tongs 36 35 Priory (Bromley) 29 27 South Dartmoor 24 23 Tower Hamlets 12 12 Priory (Portsmouth) 34 34 South Hunsley 46 44 Toynbee 43 43 Queen Elizabeth (Northern Warwickshire) 29 29 South Wigston 35 31 Tupton Hall 23 22 Queen Elizabeths (Dorset) 41 39 Southfield 23 21 Turnford 35 34 Queen Elizabeths Girls 21 19 Southfields / Ernest Bevin 30 27 University of Chester Academy 45 43 Queens 33 30 Spalding High 43 41 Ursuline 16 15 Radcliffe 45 43 Spen Valley 37 35 Vandyke Upper 42 41 Ramsey 38 38 St Ambrose Barlow 47 47 Wallingford 26 24 Rawlett 30 29 St Andrews 33 30 Wayland 29 27 Rawmarsh 27 26 St Bedes (Bristol) 22 20 Weald 49 47 Redborne 34 34 St Bedes/Blackburn with Darwen 19 19 Wellsway (5) 41 40 Redbridge 26 26 St Edmunds 35 32 Wellsway (9) 35 32 Retford Oaks 52 50 St James 14 13 Wentworth 42 42 Richard Rose 25 23 St John Fisher 33 32 West London Academy 52 49 Rickmansworth 33 30 St Josephs 46 45 Westbourne 29 28 Risedale 39 37 St Lawrence Academy 34 34 Westcroft 59 57 Roade 28 27 St Lukes (Exeter) 28 27 Westfield (Points Sheffield) 25 24 Robert Sutton 41 40 St Lukes (Swindon) 19 18 Westminster 40 37 Rodillian 38 36 St Marys (Hull) 29 29 Wexham 19 17 Roseberry 48 46 St Marys (Leeds) 33 32 Wey Valley 46 43 Rossington 20 19 St Pauls 35 34 Wheldon 28 27 Rossmore 43 42 St Thomas More 19 18 Whickham East 23 22 Roundwood Park 21 19 Stafford 53 50 Whickham West 36 34 Royal Alexandra & Albert 25 24 Stanground 29 27 Whitecross 28 28 Rush Croft 34 32 Stanley 46 44 Whitton (Richmond) 53 53 Ruskin 31 31 Staunton Park 27 27 Wickersley 22 21 Rutland 28 28 Stockport 39 39 Willenhall 16 15 Rye Hills 21 21 Stopsley 33 33 William Beamont 24 24 Saffron Walden 33 32 Stourport 32 30 William Edwards 29 29 Saints Peter & Paul (Halton) 35 35 Stowmarket 59 57 William Parker 19 20 Samuel Cody 19 19 Streetly 18 16 William de Ferrers 32 30 Sandbach 45 44 Sudbury 40 39 Wilmslow 22 21 Sandown 42 42 Sundorne 37 37 Wilson Stuart 64 59 Sandy Upper 36 36 Sutton High 34 33 Windsor (Dudley) 31 31 Sedgefield 39 39 Swadelands 19 18 Windsor Boys and Girls 44 42 Sele 60 55 Swan Valley 51 48 Winston Churchill 20 19 Shaftesbury 50 47 Swanwick Hall 23 22 Wisewood (Arches) 21 21 Sharnbrook Upper 41 42 Taverham 47 46 Witchford 31 31 Shelfield 16 15 Testwood 38 37 Wood Green (Sandwell) 26 25 Shenfield 24 22 Theale Green 46 43 Woodcote 18 17 Shoeburyness 47 45 Therfield 15 15 Woodhey 65 65 Siddal Moor 49 48 Thirsk 49 46 Woodlands 22 21 Sion-Manning 60 59 Thomas Bennett 27 27 Woodside High 26 26 Sir Frederic Osborn 26 24 Thomas Keble 36 35 Worden 47 47 Sir John Hunt 30 28 Thornleigh Salesian 30 29 Wright Robinson (Manchester East) 27 26 Sir William Borlase 43 41 Thornton Grammar 14 14 Wye Valley 40 37 Sirius Academy 56 56 Thorpe St Andrew 33 32 Wyvern 25 25 Skegness Grammar 40 39 Thurstable 46 45 Yate International 32 31 Smestow 17 16 Tibshelf 23 23 York High 35 34

69
Table 6: Percentage of pupils participating in one or more community sports, dance or multi-skill clubs with links to the school during this academic year - analysis by Local Authority
% of pupils participating in one or more community sports, dance or multi-skill clubs with links to the school during this academic year - analysis by Local Authority
Years 2 - 11
Years 2 - 13
Years 2 - 11
Years 2 - 13
Years 2 - 11
Years 2 - 13
Barking and Dagenham 29 28 Harrow 27 25 Redcar and Cleveland 29 29 Barnet 20 19 Hartlepool 38 38 Richmond upon Thames 53 53 Barnsley 30 30 Havering 15 15 Rochdale 44 44 Bath and North East Somerset 37 35 Herefordshire 33 33 Rotherham 24 23 Bedford 28 27 Hertfordshire 30 28 Rutland 27 27 Bexley 24 23 Hillingdon 34 32 Salford 44 44 Birmingham 26 26 Hounslow 30 27 Sandwell 23 22 Blackburn with Darwen 19 19 Isle of Wight 38 38 Sefton 50 48 Blackpool 32 32 Isles Of Scilly 62 62 Sheffield 26 25 Bolton 38 37 Islington 36 36 Shropshire 37 36 Bournemouth 24 23 Kensington and Chelsea 60 59 Slough 19 17 Bracknell Forest 13 12 Kent 30 29 Solihull 22 21 Bradford 30 29 Kingston upon Hull City of 41 41 Somerset 29 28 Brent 25 23 Kingston upon Thames 38 35 South Gloucestershire 30 28 Brighton and Hove 37 36 Kirklees 41 40 South Tyneside 47 47 Bristol City of 20 19 Knowsley 23 23 Southampton 28 28 Bromley 27 25 Lambeth 23 22 Southend-on-Sea 38 36 Buckinghamshire 36 34 Lancashire 37 36 Southwark 36 35 Bury 54 54 Leeds 32 30 St. Helens 36 35 Calderdale 29 28 Leicester 24 23 Staffordshire 47 45 Cambridgeshire 39 38 Leicestershire 37 35 Stockport 37 37 Camden 34 31 Lewisham 17 16 Stockton-on-Tees 43 42 Central Bedfordshire 38 37 Lincolnshire 43 42 Stoke-on-Trent 28 28 Cheshire East 33 32 Liverpool 34 32 Suffolk 42 41 Cheshire West and Chester 39 38 Luton 37 37 Sunderland 35 35 City of London 100 100 Manchester 24 24 Surrey 23 22 Cornwall 40 40 Medway 27 24 Sutton 36 32 Coventry 24 23 Merton 59 57 Swindon 19 18 Croydon 31 30 Middlesbrough 46 45 Tameside 38 38 Cumbria 44 42 Milton Keynes 40 38 Telford and Wrekin 22 21 Darlington 27 26 Newcastle upon Tyne 27 26 Thurrock 29 29 Derby 22 21 Newham 43 42 Torbay 42 41 Derbyshire 29 28 Norfolk 36 35 Tower Hamlets 23 23 Devon 45 44 North East Lincolnshire 24 24 Trafford 39 38 Doncaster 23 22 North Lincolnshire 30 30 Wakefield 37 36 Dorset 42 40 North Somerset 25 25 Walsall 17 16 Dudley 23 23 North Tyneside 38 37 Waltham Forest 35 34 Durham 40 40 North Yorkshire 39 36 Wandsworth 30 27 Ealing 41 39 Northamptonshire 31 29 Warrington 36 35 East Riding of Yorkshire 48 46 Northumberland 47 45 Warwickshire 28 27 East Sussex 21 21 Nottingham 32 31 West Berkshire 46 44 Enfield 33 32 Nottinghamshire 37 35 West Sussex 36 35 Essex 35 34 Oldham 27 26 Westminster 40 37 Gateshead 29 28 Oxfordshire 27 25 Wigan 39 39 Gloucestershire 34 32 Peterborough 28 27 Wiltshire 31 30 Greenwich 37 35 Plymouth 32 29 Windsor and Maidenhead 28 26 Hackney 28 27 Poole 44 42 Wirral 38 37 Halton 35 35 Portsmouth 34 34 Wokingham 34 33 Hammersmith and Fulham 46 45 Pre LGR (2009) Cheshire 19 19 Wolverhampton 32 30 Hampshire 38 38 Reading 18 16 Worcestershire 36 35 Haringey 23 22 Redbridge 19 17 York 42 40

70
Table 7: Percentage of pupils actively involved in sports volunteering and leadership this academic year - analysis by Partnership
% of pupils actively involved in sports volunteering and leadership this academic year - analysis by Partnership
Years 1 - 11
Years 1 - 13
GIR
LS Y
ears 1 - 13
BO
YS
Years 1 - 13
Years 1 - 11
Years 1 - 13
GIR
LS Y
ears 1 - 13
BO
YS
Years 1 - 13
Years 1 - 11
Years 1 - 13
GIR
LS Y
ears 1 - 13
BO
YS
Years 1 - 13
Abraham Guest 21 21 22 19 Blessed George Napier 17 17 18 16 City Academy Bristol 7 6 7 6
Aireville 21 21 20 22 Blessed Trinity 27 27 27 27 City Academy Norwich 28 28 29 27
Alderman Peel 14 14 14 15 Bognor Regis 15 15 16 14 City of Lincoln 18 18 18 18
Alderman White 29 28 30 27 Borden Grammar 14 14 13 14 Cliff Park 32 33 34 32
All Hallows 18 18 18 17 Boston Spa 21 20 18 22 Collegiate Palatine 29 28 29 28
All Saints 13 13 13 13 Bosworth 17 17 17 17 Colmers 28 28 30 26
All Saints (Dunstable) 17 16 17 16 Bracknell Forest 21 21 21 20 Colne 15 14 15 13
Angley 15 15 14 16 Bridgemary 12 12 11 13 Comberton Village 23 22 23 22
Angmering 19 19 19 18 Bridlington 17 17 18 16 Consett 25 24 25 24
Anthony Gell 30 31 32 29 Brighton Hill 31 31 33 29 Coopers Company and Coborn 13 13 12 13
Archbishop Beck 30 30 29 32 Broad Oak / Bury 23 23 22 23 Copeland 14 14 14 13
Archbishop Lanfranc 18 18 19 17 Brookfield (Derbyshire) 31 30 31 29 Copleston 21 20 20 19
Arrow Vale 14 14 15 13 Brooksbank 22 21 22 21 Corby 10 10 10 10
Ash Manor 24 24 24 24 Brownedge St Marys 18 18 18 17 Corpus Christi 16 16 17 16
Ashington I (Ashington) 29 29 28 29 Buckingham 29 28 30 28 Coseley 14 14 14 15 Ashington II (Blyth & Bedlington) 37 36 38 34 Bulmershe 20 20 21 19 Countesthorpe 15 15 16 14
Ashington III (Cramlington & Seaton Valley)
23 22 23 20 Burleigh
12 12 13 12 Counthill
18 18 18 18
Ashton Park 16 16 16 15 Burnage 23 23 25 21 Crown Hills 17 16 17 16
Ashton on Mersey 30 29 30 29 Burnham 19 20 25 13 Cumberland Newham 22 22 22 22
Astley 22 22 22 21 Burnholme 31 31 34 29 Davenant 17 17 17 16
Astor of Hever 19 19 22 16 Buxton 22 21 21 22 Dayncourt 22 20 22 19
Avon Valley 21 21 21 21 Caistor 38 37 37 36 Deanes 24 24 25 23
Aylesford 48 48 44 52 Callington 26 25 27 24 Denbigh 36 35 36 34
Bacons 10 10 10 11 Calthorpe 11 10 11 10 Derby Moor 17 16 18 15
Balby Carr 19 20 20 19 Canterbury 37 34 36 31 Devizes 38 39 39 39
Barking Abbey 23 22 22 21 Capital City Academy (Brent) 17 17 18 16 Dorothy Stringer 15 15 15 15
Barlby 31 31 31 30 Cardinal Heenan 30 31 31 30 Dr Challoners 26 25 28 23
Barnet East 54 51 52 50 Cardinal Langley 40 39 42 36 Droitwich Spa 22 22 22 21
Barnet South 43 39 43 36 Carisbrooke 19 20 20 19 Durham Gilesgate 25 24 24 24
Barnhill 37 34 33 36 Carr Manor 18 17 17 17 Dyson Perrins 24 24 24 23
Basildon 15 15 16 14 Carres 29 28 28 27 Easington 14 14 15 13
Baverstock 21 21 24 18 Carshalton 33 31 31 32 Eastwood 38 35 41 30
Baysgarth 19 19 20 18 Castle (Kent) 14 14 15 12 Ellis Guilford 9 9 9 8
Beacon/North Wealdon 22 20 22 19 Castle (Somerset) 24 24 24 24 Ellowes Hall 30 30 30 29
Bebington 45 45 47 44 Caterham 16 15 17 14 Eltham Green 17 16 18 14
Beckfoot 26 25 28 22 Cavendish 26 25 24 26 Emerson Park 21 20 21 20
Benfield 25 25 25 24 Central Technology 25 25 24 25 Enfield 66 61 63 59
Benfield II Newcastle 15 15 15 15 Chadsgrove 18 19 19 19 Epsom & Ewell 9 9 9 9
Berry Hill 18 17 19 16 Charlton 26 26 31 22 Evesham 14 14 15 13
Bexley 25 25 27 23 Charters 17 16 21 12 Failsworth 39 39 39 39
Biddenham 23 23 23 23 Chasetown 24 23 25 21 Farnborough 17 17 16 17
Biddick 27 26 29 24 Cherry Willingham 24 23 24 23 Farringdon 16 16 19 13
Biddulph 22 23 23 22 Cheslyn Hay 83 79 78 80 Fearns 37 35 36 33
Birchwood 24 23 25 22 Chessington 39 36 42 30 Featherstone 12 12 12 12
Bishop Barrington 16 16 16 16 Chesterfield/Sefton 41 41 41 41 Feltham 75 67 68 67
Bishop Challoner 22 21 18 25 Chesterton 18 18 18 18 Fleetwood 20 20 21 19
Bishop Wand 21 21 21 20 Childwall 22 21 19 23 Flixton Girls 20 19 23 16
Bishops 25 24 25 22 Chipping Norton 18 17 19 16 Framingham Earl 24 24 24 23
Bitterne Park 69 69 68 70 Christ College 40 37 38 37 Freman 62 59 63 56
Blacon 39 39 41 37 Churchill Community 39 37 38 37 Furness 26 26 26 25
Blakeston Community 23 23 24 21 Cirencester Kingshill 30 29 30 27 Glenburn 30 30 31 29
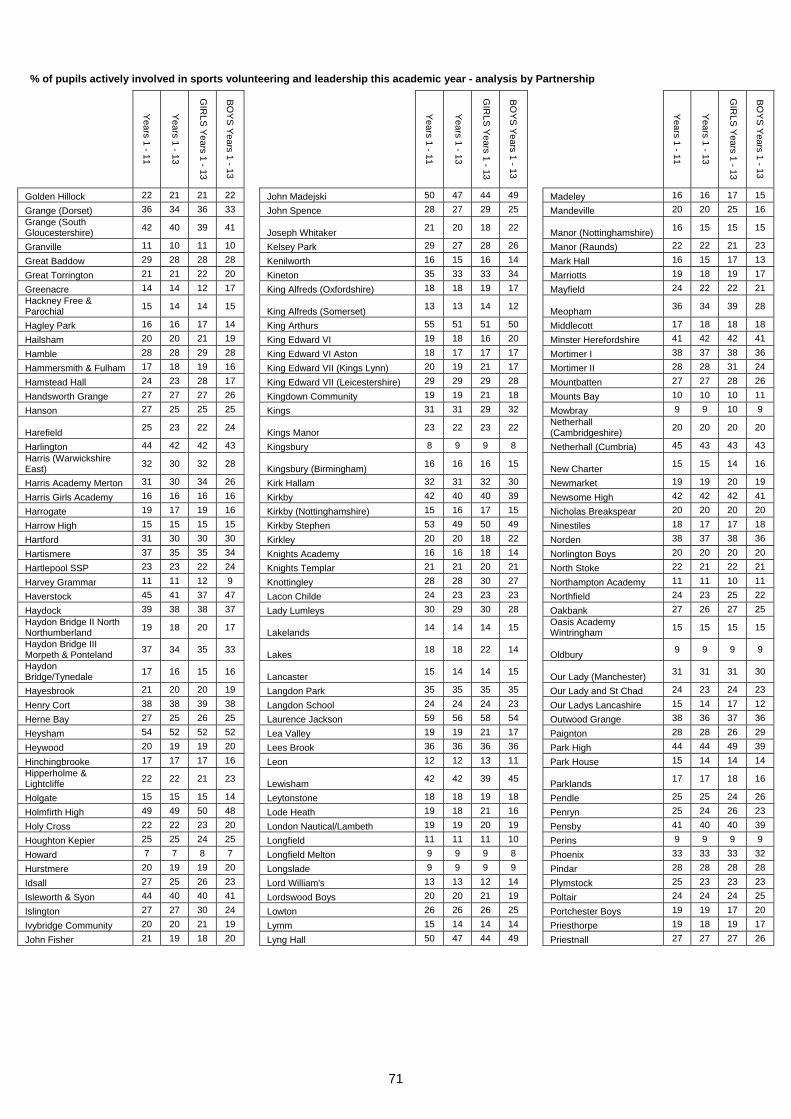
71
% of pupils actively involved in sports volunteering and leadership this academic year - analysis by Partnership
Years 1 - 11
Years 1 - 13
GIR
LS Y
ears 1 - 13
BO
YS
Years 1 - 13
Years 1 - 11
Years 1 - 13
GIR
LS Y
ears 1 - 13
BO
YS
Years 1 - 13
Years 1 - 11
Years 1 - 13
GIR
LS Y
ears 1 - 13
BO
YS
Years 1 - 13
Golden Hillock 22 21 21 22 John Madejski 50 47 44 49 Madeley 16 16 17 15
Grange (Dorset) 36 34 36 33 John Spence 28 27 29 25 Mandeville 20 20 25 16 Grange (South Gloucestershire) 42 40 39 41 Joseph Whitaker 21 20 18 22 Manor (Nottinghamshire) 16 15 15 15
Granville 11 10 11 10 Kelsey Park 29 27 28 26 Manor (Raunds) 22 22 21 23
Great Baddow 29 28 28 28 Kenilworth 16 15 16 14 Mark Hall 16 15 17 13
Great Torrington 21 21 22 20 Kineton 35 33 33 34 Marriotts 19 18 19 17
Greenacre 14 14 12 17 King Alfreds (Oxfordshire) 18 18 19 17 Mayfield 24 22 22 21 Hackney Free & Parochial 15 14 14 15 King Alfreds (Somerset) 13 13 14 12 Meopham 36 34 39 28
Hagley Park 16 16 17 14 King Arthurs 55 51 51 50 Middlecott 17 18 18 18
Hailsham 20 20 21 19 King Edward VI 19 18 16 20 Minster Herefordshire 41 42 42 41
Hamble 28 28 29 28 King Edward VI Aston 18 17 17 17 Mortimer I 38 37 38 36
Hammersmith & Fulham 17 18 19 16 King Edward VII (Kings Lynn) 20 19 21 17 Mortimer II 28 28 31 24
Hamstead Hall 24 23 28 17 King Edward VII (Leicestershire) 29 29 29 28 Mountbatten 27 27 28 26
Handsworth Grange 27 27 27 26 Kingdown Community 19 19 21 18 Mounts Bay 10 10 10 11
Hanson 27 25 25 25 Kings 31 31 29 32 Mowbray 9 9 10 9
Harefield 25 23 22 24 Kings Manor 23 22 23 22 Netherhall (Cambridgeshire) 20 20 20 20
Harlington 44 42 42 43 Kingsbury 8 9 9 8 Netherhall (Cumbria) 45 43 43 43 Harris (Warwickshire East) 32 30 32 28 Kingsbury (Birmingham) 16 16 16 15 New Charter 15 15 14 16
Harris Academy Merton 31 30 34 26 Kirk Hallam 32 31 32 30 Newmarket 19 19 20 19
Harris Girls Academy 16 16 16 16 Kirkby 42 40 40 39 Newsome High 42 42 42 41
Harrogate 19 17 19 16 Kirkby (Nottinghamshire) 15 16 17 15 Nicholas Breakspear 20 20 20 20
Harrow High 15 15 15 15 Kirkby Stephen 53 49 50 49 Ninestiles 18 17 17 18
Hartford 31 30 30 30 Kirkley 20 20 18 22 Norden 38 37 38 36
Hartismere 37 35 35 34 Knights Academy 16 16 18 14 Norlington Boys 20 20 20 20
Hartlepool SSP 23 23 22 24 Knights Templar 21 21 20 21 North Stoke 22 21 22 21
Harvey Grammar 11 11 12 9 Knottingley 28 28 30 27 Northampton Academy 11 11 10 11
Haverstock 45 41 37 47 Lacon Childe 24 23 23 23 Northfield 24 23 25 22
Haydock 39 38 38 37 Lady Lumleys 30 29 30 28 Oakbank 27 26 27 25 Haydon Bridge II North Northumberland 19 18 20 17 Lakelands 14 14 14 15 Oasis Academy
Wintringham 15 15 15 15
Haydon Bridge III Morpeth & Ponteland 37 34 35 33 Lakes 18 18 22 14 Oldbury 9 9 9 9
Haydon Bridge/Tynedale 17 16 15 16 Lancaster 15 14 14 15 Our Lady (Manchester) 31 31 31 30
Hayesbrook 21 20 20 19 Langdon Park 35 35 35 35 Our Lady and St Chad 24 23 24 23
Henry Cort 38 38 39 38 Langdon School 24 24 24 23 Our Ladys Lancashire 15 14 17 12
Herne Bay 27 25 26 25 Laurence Jackson 59 56 58 54 Outwood Grange 38 36 37 36
Heysham 54 52 52 52 Lea Valley 19 19 21 17 Paignton 28 28 26 29
Heywood 20 19 19 20 Lees Brook 36 36 36 36 Park High 44 44 49 39
Hinchingbrooke 17 17 17 16 Leon 12 12 13 11 Park House 15 14 14 14 Hipperholme & Lightcliffe 22 22 21 23 Lewisham 42 42 39 45 Parklands 17 17 18 16
Holgate 15 15 15 14 Leytonstone 18 18 19 18 Pendle 25 25 24 26
Holmfirth High 49 49 50 48 Lode Heath 19 18 21 16 Penryn 25 24 26 23
Holy Cross 22 22 23 20 London Nautical/Lambeth 19 19 20 19 Pensby 41 40 40 39
Houghton Kepier 25 25 24 25 Longfield 11 11 11 10 Perins 9 9 9 9
Howard 7 7 8 7 Longfield Melton 9 9 9 8 Phoenix 33 33 33 32
Hurstmere 20 19 19 20 Longslade 9 9 9 9 Pindar 28 28 28 28
Idsall 27 25 26 23 Lord William's 13 13 12 14 Plymstock 25 23 23 23
Isleworth & Syon 44 40 40 41 Lordswood Boys 20 20 21 19 Poltair 24 24 24 25
Islington 27 27 30 24 Lowton 26 26 26 25 Portchester Boys 19 19 17 20
Ivybridge Community 20 20 21 19 Lymm 15 14 14 14 Priesthorpe 19 18 19 17
John Fisher 21 19 18 20 Lyng Hall 50 47 44 49 Priestnall 27 27 27 26

72
% of pupils actively involved in sports volunteering and leadership this academic year - analysis by Partnership
Years 1 - 11
Years 1 - 13
GIR
LS Y
ears 1 - 13
BO
YS
Years 1 - 13
Years 1 - 11
Years 1 - 13
GIR
LS Y
ears 1 - 13
BO
YS
Years 1 - 13
Y
ears 1 - 11
Years 1 - 13
GIR
LS Y
ears 1 - 13
BO
YS
Years 1 - 13
Priory (Barnsley) 37 37 36 37 Smiths Wood 18 18 17 18 Tongs 28 28 27 28
Priory (Bromley) 26 25 23 26 South Dartmoor 17 16 18 15 Tower Hamlets 13 13 13 12
Priory (Portsmouth) 18 18 18 17 South Hunsley 20 19 19 19 Toynbee 57 57 56 57 Queen Elizabeth (Northern Warwickshire)
15 15 15 15 South Wigston
21 19 19 18 Tupton Hall
32 30 29 31
Queen Elizabeths (Dorset) 21 20 21 20 Southfield 26 25 28 21 Turnford 21 22 22 22
Queen Elizabeths Girls 50 45 46 44 Southfields / Ernest Bevin 17 16 15 16 University of Chester Academy 20 20 21 19
Queens 23 22 23 20 Spalding High 30 29 29 29 Ursuline 35 33 32 34
Radcliffe 37 34 34 34 Spen Valley 33 31 31 31 Vandyke Upper 47 45 47 43
Ramsey 24 24 23 25 St Ambrose Barlow 29 29 29 30 Wallingford 20 19 18 20
Rawlett 14 14 17 12 St Andrews 14 13 13 14 Wayland 18 17 17 18
Rawmarsh 36 35 34 35 St Bedes (Bristol) 9 9 9 8 Weald 17 17 19 15
Redborne 47 44 44 44 St Bedes/Blackburn with Darwen 25 24 26 23 Wellsway (5) 26 25 27 24
Redbridge 56 56 60 53 St Edmunds 25 24 32 16 Wellsway (9) 27 25 25 24
Retford Oaks 20 19 20 19 St James 71 65 64 65 Wentworth 11 11 11 11
Richard Rose 37 35 36 34 St John Fisher 34 34 34 33 West London Academy 51 47 45 50
Rickmansworth 34 33 32 34 St Josephs 19 19 20 18 Westbourne 22 22 22 22
Risedale 27 26 25 27 St Lawrence Academy 34 34 35 33 Westcroft 25 25 25 24
Roade 16 16 15 17 St Lukes (Exeter) 22 21 22 21 Westfield (Points Sheffield) 7 8 8 7
Robert Sutton 17 17 20 15 St Lukes (Swindon) 10 10 10 9 Westminster 5 5 5 5
Rodillian 41 41 41 40 St Marys (Hull) 29 28 32 25 Wexham 11 11 11 11
Roseberry 40 39 41 36 St Marys (Leeds) 59 56 57 54 Wey Valley 32 30 30 31
Rossington 36 34 35 34 St Pauls 23 23 22 23 Wheldon 29 27 28 27
Rossmore 39 39 40 39 St Thomas More 11 11 11 11 Whickham East 20 19 22 17
Roundwood Park 20 19 19 19 Stafford 28 27 28 26 Whickham West 18 18 18 17 Royal Alexandra & Albert 32 30 31 30 Stanground 29 28 28 28 Whitecross 25 24 25 24
Rush Croft 31 30 32 27 Stanley 39 38 40 37 Whitton (Richmond) 52 52 52 52
Ruskin 24 23 24 23 Staunton Park 22 22 23 21 Wickersley 11 12 12 11
Rutland 20 20 20 20 Stockport 22 22 24 21 Willenhall 30 29 29 29
Rye Hills 27 27 27 27 Stopsley 37 37 39 34 William Beamont 38 38 39 36
Saffron Walden 12 11 12 11 Stourport 23 22 24 21 William Edwards 24 24 26 23 Saints Peter & Paul (Halton) 35 35 35 35 Stowmarket 24 22 22 23 William Parker 21 21 22 19
Samuel Cody 11 11 12 9 Streetly 9 9 8 9 William de Ferrers 28 27 27 27
Sandbach 23 22 25 19 Sudbury 28 27 26 28 Wilmslow 30 28 27 30
Sandown 17 19 18 19 Sundorne 13 13 14 12 Wilson Stuart 42 39 40 39
Sandy Upper 38 39 36 41 Sutton High 27 27 29 24 Windsor (Dudley) 27 28 28 27
Sedgefield 36 36 37 34 Swadelands 15 15 14 17 Windsor Boys and Girls 17 17 17 16
Sele 41 39 40 39 Swan Valley 25 27 25 29 Winston Churchill 17 17 16 17
Shaftesbury 25 24 24 23 Swanwick Hall 18 17 18 16 Wisewood (Arches) 13 13 14 13
Sharnbrook Upper 64 59 64 55 Taverham 34 33 34 31 Witchford 21 21 21 20
Shelfield 9 9 10 9 Testwood 35 34 35 33 Wood Green (Sandwell) 6 6 6 6
Shenfield 21 20 21 19 Theale Green 12 12 11 12 Woodcote 13 13 14 12
Shoeburyness 32 30 33 27 Therfield 20 19 19 19 Woodhey 19 19 19 19
Siddal Moor 23 23 23 23 Thirsk 24 24 23 24 Woodlands 13 13 13 12
Sion-Manning 17 16 16 17 Thomas Bennett 16 16 15 17 Woodside High 6 7 6 7
Sir Frederic Osborn 18 19 19 20 Thomas Keble 24 23 20 26 Worden 21 21 21 21
Sir John Hunt 28 26 30 23 Thornleigh Salesian 19 19 20 17 Wright Robinson (Manchester East) 19 18 18 18
Sir William Borlase 19 21 16 24 Thornton Grammar 7 7 7 6 Wye Valley 11 12 11 13
Sirius Academy 28 28 25 30 Thorpe St Andrew 31 30 32 29 Wyvern 19 18 18 19
Skegness Grammar 20 20 20 20 Thurstable 81 78 79 77 Yate International 36 34 34 35
Smestow 19 18 19 17 Tibshelf 25 25 26 24 York High 15 15 17 13

73
Table 8: Percentage of pupils actively involved in sports volunteering and leadership this academic year - analysis by Local Authority
% of pupils actively involved in sports volunteering and leadership this academic year - analysis by Local Authority
Years 1 - 11
Years 1 - 13
GIR
LS Y
ears 1 - 13
BO
YS
Years 1 - 13
Years 1 - 11
Years 1 - 13
GIR
LS Y
ears 1 - 13
BO
YS
Years 1 - 13
Years 1 - 11
Years 1 - 13
GIR
LS Y
ears 1 - 13
BO
YS
Years 1 - 13
Barking and Dagenham 23 22 22 21 Harrow 15 15 15 15 Redcar and Cleveland 25 25 26 25
Barnet 56 51 53 49 Hartlepool 23 23 22 24 Richmond upon Thames 52 52 52 52
Barnsley 25 25 25 25 Havering 17 17 17 16 Rochdale 31 31 32 29 Bath and North East Somerset 26 25 26 24 Herefordshire 32 32 32 32 Rotherham 23 23 23 23
Bedford 31 30 31 29 Hertfordshire 25 24 24 24 Rutland 20 20 21 20
Bexley 22 22 22 21 Hillingdon 34 32 31 33 Salford 14 14 14 14
Birmingham 20 20 20 20 Hounslow 57 52 51 52 Sandwell 8 8 8 7
Blackburn with Darwen 25 24 26 23 Isle of Wight 18 19 19 19 Sefton 38 37 38 37
Blackpool 29 28 29 28 Isles Of Scilly 22 22 30 14 Sheffield 15 15 16 15
Bolton 19 19 20 18 Islington 27 27 30 24 Shropshire 24 23 25 22
Bournemouth 19 19 17 20 Kensington and Chelsea 17 16 16 17 Slough 11 11 11 11
Bracknell Forest 21 21 21 20 Kent 24 23 23 23 Solihull 18 18 18 18
Bradford 22 22 22 21 Kingston upon Hull City of 28 28 29 27 Somerset 18 18 18 17
Brent 21 20 21 19 Kingston upon Thames 39 36 42 30 South Gloucestershire 38 37 36 37
Brighton and Hove 15 15 15 15 Kirklees 40 39 40 39 South Tyneside 33 32 35 30
Bristol City of 10 10 10 10 Knowsley 32 31 32 31 Southampton 61 61 63 60
Bromley 23 22 20 24 Lambeth 19 18 21 16 Southend-on-Sea 35 33 37 29
Buckinghamshire 21 21 23 19 Lancashire 26 26 27 25 Southwark 13 13 13 13
Bury 21 21 21 22 Leeds 32 31 31 30 St. Helens 33 33 35 31
Calderdale 22 22 21 22 Leicester 17 17 19 15 Staffordshire 27 27 28 25
Cambridgeshire 20 20 20 19 Leicestershire 16 15 16 15 Stockport 25 25 26 24
Camden 45 41 37 46 Lewisham 16 16 16 17 Stockton-on-Tees 24 23 25 22
Central Bedfordshire 40 38 38 38 Lincolnshire 25 24 25 24 Stoke-on-Trent 20 19 21 18
Cheshire East 26 25 26 24 Liverpool 25 25 24 25 Suffolk 31 30 30 30 Cheshire West and Chester 31 31 31 30 Luton 36 36 38 34 Sunderland 23 22 24 20
City of London 16 16 15 16 Manchester 24 23 24 22 Surrey 21 20 20 20
Cornwall 23 23 24 22 Medway 10 10 10 11 Sutton 28 25 24 27
Coventry 14 13 13 13 Merton 31 30 34 26 Swindon 10 10 10 9
Croydon 15 15 15 14 Middlesbrough 31 31 29 32 Tameside 19 19 18 19
Cumbria 27 26 27 26 Milton Keynes 36 35 35 35 Telford and Wrekin 25 25 26 24
Darlington 19 19 20 19 Newcastle upon Tyne 19 19 19 19 Thurrock 24 24 26 23
Derby 17 17 19 15 Newham 30 29 29 30 Torbay 28 28 26 29
Derbyshire 23 22 23 22 Norfolk 25 24 25 24 Tower Hamlets 14 14 13 14
Devon 20 20 21 19 North East Lincolnshire 15 15 15 15 Trafford 26 25 27 24
Doncaster 26 26 26 25 North Lincolnshire 27 27 28 26 Wakefield 29 28 28 28
Dorset 29 28 28 27 North Somerset 19 18 18 19 Walsall 16 16 16 16
Dudley 24 24 24 23 North Tyneside 44 42 41 43 Waltham Forest 30 29 30 29
Durham 25 24 25 23 North Yorkshire 24 23 24 23 Wandsworth 17 16 15 16
Ealing 33 32 32 33 Northamptonshire 17 16 16 17 Warrington 31 31 32 30
East Riding of Yorkshire 19 18 19 18 Northumberland 28 26 27 25 Warwickshire 21 20 21 20
East Sussex 21 20 21 19 Nottingham 12 12 12 12 West Berkshire 13 13 13 13
Enfield 62 59 61 57 Nottinghamshire 27 25 26 25 West Sussex 18 18 18 17
Essex 30 29 29 28 Oldham 28 27 27 27 Westminster 5 5 5 5
Gateshead 19 19 20 17 Oxfordshire 19 19 19 18 Wigan 21 20 22 19
Gloucestershire 28 27 27 27 Peterborough 30 28 28 28 Wiltshire 29 29 30 27
Greenwich 21 20 23 18 Plymouth 26 24 26 22 Windsor and Maidenhead 17 16 20 13
Hackney 15 14 14 15 Poole 40 40 40 39 Wirral 43 43 45 41
Halton 35 35 35 35 Portsmouth 18 18 18 17 Wokingham 20 20 21 19
Hammersmith and Fulham 17 18 19 16 Pre LGR Cheshire 15 15 16 15 Wolverhampton 22 21 22 21
Hampshire 27 27 28 26 Reading 13 12 13 12 Worcestershire 20 19 20 19
Haringey 9 9 9 9 Redbridge 20 18 20 17 York 24 25 27 22

74
Appendix B – Schools questionnaire

75
Annual PE and Sport Survey 2009/10
The purpose of this survey is to help you, your partnership and the Government to evaluate progress towards meeting the aims of the national PE and Sport Strategy for Young People.
We would like you to complete the questionnaire online at www.tnsinfo.com/sportsurvey. A paper copy has been provided to help you collect answers for each question but unless your PDM has given you different instructions, your questionnaire must be submitted online this year. This year, many questions ask for the number of boys and girls separately. This change reflects an important policy need to measure any differences in the uptake of PE and school sport between girls and boys. This will help schools and partnerships to assess their strengths and weaknesses and address any gender issues.
To help you collect data by gender we have developed a data collection spreadsheet that you can download from the survey website: www.tnsinfo.com/sportsurvey A guide to the survey has been produced to help you understand the questions and complete the questionnaire. The guide provides definitions for the key terms used in the questions and other useful information. You should have received a copy of the guide but if do not have it, you can get a copy from the survey website. We hope you find completing the survey straightforward.
Your School URN:
Your Partnership number:
School name and address:
Contact name (for queries):
Telephone number (for queries):
IMPORTANT DATES
You must submit your data on the website by 1st July 2010

76
About your school In order to be able to report accurately on the information you provide, we need current and accurate information about the number of pupils in each year group by gender in your school. Please provide this information below.
How many pupils do you have in each year group?
Enter total number of pupils per year group by gender. (put 0 if none, do not leave cells blank)
GIRLS BOYS
Year 1 Year 1
Year 2 Year 2
Year 3 Year 3
Year 4 Year 4
Year 5 Year 5
Year 6 Year 6
Year 7 Year 7
Year 8 Year 8
Year 9 Year 9
Year 10 Year 10
Year 11 Year 11
Year 12 Year 12
Year 13 Year 13

77
Question 1
What is the total curriculum time in minutes that ALL pupils in each year group spend taking part in PE* in a typical week?
Enter total curriculum time in minutes by gender (put 0 if none, leave cells blank if there are no pupils in that year group)
GIRLS BOYS
Year 1 Year 1
Year 2 Year 2
Year 3 Year 3
Year 4 Year 4
Year 5 Year 5
Year 6 Year 6
Year 7 Year 7
Year 8 Year 8
Year 9 Year 9
Year 10 Year 10
Year 11 Year 11
Year 12 Year 12
Year 13 Year 13
*Definition of ‘PE’: The planned teaching and learning programme in curriculum time that meets the requirements of the national curriculum for physical education.
Schools with students in Years 10, 11, 12 and 13 go to Q1b All others go to Q2
Question 1b
For Year groups 10-13 where the total curriculum time at Q.1 was less than 120 minutes, what is the total number of pupils by gender in each year group who participate in at least 120 minutes of PE in a typical week? Note: Please include curriculum time (theory and practical) for related GCSEs/A-levels/BTECs or other relevant qualifications
Enter total number of pupils per year group by gender (put 0 if none, leave cells blank if there are no pupils in that year group)
GIRLS BOYS
Year 10 Year 10
Year 11 Year 11
Year 12 Year 12
Year 13 Year 13

78
Question 2
What is the total number of pupils in each year group who participate in at least three hours of high quality PE and out of hours school sport* in a typical week?
Note: The three hours can come from any combination of curriculum PE and out of hours school sport. Enter total number of pupils per year group by gender (put 0 if none, leave cells blank if there are no pupils in that year group)
GIRLS BOYS
Year 1 Year 1
Year 2 Year 2
Year 3 Year 3
Year 4 Year 4
Year 5 Year 5
Year 6 Year 6
Year 7 Year 7
Year 8 Year 8
Year 9 Year 9
Year 10 Year 10
Year 11 Year 11
Year 12 Year 12
Year 13 Year 13
*Definition of ‘school sport’: Any activity that requires physical skilfulness and is part of the school’s planned formal, semi-formal, supervised or led provision. School sport typically takes place out of hours and/or at lunch or break times. Definition of ‘high-quality’: This produces young people with the skills, understanding, desire and commitment to continue to improve and achieve in a range of PE, sport and health-enhancing physical activities, in line with their abilities, as set out in the ‘High Quality PE and Sport for Young People’ guide.
• TIPS ON ANSWERING QUESTION 2 • If your answer to Question 1 is equal to or more than 180 minutes for any year group, the answer to this question will be the total number of pupils in that year group. In this case, you do not need to calculate time spent on school sport or additional PE.
• If your answer to Question 1 is less than 180 minutes for any year group, to answer this question you need to take the following steps.
• Check which pupils have additional time for PE and how much additional time they actually have. This will include lessons that the rest of the year group does not have, for example GCSE PE, GCSE Dance or an extra PE lesson that some pupils have while others study an additional modern foreign language.
• Find out how long each pupil spends taking part in school sport in a typical week.
• Estimate whether each pupil participates in at least three hours of PE and school sport a week, including additional PE and school sport.
• Enter the number of pupils in each year group who participate in at least three hours of PE and school sport in a typical week.

79
Question 3
What is the total number of pupils in each year group involved in intra-school competitive activities during this academic year? Note: School sports days do not count as intra-school competitive activities. Please refer to the intra-school competitive activities’ definition below.
Enter total number of pupils per year group by gender (put 0 if none, leave cells blank if there are no pupils in that year group)
GIRLS BOYS
Year 1 Year 1
Year 2 Year 2
Year 3 Year 3
Year 4 Year 4
Year 5 Year 5
Year 6 Year 6
Year 7 Year 7
Year 8 Year 8
Year 9 Year 9
Year 10 Year 10
Year 11 Year 11
Year 12 Year 12
Year 13 Year 13
Intra-school competitive activities: Events in which pupils from the same school compete against each other and all school based extra curricular training and club activities where pupils are preparing and practicing for competition. Common events include inter-house or inter-form tournaments or leagues in sports such as netball, tennis and gymnastics; swimming/aquatic galas; club and team practices where pupils are practicing to take part in inter-school matches; and clubs with open access for games such as badminton and basketball. Intra-school competitive activities do not include clubs without competition, such as aerobics and dance clubs. Intra-school competitive activities do not include school sports days.

80
Question 4
What is the total number of pupils in each year group that have regularly participated in competitive intra-school sporting opportunities during this academic year? Note: Regular intra-school competition is defined as:
• 3 times or more during the academic year for pupils in Key Stage 2 • 12 times or more during the academic year for pupils in Key Stages 3 and 4.
Please only include participation in competition formats that allow for sustained involvement (e.g. leagues, ladders etc.) rather than one-off events which need to be included in question 3. NB: A central venue league counts as one competitive opportunity each time the event is staged.
Enter total number of pupils per year group by gender (put 0 if none, leave cells blank if there are no pupils in that year group)
GIRLS BOYS
Year 3 Year 3
Year 4 Year 4
Year 5 Year 5
Year 6 Year 6
Year 7 Year 7
Year 8 Year 8
Year 9 Year 9
Year 10 Year 10
Year 11 Year 11
Year 12 Year 12
Year 13 Year 13
Question 5
Did you hold at least one school sports day or equivalent event during this academic year? Please X yes or no
yes no

81
Question 6
What is the total number of pupils in each year group who have taken part in inter-school competition during this academic year?
Please refer to the inter-school competitive activities’ definition below.
Enter total number of pupils per year group by gender (put 0 if none, leave cells blank if there are no pupils in that year group)
GIRLS BOYS
Year 1 Year 1
Year 2 Year 2
Year 3 Year 3
Year 4 Year 4
Year 5 Year 5
Year 6 Year 6
Year 7 Year 7
Year 8 Year 8
Year 9 Year 9
Year 10 Year 10
Year 11 Year 11
Year 12 Year 12
Year 13 Year 13
Inter-school competition A sporting event or fixture where pupils from two or more schools compete against each other. Pupils are usually selected by their school to compete as individuals or as part of a team. Common examples include matches in sports such as basketball, hockey and cricket; district athletics championships; cross country championships; area swimming/aquatic galas; and 5-a-side football tournaments.

82
Question 7
What is the total number of pupils in each year group that have regularly participated in competitive inter-school sporting opportunities during this academic year?
Note: Regular inter-school competition is defined as: • 3 times or more during the academic year for pupils in Key Stage 2 • 9 times or more during the academic year for pupils in Key Stages 3 and 4.
Please only include participation in competition formats that allow for sustained involvement
(e.g. leagues, ladders etc.) rather than one-off events which need to be included in question 6. NB: A central venue league counts as one competitive opportunity each time the event is staged.
GIRLS BOYS
Year 3 Year 3
Year 4 Year 4
Year 5 Year 5
Year 6 Year 6
Year 7 Year 7
Year 8 Year 8
Year 9 Year 9
Year 10 Year 10
Year 11 Year 11
Year 12 Year 12
Year 13 Year 13

83
Question 8 Which of the following sports or activities has your school provided this
academic year? Please indicate for each sport if it is offered for girls and / or for boys. If it is offered for both please X yes in both girls and boys columns.
GIRLS BOYS Yes No Yes No
(a)
Angling Angling Archery Archery
Athletics (includes cross-country)
Athletics (includes cross-country)
Badminton Badminton Baseball Baseball Basketball Basketball Boccia Boccia Bowls Bowls Boxing Boxing
Canoeing Canoeing
Cheerleading Cheerleading Circus skills Circus skills Cricket Cricket Cycling Cycling Dance Dance Equestrian Equestrian Fencing Fencing Fitness Fitness Football Football Goalball Goalball Golf Golf Gymnastics Gymnastics Handball Handball Hockey Hockey Judo Judo Kabaddi Kabaddi Karate Karate Lacrosse Lacrosse
Martial arts (except judo and karate) Martial arts (except
judo and karate) Mountaineering Mountaineering Multi-skill clubs Multi-skill clubs

84
Netball Netball Orienteering Orienteering Outdoor and
adventurous activity Outdoor and adventurous activity
Rounders Rounders Rowing Rowing Rugby league (includes
tag rugby) Rugby league (includes
tag rugby)
Rugby union (includes tag rugby) Rugby union (includes
tag rugby) Sailing Sailing Skateboarding Skateboarding Softball Softball Squash Squash Swimming Swimming Table tennis Table tennis Tennis Tennis Trampolining Trampolining Triathlon Triathlon Volleyball Volleyball Yoga (and related
activities such as pilates, tai chi)
Yoga (and related
activities such as pilates, tai chi)
Other Other If you crossed ‘yes’ for other, please provide details: Other sport (provided for girls only):
Other sport (provided for boys only):
Other sport (provided for both girls and boys):

85
Question 9
For which sports or activities do you have links* to clubs? Please X yes or no for each sport
Yes No Yes No (b)
Angling Lacrosse Archery
Martial arts (except judo and karate)
Athletics (includes cross-country) Mountaineering
Badminton Multi-skill clubs Baseball Netball Basketball Orienteering Boccia
Bowls Outdoor and adventurous activity
Boxing Rounders Canoeing Rowing Cheerleading
Circus skills Rugby league (includes
tag rugby)
Cricket
Cycling Rugby union (includes tag rugby)
Dance Sailing Equestrian Skateboarding Fencing Softball Fitness Squash Football Swimming Goalball Table tennis Golf Tennis Gymnastics Trampolining Handball Triathlon Hockey Volleyball Judo Kabaddi
Karate
Yoga (and related activities such as pilates, tai chi)
Other If you crossed ‘yes’ for other, please provide details:
* Definition of ‘links’: a school has links to clubs when pupils are actively guided towards club activities, either in a quality assured setting at the club itself, or on the school premises. Links with any types of club can be included (community, volunteer, professional clubs).Activities on the school premises would include regular coaching sessions and out-of-hours clubs organised by the club’s coaches, but would not include one-
off ‘taster’ sessions

86
Question 10
What is the total number of pupils in each year group who have participated in one or more community sports, dance or multi-skill clubs with links to the school during this academic year?
Enter total number of pupils per year group (put 0 if none, leave cells blank if there are no pupils in that year group)
Year 2
Year 8
Year 3
Year 9
Year 4
Year 10
Year 5
Year 11
Year 6
Year 12
Year 7
Year 13
Question 11
What is the total number of pupils in each year group currently registered as gifted and talented because of their ability in PE and/or school sport?
Enter total number of pupils per year group by gender (put 0 if none, leave cells blank if there are no pupils in that year group)
GIRLS BOYS
Year 5 Year 5
Year 6 Year 6
Year 7 Year 7
Year 8 Year 8
Year 9 Year 9
Year 10 Year 10
Year 11 Year 11
Year 12 Year 12
Year 13 Year 13
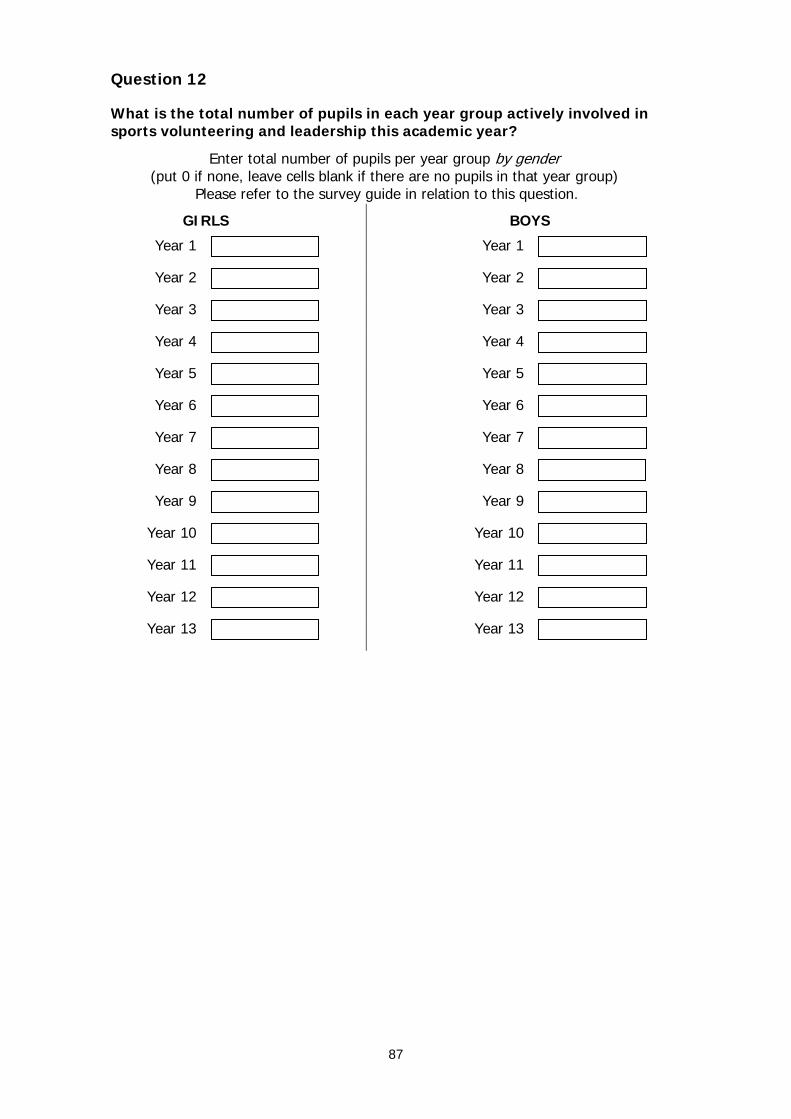
87
Question 12
What is the total number of pupils in each year group actively involved in sports volunteering and leadership this academic year?
Enter total number of pupils per year group by gender (put 0 if none, leave cells blank if there are no pupils in that year group)
Please refer to the survey guide in relation to this question.
GIRLS BOYS
Year 1 Year 1
Year 2 Year 2
Year 3 Year 3
Year 4 Year 4
Year 5 Year 5
Year 6 Year 6
Year 7 Year 7
Year 8 Year 8
Year 9 Year 9
Year 10 Year 10
Year 11 Year 11
Year 12 Year 12
Year 13 Year 13

88
This questionnaire is important as it provides a record of what your school has achieved. Please now go
back and check that you have given a full and accurate answer to ALL questions.
Please read the information below before submitting your results. By submitting a response you agree to and confirm the following: - The information I have provided is, to the best of my knowledge, accurate and up to
date. - Responses are verifiable and I understand that I may be asked by a representative
from TNS-BMRB to provide evidence to support these responses. - The information I have provided may be used for the purposes of calculating eligibility
for Sportsmark. If you wish to amend any of your answers please do so now before submitting your results. If your PDM has asked you to return this paper questionnaire to them, please print your name and position and sign and date below to indicate that you agree with the above. Name: ………………………………………………… Position: ………………………………………………… Date: ………………………………………………… Signature: …………………………………………..
Please ensure you complete your questionnaire online by 1st July 2010.
If you have any questions regarding this survey, please speak to your Partnership Development Manager.
89
Appendix C - FE questionnaire

90
Office Use Only
Further Education PE and Sport Survey 2009/10
The purpose of this survey is to help you, your partnership and the Government to evaluate progress towards meeting the aims of the national PE and Sport Strategy for Young People.
We would like you to complete the questionnaire online at: www.tnsinfo.com/sportsurvey A guide to the survey has been produced to help you understand the questions and complete the questionnaire. The guide provides definitions for the key terms used in the questions and other useful information. You should have received a copy of the guide but if do not have it, you can get a copy from the survey website. We hope you find completing the survey straightforward.
Your College URN:
Your Partnership number:
College name and address:
Contact name (for queries):
Telephone number (for queries):
You must complete this survey online at www.tnsinfo.com/sportsurvey
by 1st July 2010

91
Please note that this survey is about 16-19 year old FE students who are studying full-time across all sites in your college. Question 1 How many full-time students aged 16-19 years do you have in your college?
Question 2
What is the total number of sporting events/activities that you or someone else has organised/do you expect to be organised during this academic year?
British Colleges Sport (BCS) events
Other local leagues/ competitions
Other national leagues/ competitions
One-off festivals/events
Participation sessions/clubs
Other
Question 3
What is the total number of full-time students aged 16-19 years who have/will have participated in these sporting events/activities during this academic year?
Note: If one student participates in more than one event, then they should only be counted once.
Question 4
What is the total number of full-time students aged 16-19 years involved in intra-college competitive activities during this academic year?

92
Question 5
What is the total number of full-time students aged 16-19 years that have regularly* participated in competitive intra-college sporting opportunities during this academic year? Note: Please only include participation in competition formats such as leagues and ladders that allow for sustained involvement rather than one-off events. However, regular annual or termly events may be included.
1. *Regular intra-college competition is defined as 12 times or more during the academic year. Question 6 What is the total number of full-time students aged 16-19 years who have taken part in inter-college sporting competition during this academic year?
Question 7 What is the total number of full-time students aged 16-19 years that have regularly* participated in competitive inter-college sporting opportunities during this academic year? Note: Please only include participation in competition formats such as leagues and ladders that allow for sustained involvement rather than one-off events. However, regular annual or termly events may be included.
2. *Regular inter-college competition is defined as 9 times or more during the academic year.

93
Question 8
Which of the following sports or activities has your college provided this academic year? Please ‘X’ all that apply
Activity Activities
available to students.
Activities offered on the
college site Activity
Activities available to students.
Activities offered on the
college site Yes No Yes No
Angling Lacrosse
Archery
Martial arts (except judo and karate)
Athletics (includes cross-country)
Mountaineering
Badminton Netball
Baseball Orienteering
Basketball Boccia
Outdoor and adventurous activity
Bowls Rounders
Boxing Rowing
Canoeing Cheerleading
Rugby league (includes tag rugby)
Circus skills Cricket
Rugby union (includes tag rugby)
Cycling Sailing
Dance Skateboarding
Equestrian Softball
Fencing Squash
Fitness Swimming
Football Table tennis
Goalball Tennis
Golf Trampolining
Gymnastics Triathlon
Handball Volleyball
Hockey Judo Kabaddi
Yoga (and related activities such as pilates, tai chi)
Karate Other If you crossed ‘yes’ for other, please provide details:

94
Question 9
For which sports or activities does your college have links* to clubs? Please ‘X’ select all that apply Yes No Yes No
Angling Kabaddi Archery Karate Athletics (includes cross-country) Lacrosse Badminton Martial arts (except judo and karate) Baseball Mountaineering Basketball Netball Boccia Orienteering Bowls Outdoor and adventurous activity Boxing Rounders Canoeing Rowing Cheerleading Rugby league (includes tag rugby) Circus skills Rugby union (includes tag rugby) Cricket Sailing Cycling Skateboarding Dance Softball Equestrian Squash Fencing Swimming Fitness Table tennis Football Tennis Goalball Trampolining Golf Triathlon Gymnastics Volleyball Handball
Yoga (and related activities such as pilates, tai chi)
Hockey Judo Other If you crossed ‘yes’ for other, please provide details:
* Definition of ‘links’: a college has links to clubs when students are actively guided towards club activities, either in a quality assured setting at the club itself, or on the college site. Activities on the colleges site would include regular coaching sessions and out-of-hours clubs organised by the club’s coaches, but would not include one-off ‘taster’ sessions Students have to be actively participating with the club that has links to the college: it is not enough for the college simply to promote/advertise the club, as set out in the ‘School-club links’ guide.
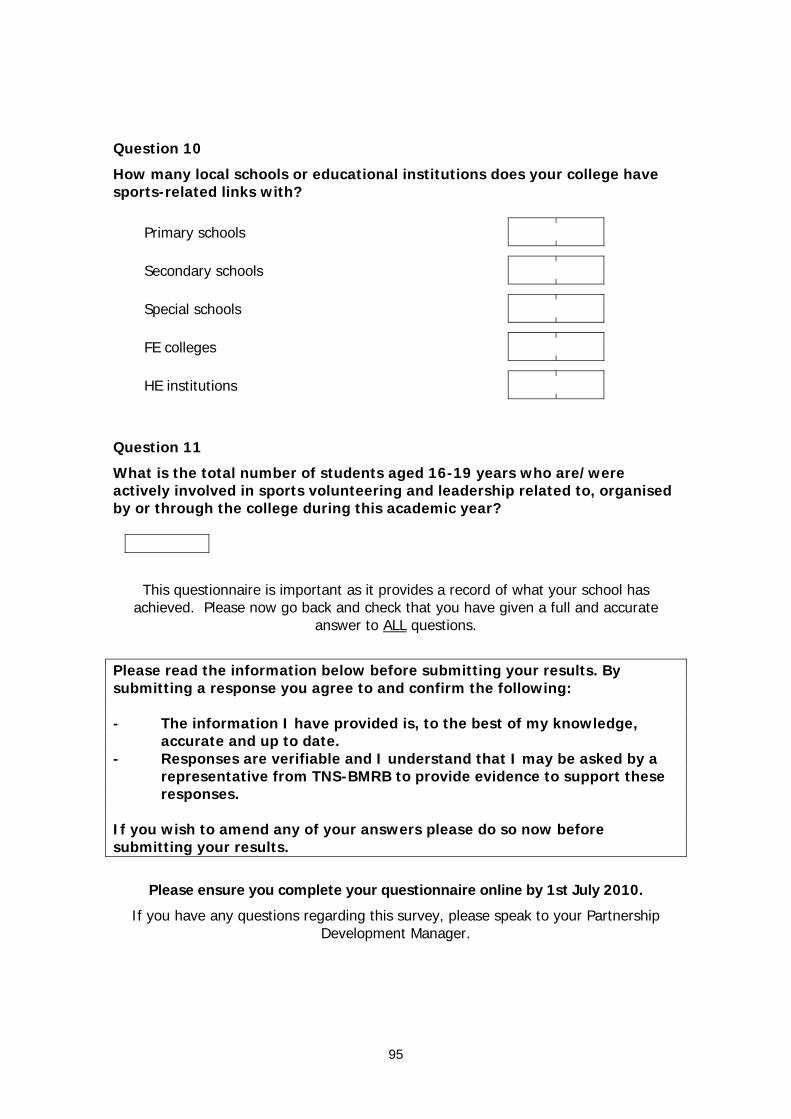
95
Question 10
How many local schools or educational institutions does your college have sports-related links with?
Primary schools
Secondary schools
Special schools
FE colleges
HE institutions
Question 11
What is the total number of students aged 16-19 years who are/were actively involved in sports volunteering and leadership related to, organised by or through the college during this academic year?
This questionnaire is important as it provides a record of what your school has
achieved. Please now go back and check that you have given a full and accurate answer to ALL questions.
Please read the information below before submitting your results. By submitting a response you agree to and confirm the following: - The information I have provided is, to the best of my knowledge,
accurate and up to date. - Responses are verifiable and I understand that I may be asked by a
representative from TNS-BMRB to provide evidence to support these responses.
If you wish to amend any of your answers please do so now before submitting your results.
Please ensure you complete your questionnaire online by 1st July 2010.
If you have any questions regarding this survey, please speak to your Partnership Development Manager.

Ref: DFE-RR032 ISBN: 978-1-84775-794-4 © TNS-BMRB September 2010


![Outdoor Education, PE & Sport Service. Primary Schools Briefings June 2013 Roy Gittens Education officer [PE & Sport] Barry Kitcher2012 Legacy Co-ordinator.](https://static.fdocuments.us/doc/165x107/56649ccf5503460f9499bbd6/outdoor-education-pe-sport-service-primary-schools-briefings-june-2013.jpg)