PE & VC Fundraising Report
14
2017 PE & VC Fundraising Report
Transcript of PE & VC Fundraising Report

2017
PE & VC Fundraising
Report

2 PITCHBOOK 2017 PE & VC FUNDRAISING REPORT
Credits & ContactPitchBook Data, Inc.
JOHN GABBERT Founder, CEO
ADLEY BOWDEN Vice President,
Market Development & Analysis
Content
KYLE STANFORD Analyst
DYLAN E. COX Analyst II
CAMERON STANFILL Analyst
REILLY HAMMOND Data Analyst
JENNIFER SAM Senior Graphic Designer
Contact PitchBook pitchbook.com
RESEARCH
EDITORIAL
SALES
COPYRIGHT © 2017 by PitchBook Data, Inc. All rights reserved. No part of this publication may be reproduced in any form or by any means—graphic, electronic, or mechanical, including photocopying, recording, taping, and information storage and retrieval systems—without the express written permission of PitchBook Data, Inc. Contents are based on information from sources believed to be reliable, but accuracy and completeness cannot be guaranteed. Nothing herein should be construed as any past, current or future recommendation to buy or sell any security or an offer to sell, or a solicitation of an offer to buy any security. This material does not purport to contain all of the information that a prospective investor may wish to consider and is not to be relied upon as such or used in substitution for the exercise of independent judgment.
Introduction 3
PE Fundraising Overview 4-5
PE Fundraising by Size 6
PE Capital Overhang 7
VC Fundraising Overview 8-9
VC Fundraising by Size 10
First-time VC Funds 11
Venture Capital Overhang 12
Methodology 13
Contents
The PitchBook PlatformThe data in this report comes from the PitchBook Platform—our
data software for VC, PE and M&A. Contact [email protected]
to request a free trial.

3 PITCHBOOK 2017 PE & VC FUNDRAISING REPORT
A crowded market impendingIntroduction
Key takeaways
• Private equity firms are raising more capital than at any point since 2007. Funds
based in North America and Europe garnered $212.6 billion in commitments
from limited partners across 214 vehicles through August 1—on pace for a 24%
increase in value from the already stellar 2016.
• Venture capital fundraising hasn’t slowed down either. 2017 is on pace to be the
fourth consecutive year with more than $40 billion in VC commitments.
• 2017 has seen the largest PE and VC funds of all time close: Apollo Investment
Fund IX ($24.7 billion) and New Enterprise Associates 16 ($3.3 billion).
• We expect PE markets to be crowded in the years to come. Dry powder levels
in North American and European PE funds reached new heights of $738.7 billion
as of year-end 2016, exceeding the levels seen at the end of the last fundraising
cycle in 2007 and 2008.
Since year-end 2016, interest in the private markets has only intensified. PE and
VC firms continue to enjoy immense success on the fundraising trail, adding to
their already hefty stores of available capital. Neither asset class shows any signs
of slowing down, which could drive valuations higher, leaving dealmakers in a
precarious position.
We hope you find this report useful in your practice and feel free to reach out
with any comments or questions at [email protected].
Look up a company.
And its cap table.
And its investors.
And its EBITDA
multiples.
And its board
members.
In seconds.
The PitchBook Platform
has the data you need
to close your next deal.
Learn more at
pitchbook.com
DYLAN E. COX
Analyst II

4 PITCHBOOK 2017 PE & VC FUNDRAISING REPORT
PE fundraising still boomingPE fundraising overview
Commitments at post-recession high
PE firms are raising more capital than
at any point since 2007. Funds based
in North America and Europe garnered
$212.6 billion across 214 vehicles
through August 1—on pace for a 24%
increase in value from the already-
stellar 2016. Notably, that capital is
accumulating in the hands of fewer
fund managers, as successful repeat
funds have been able to dominate a
larger part of the market. The number
of individual vehicles has decreased
every year since 2014 and is on track
to do so again this year.
The main reasons for the exuberance
surrounding exposure to PE
include the asset class’s continued
outperformance of public markets,
unprecedented low yields on credit,
lackluster performance by other
alternatives such as hedge funds, and,
2017 on pace for new record?
PE fundraising activity
Source: PitchBook
*As of 8/1/2017
PE fundraising activity
$32
$22
$28
$23
$38
$47
$29
$37
$45
$39
$29
$40
$43
$93
$57
$91
$66
$93
$44
$65
$68
$52
$65
$76
$72
$81
$56
$85
$73
$89
$51
34
0
20
40
60
80
100
120
140
$0
$10
$20
$30
$40
$50
$60
$70
$80
$90
$100
1Q 2Q 3Q 4Q 1Q 2Q 3Q 4Q 1Q 2Q 3Q 4Q 1Q 2Q 3Q 4Q 1Q 2Q 3Q 4Q 1Q 2Q 3Q 4Q 1Q 2Q 3Q 4Q 1Q 2Q 3Q
2010 2011 2012 2013 2014 2015 2016 2017*
Capital Raised ($B) # of Funds Closed
$292
$376
$259
$176
$106
$150
$154
$283
$268
$261
$294
$213
476519
437
283 283317 317
414 427393 387
214
2006 2007 2008 2009 2010 2011 2012 2013 2014 2015 2016 2017*
Capital Raised ($B) # of Funds Closed
Source: PitchBook
*As of 8/1/2017

5 PITCHBOOK 2017 PE & VC FUNDRAISING REPORT
PE funds (#) that hit target
finally, strong recent distributions to
LPs of PE funds, allowing those LPs
to recycle distributions back into the
asset class. These factors, in addition
to the fact that the number of publicly
traded firms in the US remains well
below its 1996 high, contribute to
an environment where capital is
incentivized to chase returns through
the private markets.
Prominent names top the list,
technology booming
Some of the biggest names in PE—
including Apollo, CVC, Silver Lake,
KKR, Vista, and Clayton, Dubilier &
Rice—have closed funds in the first
seven months of the year. The Apollo
Investment Fund IX raised $24.7 billion,
surpassing Blackstone’s 2007 vehicle
worth $21.7 billion to become the
largest buyout fund ever raised. Less
than two months earlier, CVC Capital
Partners closed their seventh flagship
buyout fund worth ¤16 billion ($17.95
billion), which set a record for largest
European buyout fund.
Silver Lake Management and Vista
Equity Partners closed technology-
focused funds totaling $15 billion and
Average & median PE fund size ($M)
$11 billion, respectively. Such closings
at ample sums exemplify the success
that general partners have had in the
IT sector, as well as LPs’ continued
interest in gaining exposure to the
industry outside of FANG-skewed
public stocks. About one-fifth of all PE
deals now involve tech companies.
Further signs of ease for IR teams
Not only are PE firms raising enormous
sums, but they seem to be doing
it more quickly and with more
consistency than they have in the past.
The average time to close for PE funds
in 2017 rests at just 13.2 months, down
from 15.9 months for 2016 funds and
the lowest figure recorded since 2006.
Further, 92% of all funds to close this
year have hit their stated target. Very
rarely do firms come back from the
fundraising trail without having met
their expectations.
PE funds’ closing time
$273.6$225.0
$208.0$162.9
$191.4
$217.0
$173.5 $174.0
$194.1 $200.0$288.0 $282.6
$738.6
$813.4
$663.0
$703.7
$422.8
$545.3
$540.5
$719.2
$646.4
$687.6$768.8
$1,007.6
2006 2007 2008 2009 2010 2011 2012 2013 2014 2015 2016 2017*
Median ($M) Average ($M)
Source: PitchBook
*As of 8/1/2017
11.8 12.0 12.0
13.5
19.8
16.9
14.1 14.5 14.3 14.8 14.8
11.8
12.4
14.015.3 15.6
19.6 18.3
16.715.6
16.8 16.815.9
13.2
2006 2007 2008 2009 2010 2011 2012 2013 2014 2015 2016 2017*
Median (Months) Average (Months)
Source: PitchBook
*As of 8/1/2017
0%
10%
20%
30%
40%
50%
60%
70%
80%
90%
100%
2006
2007
2008
2009
2010
2011
2012
2013
2014
2015
2016
2017
*
Hit Target Missed TargetSource: PitchBook
*As of 8/1/2017

6 PITCHBOOK 2017 PE & VC FUNDRAISING REPORT
PE fundraising (#) by fund size
PE fundraising ($B) by fund size
Funds trend largerPE fundraising by size
Megafunds dominate capital
commitments
PE funds with at least $5 billion in
commitments have accounted for
nearly half (49.8%) of all capital
committed to the asset class this
year. The flurry of mega-buyout
funds is driven by a multitude of
factors. First, intense LP demand
has allowed successful GPs to
increase their target AUM. Second,
committing larger amounts of
capital across fewer funds allows
LPs to whittle down administrative
costs, streamline tracking
processes, and gain leverage
when it comes to negotiating for
co-investment rights. CalPERS is
even considering opening its own
direct investment arm, similar to
a plethora of Canadian LPs. Third,
soaring prices in both public and
private markets require that firms
raise more capital to compete
for the largest targets. For
consideration, the S&P 500 now
trades at a P/E ratio of around 24x,
compared to 14x in 2012, just prior
to the most recent buyout boom.
Middle market provides the most
opportunity
Though megafunds have dominated
the fundraising scene in terms
of dollars raised, middle-market
firms account for a larger portion
of final closes this year. There
have been 105 funds with between
$100 million and $500 million in
commitments that have closed
through August 1, representing
about 50% of all fund closes, the
highest since at least 2006. In
an ultracompetitive environment,
lower and core-middle-market
exposure provides a way to avoid
such rich valuations by targeting
companies that aren’t on the
traditional investment banking
circuits and thus not as likely to go
through an auction process.
0
50
100
150
200
250
300
350
400
450
2010 2011 2012 2013 2014 2015 2016 2017*
Under $100M $100M-$250M $250M-$500M
$500M-$1B
$1B-$5B
$5B+
Source: PitchBook
*As of 8/1/2017
$0
$50
$100
$150
$200
$250
$300
$350
2010 2011 2012 2013 2014 2015 2016 2017*
Under $100M
$100M-$250M
$250M-$500M
$500M-$1B
$1B-$5B
$5B+
Source: PitchBook
*As of 8/1/2017

7 PITCHBOOK 2017 PE & VC FUNDRAISING REPORT
Dry powder at record highPE capital overhang
2017 PE capital overhang ($B)
by vintage
Source: PitchBook
*Data pulled as of 7/10/2017
Note: The LP reporting cycle is two quarters behind the
most recent quarter ended. PitchBook’s most recent
fund returns data is through the end of 2016. 2017
numbers are from vehicles that have begun reporting.
Dry powder climbs to staggering
heights
Dry powder levels in North
American and European PE funds
reached new heights of $738.7
billion as of year-end 2016. The
packed coffers contain slightly
more than the $732.8 billion
that was available at year-end
2015 and also surpass capital
overhang levels at the end of the
last fundraising cycle in 2007 and
2008. The market is crowded, to
say the least.
Barring a severe economic
downturn, these sums will support
future deal flow, putting further
upward pressure on pricing
for buyout targets. Since more
of this capital continues to be
amassed in larger funds, which
necessitate larger minimum
equity deployments, we expect
the average size of PE deals to
continue growing. Late-cycle
vintages tend to underperform
their early-cycle peers, but that
certainly hasn’t deterred LPs from
committing to PE recently. We may
experience a future market where
expected PE returns are far lower
than historical norms.Source: PitchBook
Closing in on three-quarters of a trillion dollars available for deployment
PE capital overhang ($B) by year
$587.4
$700.4 $703.5$663.9
$611.5 $641.0 $618.2
$687.6$714.7 $732.8 $738.7
2006 2007 2008 2009 2010 2011 2012 2013 2014 2015 2016
2017*
2016
2015
2014
2013
2012
2011
2010
2009
Cumula�ve overhang
Overhang by vintage
1%1%
2% 6%
12%
14%
26%
30%
8%
2009 2010 2011
2012 2013 2014
2015 2016 2017*

8 PITCHBOOK 2017 PE & VC FUNDRAISING REPORT
2017 set for $40B+?VC fundraising overview
VC fundraising activity
Unprecedented consecutive successes
VC fundraising activity
Venture fundraising in Europe and
North America is well on pace to
make 2017 the fourth consecutive
year with more than $40 billion raised
across all vehicles. Moreover, the tally
may approach last year’s record $51
billion figure when final numbers are
calculated. Through July, $27.5 billion
has been raised across 165 vehicles, a
number that will likely lead to a year-
over-year decrease in the number
of funds closed as LPs continue to
consolidate commitments across fewer
managers. That decline in number of
funds has been offset by some of the
largest funds we have ever seen. In
June, NEA raised the largest VC fund
ever—its $3.3 billion New Enterprise
Associates 16—and in Europe there
have already been two vehicles closed
this year on more than $750 million
(Rocket Internet Capital Partners SCS
and Atomico IV), only the second time
in the past decade that more than one
such fund has been closed in a single
year in Europe.
$42.
9
$43.
2
$42.
7
$17.
5
$28.
5
$33.
8
$31.
2
$29.
0
$42.
6
$44.
7
$51.
1
$27.
5
315 296
337
235
276 279309 316
363335
353
165
2006 2007 2008 2009 2010 2011 2012 2013 2014 2015 2016 2017*
Capital Raised ($B) # of Funds Closed
$14
$5 $5 $5 $10
$10
$4 $10
$11
$6 $9 $5 $8 $7 $6 $8 $11
$12
$9 $10
$9 $15
$8 $13
$14
$17
$12
$9 $11
$14
$3
15
0
20
40
60
80
100
120
$0
$2
$4
$6
$8
$10
$12
$14
$16
$18
1Q 2Q 3Q 4Q 1Q 2Q 3Q 4Q 1Q 2Q 3Q 4Q 1Q 2Q 3Q 4Q 1Q 2Q 3Q 4Q 1Q 2Q 3Q 4Q 1Q 2Q 3Q 4Q 1Q 2Q 3Q
2010 2011 2012 2013 2014 2015 2016 2017
Capital Raised ($B) # of Funds Closed
Source: PitchBook
*As of 8/1/2017
Source: PitchBook
*As of 8/1/2017

9 PITCHBOOK 2017 PE & VC FUNDRAISING REPORT
Record average VC fund size
VC fund size metrics
Convergence as industry trends larger
VC fund time to close
More and more targets continue to be hit
VC funds (#) that hit target
Moving into 2017, we expected to
see fundraising slow given that both
Europe and North America had just
experienced near-record fundraising
years. That hasn’t been the case,
however, as managers have continued
to raise outsized sums of capital.
Since 2012, the proportion of all funds
closed with less than $50 million in
commitments has declined from almost
60% to 34% this year. Conversely,
the proportion of vehicles raised with
between $100 million and $250 million
in commitments has increased from
just 15.2% to near 28% during that same
time period.
Cyclical effects come full circle
As the venture market has evolved,
so has the GP fundraising landscape.
Companies continue to raise larger
rounds and valuations have only
increased. While these trends have
partially been driven by the sheer
amount of capital raised since 2014
began ($166 billion), the effects they
have wrought have come full circle as
managers continue to raise massive
pools. To illustrate, the median fund
size has tripled from just $28 million in
2012 to $84 million as of 1H 2017.
We believe today’s fundraising levels
will underpin the current trends in VC
for the foreseeable future. Further,
as companies continue to raise larger
rounds, managers will continue to
adjust their fundraising strategies to
align well with the current dynamics of
the industry.
$64$70
$63
$33
$35 $35
$28
$35 $34$46
$65
$84
$161 $164
$139
$85
$116$135
$111
$101
$129$138
$153
$170
2006 2007 2008 2009 2010 2011 2012 2013 2014 2015 2016 2017*
Median ($M) Average ($M)
Source: PitchBook
*As of 8/1/2017
14.2
10.9
12.9
15.6 19.5
10.7
13.514.9
12.413.1
19.4
15.9
19.1
13.0
16.3
14.1
20.9
15.915.7
18.1
14.8
16.1
20.3
15.7
2006 2007 2008 2009 2010 2011 2012 2013 2014 2015 2016 2017*
Median (Months) Average (Months)
Source: PitchBook
*As of 8/1/2017
0%
20%
40%
60%
80%
100%
2006
2007
2008
2009
2010
2011
2012
2013
2014
2015
2016
2017
*
Hit Target Missed TargetSource: PitchBook
*As of 8/1/2017

10 PITCHBOOK 2017 PE & VC FUNDRAISING REPORT
Upper & mid-market strongVC fundraising by size
Fund sizes in 2017 continued their
growth trajectory, increasing every
year since 2012. Much of this we
attribute to the upturn of deal sizes
in all stages. For that reason, GPs
needed to increase fundraising to
be able to maintain their strategy
and participate in follow-on rounds.
Logically, the number of funds
raising under $50 million has been
hit the hardest, sliding to the
category’s lowest percentage of
total funds in over a decade.
On the other end of the spectrum,
while there have only been two
funds of over $1 billion raised
through the first seven months of
2017, June saw NEA close a $3.3
billion vehicle—the largest VC
fund ever. Interestingly, the focus
of $1 billion+ funds has not been
solely on outsized late-stage deals.
Specifically, many recent mega-
funds have invested a meaningful
portion of their capital into seed
and early-stage deals, putting even
more pressure on small funds. For
traditional firms investing earlier
in the company lifecycle, their
strategies of deploying capital
might need to evolve to consider
the competition, or at minimum
the presence, of these mega-funds
creeping into the stage where they
typically invest.
Smaller funds sliding relative to the whole
VC fundraising (#) by fund size
VC fundraising ($B) by fund size
0
50
100
150
200
250
300
350
400
2007 2008 2009 2010 2011 2012 2013 2014 2015 2016 2017*
Under $50M $50M-$100M $100M-$250M
$250M-$500M $500M-$1B $1B+
Source: PitchBook
*As of 8/1/2017
$0
$10
$20
$30
$40
$50
$60
2007 2008 2009 2010 2011 2012 2013 2014 2015 2016 2017*
Under $50M $50M-$100M $100M-$250M
$250M-$500M $500M-$1B $1B+
Source: PitchBook
*As of 8/1/2017

11 PITCHBOOK 2017 PE & VC FUNDRAISING REPORT
First-timers set to break a record?
First-time VC fundraising activity
First-time funds2017 has been an especially strong
year for first-time fundraisers. The
amount raised in the first seven
months of the year exceeds full-
year totals for 2012 to 2014, and is
currently on pace to best 2008’s
record-breaking mark.
The spike in first-time fund closings
in 2016, which has continued into
this year, has been driven by a
very diverse set of geographies,
strategies and manager
backgrounds. Our data shows
that both 2016 and 2017 were
dominated by funds in California,
representing 41% and 52% of total
first-time funds, respectively. That
said, London saw the largest first-
time funds raised in both years.
Strangely, the diverse geographic
scope of these top funds doesn’t
stop there. Both were raised with
a focus on aiding businesses
expand into China, and both had
large Chinese backers like the
State-owned Assets Supervision
and Administration Commission
(SASAC) and ChinaEquity Group.
Although in general we saw
managers trend toward focused
funds, there was still a wide
variance in strategies. Obviously,
there were some centered around
currently popular strategies like
fintech, SaaS, biotech and artificial
intelligence. However, we also saw
funds raised to target startups
co-founded by designers, retail
technology and real estate tech.
$3.9
$3.8
$4.1
$1.7
$2.7
$3.1
$2.2
$2.1
$2.0
$2.8
$3.8
$2.6
61
48
49
39
50
31
35
28
42
29
32
25
2006 2007 2008 2009 2010 2011 2012 2013 2014 2015 2016 2017*
Capital Raised ($B) # of Funds Closed
Source: PitchBook
*As of 8/1/2017
The managers of these first-time
funds also boast a wide range
of backgrounds. While there
were many who had served as
founders or partners at other
VC firms (Google Ventures, FTV
Capital, Andreessen Horowitz, etc.)
there were also a host of serial
entrepreneurs raising VC funds,
including co-founders of Palantir,
Cabify and Invitation Homes.
SELECT FIRST-TIME FUNDS
CLOSE DATE CAPITAL RAISED FOCUS
Cocoon Network Venture Capital Fund
1/19/2016 $721.5M UK & Europe
SILK Ventures Fund 5/16/2017 $500M China
Geodesic Capital Fund I 5/17/2016 $335M Japan
Pivotal bioVenture Partners Fund I
3/16/2017 $300MLife sciences & biotechnology
Centana Growth Partners 6/12/2017 $250M Fintech
Fifth Wall Ventures 5/1/2017 $212MReal estate technology
Section 32 Fund 1 5/16/2017 $151.3MLife sciences & biotechnology
Maniv Mobility Fund 7/26/2017 $42M Mobility
Campfire Capital Fund I 10/21/2016 $31MRetail technology
Source: PitchBook
*As of 8/1/2017
12 PITCHBOOK 2017 PE & VC FUNDRAISING REPORT
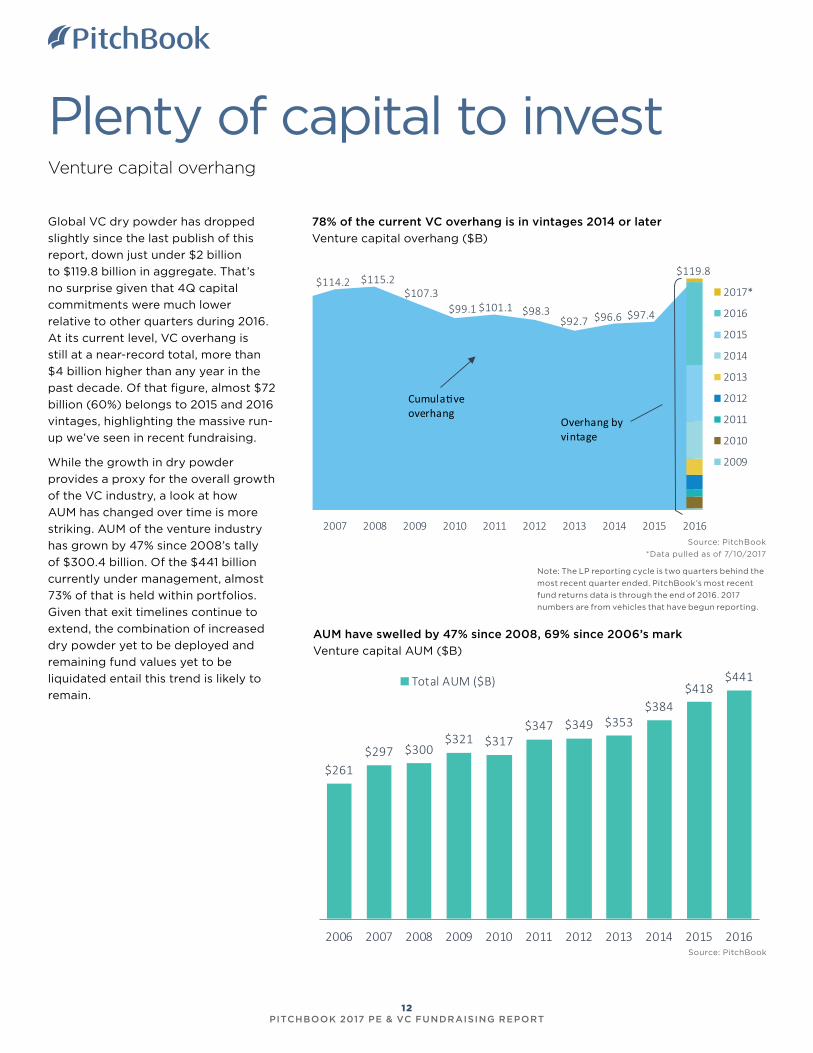
Plenty of capital to investVenture capital overhang
Global VC dry powder has dropped
slightly since the last publish of this
report, down just under $2 billion
to $119.8 billion in aggregate. That’s
no surprise given that 4Q capital
commitments were much lower
relative to other quarters during 2016.
At its current level, VC overhang is
still at a near-record total, more than
$4 billion higher than any year in the
past decade. Of that figure, almost $72
billion (60%) belongs to 2015 and 2016
vintages, highlighting the massive run-
up we’ve seen in recent fundraising.
While the growth in dry powder
provides a proxy for the overall growth
of the VC industry, a look at how
AUM has changed over time is more
striking. AUM of the venture industry
has grown by 47% since 2008’s tally
of $300.4 billion. Of the $441 billion
currently under management, almost
73% of that is held within portfolios.
Given that exit timelines continue to
extend, the combination of increased
dry powder yet to be deployed and
remaining fund values yet to be
liquidated entail this trend is likely to
remain.
78% of the current VC overhang is in vintages 2014 or later
Venture capital overhang ($B)
Note: The LP reporting cycle is two quarters behind the
most recent quarter ended. PitchBook’s most recent
fund returns data is through the end of 2016. 2017
numbers are from vehicles that have begun reporting.
Source: PitchBook
Source: PitchBook
*Data pulled as of 7/10/2017
$99.7$108.0
$114.2 $115.2$107.3
$99.1 $101.1 $98.3$92.7 $96.6 $97.4
$119.8
2005 2006 2007 2008 2009 2010 2011 2012 2013 2014 2015 2016
2017*
2016
2015
2014
2013
2012
2011
2010
2009
Cumula�ve overhang
Overhang by vintage
AUM have swelled by 47% since 2008, 69% since 2006’s mark
Venture capital AUM ($B)
$261$297 $300
$321 $317$347 $349 $353
$384$418
$441
2006 2007 2008 2009 2010 2011 2012 2013 2014 2015 2016
Total AUM ($B)

13 PITCHBOOK 2017 PE & VC FUNDRAISING REPORT
MethodologyPRIVATE EQUITY FUNDS
The following fund types are used in PitchBook’s PE fundraising data: buyout, PE growth/expansion, co-
investment, mezzanine, mezzanine captive, diversified PE, energy and restructuring/turnaround. This report
only includes funds based in North America or Europe that have held their final close. Note: for PE and VC
contributions versus capital raised, the contributions are the sums called down from limited partners by
general partners, compared to overall capital raised, in a given timeframe.
VENTURE CAPITAL FUNDS
In addition to traditional VC funds, PitchBook also includes corporate VC funds and seed-stage funds in our
VC fundraising total. Funds that identify themselves as growth-stage vehicles are classified as PE funds in
this report. Only funds based in North America or Europe that have held their final close are included in the
fundraising numbers.
CLOSE DATE AND VINTAGE
Unless otherwise noted, the fundraising data in this report is based on a fund’s close date. The vintage year
is based on the vintage year reported by the GP, otherwise the year in which a fund holds its final close or
the year of first investment is used.
CAPITAL OVERHANG
Calculated using the most recently available fund cash flow data, the capital overhang in this report is
updated through July 10, 2017. The capital overhang is based on vintage year and only capital that is held in
closed funds is considered. (It is important to note that evergreen funds are included). If a fund closed on
January 1, 2017 or later, it is only included in the dry powder figure if it previously held a first close and has
cash flow data available.
FUND LOCATION
A fund’s location is determined by the country or region where the majority of its investments have been or
will be made. Only funds based in North America or Europe are included in this report.

We do
The PitchBook Platform is the leading
web-based data software for limited partners
and other private market professionals.
custom fund benchmarks, cash flows,dry powder,valuations,GP co-investments.
You drive stronger portfolio returns.