The Economic Importance of Tourism in Australia's … Introduction Tourism plays a significant part...
32
The Economic Importance of Tourism in Australia’s Regions
Transcript of The Economic Importance of Tourism in Australia's … Introduction Tourism plays a significant part...
The Economic Importance of Tourism in Australia’s Regions

ISBN 978-1-921812-27-9
Tourism Research Australia GPO Box 1564 Canberra ACT 2601 Phone: 6243 7745 Email: [email protected] Web: www.ret.gov.au/tra
Publication date: April 2011
This work is licensed under a Creative Commons Attribution 3.0 Australia licence. To the extent that copyright subsists in third party quotes and diagrams it remains with the original owner and permission may be required to reuse the material.
This work should be attributed as The Economic Importance of Tourism in Australia’s Regions, Tourism Research Australia, Canberra.
Enquiries regarding the licence and any use of work by Tourism Research Australia are welcome at [email protected]
Contents
1 Introduction ....................................................................................................... 1
2 Australia’s tourism regions ................................................................................... 1
3 Methodology ...................................................................................................... 5
4 Results .............................................................................................................. 6
5 Conclusion ....................................................................................................... 11
Appendices
Appendix A: Detailed methodology ...................................................................... 12
A1 Tourism output ........................................................................................ 12
A2 Regional output ....................................................................................... 15
A3 Data sources ........................................................................................... 17
Appendix B: Detailed results .............................................................................. 18
Glossary of terms ................................................................................................. 25
References .......................................................................................................... 26
Tables
Table 1: Tourism regions by state/territory ................................................................ 2
Table 2: Top 20 tourism regions by economic importance of tourism .............................. 6
Table 3: Less dependent regions with larger tourism industries ..................................... 9
Figures
Figure 1: Total tourism expenditure in 2007/08 .......................................................... 4
Figure 2: Economic importance and total tourism expenditure in 2007/08....................... 8
Figure 3: Comparison between industry size and economic importance of tourism ......... 10


1 Introduction
Tourism plays a significant part in the Australian economy, contributing 2.6% to Australia’s GDP and 4.5% to Australia’s employment in 2009–10. With 46% of tourism expenditure in Australia spent in regional areas1, tourism is also of considerable importance to many of Australia’s regional communities. To determine the extent of tourism importance, this report estimates the economic importance of tourism across each tourism region in Australia by: • comparing the value of each region’s tourism industry to its local economy, and • ranking each region by the relative importance of tourism to their local economies. Section 2 of this report outlines the composition of the tourism regions, Section 3 summarises the methodology used to calculate the economic importance of tourism in each region and Section 4 reports on the key findings. Finally, Section 5 summarises the results.
2 Australia’s tourism regions
Australia has 84 tourism regions2; each tourism region is made up of a number of Statistical Local Areas (SLAs), as defined by the Australian Bureau of Statistics in consultation with state and territory tourism organisations.
This report estimates the economic importance of tourism for all regions except Lord Howe Island. In addition, some regions in the Northern Territory have been combined due to data reliability issues. Table 1 lists the regions for which economic importance has been estimated.
1 Based on TRA regional expenditure estimates (2009-10, unpublished data). Note the estimate excludes the Gold Coast. 2 Based on 2009 concordances. See ABS 2009, cat no. 9503.0.55.001.
1

Table 1: Tourism regions by state/territory
State/territory Tourism regions No. of regions
New South Wales (NSW)
Blue Mountains Capital Country Central Coast Central NSW Hunter Mid North Coast Northern Rivers
New England North West Outback NSW Riverina Snowy Mountains South Coast Sydney The Murray
14
Victoria (Vic)
Ballarat Bendigo Loddon Central Highlands Central Murray Geelong Gippsland Goulburn High Country Lakes Macedon Mallee
Melbourne Melbourne East Murray East Peninsula Phillip Island Spa Country Upper Yarra Western Western Grampians Wimmera
21
Queensland (Qld)
Brisbane Bundaberg Central Queensland Darling Downs Fraser Coast Gold Coast
Mackay Northern Outback Sunshine Coast Tropical North Qld Whitsundays
12
South Australia (SA)
Adelaide Adelaide Hills Barossa Clare Valley Eyre Peninsula Fleurieu Peninsula Flinders Ranges
Kangaroo Island Limestone Coast Murraylands Outback SA Riverland Yorke Peninsula
13
Western Australia (WA) Australia’s Coral Coast Australia’s Golden Outback Australia’s North West
Australia’s South West Experience Perth 5
Tasmania (Tas)
East Coast Hobart and Surrounds Launceston and Tamar Valley Northern
North West Southern West Coast 7
Northern Territory (NT) Alice Springs Central (includes Barkly, Central Desert, Yulara)
Darwin Top End (includes Arnhem, Kakadu, Katherine Daly)
4
Australian Capital Territory (ACT)
Canberra
1
Total number of regions 77
2
Australia’s regional tourism industries are not all equal in size, and visitor numbers, tourism output, and tourism expenditure can vary greatly from region to region. To gauge the size of regional tourism industries, Tourism Research Australia (TRA) has used modelled estimates of regional tourism expenditure3 using data from the National Visitor Survey and International Visitor Survey. Total tourism expenditure is calculated by combining estimates for each tourism region’s domestic day, domestic overnight, and international visitor expenditure.
Based on total tourism expenditure estimates for 2007/084, the five largest tourism regions in Australia are Sydney, Melbourne, Brisbane, the Gold Coast, and Experience Perth. Together, these regions account for close to half (47%) of Australia’s tourism expenditure. Furthermore, the top ten regions account for over three fifths of Australia’s total tourism expenditure. The remaining tourism regions in Australia (67) have comparatively small tourism industries. Figure 1 shows the spread of tourism expenditure across Australia’s tourism regions in 2007/08.
3 The amount paid by a visitor or on behalf of a visitor for and during his/her trip and stay at the destination (ABS 2010 cat no. 5249.0). 4 Due to the lack of more recent data on personal income (see Section 3), the estimates relate to the 2007/08 financial year.
3
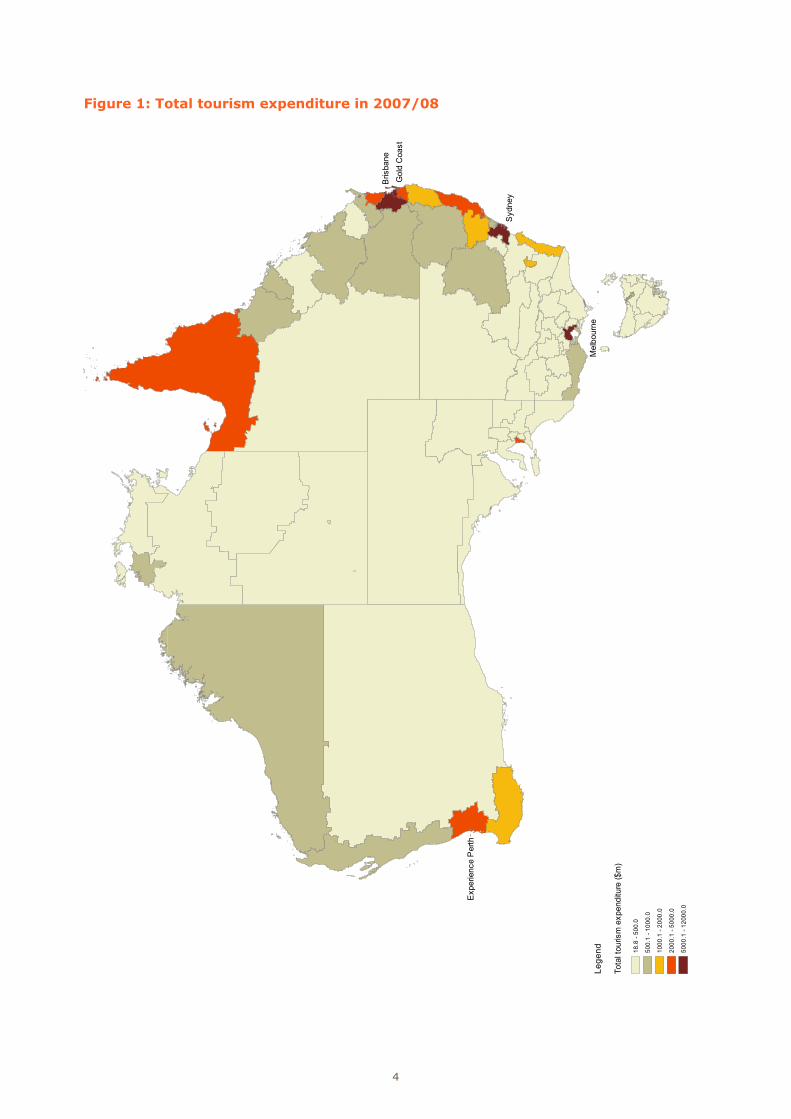
Figure 1: Total tourism expenditure in 2007/08
Lege
nd
Tour
ism
Dep
ende
ncy
Rat
ioE
XP_M
IL 18.8
- 50
0.0
500.
1 - 1
000.
0
1000
.1 -
2000
.0
2000
.1 -
5000
.0
5000
.1 -
1200
0.0
Tota
l tou
rism
exp
endi
ture
($m
)
Exp
erie
nce
Per
th
Mel
bour
ne
Syd
ney
Gol
d C
oast
Bris
bane
4

3 Methodology
To determine the economic importance of tourism in a regional economy, the ratio of each region’s total tourism output to its total output is estimated. As data on these variables are not available at the regional level, proxy variables for tourism output and total output are estimated. TRA’s total tourism expenditure estimates for day, overnight and international visitors are used to approximate tourism output. The difference between tourism expenditure and tourism output is that tourism output excludes taxes and subsidies that would otherwise be incurred by the producer in selling a tourism-related good or service. As such, the estimates of total tourism expenditure are adjusted in order to approximate tourism output. To estimate the total output in each region, ABS data for total state/territory output are used along with data on personal income earned in each region. The data on total personal income – the amount of income5 earned by its residents – are used to calculate the percentage of total state/territory personal income attributable to each region. This percentage is then applied to the relevant state/territory’s total output in order to derive an estimate for total output in the region. For example, total personal income in the South Coast region ($9.2 billion) accounts for 5% of total personal income in New South Wales ($185.5 billion). This percentage is multiplied by the state’s total output ($683.7 billion) in order to obtain an estimate of the South Coast’s total output ($33.8 billion). Once estimates for tourism output and total regional output are obtained for each tourism region, the economic importance of tourism is estimated by finding the ratio of tourism output to total output for each tourism region.
A detailed explanation of the methodology and data sources can be found in Appendix A.
5 Including income from wages/salaries; own unincorporated businesses; investments; superannuation/annuities; and excluding income from government pensions/allowances.
5

4 Results
As expected, the economic importance of tourism in Australia’s regions varies across Australia (see Table 3 and Figure 2), but also shows that a large part of eastern Australia and the Northern Territory depend more on tourism than other areas of the country. For the purposes of this report, a benchmark for Australian tourism regions was derived by dividing the tourism output across all tourism regions by the total output across all tourism regions. All regions in the Top 20 are well above the Australian benchmark of 3.0%, showing that the tourism industry in each of these regions is relatively important to the region’s economy. The complete list of results and rankings can be found in Appendix B.
Table 2: Top 20 tourism regions by economic importance of tourism
Rank Tourism region State
Economic importance of tourism
Total tourism expenditure
% Purchaser’s prices6, $m
1 Central NT 24.8 411
2 Phillip Island Vic 18.7 391
3 Whitsundays Qld 17.7 685
4 Snowy Mountains NSW 17.1 495
5 West Coast Tas 16.2 102
6 East Coast Tas 14.6 129
7 Spa Country Vic 14.3 163
8 Kangaroo Island SA 14.1 63
9 Tropical North Queensland Qld 9.7 2,761
10 Lakes Vic 9.2 296
11 Mid North Coast NSW 8.7 2,041
12 Upper Yarra Vic 7.7 92
13 Central Murray Vic 7.4 373
14 High Country Vic 7.2 470
15 Australia's Coral Coast WA 6.9 512
16 Sunshine Coast Qld 6.7 2,458
17 Outback Qld 6.5 409
18 Gold Coast Qld 6.4 4,528
19 Western Vic 6.2 880
20 Northern Rivers NSW 6.1 1,185
Australian benchmark (%) 3.0
6 The amount paid by the purchaser, excluding any deductible tax, in order to take delivery of a unit of a good/service at the time and place required by the purchaser.
6

The Top 20 list, which contains a number of regions with relatively small economies, shows that the economic importance of tourism is not determined by the size of the tourism industry within a tourism region. The top 20 regions accounted for only a quarter of Australia’s tourism expenditure in 2007/08 with the Gold Coast, Tropical North Queensland, Sunshine Coast, Mid North Coast and Northern Rivers the only regions whose total expenditure was above $1 billion.
7
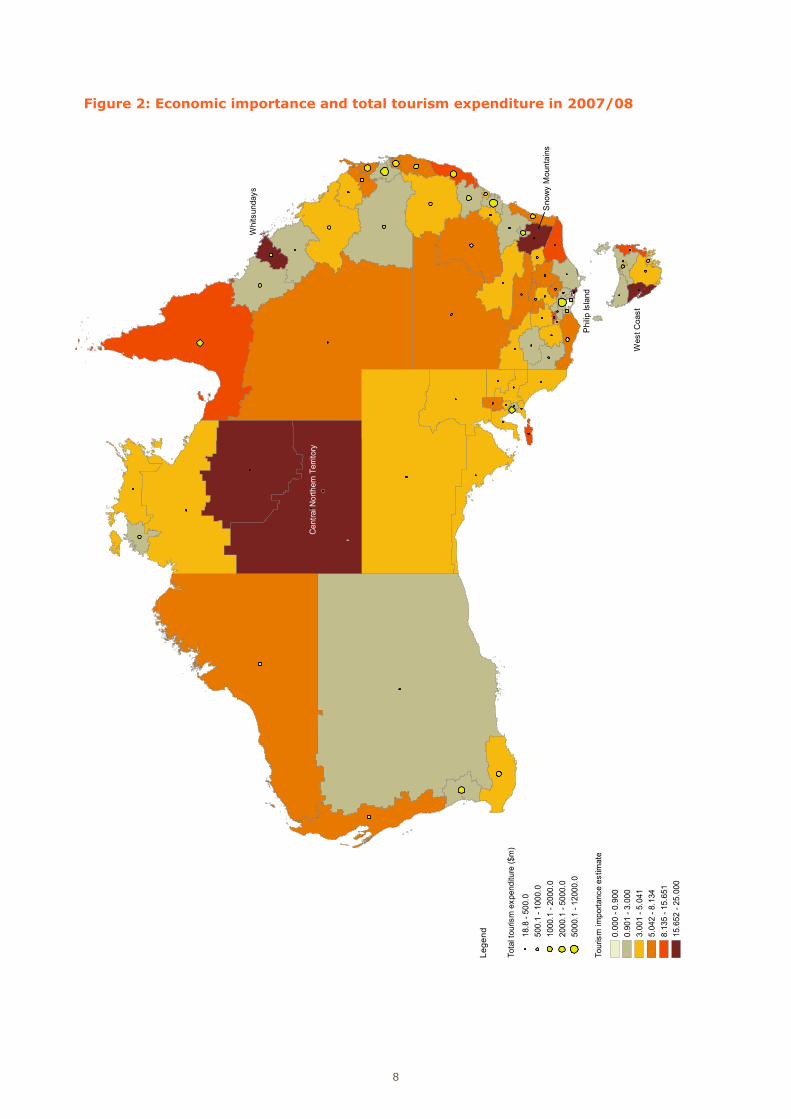
Figure 2: Economic importance and total tourism expenditure in 2007/08
Cen
tral
NT
Lege
nd
Tour
ism
Exp
endi
ture
EX
P_M
IL18
.8 -
500.
050
0.1
- 100
0.0
1000
.1 -
2000
.020
00.1
- 50
00.0
5000
.1 -
1200
0.0
Tour
ism
Dep
ende
ncy
Rat
ioTD
R0.
000
- 0.9
000.
901
- 3.0
003.
001
- 5.0
415.
042
- 8.1
348.
135
- 15.
651
15.6
52 -
25.0
00
Tour
ism
impo
rtanc
e es
timat
e
Tota
l tou
rism
exp
endi
ture
($m
)
Cen
tral N
orth
ern
Terri
tory
Sno
wy
Mou
ntai
ns
Wes
t Coa
st
Phi
lip Is
land
Whi
tsun
days
8
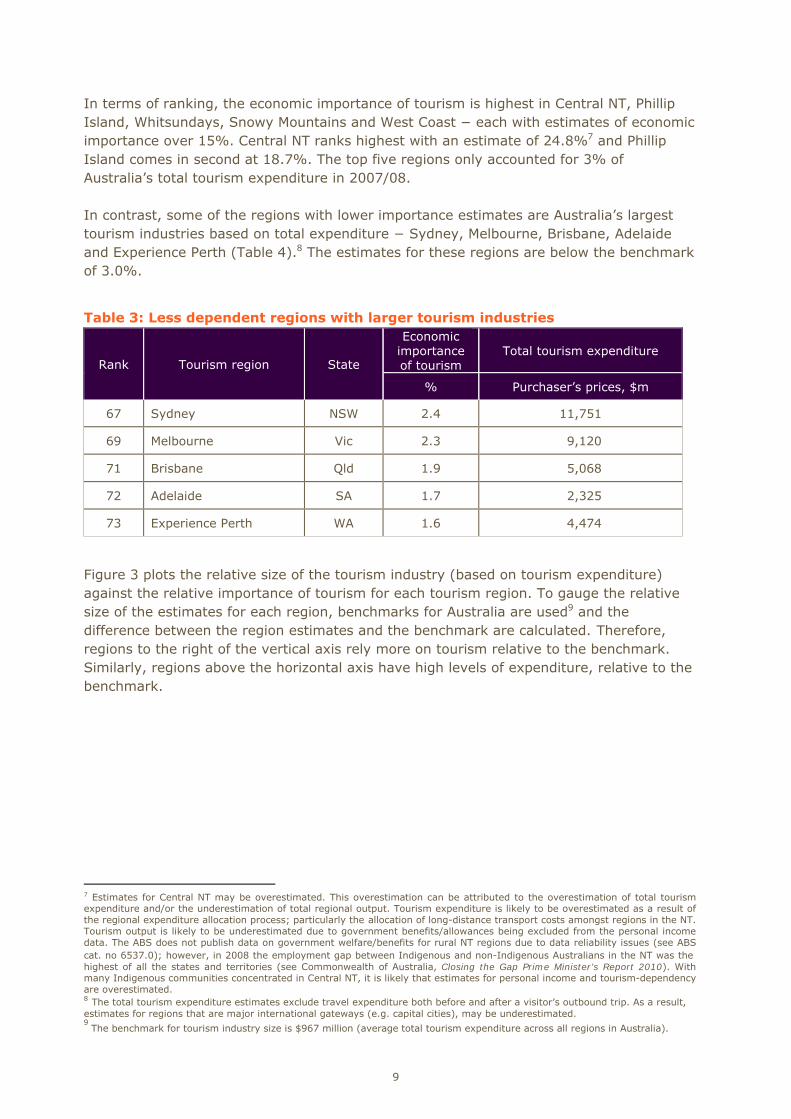
In terms of ranking, the economic importance of tourism is highest in Central NT, Phillip Island, Whitsundays, Snowy Mountains and West Coast − each with estimates of economic importance over 15%. Central NT ranks highest with an estimate of 24.8%7 and Phillip Island comes in second at 18.7%. The top five regions only accounted for 3% of Australia’s total tourism expenditure in 2007/08. In contrast, some of the regions with lower importance estimates are Australia’s largest tourism industries based on total expenditure − Sydney, Melbourne, Brisbane, Adelaide and Experience Perth (Table 4).8 The estimates for these regions are below the benchmark of 3.0%.
Table 3: Less dependent regions with larger tourism industries
Rank Tourism region State
Economic importance of tourism
Total tourism expenditure
% Purchaser’s prices, $m
67 Sydney NSW 2.4 11,751
69 Melbourne Vic 2.3 9,120
71 Brisbane Qld 1.9 5,068
72 Adelaide SA 1.7 2,325
73 Experience Perth WA 1.6 4,474
Figure 3 plots the relative size of the tourism industry (based on tourism expenditure) against the relative importance of tourism for each tourism region. To gauge the relative size of the estimates for each region, benchmarks for Australia are used9 and the difference between the region estimates and the benchmark are calculated. Therefore, regions to the right of the vertical axis rely more on tourism relative to the benchmark. Similarly, regions above the horizontal axis have high levels of expenditure, relative to the benchmark.
7 Estimates for Central NT may be overestimated. This overestimation can be attributed to the overestimation of total tourism expenditure and/or the underestimation of total regional output. Tourism expenditure is likely to be overestimated as a result of the regional expenditure allocation process; particularly the allocation of long-distance transport costs amongst regions in the NT. Tourism output is likely to be underestimated due to government benefits/allowances being excluded from the personal income data. The ABS does not publish data on government welfare/benefits for rural NT regions due to data reliability issues (see ABS cat. no 6537.0); however, in 2008 the employment gap between Indigenous and non-Indigenous Australians in the NT was the highest of all the states and territories (see Commonwealth of Australia, Closing the Gap Prime Minister’s Report 2010). With many Indigenous communities concentrated in Central NT, it is likely that estimates for personal income and tourism-dependency are overestimated. 8 The total tourism expenditure estimates exclude travel expenditure both before and after a visitor’s outbound trip. As a result, estimates for regions that are major international gateways (e.g. capital cities), may be underestimated. 9 The benchmark for tourism industry size is $967 million (average total tourism expenditure across all regions in Australia).
9

Figure 3: Comparison between industry size and economic importance of tourism
Tropical North Queensland, Sunshine Coast, Gold Coast, Mid North Coast, Northern Rivers, South Coast and Australia’s South West have large tourism industries, and they are also highly dependent on tourism. Together, these regions account for 21% of total tourism expenditure in Australia.
10
5 Conclusion
While the majority of tourism expenditure in Australia was limited to a small number of regions, there are a significantly larger number of tourism regions that rely on tourism as part of their economic base – showing that the economic importance of tourism within a tourism region is not determined by the size of that region’s tourism industry. While it has not been possible to calculate the actual level of tourism importance in a region, the proxy measures developed do provide an indication of the relative importance of tourism in 77 of Australia’s tourism regions. The findings suggest that the economic importance of tourism is highest in Central NT, Phillip Island, Whitsundays, Snowy Mountains and West Coast in Tasmania. These regions all have relatively small economies with small tourism industries that rely significantly on tourism. In contrast, the economic importance of tourism in regions like Tropical North Queensland, Sunshine Coast, Gold Coast, Mid North Coast, Northern Rivers, South Coast and Australia’s South West cannot be understated, as they also have relatively large tourism industries. Tourism regions whose economies are dependent on tourism are more likely to be vulnerable to shocks that affect the tourism industry. Whether their economies are large or small, the importance of these local tourism industries to their regional economies is considerable, as unexpected shocks could impact on the entire local economy.
11

Appendices
Appendix A: Detailed methodology The concept underpinning the economic importance of tourism estimates in this report is essentially a ratio of output measures, whereby,
The numerator must reflect some measure of output that is generated by the region’s tourism industry. The denominator, on the other hand, needs to reflect the region’s economic base – the total output generated by the economy.
A1 Tourism output ‘Tourism output’ is the value of goods and services, at basic prices10, which are consumed by visitors and produced in the region by industries in a direct relationship with visitors. Currently there are no data or estimates available on tourism output at either the Statistical Local Area (SLA) or regional level. It is possible, however, to use regional tourism expenditure as a proxy variable. Tourism expenditure comprises ‘the amount paid by a visitor or on behalf of a visitor for and during his/her trip and stay at the destination’.11 Regional tourism expenditure estimates for domestic day, domestic overnight and international visitors are calculated by TRA using a regional tourism expenditure allocation method.12 The variable of interest is total tourism expenditure. It is derived by aggregating the estimates for each region’s domestic day, domestic overnight, and international visitor expenditure (see Table A1). These estimates are given in purchasers’ prices.13 Table A1: Example derivation of total tourism expenditure estimates for each tourism region
Tourism region Variable Domestic
day ($m)
Domestic overnight
($m) (Including airfares)
International ($m)
(Including package
expenditure)
Total
South Coast (NSW)
Tourism expenditure 2007/08, purchaser’s prices ($m)
521 1,263 140 1,924
10 Basic prices – See Glossary. 11 ABS 2010 cat no. 5249.0 12 See References for more information. 13 See Glossary.
12
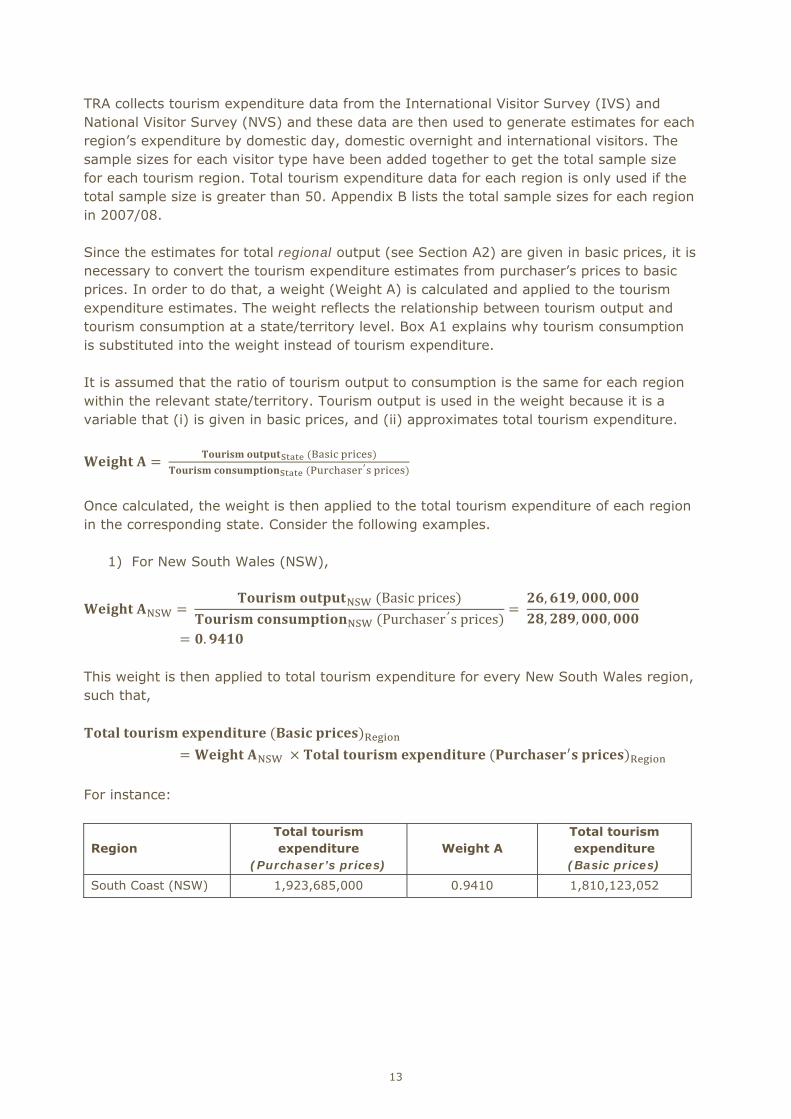
TRA collects tourism expenditure data from the International Visitor Survey (IVS) and National Visitor Survey (NVS) and these data are then used to generate estimates for each region’s expenditure by domestic day, domestic overnight and international visitors. The sample sizes for each visitor type have been added together to get the total sample size for each tourism region. Total tourism expenditure data for each region is only used if the total sample size is greater than 50. Appendix B lists the total sample sizes for each region in 2007/08. Since the estimates for total regional output (see Section A2) are given in basic prices, it is necessary to convert the tourism expenditure estimates from purchaser’s prices to basic prices. In order to do that, a weight (Weight A) is calculated and applied to the tourism expenditure estimates. The weight reflects the relationship between tourism output and tourism consumption at a state/territory level. Box A1 explains why tourism consumption is substituted into the weight instead of tourism expenditure. It is assumed that the ratio of tourism output to consumption is the same for each region within the relevant state/territory. Tourism output is used in the weight because it is a variable that (i) is given in basic prices, and (ii) approximates total tourism expenditure. S B S P ′
Once calculated, the weight is then applied to the total tourism expenditure of each region in the corresponding state. Consider the following examples.
1) For New South Wales (NSW), NSW NSW Basic prices NSW Purchaser′s prices , , ,, , ,. This weight is then applied to total tourism expenditure for every New South Wales region, such that, R NSW R For instance:
Region Total tourism expenditure
(Purchaser’s prices) Weight A
Total tourism expenditure
(Basic prices)
South Coast (NSW) 1,923,685,000 0.9410 1,810,123,052
13

Tourism expenditure consists of the amount paid by a visitor or on behalf of a visitor for and during his/her trip and stay at the destination. Tourism consumption consists of tourism expenditure plus imputed consumption by resident and non-resident visitors on tourism-related products, including those sold at prices that are not economically significant. The imputed consumption includes: • Actual and imputed rent on dwellings – the consumption of housing services
provided by holiday houses to the owner • Products provided to visitors in private households • Non-market services provided by government – e.g. museum services. In short, tourism consumption equals tourism expenditure plus imputed values. The reason tourism consumption is used in Weight A, as opposed to tourism expenditure, is to ensure measurement consistency with tourism output. Since tourism output is derived from tourism consumption, it also accounts for imputed values.
2) For South Australia (SA), SA SA Basic prices SA Purchaser′s prices , , ,, , , .
This weight is then applied to every region in South Australia:
Region
Total tourism expenditure (Purchaser’s
prices)
Weight A Tourism
expenditure (Basic prices)
Limestone Coast (SA) 250,883,000 0.7979 200,184,580
The readjusted tourism expenditure estimates are then substituted as the tourism output variable in the estimates. Box A1: Difference between tourism consumption and tourism expenditure
14

A2 Regional output In order to derive the economic base for each tourism region, data collected at the SLA level needs to be aggregated according to SLA and tourism region concordances.14 Presently, however, the data needed to calculate the regional economic base is not available at either the SLA or regional level. In other words, there are no readily-available estimates of regional income, output, or gross value-added. Unfortunately, a direct consequence of this absent data is that calculating economic importance of tourism is not as straightforward as calculating national importance (direct tourism contribution). Each economic importance estimate must reflect the respective region’s economic base – the size of the region’s economy. The economic importance estimates in this report rely on estimates of total regional output. The starting point for estimating regional output is ABS data on total personal income. This data set15 provides estimates of personal income at the SLA level. In order to obtain the regional estimates for personal income, the SLA estimates are aggregated according to the 2009 tourism region concordances. The regional estimates of personal income cannot, however, be substituted directly into the economic importance formula as a proxy for regional output. The reason for this is due to the nature of the personal income data. These data only account for the following sources of income: • Wage and salary • Own unincorporated business • Investment • Superannuation and annuities • Other income (excluding government pensions and allowances). The data do not explicitly include income that is (i) received by incorporated businesses and (ii) does not fall within the scope of aforementioned income categories. For example, commercial revenue that is not distributed among the income categories above remains unaccounted for in the personal income estimates. As such, a second weight (Weight B) is devised in order to obtain estimates regional output. This weight essentially uses the relationship between a region’s total personal income and its state’s total personal income to estimate the proportion of state output attributable to that region. In other words, the proportion of state total personal income attributable to a region is assumed to hold for output. The relevant weight is derived as follows, Region State
This weight is then applied to the corresponding region’s total state output in order to obtain an estimate of total regional output in basic prices.16 14 ABS 2009, cat no. 9503.0.55.001. 15 ABS 2010 cat no. 6524.0.55.002. 16 Basic prices – see Glossary.
15

Consider the following example for the South Coast. S C S C NSW , , ,, , , .
and NSW , , , 17 Therefore, S C NSW S C
Region Total state output
(Basic prices) Weight B
Total regional output (Basic prices)
South Coast (NSW) 683,745,562,500 0.0495 33,813,745,823
This result is then used as an estimate of South Coast’s economic base; it is used as a proxy estimate for the region’s output. Calculating the economic importance of tourism estimates Once estimates for tourism output and total regional output were obtained for each tourism region, the economic importance of tourism is calculated by dividing tourism output over total regional output. %
The economic importance estimates reflect the percentage of a region’s total output that is attributable to its local tourism industry.
17 STCRC unpublished data.
16

A3 Data sources
The economic importance of tourism estimates calculated in this report relate only to the 2007/08 financial year. This is due to the lack of more recent data on total personal income. Table A1 lists all the variables used in the methodology as well as the corresponding data sources. Table A1: Variables of interest and corresponding data sources
Variable Source
Tourism expenditure TRA expenditure allocation method applied to National Visitor Survey and International Visitor Survey data, 2007/08 (unpublished data)
State tourism output at basic prices Pambudi et al. (2009)
State tourism consumption at purchaser’s prices
Pambudi et al. (2009)
Total personal income ABS cat no. 6524.0.55.002 2007/08
State total output at basic prices STCRC unpublished data
17

Appendix B: Detailed results
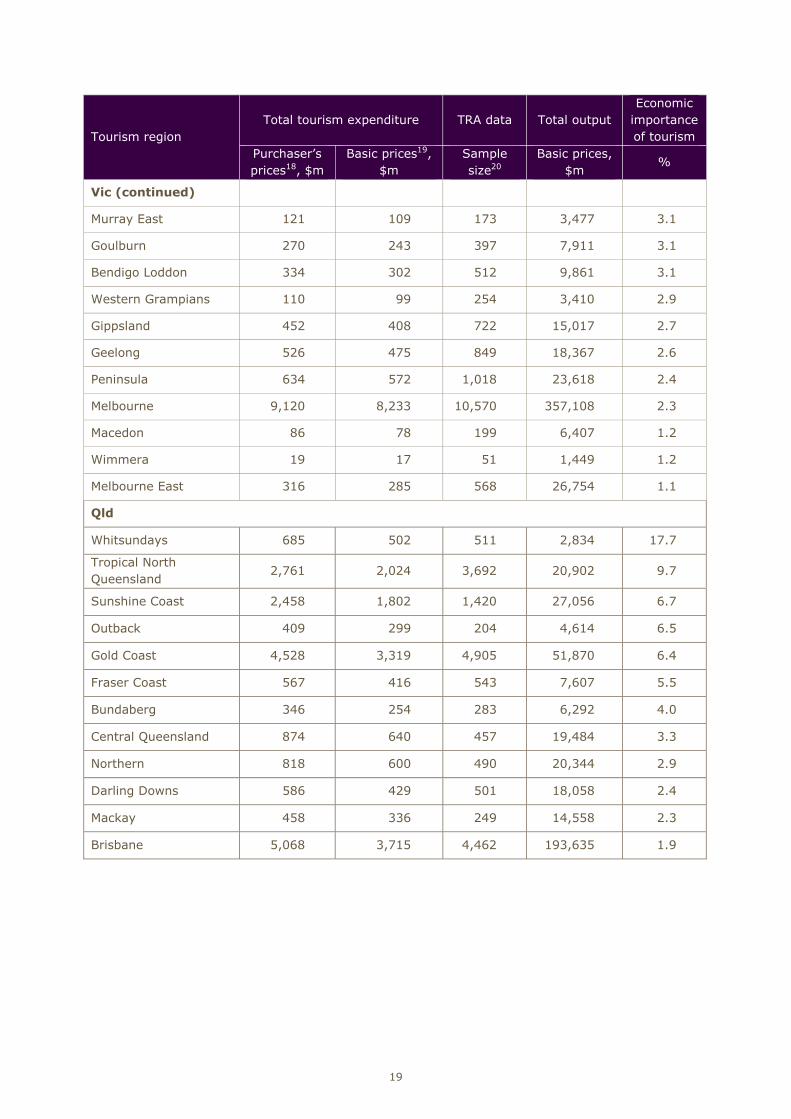
Table B1: Total tourism expenditure, sample sizes, total output and economic importance of tourism estimates (in order of magnitude)
Tourism region Total tourism expenditure TRA data Total output
Economic importance of tourism
Purchaser’s prices18, $m
Basic prices19, $m
Sample size20
Basic prices, $m
%
NSW
Snowy Mountains 495 465 369 2,726 17.1
Mid North Coast 2,041 1,921 1,987 21,960 8.7
Northern Rivers 1,185 1,115 1,262 18,275 6.1
The Murray 409 385 464 7,061 5.5
Outback NSW 186 175 198 3,218 5.4
South Coast 1,924 1,810 2,296 33,814 5.4
Central NSW 934 879 1,124 17,254 5.1
New England North West
622 585 752 12,108 4.8
Blue Mountains 431 406 721 9,236 4.4
Riverina 450 423 498 11,775 3.6
Central Coast 844 794 1,104 24,595 3.2
Hunter 1,368 1,287 1,794 44,799 2.9
Capital Country 417 392 673 15,197 2.6
Sydney 11,751 11,057 17,836 459,679 2.4
Vic
Phillip Island 391 353 539 1,887 18.7
Spa Country 163 147 173 1,027 14.3
Lakes 296 267 283 2,898 9.2
Upper Yarra 92 83 147 1,087 7.7
Central Murray 373 337 414 4,574 7.4
High Country 470 425 479 5,872 7.2
Western 880 794 1,128 12,820 6.2
Mallee 260 235 358 6,124 3.8
Ballarat 310 280 439 7,372 3.8
Central Highlands 76 69 128 2,000 3.4
18 Purchaser’s prices – See Detailed methodology (Appendix A) and Glossary. 19 Basic prices – See Detailed methodology (Appendix A) and Glossary. 20 The estimates for tourism expenditure are derived by TRA using their regional tourism expenditure allocation model. This model relies on data from the National and International Visitor Surveys. The aggregate sample sizes of these surveys for the 2007/08 financial year are provided here.
18
Tourism region Total tourism expenditure TRA data Total output
Economic importance of tourism
Purchaser’s prices18, $m
Basic prices19, $m
Sample size20
Basic prices, $m
%
Vic (continued)
Murray East 121 109 173 3,477 3.1
Goulburn 270 243 397 7,911 3.1
Bendigo Loddon 334 302 512 9,861 3.1
Western Grampians 110 99 254 3,410 2.9
Gippsland 452 408 722 15,017 2.7
Geelong 526 475 849 18,367 2.6
Peninsula 634 572 1,018 23,618 2.4
Melbourne 9,120 8,233 10,570 357,108 2.3
Macedon 86 78 199 6,407 1.2
Wimmera 19 17 51 1,449 1.2
Melbourne East 316 285 568 26,754 1.1
Qld
Whitsundays 685 502 511 2,834 17.7
Tropical North Queensland
2,761 2,024 3,692 20,902 9.7
Sunshine Coast 2,458 1,802 1,420 27,056 6.7
Outback 409 299 204 4,614 6.5
Gold Coast 4,528 3,319 4,905 51,870 6.4
Fraser Coast 567 416 543 7,607 5.5
Bundaberg 346 254 283 6,292 4.0
Central Queensland 874 640 457 19,484 3.3
Northern 818 600 490 20,344 2.9
Darling Downs 586 429 501 18,058 2.4
Mackay 458 336 249 14,558 2.3
Brisbane 5,068 3,715 4,462 193,635 1.9
19

Tourism region Total tourism expenditure TRA data Total output
Economic importance of tourism
Purchaser’s prices21, $m
Basic prices22, $m
Sample size23
Basic prices, $m
%
SA
Kangaroo Island 63 50 126 358 14.1
Clare Valley 78 62 190 1,074 5.8
Yorke Peninsula 177 141 520 2,921 4.8
Eyre Peninsula 282 225 385 4,720 4.8
Fleurieu Peninsula 357 285 919 6,160 4.6
Outback SA 61 48 84 1,077 4.5
Flinders Ranges 187 149 355 3,353 4.4
Riverland 123 99 234 2,379 4.1
Murraylands 105 84 361 2,033 4.1
Barossa 156 124 335 3,263 3.8
Limestone Coast 251 200 530 6,128 3.3
Adelaide 2,325 1,855 3,198 107,251 1.7
Adelaide Hills 88 70 250 7,633 0.9
WA
Australia's Coral Coast 512 379 619 5,531 6.9
Australia's North West 703 520 581 9,301 5.6
Australia's South West 1,306 966 2482 20,234 4.8
Australia's Golden Outback
393 291 795 10,898 2.7
Experience Perth 4,474 3,310 8,470 205,530 1.6
Tas
West Coast 102 71 136 439 16.2
East Coast 129 90 430 621 14.6
Launceston and Tamar Valley
530 371 923 8,268 4.5
Southern 125 87 605 2,137 4.1
Hobart & Surrounds 914 640 1,237 18,659 3.4
North West 323 226 775 7,877 2.9
Northern 72 50 337 2,062 2.4
21 Purchaser’s prices – See Detailed methodology (Appendix A) and Glossary. 22 Basic prices – See Detailed methodology (Appendix A) and Glossary. 23 The estimates for tourism expenditure are derived by TRA using their regional tourism expenditure allocation model. This model relies on data from the National and International Visitor Surveys. The aggregate sample sizes of these surveys for the 2007/08 financial year are provided here.
20

Tourism region Total tourism expenditure TRA data Total output
Economic importance of tourism
Purchaser’s prices21, $m
Basic prices22, $m
Sample size23
Basic prices, $m
%
NT
Central 411 307
756 1,239 24.8
Alice Springs 241 180 278 3,368 5.3
Top End 237 177 466 3,575 5.0
Darwin 791 591 886 19,831 3.0
ACT
Canberra 1,464 1,058 1,580 41,428 2.6
21

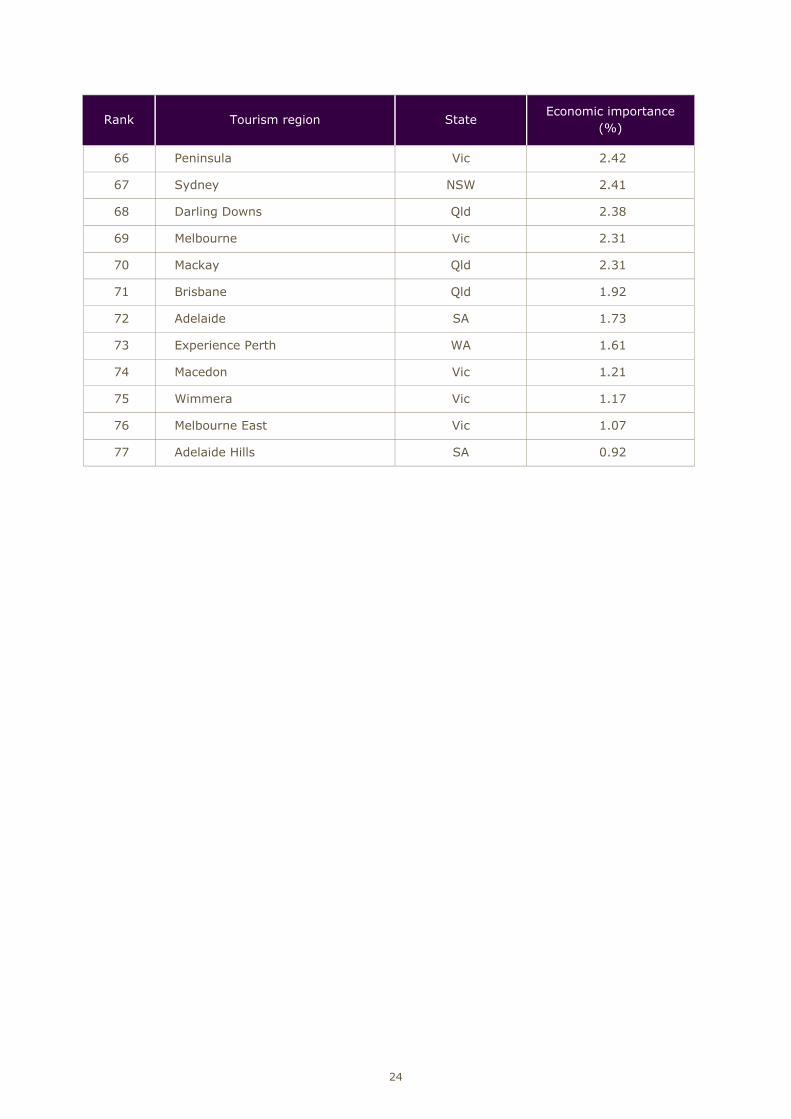
Table B2: Economic importance of tourism estimates ranked by importance
Rank Tourism region State Economic importance
(%)
1 Central NT 24.78
2 Phillip Island Vic 18.70
3 Whitsundays Qld 17.71
4 Snowy Mountains NSW 17.08
5 West Coast Tas 16.20
6 East Coast Tas 14.57
7 Spa Country Vic 14.34
8 Kangaroo Island SA 14.07
9 Tropical North Queensland Qld 9.68
10 Lakes Vic 9.21
11 Mid North Coast NSW 8.75
12 Upper Yarra Vic 7.66
13 Central Murray Vic 7.36
14 High Country Vic 7.23
15 Australia's Coral Coast WA 6.85
16 Sunshine Coast Qld 6.66
17 Outback Qld 6.49
18 Gold Coast Qld 6.40
19 Western Vic 6.20
20 Northern Rivers NSW 6.10
21 Clare Valley SA 5.78
22 Australia's North West WA 5.59
23 Fraser Coast Qld 5.46
24 The Murray NSW 5.45
25 Outback NSW NSW 5.44
26 South Coast NSW 5.35
27 Alice Springs NT 5.34
28 Central NSW NSW 5.09
29 Top End NT 4.95
30 New England North West NSW 4.83
31 Yorke Peninsula SA 4.82
32 Australia's South West WA 4.77
22

Rank Tourism region State Economic importance
(%)
33 Eyre Peninsula SA 4.76
34 Fleurieu Peninsula SA 4.62
35 Outback SA SA 4.49
36 Launceston and Tamar Valley TAS 4.49
37 Flinders Ranges SA 4.44
38 Blue Mountains NSW 4.40
39 Riverland SA 4.14
40 Murraylands SA 4.13
41 Southern Tas 4.09
42 Bundaberg Qld 4.03
43 Mallee Vic 3.84
44 Barossa SA 3.80
45 Ballarat Vic 3.79
46 Riverina NSW 3.59
47 Central Highlands Vic 3.45
48 Hobart and Surrounds Tas 3.43
49 Central Queensland Qld 3.29
50 Limestone Coast SA 3.27
51 Central Coast NSW 3.23
52 Murray East Vic 3.13
53 Goulburn Vic 3.08
54 Bendigo Loddon Vic 3.06
55 Darwin NT 2.98
56 Northern Qld 2.95
57 Western Grampians Vic 2.90
58 Hunter NSW 2.87
59 North West Tas 2.87
60 Gippsland Vic 2.72
61 Australia's Golden Outback WA 2.67
62 Geelong Vic 2.59
63 Capital Country NSW 2.58
64 Canberra ACT 2.55
65 Northern Tas 2.43
23
Rank Tourism region State Economic importance
(%)
66 Peninsula Vic 2.42
67 Sydney NSW 2.41
68 Darling Downs Qld 2.38
69 Melbourne Vic 2.31
70 Mackay Qld 2.31
71 Brisbane Qld 1.92
72 Adelaide SA 1.73
73 Experience Perth WA 1.61
74 Macedon Vic 1.21
75 Wimmera Vic 1.17
76 Melbourne East Vic 1.07
77 Adelaide Hills SA 0.92
24
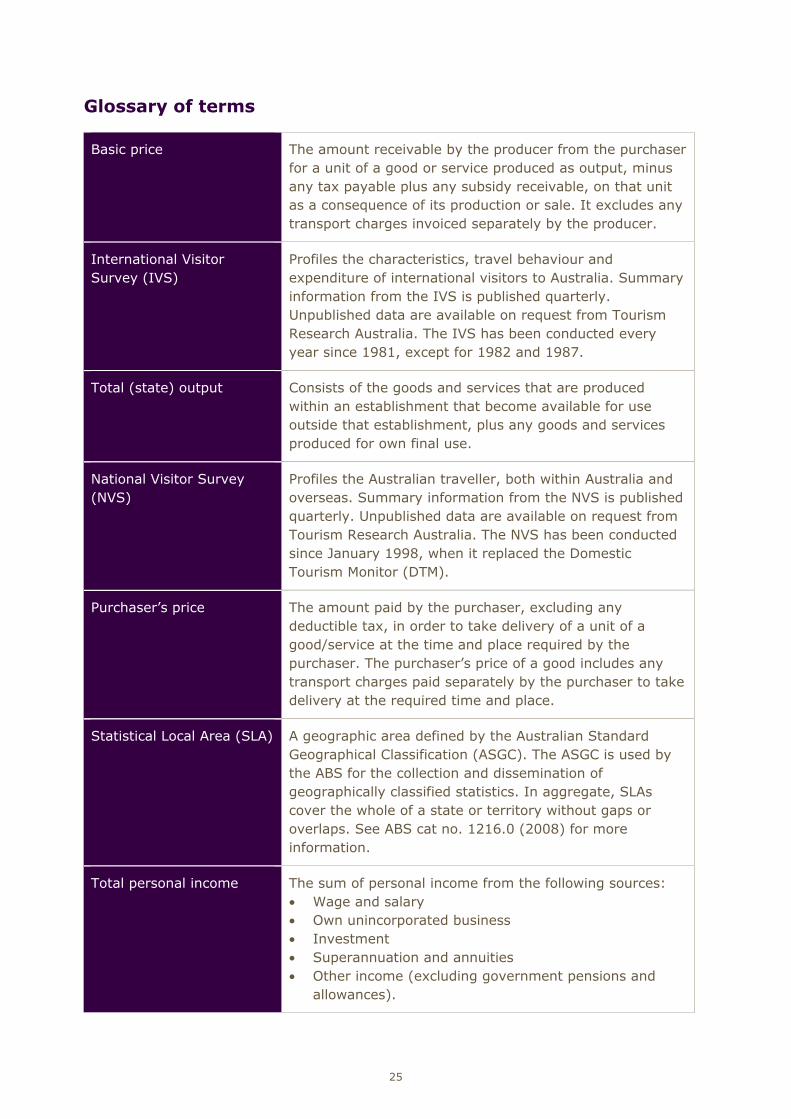
Glossary of terms
Basic price The amount receivable by the producer from the purchaser for a unit of a good or service produced as output, minus any tax payable plus any subsidy receivable, on that unit as a consequence of its production or sale. It excludes any transport charges invoiced separately by the producer.
International Visitor Survey (IVS)
Profiles the characteristics, travel behaviour and expenditure of international visitors to Australia. Summary information from the IVS is published quarterly. Unpublished data are available on request from Tourism Research Australia. The IVS has been conducted every year since 1981, except for 1982 and 1987.
Total (state) output Consists of the goods and services that are produced within an establishment that become available for use outside that establishment, plus any goods and services produced for own final use.
National Visitor Survey (NVS)
Profiles the Australian traveller, both within Australia and overseas. Summary information from the NVS is published quarterly. Unpublished data are available on request from Tourism Research Australia. The NVS has been conducted since January 1998, when it replaced the Domestic Tourism Monitor (DTM).
Purchaser’s price The amount paid by the purchaser, excluding any deductible tax, in order to take delivery of a unit of a good/service at the time and place required by the purchaser. The purchaser’s price of a good includes any transport charges paid separately by the purchaser to take delivery at the required time and place.
Statistical Local Area (SLA) A geographic area defined by the Australian Standard Geographical Classification (ASGC). The ASGC is used by the ABS for the collection and dissemination of geographically classified statistics. In aggregate, SLAs cover the whole of a state or territory without gaps or overlaps. See ABS cat no. 1216.0 (2008) for more information.
Total personal income The sum of personal income from the following sources: • Wage and salary • Own unincorporated business • Investment • Superannuation and annuities • Other income (excluding government pensions and
allowances).
25

Total tourism expenditure The sum of tourism expenditure by domestic day, domestic overnight and international visitors.
Tourism consumption Consists of tourism expenditure plus imputed consumption by resident and non-resident visitors on tourism-related products, including those sold at prices that are not economically significant.
Tourism expenditure Consists of the amount paid by a visitor or on behalf of a visitor for and during his/her trip and stay at the destination.
(State) Tourism output The value of goods and services, at basic prices, which are consumed by visitors and produced in the state/territory by industries in a direct relationship with visitors.
Tourism region A region geographically defined by the ABS Tourism Region Maps and Concordance Files. See Reference List.
References
Australian Bureau of Statistics, 2007, Government Benefits, Taxes and Household Income, Australia, 2003/04, cat no. 6537.0, ABS, Canberra. Australian Bureau of Statistics, 2009. Australian National Accounts: Tourism Satellite Account, 2007/08, cat no. 5249.0, ABS, Canberra. Australian Bureau of Statistics, 2009. Tourism Region Maps and Concordance Files, Australia, 2008, cat no. 9503.0.55.001, ABS, Canberra. Australian Bureau of Statistics, 2010. Australian National Accounts: Tourism Satellite Account, 2009/10, cat no. 5249.0, ABS, Canberra. Australian Bureau of Statistics, 2010. Estimates of Personal Income for Small Areas, 2007/08, cat no. 6524.0.55.002, ABS, Canberra. Commonwealth of Australia, 2010, Closing the Gap Prime Minister’s Report 2010, Attorney General’s Department, Canberra. Pambudi et al., 2009. Tourism Satellite Accounts 2007/08: Summary Spreadsheets, Sustainable Tourism Cooperative Research Centre, Gold Coast, Queensland. For further information on the TRA expenditure allocation method: Tourism Research Australia, 2010. Backgrounds and Methods: Regional Expenditure 2009. TRA, Canberra.
26


Tourism Research Australia Department of Resources, Energy and Tourism GPO Box 1564 Canberra ACT 2601 ABN: 46 252 861 927
Contact us at www.ret.gov.au/tra