STRUCTURE AND PROPERTIES OF UNI- AND … AND PROPERTIES OF UNI - AND BIAXIALLY ORIENTED...
27
?ure & Appi. Chem., Vol.53, pp.'011—1037. 0033—4545/81/051011—26$02.OO/O Printed in Great Britain. Pergamon Press Ltd. ©1981 IUPAC INTERNATIONAL UNION OF PURE AND APPLIED CHEMISTRY MACROMOLECULAR DIVISION COMMISSION ON POLYMER CHARACTERIZATION AND PROPERTIES WORKING PARTY ON STRUCTURE AND PROPERTIES OF COMMERCIAL POLYMERS* STRUCTURE AND PROPERTIES OF UNI- AND BIAXIALLY ORIENTED POLYPROPYLENE FILMS: PART I— STRUCTURAL CHARACTERIZATION Prepared for publication by A. J. de VRIES Rhône-Poulenc Centre de Recherches, Aubervilliers, France *Membership of the Working Party during 1979 - 81 is principally as follows: Chairman: P. L. CLEGG (UK); Secretary: M. E. CARREGA (France); Members: G. AJROLDI (Italy); C. B. BUCKNALL (UK); J. M. CANN (UK); J. C. CHAUFFOUREAUX (Belgium); F. N. COGSWELL (UK); M. FLEISSNER (FRG); A. GHIJSELS (Netherlands); G. GOLDBACffj1RG); J. HEIJBOER (Netherlands); P. B. KEATING (Belgium); A. S. LODGE (USA)\ J. MEISSNER (Switzerland); H. MUNSTEDT (FRG); W. RETTING (FRG); S. FURNER (UK); A. K. van der YEGT (Netherlands); A. J. de VRIES (France); J. L. S. WALES (Netherlands); H. H. WINTER (USA); J. YOUNG (Netherlands).
-
Upload
phungkhanh -
Category
Documents
-
view
222 -
download
1
Transcript of STRUCTURE AND PROPERTIES OF UNI- AND … AND PROPERTIES OF UNI - AND BIAXIALLY ORIENTED...
?ure & Appi. Chem., Vol.53, pp.'011—1037. 0033—4545/81/051011—26$02.OO/O
Printed in Great Britain. Pergamon Press Ltd.©1981 IUPAC
INTERNATIONAL UNION OF PUREAND APPLIED CHEMISTRY
MACROMOLECULAR DIVISION
COMMISSION ON POLYMER CHARACTERIZATIONAND PROPERTIES
WORKING PARTY ON STRUCTURE AND PROPERTIES OFCOMMERCIAL POLYMERS*
STRUCTURE AND PROPERTIES OFUNI- AND BIAXIALLY ORIENTED
POLYPROPYLENE FILMS: PART I—STRUCTURAL CHARACTERIZATION
Prepared for publication byA. J. de VRIES
Rhône-Poulenc Centre de Recherches,Aubervilliers, France
*Membership of the Working Party during 1979 - 81 is principally as follows:
Chairman: P. L. CLEGG (UK); Secretary: M. E. CARREGA (France); Members:G. AJROLDI (Italy); C. B. BUCKNALL (UK); J. M. CANN (UK);J. C. CHAUFFOUREAUX (Belgium); F. N. COGSWELL (UK); M. FLEISSNER (FRG);A. GHIJSELS (Netherlands); G. GOLDBACffj1RG); J. HEIJBOER (Netherlands);P. B. KEATING (Belgium); A. S. LODGE (USA)\ J. MEISSNER (Switzerland);H. MUNSTEDT (FRG); W. RETTING (FRG); S. FURNER (UK); A. K. van der YEGT(Netherlands); A. J. de VRIES (France); J. L. S. WALES (Netherlands); H. H. WINTER(USA); J. YOUNG (Netherlands).
STRUCTURE AND PROPERTIES OF UNI - AND BIAXIALLY ORIENTED
POLYPROPYLENE FILMS
PART 1 : STRUCTURAL CHARACTERIZATION
A.J. de Vries
Rhône—Poulenc Industries, 93308 Aubervilliers, France
ABSTRACT : Six different laboratories have participated in a collaborativeresearch programme on the characterization of five uniaxially and five biaxiallydrawn polypropylene films. The experimental results mainly concern the followingcharacteristics : density, heat of fusion, principal refractive indices, surfaceand bulk birefringence, wide — and small angle X—ray diffraction, Infra—red di—chroism. Crystallinity content and average molecular orientation in both crystal—line and non—crystalline phases have been calculated from the experimental data.Substantial differences were found between the states of structural order in
crystalline and non—crystalline phases, in particular with regard to : degree ofmolecular orientation, amount of planar orientation, and degree of unbalancedorientation in biaxially drawn films.
1 - INTRODUCTION
The present report is one of a series dealing with a collaborative study of the relation-ships between molecular orientation and end—use properties of polymers. Previous studies ofthe IUPAC Working Party were concerned with (i) uniaxially drawn sheets of atactic polys-tyrene, and (ii) uniaxially drawn sheets of rubber—modified atactic polystyrene. The resultsof both studies, reported by T.T. Jones (1) and W. Retting (2) respectively, have provideda wealth of information on the induction of essentially uniaxial molecular orientation inamorphous polymers and on the effect of degree of orientation on various mechanical proper-ties.
An appropriate quantitative description of the degree of molecular orientation is a prere-quisite for any further progress in our understanding of the complex relationships betweenpolymer processing and molecular orientation, on the one hand, and between orientation andend—use properties, on the other hand. Although various experimental techniques designed toprovide accurate information on the degree of molecular orientation in amorphous and/or semi—crystalline polymers are available (Refs.3,4) their systematic use is still limited andmainly restricted to the particular case of uniaxial orientation. In industrial practiceoriented polymer films or sheets are most often produced by means of simultaneous or sequen-tial stretching in two orthogonal directions and the resulting anisotropic structure can onlybe described in terms of biaxial molecular orientation. For this reason the Working Partydecided to include in its third collaborative programme devoted to the general theme of mole-cular orientation, an extensive study of biaxially oriented polymer films.
In addition, a semi—crystalline polymer containing a substantial amount of crystallinity, iso—tactic polypropylene, was chosen not only because of its industrial importance, but also be-cause the presence of a voluminous crystalline phase would allow, with the aid of X—ray dif-fraction analysis, a reasonably complete description of the state of orientation in at leastone important fraction of the material.
Uniaxially drawn fibers and films of isotactic polypropylene have been investigated in consi-derable detail by R.J. Samuels (4,5), who also developed a systematic analysis of the expe-rimental data, based on a simple two—phase model (Ref. 6). One of the objectives of the pre-sent programme was to apply a similar analysis to both uni—and biaxially oriented polypropy-lene films and to examine its possible interest for developing unique structure—properties
relationships.
1012

Structure and properties of polypropylene films 1013
Part 1 of the Report is mainly concerned with the structural characterization of the inves—
tigated polypropylene films prepared under conditions comparable to standard industrialpractice. Subsequent Parts will be devoted to a discussion of mechanical and other end—useproperties of the same films and to the results of laboratory experiments on uni—and biaxialstretching under well defined condi.tions.
2 — PARTICIPANTS
The following laboratories have participated in this part of the programme
1. BASF Aktiengesellschaft, Ludwigshaf en am Rhein, F.R.G.
2.&3 ICI Plastics Division, Welwyn Garden City, U.K.
3. SHELL Research B.V. Amsterdam, Netherlands
4. SOLVAY & Cie Brussels, Belgium
5. T.N.0. Central Laboratory, Delft, Netherlands
6.,Q RHONE—POULENC INDUSTRIES, Aubervilliers and St—Fons, France.
Each participant will be referred to by the numbers or by the symbols given above.
3 - PREPARATION OF ORIENTED FILMS
The preparation of isotactic polypropylene films of varying nominal draw ratios was conductedon a continuous basis by means of extrusion of the polymer melt through a slit die, followedby cooling on a chill roll and stretching in the machine direction (MD) at a temperature of120—140° C (uniaxially drawn films); in the case of biaxially drawn films stretching in themachine direction was immediately followed by stretching in the transverse direction (TD)by means of a tenterframe. TD—stretching was performed at a temperature At least 20° C higherthan MD—stretching. Initial thickness of the extruded sheet was varied in order to attain anearly constant film thickness, irrespective of draw ratio : for the uniaxially drawn filmsthe average final thickness was 160 im ( 10 %), for the biaxially drawn films 21(t 10 Z).
All films were prepared from the same commercial grade of isotactic polypropylene
Napryl 63 200 (Naphtachimie) of the following characteristics
Weight—average Molecular Weight, H 350 000
Polydispersity, / = 4.8
Soluble fraction in boiling n—heptane (low molecular weight isotactic polypropylene + atacticpolypropylene) = 5 %
Melting point (DSC) = 161° C, Melt Index (ASTM 1238—65 T) = 3
The polymer contained small amounts of anti—oxydant and stabilizer. Each investigated filmis referred to by a number : 1.01 for the isotropic film, 1.02 — 1.06 for the five uniaxiallydrawn films and 2.07 — 2.11 for the five biaxially drawn films, respectively. Nominal drawratios in the machine direction ( final—to—initial length ratio) and in the transverse di-rection ( final—to—initial width ratio) are indicated in Table 1.
All films were prepared by Rhône—Poulénc in September 1976 and March 1977 and distributed toparticipating laboratories in July 1977 ; a major part of the measurements was performed atleast six months after preparation of the films.
1014 COMMISSION ON POLYMER CHARACTERIZATION AND PROPERTIES
TABLE 1 :
Sample
Code
Nominal Draw Ratios
M X T
Density 23°C
kg/m3
v
(Eq. 1)
w
(= vd/d)w
(D.S.C.)
Participant
1.01 1 x 1
900.3
901.0
0.58 0.60 0.56
2
6
1.02 1.2 X 1
906.2
0.65 0.67 0.64
2
1.03 1.5 X 1
902.5
903.6
0.60 0.62 0.62
2
6
1.04 4 X 1
902.6
903.7
0.60 0.62 0.62
2
6
1.05 s X 1
903.6
0.62 0.64 0.66
2
1.06 6 X 1
902.2
904.0
0.60 0.62 0.60
2
6
2.07 1.2 X
913.6
0.71 0.73 0.72
6
2.08 1.5 X
912.3
0.71 0.73 0.72
2
2.09 4 X '
910.3
909.8
0.69 0.71 0.71
2
6
2.10 5 X 6
911.5
0.70 0.72 0.69
2
2.11 6 X 6
910.5
0.70 0.72 0.71
2

Structure and properties of polypropylene films 1015
4 - DENSITY, CRYSTALLINITY AND AVERAGE REFRACTIVE INDEX
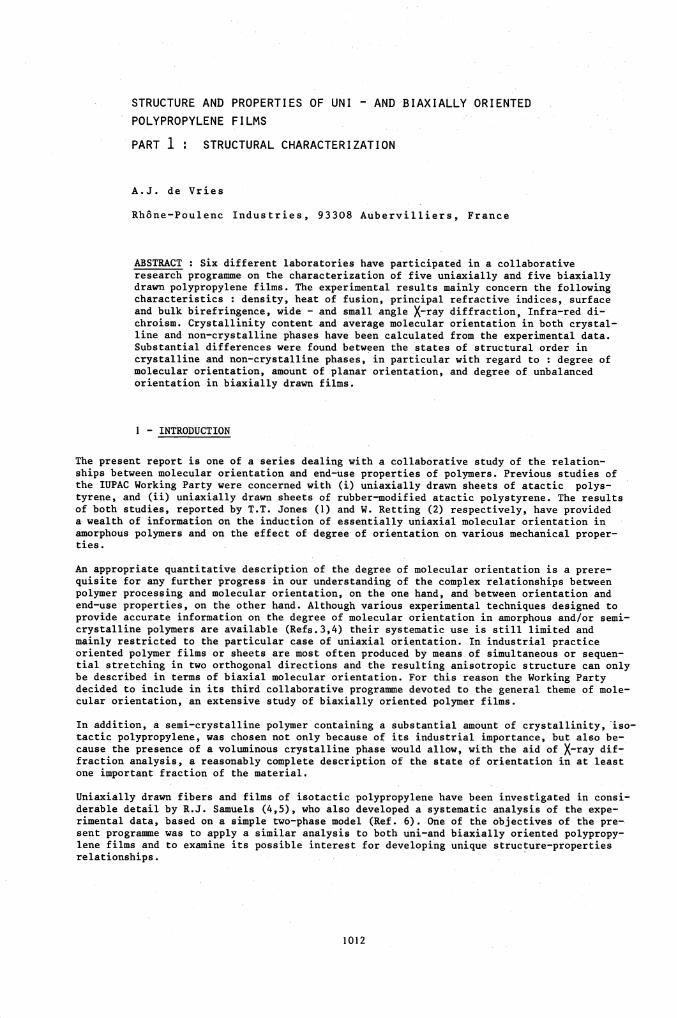
Density values determined by four participants with the aid of density gradient columns at23° C are given in Table 1. Duplicate measurements carried out by Participant 5 show thatresults of successive measurements with the same column differ less than 0.5 kg/rn3. Diff e—rences between the results of different laboratories may amount to more than 1 kg/rn3 and donot seem to be related to the date of measurement. The effect of spontaneous volume relaxa—
tion or "physical ageing" (Ref. 7) was also investigated by Participant 5 who observed bet—ween September 1977 and January 1979 increases of density at 23° C which varied between 1.2and 1.8 kg/rn3, apparently independent of the state and degree of orientation of the filmconsidered. Volume changes in both amorphous and crystalline phases may be responsible forthis ageing behaviour.
As to the absolute values of density no systematic effect of draw ratio can be detected fromthe data in Table 1 ; however the biaxially drawn films are much denser than the uniaxiallydrawn ones. The densities of the latter appear to be related to the date of manufacture,which may be explained by admitting that variations in processing conditions leading to dif—ferences in thermal history will have affected the final film densities.
Adopting the usual two—phase model and assuming constant, orientation—independent densitiesfor the crystalline and non—crystalline phases,dx and dame respectively, the volume fractionof crystalline phase, Vx 5 given by :
v (d—d ) / (d — d ) (1)x am x am
if d is the film density. Estimated crystallinity values deduced from Eq. (1) by assumingd = 936 and d = 853 kg/rn3 are given in Table 1.x am
Taking account of the spread in density values measured by different participants and of theerror associated with the adopted value for dam in particular, the estimated crystallinitiesindicated in Table 1 may possibly be wrong by at least 5 %.
Participants 3 and 6 measured the total heat of fusion by means of Differential Scanning Ca-lorimetry and calculated the weight fraction of crystallinity, wx = vx dx/d• The crystalli—nity values calculated from the D.S.C. results of Participant 3, by assuming a value of 35cal/g (Ref. 8) for the heat of fusion of isotactic polypropylene crystals, are also givenin Table 1 and appear to be in good agreement with those calculated from density.
Other methods liable to provide information on the amount of crystallinity, in particularInfra—red adsorption and X—ray diffraction, have been examined in 'some detail by severalparticipants but the results obtained sofar did not lead to conclusive evidence concerningthe general applicability of these methods in the case of oriented polypropylene films.
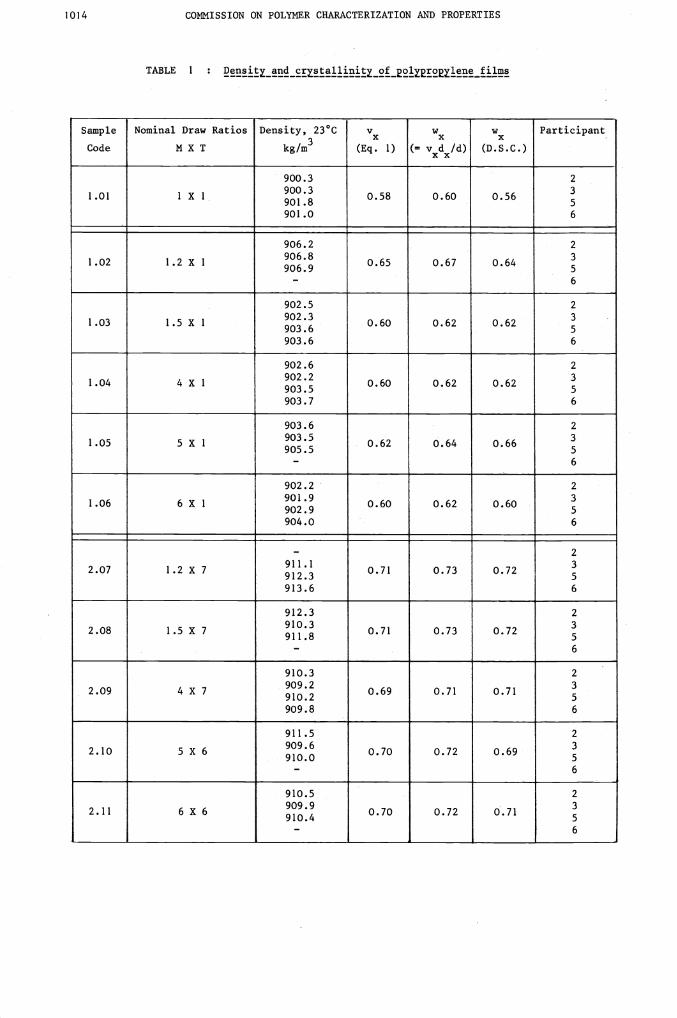
It is well—known that the general relationship between average refractive index and density,given by the Lorentz—Lorenz theory, is also valid in afirst approximation for anisotropicpolymers, irrespective of the degree of orientation. In the very limited range of densitiesusually encountered in the case of polymers, the Lorentz—Lorenz equation may be replaced bya simple linear relationship . Two slightly different empirical relationships of this kindhave been reported for oriented polypropylene films (Ref s.9,1O) and are compared in Fig. 1with the results obtained by Participants 2 and 6 who measured the principal refractive in-dices at the surface of the films. The average refractive index n is equal to
+ nT + nN) /3 (2)
'where mM is the refractive index in the machine direction, nT the refractive index in thetransverse direction, and nN the refractive index in the direction normal to the film plane.
The expe-dmental technique used was similar to the method described in Ref s. 9 and 10 exceptfor the fact that analysis of the refracted plane polarized light was based on a criticalangle determination using an ABBE refractometer with a single prism. Since the light raysenter and leave the film at the same face the refractive indices measured are representativeof a surface layer of undefined depth. As shown in Table 2 the corresponding refractive in-dices on both surfaces of the biaxially oriented films are identical, but in the case of theuniaxially oriented films a systematic difference exists, resulting in a lower average re-fractive index in the surface having been in contact with the chill—roll and, consequently,more rapidly cooled.
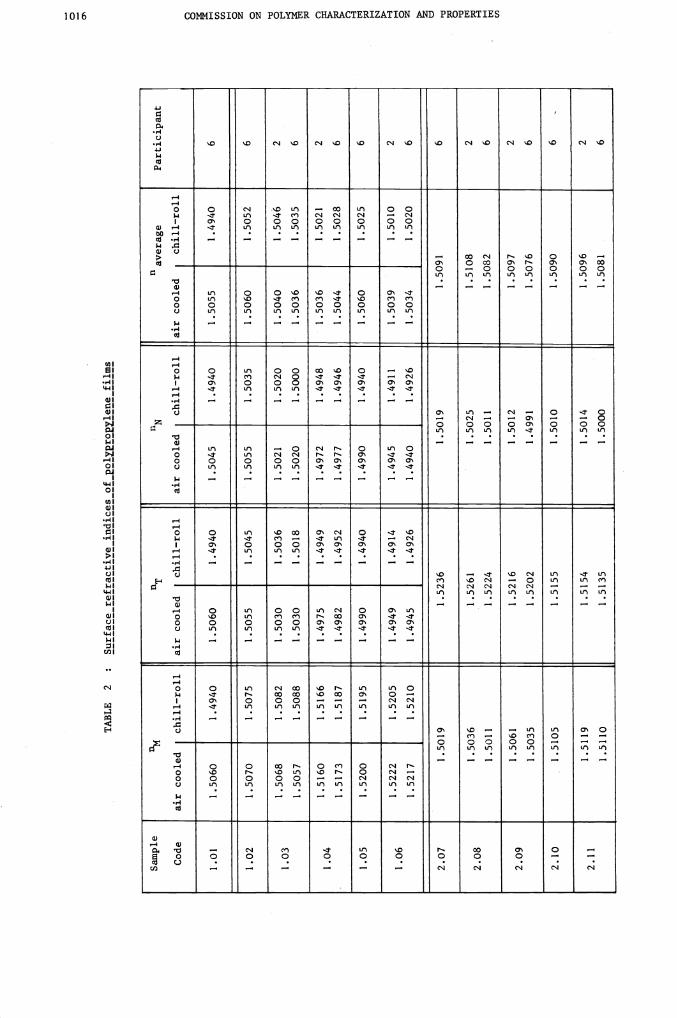
TABLE 2
:
Surface refractive indices of polypropylene films
Sample
Code
air cooled
chill—roll
n T
air cooled
chill—roll
n N
air cooled
chill—roll
n average
air cooled
chill—roll
. P
artic
ipan
t
1.5060
1.4940
1.5060
1.4940
1.5045
1.4940
1.5055
1.4940
6
1.5070
1.5075
1.5055
1.5045
1.5055
1.5035
1.5060
1.5052
6
1.5068
1.5057
1.5082
1.5088
1.5030
1.5030
1.5036
1.5018
1.5021
1.5020
1.5020
1.5000
1.5040
1.5036
1.5046
1.5035
2
6
1.5160
1.5173
1.5166
1.5187
1.4975
1.4982
1.4949
1.4952
1.4972
1.4977
1.4948
1.4946
1.5036
1.5044
1.5021
1.5028
2
6
1.5200
1.5195
1.4990
1.4940
1.4990
1.4940
1.5060
1.5025
6
1.5222
1.5217
1.5205
1.5210
1.4949
1.4945
1.4914
1.4926
1.4945
1.4940
1.4911
1.4926
1.5039
1.5034
1.5010
1.5020
2
6
1.5019
1.5236
1.5019
1.5091
6
1.5036
1.5011
1.5261
1.5224
1.5025
1.5011
1.5108
1.5082
2
6
1.5061
1.5035
1.5216
1.5202
1.5012
1.4991
1.5097
1.5076
2
6
1.5105
1.5155
1.5010
1.5090
6
1.5119
1.5110
1.5154
1.5135
1.5014
1.5000
1.5096
1.5081
2 6
0 a'

1.51( n
905 910 915
Fig. 1 Average refractive index as a function of density (Participants 2 and 6)
The experimental scatter in the data of Fig. 1 does not allow us to distinguish between thetwo proposed empirical relationships (Ref s. 9, 10) which both may be used for calculatingdensity from measured average refractive index. Refractive index measurements by means ofthe method employed by Participants 2 and 6 also allow the calculation of surface birefrin—gence values which may be compared with directly determined bulk birefringence as shown inthe next section.
Bulk birefringence values in the plane of the film i.e. n.M — T' were determined with theaid of customary compensator methods by five participants. Moreover, Participants 1, 2 and4 also determined the other components of the bulk birefringence, tiM — tiN or nT—n, carryingout measurements as a function of angle of inclination of the film with respect o the light
beam, followed by an appropriate extrapolation (Ref.11). Finally, Participant 4 determinedbulk refractive index values in the plane of the film, N and nT, for some of the samples.
The bulk birefringence values obtained by these methods are compared in Table 3 with thesurface birefringence calculated from the surface refractive indices measured by Partici-pants 2 and 6.
In the uniaxially drawn films surface birefringence values are highest at the most rapidlycooled interface as expected but the absolute difference between two faces of the same filmis relatively small and only slightly higher than the difference observed between values ob-tained in different laboratories. The largest difference observed is in the order of 5.10g.Bulk birefringence values are intermediate between the surface values in general and theresults obtained in different laboratories are in fair agreement, the largest deviation ob-served being less than 4.1O.
In the biaxially drawn films surface birefringence is the same at both faces of a film andseems to be slightly lower than the bulk birefringence (although the differences are hardlysignificant with regard to the experimental error and the differences observed between dif-ferent laboratories).
The deviation from "perfect transverse isotropy" (nT =nN) in the uniaxially drawn films is
not negligible, but decreases with increasing draw ratio ; in the case of low draw ratios(films 1.02 and 1.03) the fraction —
nN)/(nM— n ) amounts to 0.2 — 0.25 but for the
highest draw ratio (film 1.06) this fraction is smal'er than 0.1. The strongly unbalancedbiaxially drawn films 2.07 and 2.08 show only small deviations from isotropy perpendicularto the direction of highest draw (TD), similar in magnitude to the deviations found in theuniaxially drawn films of highest draw ratio.
Structure and properties of polypropylene films 1017
1o
0
1.5O
I Afl900
d (kg/rn3)
5 - SURFACE AND BULK BIREFRINGENCE
PAAC 53:5 - H

3 A — U
niax
ially
irawn fi
lms
TABLE 3 :
Sample
Code
3
(riM
-
.
10
bulk
surface
air
chill—roll
3
—
. 10
bulk
surface
air
chill—roll
3
—
. 10
bulk
surface
air
chill—roll
Participant
1.01
0.6
0.5
0.5
0
0
1.2
1.5
0
0.7
1.5
0
1 3 6
1.02
2.2
2.1
2.2
1.5
3.0
2.9
1.5
4.0
0.7
0
1.0
1 3 6
1.03
4.0
3.9
4.2
5.0
3.7
2.7
4.6
7.0
5.0
5.2
4.6
3.7
6.2
8.8
0.9
1.3
0.9
1.0
1.6
1.8
1 2 3 6
1.04
18.8
18.6
20.5
21.5
18.5
19.1
21.7
23.5
19.5
20.6
18.8
19.6
21.8
24.1
0.8
2.0
1.9
0.3
0.5
0.1
0.6
1 2
3 4 6
1.05
1.06
20.9
23.7
25.6
24.6
27.3
27.0
21.0
27.3
25.5
29.0
20.3
26.5
26.8
21.0
27.7
25.5
29.3
— 0.
6
0.9
2.2
0
0.4
0
0.3
1
3 6
1 2
3
4
6
27.2
28.4
27.7
28.4
0.5
0
C
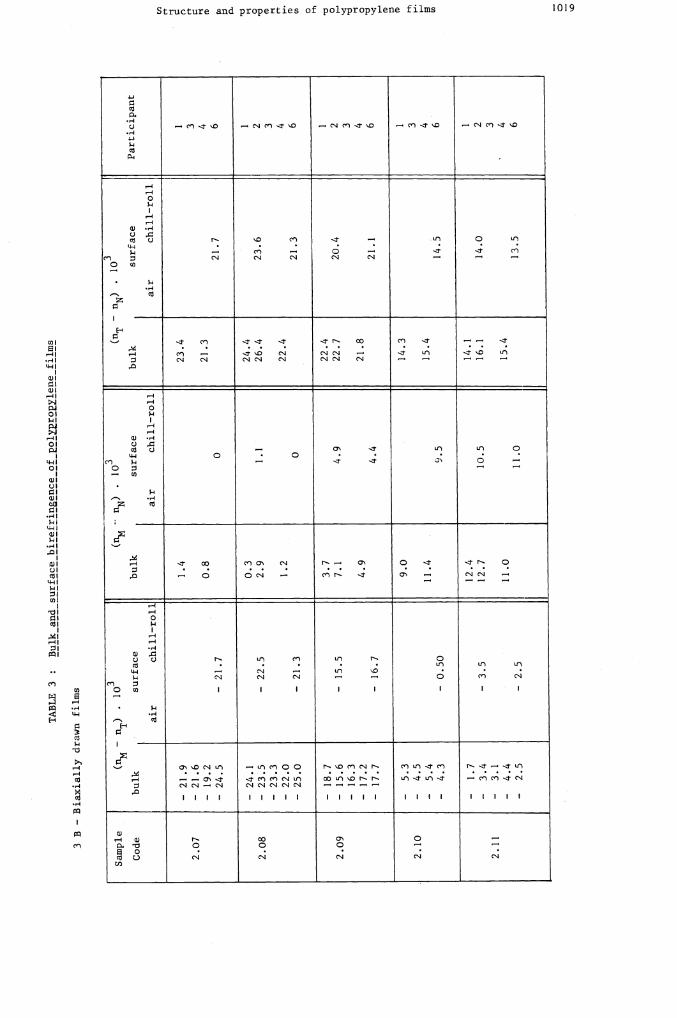
TABLE 3
:
Bulk and surf ace birefrinene_o
3 B - B
iaxi
ally
drawn films 3
(riM
- nT
) .
10
bulk
surface
air
chill—rol
3
(tiM
--
nN)
.
10
bulk
surface
air
chill—roll
- 10
bulk
surface
air
chill—roll
Participant
— 21
.9
—
21.6
—
19.2
—
24.5
•
— 21
.7
1.4
0.8
0
23.4
21.3
21.7
1 3 4 6
— 24
.1
—
23.5
—
23.3
— 22
.0
— 25
.0
— 22
.5
— 2
1.3
0.3
2.9
1.2
1.1
0
24.4
26.4
22.4
23.6
21.3
1 2 3
4
6
- 18
.7
—
15.6
—
16.3
—
17.2
—
17.7
— 15
.5
—
16.7
3.7
7.1
4.9
4.9
4.4
22.4
22.7
21.8
20.4
21.1
1 2
3
4
6
—
5.3
-
4.5
—
5.4
—
4.3
—
1.7
—
3.4
-
3.1
—
4.4
—
2.5
— 0.
50
—
3.5
9.0
11.4
12.4
12.7
11.0
9.5
10.5
14.3
15.4
14.1
16.1
15.4
14.5
14.0
1 3
4
6
1 2 3 4 6
— 2.
5 11.0
13.5
c/i
C)
CD
a a a-
0 0 C
D
Cl) 0 0 0 a CD 8 C
l) C
1020 CONMISSION ON POLYMER CHARACTERIZATION AND PROPERTIES
Finally, the least unbalanced biaxially drawn film 2.11 is still significantly anisotropic inthe film plane, the value of nT —
nM amounting to 20 % of the birefringence nT —
6 - ORIENTATION AND BIREFRINGENCE IN THE CRYSTALLINE PHASE
The measured total bulk birefringence in an oriented semi—crystalline polymer film may be con-sidered as the sum of various contributions as defined by the following well—known expression
(Ref. 12).
=vx. x n + (l-v). Aamfl + AF (2)
where the first two terms on the right—hand side represent the contributions of the crystal-line and non—crystalline phases, respectively, and the last term the contribution of formbirefringence AF which is usually assumed to be negligibly small.
The crystalline phase birefringence n is related to the principal refractive indices of thecrystal as well as to the average crystal orientation, as follows
=(nM-nT) [(nc_na) cMcT + (nb_na)
bMfbT)]
= (-nN) =[c_na) cMcN + (nb_na)
bMfbN)](3)
Ax nTN = (nT-nN)X=
[(nc_na)cTcN + (nb_na)
TFbN]
na, rib and nc are the principal refractive indices along three orthogonal directions in thecrystal and f stands for the so—called Hermans orientation function
cM =(3cos2 0cM_1)/2
=
(3cos2 01)12etc...
where is the angle between the crystallographic c—axis and the M—direction, 0bM theangle between the b—axis and the M—direction, etc. The orientation, function is equal to 0in the case of random orientation, equal to 1 for perfect axial orientation and equal to— 0.5 if the crystal axis is oriented perpendicular to the reference film coordinate.
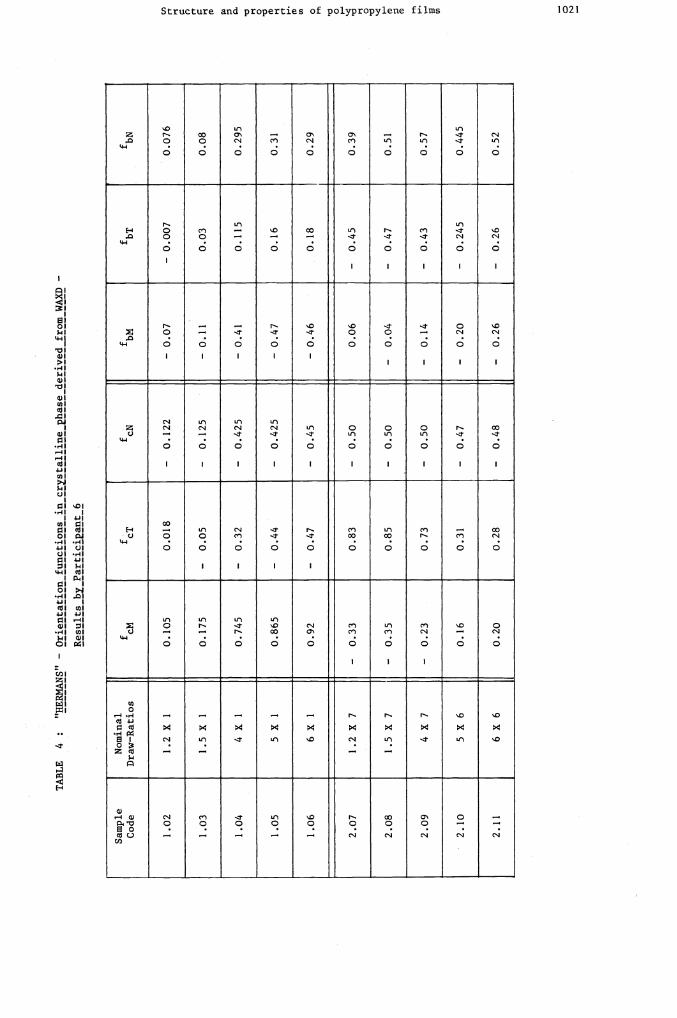
Equations similar to Eq. (3) have already been published in 1958 by R.S. Stein (13), butsince then apparently only applied to the particular case of uniaxial orientation. In orderto calculate the crystalline phase contribution to the total birefringence by means of Eq.(3), Participant 6 has determined the various orientation functions for the crystallographicaxes by Wide—Angle X—Ray Diffraction (Ref s. 14, 15) and his results are given in Table 4.
Directly measured values for the principal refractive indices of the monoclinic polypropylenecrystal do not exist but various estimates obtained by different methods have been publishedand discussed (Ref. 16). In general the crystal is assumed to exhibit uniaxial symmetry be-cause of its helical structure, i.e. na= nb if the c—axis of the unit cell is taken parallelto the helical axis of the molecule. Eq. () may, consequently, be simplified as follows
A r1NT = Mt1T)x = . (nc_ %) cM - cTx
Ax nNN
=(nM-nN)
=(nc
-nb) cM — cNx (4)
2Ax nTN
=(nT-nN)
=(nc
- nb cT - cNx
Sample
Code
Nominal
Draw—Ratios
f cM
f cT
f cN
f bM
f bT
f bN
1.02
1.2 X 1
0.105
0.018
—
0.12
2 —
0.
07
— 0.
007
0.076
1.03
1.5 X 1
0.175
—
0.05
—
0.
125
— 0.
11
0.03
0.08
1.04
4 X 1
0.74
5 —
0.
32
—
0.42
5 —
0.
41
0.115
0.295
1.05
5 X 1
0.865
—
0.44
—
0.
425
— 0.
47
0.16
0.31
1.06
6 X 1
0.92
—
0.47
—
0.
45
— 0.
46
0.18
0.29
2.07
1.2 X 7
—
0.33
0.83
—
0.50
0.06
—
0.45
0.39
2.08
1.5 X 7
—
0.35
0.85
—
0.50
—
0.
04
—
0.47
0.51
2.09
4 X 7
—
0.23
0.73
—
0.50
—
0.
14
—
0.43
0.57
2.10
5 X 6
0.16
0.31
—
0.47
—
0.
20
—
0.24
5 0.445
2.11
6 X 6
0.20
0.28
—
0.48
—
0.
26
—
0.26
0.52
TABLE
4 :
"HERNANS" — Orientation functions in
Results by Participant 6
crystalline phase derived from WAXD —
Cl)
C)
C)
(D 0 0 (D
C)
(D
S 0 0 0 P1 0 (D
(D
frh
Cl) C
1022 CONNISSION ON POLYMER CHARACTERIZATION AND PROPERTIES
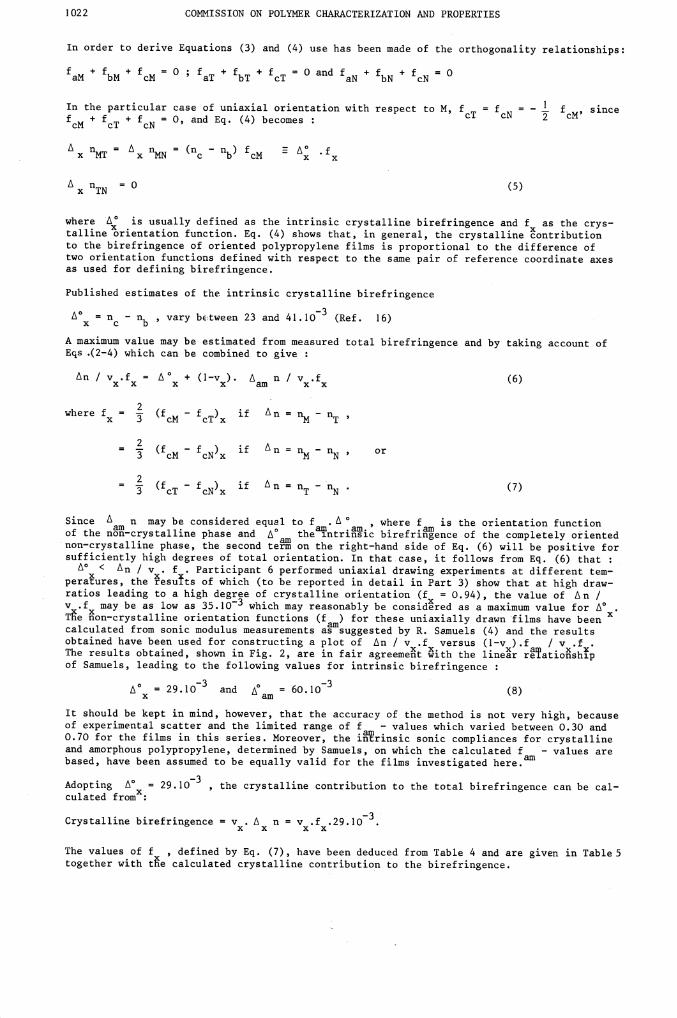
In order to derive Equations (3) and (4) use has been made of the orthogonality relationships:
f +f +f =0f +f +f Oandf +f +f =0aM bM cM aT bT cT aN bN cN
In the particular case of uniaxial orientation with respect to M f = = — f sincecT cN 2 cMf + f + f = 0, and Eq. (4) becomescM cT cN
A nMT = Ax nMN
=(nc
-nb) cM A;
xTN =0 (5)
where A; is usually defined as the intrinsic crystalline birefringence and f as the crys-talline orientation function. Eq. (4) shows that, in general, the crystalline contributionto the birefringence of oriented polypropylene films is proportional to the difference oftwo orientation functions defined with respect to the same pair of reference coordinate axesas used for defining birefringence.
Published estimates of the intrinsic crystalline birefringence
A° =nc
—n.0 , vary bEtween 23 and 41.1o (Ref. 16)
A maximum value may be estimated from measured total birefringence and by taking account ofEqs .(2—4) which can be combined to give
An / v .f = A° + (1—v ). A n / v ,f (6)x x x x am x x
where f = (f — f ) if An = n. — nx 3 cM cTx n T
=3 cMcNx if Ann_nN, or
=3 cTcNx if An=nT_nN. (7)
Since A n may be considered equal to f . A ° , where f is the orientation functionof the n—crystalline phase and A°am the9ntriic birefrience of the completely orientednon—crystalline phase, the second term on the right—hand side of Eq. (6) will be positive forsufficiently high degrees of total orientation. In that case, it follows from Eq. (6) thatA° < An / v . f . Participant 6 performed uniaxial drawing experiments at different tem—
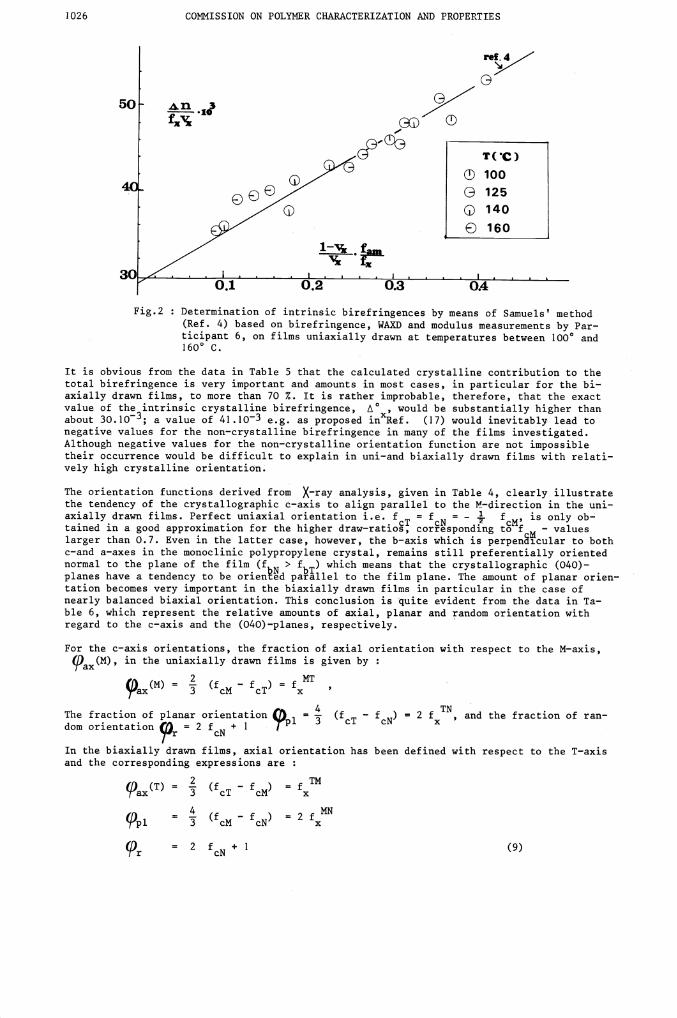
peraures, the esuts of which (to be reported in detail in Part 3) show that at high draw—ratios leading to a high degree of crystalline orientation = 0.94), the value of An /v .f may be as low as 35.1O which may reasonably be considered as a maximum value for A°T?e on—crystalline orientation functions for these uniaxially drawn films have been xcalculated from sonic modulus measurements as suggested by R. Samuels (4) and the resultsobtained have been used for constructing a plot of An / v .f versus (1—v ).f / vThe results obtained, shown in Fig. 2, are in fair agreeme?k *ith the liner re9atioshpof Samuels, leading to the following values for intrinsic birefringence
A°x = 29.1O and A°am = 6O.1o (8)
It should be kept in mind, however, that the accuracy of the method is not very high, becauseof experimental scatter and the limited range of f — values which varied between 0.30 and0.70 for the films in this series. Moreover, the inrinsic sonic compliances for crystallineand amorphous polypropylene, determined by Samuels, on which the calculated — values arebased, have been assumed to be equally valid for the films investigated here.
Adopting A° = 29.1O , the crystalline contribution to the total birefringence can be cal-culated fromx:
Crystalline birefringence = vx. Ax n = v.f.29.1O3.
The values of f , defined by Eq. (7), have been deduced from Table 4 and are given in Table 5together with te calculated crystalline contribution to the birefringence.

TABLE 5 :
5 A — U
niax
ially
drawn films
Sample
Code
Total n
X 1O3
f
(Eq.7)
v
n 3
(1—v )
n
f am
f
v
1.02
NN
MT
2.9
2.2
0.15
0.06
2.8
1.1
0.1
1.1
0.005
0.05
0.10
0.06
0.65
1.03
A
5.1
4.0
0.20
0.15
3.5
2.6
1.6
1.4
0.06
0.06
0.14
0.11
0.60
1.04
A
Ln
20
19
0.78
0.71
13.6
12.4
6.4
6.6
0.27
0.27
0.58
0.53
0.60
1.05
LI1M
N
MT
22
22
0.86
0.87
15.4
15.6
6.6
6.4
0.29
0.28
0.64
0.64
0.62
1.06
AnN N
AnMT
27
27
0.92
0.92
16
16
11
11
0.46
0.46
0.74
0.74
0.60
rt
CD
0 CD
f-C
CD
Cl) 0 0 0 CD
CD
Cl)
C

TABLE 5 Bifenaoei
5 B —
Bia
xial
ly drawn films
in crystalline and non crystalline phases of polypropylene films
C
Sam
ple
Cod
e
Tot
al n
3
X 10
f x
(Eq. 7)
v
Li n
xx
X 10
(1—v )
n
x
am
3
X 1
0
f am
f av
(Eq. 14)
v x
2.07
LirIMN
LnTN
LnTM
1.0
23
22
0.11
0.88
0.77
2.3
18
15.8
— 1.
3
5.0
6.2
— 0.
075
0.29
0.36
0.056
0.71
0.65
0.71
2.08
LnM
N
LnT
N
LinT11
1.0
25
24
0.10
0.90
0.80
2.0
18.5
16.5
- 1.
0
6.5
7.5
- 0.
06
0.37
0.43
0.054
0.75
0.69
0.71
2.09
A4
nTN
LinT
5.0
22
17
0.18
0.82
0.64
3.6
16.4
12.8
1.4
5.6
4.2
0.075
0.30
0.225
0.15
0.66
0.51
0.69
.1..

5 B —
Bia
xial
ly drawn films
(contd.)
Sample
Code
Total
Ln
X 1O3
f x
(Eq. 7)
v
n
xx
X 1O
(1—v ) j
n x
am
X 1O
f am
f av
(Eq. 14)
v x
2.10
Ln
tflTN
TM
9.5
14.5
5.0
0.42
0.52
0.10
8.5
10.5
2.0
1.0
4.0
3.0
0.055
0.22
0.17
0.31
0.43
0.12
0.70
2.11
Ln
'TN
&DTM
12
15
3.0
0.45
0.50
0.05
9.0
10.0
1.0
3.0
5.0
2.0
0.17
0.28
0.11
0.36
0.43
0.07
0.70
Cl)
C) 1 C
D 0 C
D
CD
C
l) 0 0 0 CD
CD
Cl) 0 Ui
1026 CONMISSION ON POLYMER CHARACTERIZATION AND PROPERTIES
Fig.2 Determination of intrinsic birefringences by means of Samuels' method(Ref. 4) based on birefringence, WAXD and modulus measurements by Par-ticipant 6, on films uniaxially drawn at temperatures between 1000 and1600 C.
It is obvious from the data in Table 5 that the calculated crystalline contribution to thetotal birefringence is very important and amounts in most cases, in particular for the bi-axially drawn films, to more than 70 %. It is rather improbable, therefore, that the exactvalue of the intrinsic crystalline birefringence, i°, would be substantially higher thanabout 3O.1O; a value of 41.1O e.g. as proposed in Ref. (17) would inevitably lead tonegative values for the non—crystalline birefringence in many of the films investigated.Although negative values for the non—crystalline orientation function are not impossibletheir occurrence would be difficult to explain in uni—and biaxially drawn films with relati-
vely high crystalline orientation.
The orientation functions derived from X—ray analysis, given in Table 4, clearly illustratethe tendency of the crystallographic c—axis to align parallel to the M—direction in the uni—axially drawn films. Perfect uniaxial orientation i.e. cT =
N= - cM' is only ob-
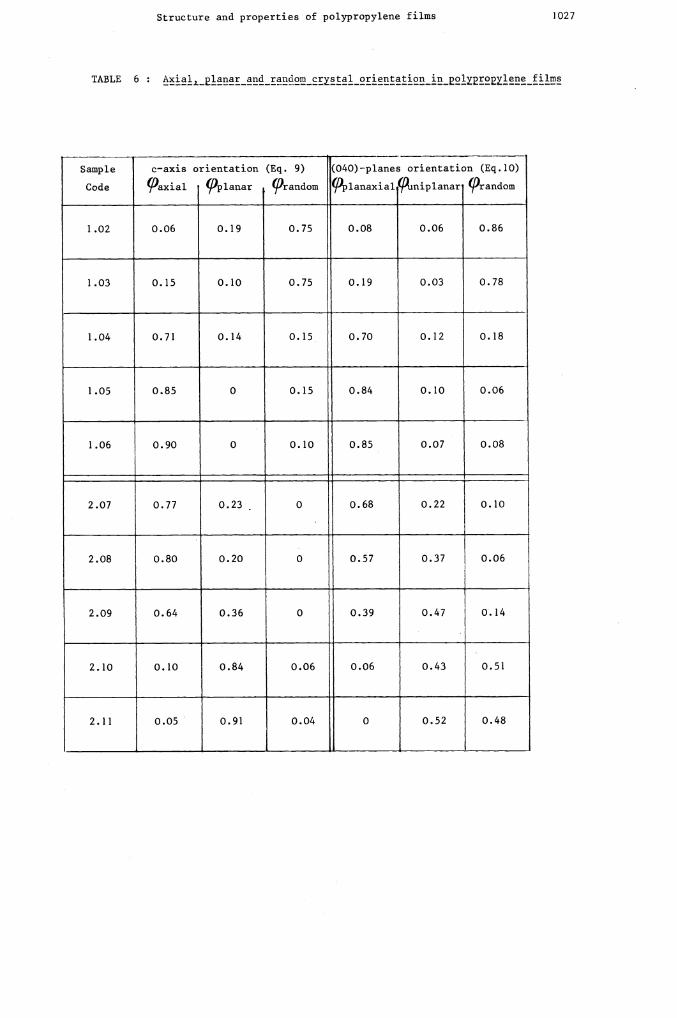
tained in a good approximation for the higher draw—ratios, coresponding to f hI — valueslarger than 0.7. Even in the latter case, however, the b—axis which is perpenicular to bothc—and a—axes in the monoclinic polypropylene crystal, remains still preferentially orientednormal to the plane of the film > bT which means that the crystallographic (040)—planes have a tendency to be oriented parallel to the film plane. The amount of planar orien-tation becomes very important in the biaxially drawn films in particular in the case ofnearly balanced biaxial orientation. This conclusion is quite evident from the data in Ta-ble 6, which represent the relative amounts of axial, planar and random orientation withregard to the c—axis and the (040)—planes, respectively.
For the c—axis orientations, the fraction of axial orientation with respect to the M—axis,in the uniaxially drawn films is given by
9ax(M) = 4 cM — cT =fxMT
The fraction of planar orientation (1 = (f — f ) = 2 f TN, and the fraction of ran-dom orientation (I) = 2 f + 1
3 cT cN x
rr cN
In the biaxially drawn films, axial orientation has been defined with respect to the T—axisand the corresponding expressions are
2(/ (T) = —
ax 3 cT — cM =fxTM
= cM — cN = 2 f MN
= 2 f +1 (9)r cN
50
D 100a 125GD 140
e 160
T (
Structure and properties of polypropylene films 1027
TABLE 6 :
Sample
Code
c—axis orientation (Eq. 9)
axia1 9p1anar (/random
(040)-planes orientation (Eq.10)
pianaxiaiq4tnipianar 9random
1.02 0.06 0.19 0.75 0.08 0.06 0.86
1.03 0.15 0.10 0.75 0.19 0.03 0.78
1.04 0.71 0.14 0.15 0.70 0.12 0.18
1.05 0.85 0 0.15 0.84 0.10 0.06
1.06 0.90 0 0.10 0.85 0.07 0.08
2.07 0.77 0.23 0 0.68 0.22 0.10
2.08
I
0.80 0.20 0 0.57 0.37 0.06
2.09 0.64 0.36 0 0.39 0.47 0.14
2.10 0.10 0.84 0.06 0.06 0.43 0.51
2.11 0.05 0.91 0.04 0 0.52 0.48

1028 COMMISSION ON POLYMER CHARACTERIZATION AND PROPERTIES
Similar expressions can be easily derived for the orientation of the (040)—planes which inthe terminology of Heffelfinger and Burton (18) may be divided in plan—axial, uniplanar andrandom orientation
(I) . (M) 4rplan—axial = : bT bM
tniplanar = 4 bN bT
random = 2 bM
for the uniaxially drawn films, and
(I) . (T) 4'-'planaxial
= -. bM bT
uniplanar 4 bN bM
random = 2 bT (10)
for the biaxially drawn films.
Equivalent expressions have been derived earlier for the description of crystalline orien—tation in polyethylene (Ref. 19) and polyethylene terephthalate(Ref. 20).
The data of Table 6 confirm thepredominance of uniaxial c—axis orientation in the uniaxiallydrawn films of relatively high draw—ratio and the persistence of a small amount ( < 10 %) ofuniplanar orientation of (040) planes.
Although uniaxial c—axis orientation is still predominant in the highly unbalanced biaxiallydrawn films 2.07 and 2.08, the amount of planar orientation is already quite substantial;in the nearly balanced biaxially drawn film 2.11, about 90 % of the c—axis orientation isplanar whereas uniaxial orientation has practically disappeared. Uniplanar orientation of(040) planes also, is already important in the unbalanced biaxially drawn films and becomesthe unique mode of orientation in the nearly balanced film 2.11. An important fraction ofthe planes remains randomly oriented in the nearly balanced films, reflecting the smallerpreference of the a—axis (compared to the c—axis) to lie in the plane of the film.
The rapid change from axial to planar c—axis orientation when biaxial draw approaches perfectbalance is further illustrated by the curves in Fig. 3, which represent the fractions of axialand planar orientation as a function of the degree of unbalanced draw characterized by the
ratio XT / XM
Further information on the two—phase morphology was obtained by Participants 2 and 5 by meansof Small Angle X—ray Diffraction. A long period of 14 nm was calculated by Participant 5 fromthe SAXD—pattern of the unoriented film 1.01. The diffraction patterns of the uniaxiallydrawn films show pronounced meridional maxima for suffiently large draw—ratios ( X 4),corresponding to a long period spacing of about 17 nm in the draw direction (Fig. 4. Onlyin films 1.02 and 1.05 which have a higher density (due probably to a somewhat higher drawtemperature), the long period is also significantly higher and equal to 20 nm. These valuesare in good agreement with those reported by Balt—Calleja and Peterlin (21) for draw andannealing temperatures between 120 and 140° C. It is remarkable that the long period spacingis practically independent of the crystalline c—axis orientation as determined by WAXD, downto very low values of ( .'0.1) as shown in Fig. 4.
The SAXD pattern of the highly unbalanced biaxially drawn films 2.07 and 2.08 is similar tothat of the uniaxially drawn films but the asymmetry is much weaker, and disappears comple-tely when the state of biaxial orientation becomes more balanced. In the latter case the de-termination of the long period is rather inaccurate, although there seems to be no doubt thatits value ( 40 nm) is larger than in the unbalanced films ( 30 nm), from which it mightbe deduced that with increasing orientation in the M—direction, the average distance between
the crystalline regions, measured in the T—direction, becomes greater (Fig. 4). The much lar—ger Values of the long period spacings in the biaxially drawn films, relative to the uniaxi—ally drawn ones, may be compared to the higher densities and are most probably related tohigher draw temperatures in the case of the biaxially drawn films resulting in larger valuesfor the crystallinity and for the average size of the crystalline regions. Participant 5
also observed that the width of the intensity peaks in general decreases with increasingorientation in the corresponding direction.

bc ATAM
Fig. 3 : Axial and planar c—axis orientation in crystalline phase of biaxiallydrawn polypropylene films as a function of degree of unbalanced draw;
AT and AM are nominal draw—ratios in T— and.M — direction respectively.
—0.4 0 0.4 0.8 1
Fig. 4 Long period spacings in uni—and biaxially drawn films as a function ofcrystal c—axis orientation ; SAXD—measurements by Participants 2 and 5,orientation calculated from WAXD by Participant 6.
?1an.
Structure and properties of polypropylene films 1029
1
0.5
nTax.
.I
I
0
50
40
30
20
10
L(nm)
/iax.CM
1030 COMMISSION ON POLYMER CHARACTERIZATION AND PROPERTIES
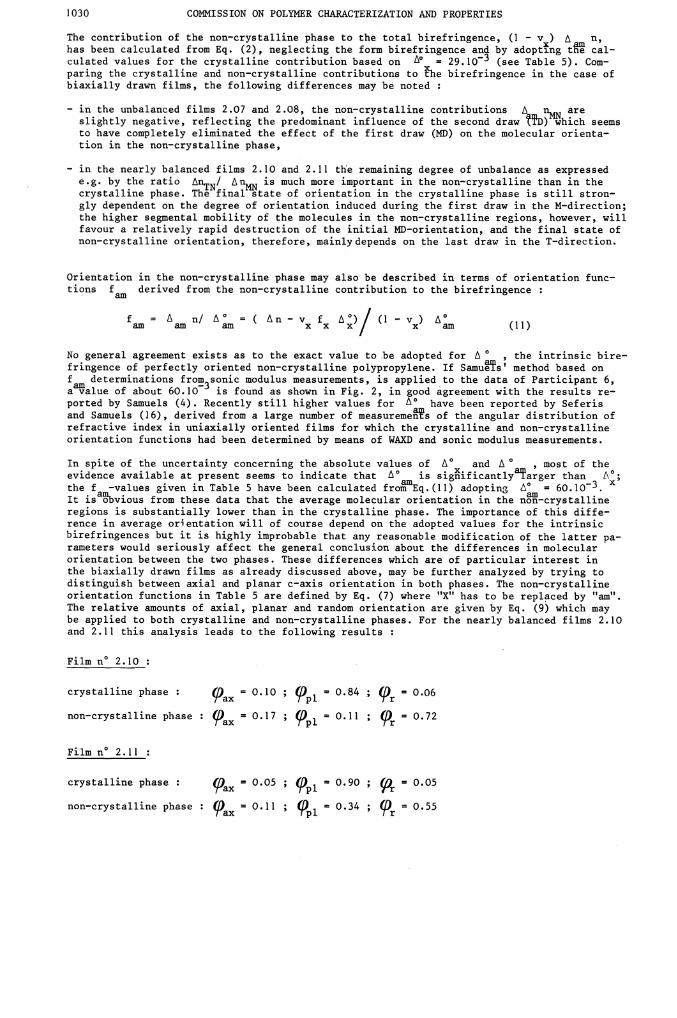
The contribution of the non—crystalline phase to the total birefringence, (1 — v )
has been calculated from Eq. (2), neglecting the form birefringence and by adoptng t cal—culated values for the crystalline contribution based on 1 29.1O (see Table 5). Corn—paring the crystalline and non—crystalline contributions to he birefringence in the case ofbiaxially drawn films, the following differences may be noted
— in the unbalanced films 2.07 and 2.08, the non—crystalline contributions areslightly negative, reflecting the predominant influence of the second draw 'fD) which seemsto have completely eliminated the effect of the first draw (MD) on the molecular orienta—tion in the non—crystalline phase,
— in the nearly balanced films 2.10 and 2.11 the remaining degree of unbalance as expressed
e.g. by the ratio EnTN/ is much more important in the non—crystalline than in thecrystalline phase. The final state of orientation in the crystalline phase is still stron—gly dependent on the degree of orientation induced during the first draw in the M—direction;the higher segmental mobility of the molecules in the non—crystalline regions, however, willfavour a relatively rapid destruction of the initial MD—orientation, and the final state ofnon—crystalline orientation, therefore, mainly depends on the last draw in the T—direction.
Orientation in the non—crystalline phase may also be described in terms of orientation func-tions f derived from the non—crystalline contribution to the birefringence
am
f = n/ ° ( sn-v f O)/(1) oam am am x x x / x am (11)
No general agreement exists as to the exact value to be adopted for , the intrinsic bire—fringence of perfectly oriented non—crystalline polypropylene. If SamuPs' method based onam determinations frorn3sonic modulus measurements, is applied to the data of Participant 6,a value of about 60.10 is found as shown in Fig. 2, in good agreement with the results re-ported by Samuels (4). Recently still higher values for LO have been reported by Seferisand Samuels (16), derived from a large number of measuremes of the angular distribution ofrefractive index in uniaxially oriented films for which the crystalline and non—crystallineorientation functions had been determined by means of WAXD and sonic modulus measurements.
In spite of the uncertainty concerning the absolute values of i° and i , most of theevidence available at present seems to indicate that t° is sig?ificantly9arger than A°;am . o —3 xthe f —values given in Table 5 have been calculated from Eq.(11) adopting = 60.10
It isbvious from these data that the average molecular orientation in the n—crystallineregions is substantially lower than in the crystalline phase. The importance of this diff e—rence in average orientation will of course depend on the adopted values for the intrinsic
birefringences but it is highly improbable that any reasonable modification of the latter pa-rameters would seriously affect the general conclusion about the differences in molecularorientation between the two phases. These differences which are of particular interest in
the biaxially drawn films as already discussed above, may be further analyzed by trying todistinguish between axial and planar c—axis orientation in both phases. The non—crystallineorientation functions in Table 5 are defined by Eq. (7) where "X" has to be replaced by "am".The relative amounts of axial, planar and random orientation are given by Eq. (9) which maybe applied to both crystalline and non—crystalline phases. For the nearly balanced films 2.10and 2.11 this analysis leads to the following results
Film n° 2.10
crystalline phase : (I) = 0.10 ; 0 0.84 ; (L = 0.06Tax Tpl Tr
non—crystalline phase : 0 = 0.17 ; 0 0.11 ; 0 = 0.72rax rpl Tr
Film n° 2.11
crystalline phase : (I = 0.05 ; (I) = 0.90 . (II = 0.05rax ypl yr
non—crystalline phase : 0 = 0.11 ; (0 = 0.34 (0 = 0.55Tax ipl ir
Structure and properties of polypropylene films • 1031
The data obtained clearly bring out the importance of randomly oriented molecules in thenon—crystalline regions, in contrast with the crystalline phase where the amount of randomorientation is negligible. The absolutes values concerning the non—crystalline phase dependof course ont he absolute value adopted for .L° , but the latter parameter does not affect,as easily shown, the calculated ratio of plan—to—axial orientation in the non—crystallineregions. This ratio, (p 1 " a ' ]S much smaller than the corresponding ratio for the crys—talline phase and even maller han one in the case of film 2.10.Apreference for planarorientation in the non—crystalline regions exists, however, in film 2.11 ( p/ p xin spite of the still important difference in famahes with respect to the f — an T direc—tions (see Table 5)
Although a still larger preference for planar orientation may be anticipated in perfectlybalanced biaxially drawn films, it is not expected that planar orientation in the non—crys-talline regions will ever attain the same importance as in the crystalline phase.
8 - MOLECULAR ORIENTATION AND INFRA-RED DICHROISM
Infra—red dichroic ratios for different absorption bands were determined by four partici-pants. Although, in general, two independent dichroic ratios have to be known for a fulldescription of the dichroic behaviour of an absorption band, only one ratio as been measuredin this study, DMT for uniaxially drawn films or its inverse, DTM in the case of biaxiallydrawn films
=
if AM is the absorbance of radiation polarized parallel to the M—direction and AT the absor—bance of radiation with its plane of polarization parallel to the T—direction.
All four participants explored several absorption bands, the maximum number being eleven. Ingeneral the results obtained with different spectrometers were in fair agreement ; one par-ticipant who found systematically weaker dichroism than the other participants, using a con—vential instrument, obtained better agreement by performing measurements with a FourierTransform I—R spectrometer which seems to indicate that the results may be affected by the
instrument's resolving power.
I
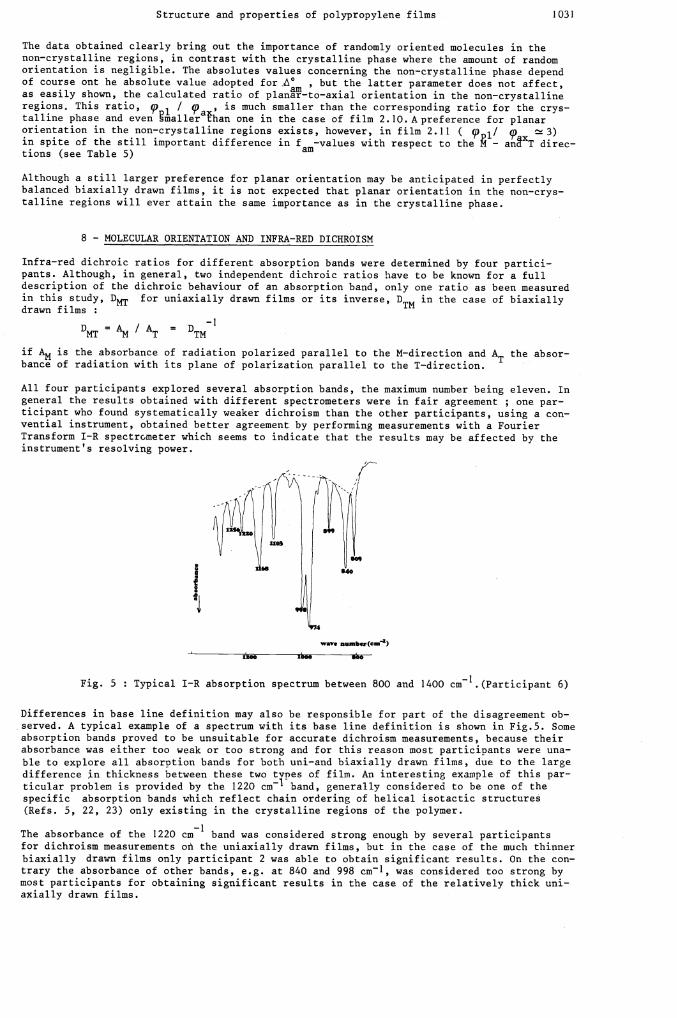
Fig. 5 : Typical I—R absorption spectrum between 800 and 1400 cm1.(Participant 6)
Differences in base line definition may also be responsible for part of the disagreement ob—served. A typical example of a spectrum with its base line definition is shown in Fig.5. Someabsorption bands proved to be unsuitable for accurate dichroism measurements, because theirabsorbance was either too weak or too strong and for this reason most participants were una-ble to explore all absorption bands for both uni—and biaxially drawn films, due to the largedifference in thickness between these two types of film. An interesting example of this par-ticular problem is provided by the 1220 cm band, generally considered to be one of thespecific absorption bands which reflect chain ordering of helical isotactic structures
(Ref s. 5, 22, 23) only existing in the crystalline regions of the polymer.
The absorbance of the 1220 cm' band was considered strong enough by several participantsfor dichroism measurements o the uniaxially drawn films, but in the case of the much thinnerbiaxially drawn films only participant 2 was able to obtain significant results. On the con-trary the absorbance of other bands, e.g. at 840 and 998 cm', was considered too strong bymost participants for obtaining significant results in the case of the relatively thick uni—axially drawn films.
wave aumber(cm)
1200 1000 00

1032 COMMISSION ON POLYMER CHARACTERIZATION AND PROPERTIES
Approximate crystalline orientation functions f1 calculated from D.çj mesured for different"crystallinity bands" in uniaxially drawn films ave been plotted versus f cM—values obtainedfrom WAXD in Fig. 6. Some additional data on other films with intermediate fcMvalues, obtai-ned by Participant 6, were also plotted in the same figure. The following expressions havebeen used
IR = 2 (1 — D) / (D + 2) for DMT < 1
= (D — 1) (D + 2) for D > 1 (12)
It is well—known (Refs. 24,25) that Eqs. (12) are only valid for uniaxial orientation if thetransition moment M of the absorbing vibration is either perpendicular or parallel to thepolymer chain axis. For a transition moment angle smaller than 900 (D < 1) or larger than00 (D > 1), use of Eq. (12) should lead to underestimated values for the orientation func-tion. If transition moment vectors form an angle ct with the chain axis and are randomlydistributed with respect to other axes, Eq. (12) should be replaced by a more general rela-
tionship
IR =1(DMT
— 1) / (D + 2)j .[(D
+ 2) / (D —
1)](13)
where D = 2 cot2 c
IR(l0I) ///
ft0.4 0/
//1av
0.2 o.4 0.6 0,8
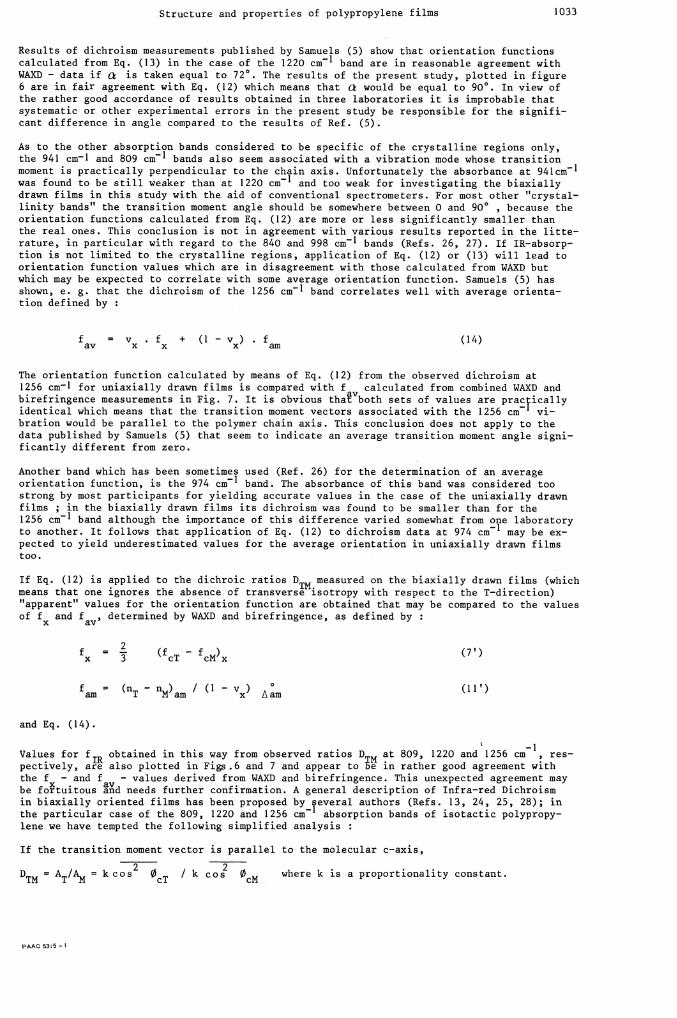
Fig. 6 : Crystalline phase orientation calculated from IR—dichroism (Eq. 12)versus crystal orientation deduced from WAXD.
range of values obtained by Participant 2,5 and 6 on uniaxiallydrawn films at 1220 cm,
O measurements by Participant 6 on films of intermediate orientation(1220 cm—i)
measurements by Participant 2 at 809 cm1
measurements by Participant 5 at 840 and 998 cm1
Z measurements by Participant 2 (1220 and 809 cm1) on biaxially drawnfilms
IR
Fig. 7 : Average orientation calculated from IR—dichroism at 1256 cm1 (Eq. 12)versus average orientation deduced from WAXD and birefringence (Eq. 14).Measurements by Participants 2,5 and 6 on uniaxially drawn films
and on biaxially drawn films (Q)
1
IRAm'
171220809
I LA o.8I 840
0 P9,.
0/
o.2
Structure and properties of polypropylene films 1033
Results of dichroism measurements published by Samuels (5) show that orientation functionscalculated from Eq. (13) in the case of the 1220 cm' band are in reasonable agreement withWAXD — data if is taken equal to 72°. The results of the present study, plotted in figure6 are in fair agreement with Eq. (12) which means that c would be equal to 90°. In view ofthe rather good accordance of results obtained in three laboratories it is improbable thatsystematic or other experimental errors in the present study be responsible for the signifi-cant difference in angle compared to the results of Ref. (5).
As to the other absorption bands considered to be specific of the crystalline regions only,the 941 cml and 809 cm1 bands also seem associated with a vibration mode whose transitionmoment is practically perpendicular to the chain axis. Unfortunately the absorbance at 941cm'was found to be still weaker than at 1220 cm' and too weak for investigating the biaxiallydrawn films in this study with the aid of conventional spectrometers. For most other "crystal—linity bands" the transition moment angle should be somewhere between 0 and 900 , because theorientation functions calculated from Eq. (12) are more or less significantly smaller thanthe real ones. This conclusion is not in agreement with various results reported in the litte—rature, in particular with regard to the 840 and 998 cm' bands (Refs. 26, 27). If IR—absorp—don is not limited to the crystalline regions, application of Eq. (12) or (13) will lead toorientation function values which are in disagreement with those calculated from WAXD butwhich may be expected to correlate with some average orientation function. Samuels (5) hasshown, e. g. that the dichroism of the 1256 cm' band correlates well with average orienta-tion defined by
f = v . f + (1 — v ) . f (14)av x x x am
The orientation function calculated by means of Eq. (12) from the observed dichroism at1256 cm' for uniaxially drawn films is compared with f calculated from combined WAXD andbirefringence measurements in Fig. 7. It is obvious tharboth sets of values are practicallyidentical which means that the transition moment vectors associated with the 1256 cm vi-bration would be parallel to the polymer chain axis. This conclusion does not apply to thedata published by Samuels (5) that seem to indicate an average transition moment angle signi-ficantly different from zero.
Another band which has been sometimes used (Ref. 26) for the determination of an averageorientation function, is the 974 cm' band. The absorbance of this band was considered toostrong by most participants for yielding accurate values in the case of the uniaxially drawnfilms ; in the biaxially drawn films its dichroism was found to be smaller than for the1256 cm' band although the importance of this difference varied somewhat from one laboratoryto another. It follows that application of Eq. (12) to dichroism data at 974 cm' may be ex-pected to yield underestimated values for the average orientation in uniaxially drawn filmstoo.
If Eq. (12) is applied to the dichroic ratios DTM measured on the biaxially drawn films (whichmeans that one ignores the absence of transverse isotropy with respect to the T—direction)"apparent" values for the orientation function are obtained that may be compared to the valuesof f and f , determined by WAXD and birefringence as defined by
x av
=3 cT - cMx (7')
f = (n — n ) / (1 — v )° (11')am T Mam x Lam
and Eq. (14).
Values for f obtained in this way from observed ratios DTM at 809, 1220 and 1256 cm 1, res-pectively, are also plotted in Figs.6 and 7 and appear to e in rather good agreement withthe f — and f — values derived from WAXD and birefringence. This unexpected agreement maybe fotuitous Xd needs further confirmation. A general description of Infra—red Dichroismin biaxially oriented films has been proposed by several authors (Ref s. 13, 24, 25, 28); inthe particular case of the 809, 1220 and 1256 cm' absorption bands of isotactic polypropy-
lene we have tempted the following simplified analysis
If the transition moment vector is parallel to the molecular c—axis,
2 2 . .DTM
=AT/AM
= k cos 0cT / k cos 0cM where k is a proportionality constant.
PAAC 535 -
1034 COMMISSION ON POLYMER CHARACTERIZATION AND PROPERTIES
The average angle between the c—axis and any coordinate axis, Z, is related to the orienta-tion function by
= (3 cos2 0Z — 1) /2 , or
cos2 0cZ = (2 + 1) /3 (15)
It follows that the dichroic ratio in this case is given by
DTM = (2 cT + 1) / (2 cM + 1) (16)
In the case of a transition moment vectorM which on the average is randomly oriented in aplane perpendicular to the molecular c—axis (a reasonable approximation for the crystalli—nity bands at 809 and 1220 cm'), the angle o formed between this vector M and any coor-dinate axis Z is given by
2 cos2 8Z = 1 — cos2 cZ (17)
The dichroic ratio in this case is, therefore, equal to
D = k cos2 êT / k cos2 eM = (1 - cos2 0cT / (1 - cos2 0cM (18)
which after substitution of Eq. (15), leads to
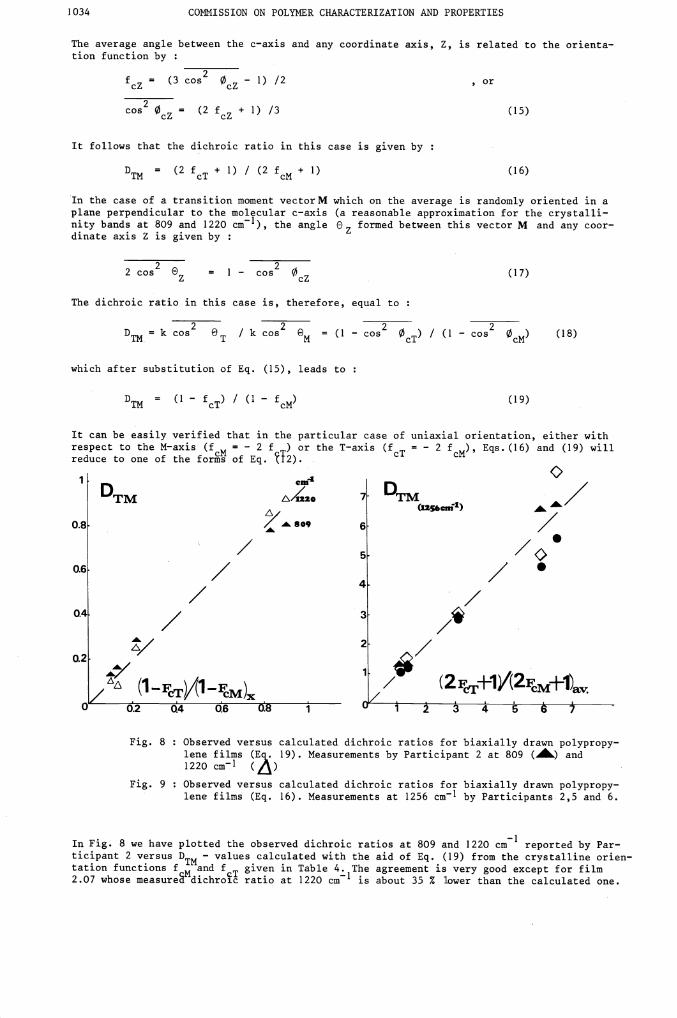
DTM = (1 — cT / ' — cM (19)
It can be easily verified that in the particular case of uniaxial orientation, either withrespect to the M—axis = — 2 or the T—axis cT = — 2 f M' Eqs. (16) and (19) willreduce to one of the forms of Eq. t2). c
1
DTM 7 DTM /(1256cnf1)
0.8 809 6 ,/"/ 5 /•0.6 / / •/0.4 I/ /
2 //
d.2/M)
0:8
Fig. 8 : Observed versus calculated dichroic ratios for biaxially drawn polypropy-lene films (EqS. 19). Measurements by Participant 2 at 809 () and1220 cm' ()
Fig. 9 Observed versus calculated dichroic ratios for biaxially drawn polypropy-lene films (Eq. 16). Measurements at 1256 cm' by Participants 2,5 and 6.
In Fig. 8 we have plotted the observed dichroic ratios at 809 and 1220 cm' reported by Par-ticipant 2 versus DTM — values calculated with the aid of Eq. (19) from the crystalline orien-tation functions f M and T given in Table 4. The agreement is very good except for film2.07 whose measures dichroic ratio at 1220 cm' is about 35 % lower than the calculated one.

Structure and properties of polypropylene films O35
A similar plot for the 1256 cm band is shown in Fig. 9, which compares the dichroic ratiosreported by three participants with values calculated by means of Eq. (16) from the averageorientation functions f T and cM' as defined by Eq. (14). The discrepancies between the ex—perimental results of te three participants are relatively important, in particular forfilms 2.07 and 2.08, but the mean observed values, even in this case, are less than 10 %different from the calculated ones.
We conclude that Eqs. (16) and (19) may be simultaneously used for the determination of twoindependent orientation functions associated with a particular phase , if the dichroic ra—tios for at least one parallel and one perpendicular absorption band are measurable.
9 — DISCUSSION AND CONCLUSIONS :
The results obtained in this collaborative study show that the combination of various expe—rimental techniques may provide quantitative information on the state of molecular orien—tation in both crystalline and non—crystalline phases of uni—anci biaxially drawn polypropy—lene films. Wide Angle X—ray Diffraction is undoubtedly the most appropriate characteriza—tion method if one wants an unambiguous description of average orientation in the crystal—line regions of the polymer. WAXD — analysis proved to be particularly useful in the case ofbiaxially drawn films as it allowed us to distinguish between axial and planar orientationas well as to determine the degree of unbalanced orientation in the plane of the film.
Birefringence data either directly measured or calculated from the measured principal re—fractive indices provide complementary information required for a more general descriptionof molecular orientation in both crystalline and non—crystalline phases. Because of the re—
latively high degree of crystallinity, birefringence in the films investigated here, ismainly determined by orientation in the crystalline phase ; nevertheless the contributionof the non—crystalline regions cannot be neglected. The importance of the latter contribu-tion and the degree of molecular orientation in the non—crystalline regions which is propor-tional to this contribution depend critically on the assumed values for the intrinsic bire—fringence of both phases. The results obtained in the present investigation do not allow anydefinite conclusion about the exact values for these intrinsic parameters, but it may beconcluded that they are not incompatible with the values proposed by Samuels (4). In parti-cular our results seem to indicate that the most probable value for should not be verydifferent from 30 (t 5). i03 and that the value of i5°a must be substantially higher than
x•
Irrespective of the exact values adopted for the intrinsic birefringences, the conclusionthat average molecular orientation in the non—crystalline regions is lower than in the crys-talline phase for both uni—and biaxially drawn films, appears inevitable. This differencebetween the two phases is particularly important in the biaxially drawn films and can befurther qualified in terms of degree of unbalanced orientation, on the one hand and ratioof planar—to—axial c—axis orientation, on the other hand.
The observed differences are not unexpected if one takes account of the higher segmentalmobility in the non—crystalline regions and if one remembers that the biaxially orientedfilms have been obtained by means of a sequential stretching process.
Measurement of principal refractive indices does not only allow a complete description ofbirefringence but may also be used for a rapid determination of density and crystallinity
(by adopting the usual two—phase model).
Small Angle X—ray Diffraction yields values for long period spacings which appear to bestrongly dependent on fabrication conditions (draw and annealing temperatures), but whichdo not seem to be related in a straight forward way to molecular orientation in the crys-talline phase. In biaxially drawn films the long period spacing in the T—direction was evenshown to increase with decreasing molecular orientation with respect to the same direction.
However, the width of the SAXD—intensity peaks also decreased, in general, with increasingorientation (in the M—direction for uniaxially and in the T—direction for biaxially drawnfilms), which tends to indicate that supermolecular structural units (crystal lamellae, mi—crofibrils) align themselves in the direction of highest draw—ratio. The orientation ofthese structural entities may be more or less closely coupled to the orientation of mole-cular chain axes in the crystalline phase (Ref s. 4,29) but the quantitative aspects of sucha relationship have not been further examined in the present investigation.

1036 COMMISSION ON POLYNER CHARACTERIZATION AND PROPERTIES
Finally our study has confirmed that Infra—red Dichroism measurements may provide valuableinformation on molecular orientation in both crystalline and amorphous phases by means of anappropriate choice of absorption bands. In biaxially oriented films the knowledge of two in-dependent dichroic ratios would be required for a complete description of each absorptionband. Two particular examples, corresponding to the limiting case of a perfectly paralleland a perfectly perpendicular absorption band, respectively, have been analyzed showing thatthe dichroic ratio will be determined, in general, by two independent orientation functionsof the molecular chain axis. The agreement between calculated and observed dichroic ratiosfor the 809, 1220 and 1256 cmH bands in the case of biaxially drawn films is rather satis-factory and serves to illustrate the potential possibilities of this experimental techniquefor quantitative characterization of any state of molecular orientation.
As to other methods proposed in the literature for the characterization of molecular orien-
tation in semi—crystalline polymers, two participants in this programme have performed sonicmodulus measurements at room temperature. Their results will be discussed together with theresults of relaxation and dynamic modulus measurements in Part 2 of the present report.
Acknowledgment : The author is much indebted to all participants in the programme as wellas to his colleagues C. Bonnebat and J. Beautemps for helpful collaboration and discussions.

Structure and properties of polypropylene films 1037
REFERENCESPure Appl. Chem. 45, 39 (1976)
Pure Appl. Chem. 50, 1725 (1978)
"Structure and Properties of Oriented Polymers",
Applied Science Publishers, London 1975
"Structured Polymer Properties", Wiley, New—York, 1974
J. Polym. Sci. A. 3, 1741 (1965)
Acta Cryst. 14, 1180 (1961)
Ann. N.Y. Acad. Sci. 279, 78 (1976)
and M. Dole, J. Polym. Sci. 58, 1089 (1962)
J. Appl. Polym. Sci. 12, 903 (1968)
Kurihara and K. Homma, J. Appl. Polym. Sci 11, 1703 (1967)
J. Polym. Sci. 24, 383 (1957)
F.H. Norris, J. Polym. Sci. 21, 381 (1956)
J. Polym. Sci. 31, 327, 335 (1958)
14. B.D. Cullity and A. Freda, J. Appl. Phys. 29, 25 (1958)
15. Z.W. Wilchinsky, J. Appl. Phys. 31, 1969 (1960)
16. J.C. Seferis and R.J. Samuels, Polym. Eng. Sci. 19, 975 (1979)
17. T. Masuko, H. Tanaka and S. Okajima, J. Polym. Sci. A2, 8, 1565 (1970)
18. C.J. Heffelfinger and R.L. Burton, J. Polym. Sci. 47, 289 (1960)
19. W.Heckmann and G. Spilgies, Kolloid Z.Z. Polym. 250, 1150 (1972)
20. A.J. de Vries, C. Bonnebat and J. Beautemps, J. Polym. Sci. Polym. Symp.
58, 109 (1977)
21. F.J. Balt—Calleja and A. Peterlin, Makromol. Chem. 141, 91 (1971)
22. N. Peraldo and M. Farina, Chim. md. (Milan) 42, 1349 (1960)
23. T. Miyazawa, J. Polym. Sci. C 7, 59 (1964)
24. R. Zbinden, "Infrared Spectroscopy of High Polymers", Academic Press,
New—York, 1964
25. B. Jasse and J.L. Koenig, J. Macromol. Sci. — Rev. Macromol. Chem.
C 17 (1), 61, 1979
26. Y. Kobayashi, S. Okajima and A. Narita, J. Appl. Polym. Sci. 11 2515 (1969)
YU. V. Kissin, et al, Vysokomol. soyed A16, 677 (1974)
S. Nomura, H. Kawai, I. Kimura and N. Kagiyana, J. Polym. Sci. A2, 5, 479 (1967)
C.J. Heffelfinger and E.L. Lippert, Jr, J. Appl. Polym. Sci. 15, 2699 (1971)
1. T.T. Jones,
2. W. Retting,
3. I.M. Ward,
4. R.J. Samuels,
5. R.J. Samuels,
6. W. Ruland,
7. L.C.E. Struik
8 R.W. Wilkinson
9. G. Schael
10. 5. Okajima, K.
11. R.S. Stein,
12. R.S. Stein and
13. R.S. Stein,
27
28.
29.