Readout No.42E 14 Feature Article - HORIBA Edition No.42 July 2014 91 Feature Article Technical...
6
91 English Edition No.42 July 2014 Feature Article Application Real-time Fuel Consumption Measurement Using Raw Exhaust Flow Meter and Zirconia AFR Sensor Masanobu AKITA The improvement of fuel efficiency is one of the most important issues in the R&D of powertrain system. The real-time fuel consumption can be determined by AFR (air-to-fuel ratio) and raw exhaust gas flow rate and can be easily obtained without delay time by the in-situ measuring devices which can be installed at the same location. Integrated fuel consumption by this method showed a good correlation with that by the carbon balance method. On the other hand, when a fuel-cut is operated, the difference in transient behavior of the fuel consumption has been also observed due to the response time difference between these two methods. The result suggests that this method has a large potential for measuring the real-time fuel consumption. Introduction Direct measurement of exhaust flow rate had been one of the difficult challenges in exhaust gas analysis and evaluation. Direct measurement of exhaust gas had not been so urgently needed in the past, since the regulating methods, which are used in evaluation of light/medium duty vehicles for conformance to the exhaust gas regulation, adopt the constant volume dilution sampling (CVS) method which requires no exhaust gas flow rate. However, the concern that the intermittent operation of engine while driving would cause errors in measurements by CVS method was raised as hybrid vehicles and idle stop vehicles have become more popular. While improvement in CVS method itself was proposed by intermittently operating the sampling itself in synchronicity with this intermittent operation [1] , direct mass measurement method which is calculated by direct measuring of the exhaust gas flow rate and concentration has been gaining attention especially for research and development purposes. With such circumstances in the background, the authors developed an ultrasonic exhaust flowmeter and proposes to the customers the direct mass measurement in combination with direct exhaust gas analyzer as a measure to improve the engine/vehicle development efficiency. In this study, we propose a real-time fuel consumption measurement using the exhaust gas flow rate and air-to- fuel ratio (AFR) as a measurement application of this exhaust gas flowmeter. This is a new measurement proposed by HORIBA. An advantage of this measurement method is that the fuel consumption can be calculated by only measuring the exhaust gas and AFR the direct mass measurement in combination with direct exhaust gas measurement to improve the engine/vehicle development efficiency. including completed vehicles. In general, fuel consumption is measured by connecting a fuel flowmeter to the fuel piping from the fuel tank to the engine when evaluation is conducted on engine bench [2] . On the other hand, it is difficult to add the fuel flowmeter and a special piping for it to the fuel piping system in tests on completed vehicles. Although it is possible to measure the fuel consumption without any processing of the vehicle when carbon balance method adopting the CVS method is used, it does not deliver sufficient response time for rapid changes in fuel consumption rate under transient states due to its principle. The authors therefore examined “exhaust gas flow rate/AFR method” as a method capable of measuring fuel consumption with response time sufficient for checking the transient behaviors in a simpler method than these conventional methods during automobile research and development. This article reports on its concept, configuration of devices and the results of its evaluation in comparison with the conventional method.
Transcript of Readout No.42E 14 Feature Article - HORIBA Edition No.42 July 2014 91 Feature Article Technical...

91English Edition No.42 July 2014
Technical ReportsFeature Article Application
Real-time Fuel Consumption Measurement Using Raw Exhaust Flow Meter and Zirconia AFR Sensor
Masanobu AKITAThe improvement of fuel efficiency is one of the most important issues in the
R&D of powertrain system. The real-time fuel consumption can be determined
by AFR (air-to-fuel ratio) and raw exhaust gas flow rate and can be easily
obtained without delay time by the in-situ measuring devices which can be
installed at the same location. Integrated fuel consumption by this method
showed a good correlation with that by the carbon balance method. On the other
hand, when a fuel-cut is operated, the difference in transient behavior of the
fuel consumption has been also observed due to the response time difference
between these two methods. The result suggests that this method has a large
potential for measuring the real-time fuel consumption.
Introduction
Direct measurement of exhaust flow rate had been one of the diff icult challenges in exhaust gas analysis and evaluation. Direct measurement of exhaust gas had not been so urgently needed in the past, since the regulating methods, which are used in evaluation of light/medium duty vehicles for conformance to the exhaust gas regulation, adopt the constant volume dilution sampling (CVS) method which requires no exhaust gas f low rate. However, the concern that the intermittent operation of engine while driving would cause errors in measurements by CVS method was raised as hybrid vehicles and idle s top veh icles have become more popula r. W hi le improvement in CVS method itself was proposed by i n t e r m it t ent ly ope r a t i ng t he sa mpl i ng i t sel f i n synchronicity with this intermittent operation [1], direct mass measurement method which is calculated by direct measuring of the exhaust gas flow rate and concentration has been gaining attention especially for research and development purposes. With such circumstances in the background, the authors developed an ultrasonic exhaust flowmeter and proposes to the customers the direct mass measurement in combination with direct exhaust gas analyzer as a measure to improve the engine/vehicle development efficiency.
In this study, we propose a real-time fuel consumption measurement using the exhaust gas flow rate and air-to-
fuel ratio (AFR) as a measurement application of this exhaust gas f lowmeter. This is a new measurement proposed by HORIBA. An advantage of this measurement method is that the fuel consumption can be calculated by only measuring the exhaust gas and AFR the direct mass measurement in combination with direct exhaust gas measurement to improve the engine/vehicle development efficiency. including completed vehicles. In general, fuel consumption is measured by connecting a fuel flowmeter to the fuel piping from the fuel tank to the engine when evaluation is conducted on engine bench[2]. On the other hand, it is difficult to add the fuel flowmeter and a special piping for it to the fuel piping system in tests on completed vehicles. Although it is possible to measure the fuel consumption without any processing of the vehicle when carbon balance method adopting the CVS method is used, it does not deliver sufficient response time for rapid changes in fuel consumption rate under transient states due to its principle. The authors therefore examined “exhaust gas flow rate/AFR method” as a method capable of measuring fuel consumption with response time sufficient for checking the transient behaviors in a simpler method than these convent ional methods du r ing automobile research and development. This article reports on its concept, configuration of devices and the results of its evaluation in comparison with the conventional method.
92 English Edition No.42 July 2014
Feature ArticleApplication
Real-time Fuel Consumption Measurement Using Raw Exhaust Flow Meter and Zirconia AFR Sensor
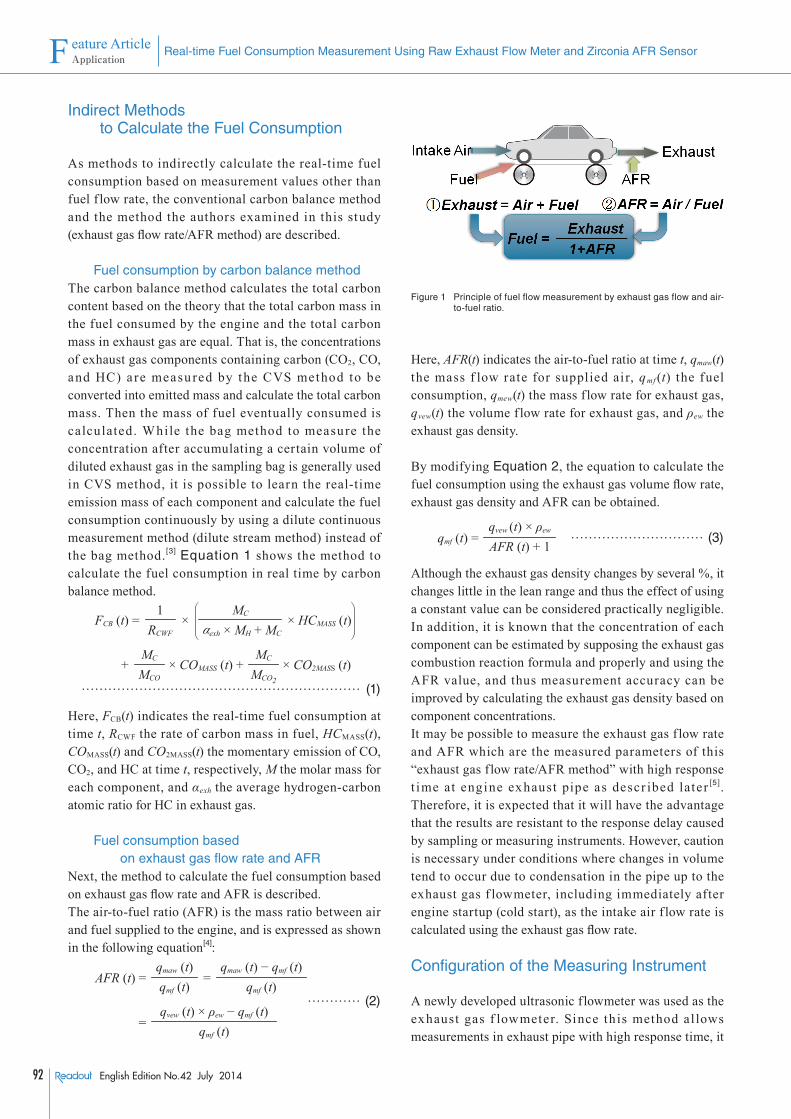
Indirect Methods to Calculate the Fuel Consumption
As methods to indirectly calculate the real-time fuel consumption based on measurement values other than fuel f low rate, the conventional carbon balance method and the method the authors examined in this study (exhaust gas flow rate/AFR method) are described.
Fuel consumption by carbon balance methodThe carbon balance method calculates the total carbon content based on the theory that the total carbon mass in the fuel consumed by the engine and the total carbon mass in exhaust gas are equal. That is, the concentrations of exhaust gas components containing carbon (CO2, CO, and HC) a re measu red by the CVS method to be converted into emitted mass and calculate the total carbon mass. Then the mass of fuel eventually consumed is calculated. While the bag method to measure the concentration after accumulating a certain volume of diluted exhaust gas in the sampling bag is generally used in CVS method, it is possible to learn the real-time emission mass of each component and calculate the fuel consumption continuously by using a dilute continuous measurement method (dilute stream method) instead of the bag method. [3] Equation 1 shows the method to calculate the fuel consumption in real time by carbon balance method.
……………………………………………………… (1)
Here, FCB(t) indicates the real-time fuel consumption at time t, RCWF the rate of carbon mass in fuel, HCMASS(t), COMASS(t) and CO2MASS(t) the momentary emission of CO, CO2, and HC at time t, respectively, M the molar mass for each component, and αexh the average hydrogen-carbon atomic ratio for HC in exhaust gas.
Fuel consumption based on exhaust gas flow rate and AFR
Next, the method to calculate the fuel consumption based on exhaust gas flow rate and AFR is described.The air-to-fuel ratio (AFR) is the mass ratio between air and fuel supplied to the engine, and is expressed as shown in the following equation[4]:
………… (2)
Here, AFR(t) indicates the air-to-fuel ratio at time t, qmaw(t) the mass f low rate for supplied air, qmf (t) the fuel consumption, qmew(t) the mass f low rate for exhaust gas, qvew(t) the volume f low rate for exhaust gas, and ρew the exhaust gas density.
By modifying Equation 2, the equation to calculate the fuel consumption using the exhaust gas volume flow rate, exhaust gas density and AFR can be obtained.
………………………… (3)
Although the exhaust gas density changes by several %, it changes little in the lean range and thus the effect of using a constant value can be considered practically negligible. In addition, it is known that the concentration of each component can be estimated by supposing the exhaust gas combustion reaction formula and properly and using the AFR value, and thus measurement accuracy can be improved by calculating the exhaust gas density based on component concentrations.It may be possible to measure the exhaust gas f low rate and AFR which are the measured parameters of this “exhaust gas flow rate/AFR method” with high response t ime at engine exhaust pipe as descr ibed later [5]. Therefore, it is expected that it will have the advantage that the results are resistant to the response delay caused by sampling or measuring instruments. However, caution is necessary under conditions where changes in volume tend to occur due to condensation in the pipe up to the exhaust gas f lowmeter, including immediately after engine startup (cold start), as the intake air f low rate is calculated using the exhaust gas flow rate.
Configuration of the Measuring Instrument
A newly developed ultrasonic flowmeter was used as the exhaust gas f lowmeter. Since this method al lows measurements in exhaust pipe with high response time, it
FCB (t) = ×
× COMASS (t) + × CO2MASS (t)
× HCMASS (t)1
RCWF
+ MC
MCO
MC
MCO2
MC
exh × MH + MCα
⎝―――⎛
⎠―――⎞
AFR (t) = =qmaw (t)qmf (t)
qmaw (t) − qmf (t)qmf (t)
= qvew (t) × ρew − qmf (t)
qmf (t)
qmf (t) = qvew (t) × ρewAFR (t) + 1
Figure 1 Principle of fuel flow measurement by exhaust gas flow and air-to-fuel ratio.

93English Edition No.42 July 2014
Technical Reports
is optimal for this measurement. In addition, a directly inser ted zirconia (ZrO2) sensor which can also be installed directly in the exhaust pipe was used for AFR measurement. These measuring instruments cause extremely small pressure loss through installation and thus the load on the engine can be neglected. The details are described as follows:
Ultrasonic exhaust gas flowmeterFigure 2 shows the structure of the ultrasonic fl owmeter. The ultrasonic transducers are installed with an angle on opposi t e s ides of t he pipi ng t h roug h wh ich t he measurement subject gas f lows. These transducers comprise mainly of piezoelectric elements and are capable of converting the electric signal into mechanical vibration. The resonance frequency for these elements is designed in an appropriate ultrasonic frequency band. When voltage pulse for resonance f requency is applied on these t ransducers, the ult rasonic pulse is osci l lated by piezoelectric effect. The ultrasonic pulse propagates through the gas in pipe, reaches the transducer on the other side and become converted into electric signal again to be stored in CPU board as a waveform shown in Figure 3.
If there is gas f low inside the piping, the time for the ultrasonic pulse to propagate is affected by the flow. The propagation time for flows in upstream and downstream directions are expressed as follows, respectively:
………………………… (4)
………………………… (5)
Here, T1 indicates the propagation time in downstream direct ion [s], T2 the propagation t ime in upst ream d i rect ion [s] , L t he d is t ance bet ween u lt rason ic transducers [m], c the velocity of sound, v the velocity of gas, and θ the angle of ultrasound propagation.
Equation 4 and 5 can be modifi ed as Equation 6 and 7, respectively.
………………………… (6)
………………………… (7)
When the term for velocity of sound c(t) is deleted from Equation 6 and 7, Equation 8 that indicates the gas fl ow velocity is obtained.
………………… (8)
As shown in Equation 8, the gas fl ow velocity calculated by this method does not depend on the sound of velocity. That is, the gas flow velocity calculated is not influenced even when gas density changes due to composition change. The exhaust gas volume f low rate (standard condition) can be calculated based on this exhaust gas fl ow rate and pipe diameter.
…… (9)
Here, qvew indicates the exhaust gas volume f low rate (converted for standard condition), kprofile the correction coeff icient, A the pipe surface area, T0 the standard temperature, T the exhaust gas temperature, P the absolute pressure for exhaust gas, and P0 the standard absolute pressure.
T1 = L
c (t) + v (t) cosθ
T2 = L
c (t) − v (t) cosθ
c (t) = − v (t) cosθLT1
c (t) = + v (t) cosθLT2
v (t) = × −L
2 cosθ1T2
1T1
⎝―――⎛
⎠―――⎞
qvew (t) = kprofile × A × v (t) × ×T0
T (t)P (t)P0
Figure 2 Principle of ultrasonic exhaust gas flow meter Figure 3 Ultrasonic signal wave form

94 English Edition No.42 July 2014
Feature ArticleApplication
Real-time Fuel Consumption Measurement Using Raw Exhaust Flow Meter and Zirconia AFR Sensor
Furthermore, coefficient kprof ile is used to correct the effects of gas flow velocity and temperature distribution within the pipe. It is determined by comparison with reference f lowmeters such as smooth approach orifice (SAO) flowmeter.
In this study, we used a special ultrasonic flowmeter for engine exhaust gas with the presumption to measure the exhaust gas f low rate in exhaust pipe. Since this device uses a unique ultrasonic transducer, measurements can be taken even when the gas temperature is high. It also has the advantage to reduce the effect of the ultrasonic propagation time caused by pipe stain as the propagation time difference is measured. As the f low rate response converted for standard condition also depends on exhaust gas temperature response, the temperature sensor with sharp response to gas temperature was adopted.
Zirconia AFR sensorFigure 4 shows the structure of the zirconia AFR sensor, and Figure 5 a photograph of an example of this sensor. The measurement subject gas diffuses through the space inside (diffusion chamber) from diffusion porosity from the sensor surface. The sensing cell block has electrodes formed on both sides of the zirconia solid electrolyte, and monitors the potential difference generated due to O2 concentration difference between the reference air side and diffusion chamber side. The pump cell block has the function to transfer O2 via the zirconia solid electrolyte as voltage is applied from an external source. The voltage of the pump cell block is controlled so that the potential difference monitored by the sensing cell block is stable at an equivalent level to the theoretical AFR. That is, it draws out the excessive O2 entering the diffusion chamber under lean condition and draws in the O2 to burn the CO, H2, and HC inside the diffusion chamber under rich condition. The current proportional to the amount of O2 transferred (pumping current) f lows through the pump cell. The pumping current is expressed as shown in Equation 10:
…………… (10)
Here, Ip indicates the pumping current [A], n the number of electrical charge in electrode reaction (=4), F the Faraday constant, S the cross sect ion area for gas diffusion pre, P the pressure, R gas constant, T the temperature, L the length of gas diffusion pore, DO2 the ox yge n d i f f u s io n c o ef f i c ie n t , a nd CO2 ox yge n concentration.
It is possible to calculate the AFR as the excess/shortage of O2 compared to the theoretical AFR is calculated by measuring the pumping current and thus the AFR is calculated.
Materials and Methods
Setup for fuel consumption measurementFigure 6 shows the system setup for fuel consumption measurement. The ultrasonic f lowmeter was connected behind the tail pipe of the test vehicle. The zirconia AFR sensor is capable of addressing simultaneous measurement at a close position and providing the two roles of exhaust gas f lowmeter and fuel f lowmeter in the same unit by installing it inside the piping for ultrasonic flowmeter.The exhaust side of the exhaust gas f lowmeter was connected to the CVS system to implement correlation evaluation with carbon balance method.
Ip = × DO2 × CO2n × F × S × PR × T × L
Figure 5 Zirconia AFR sensor
Figure 6 Experimental setup for fuel consumption measurementFigure 4 Configuration schematic of zirconia AFR sensor
95English Edition No.42 July 2014
Technical Reports
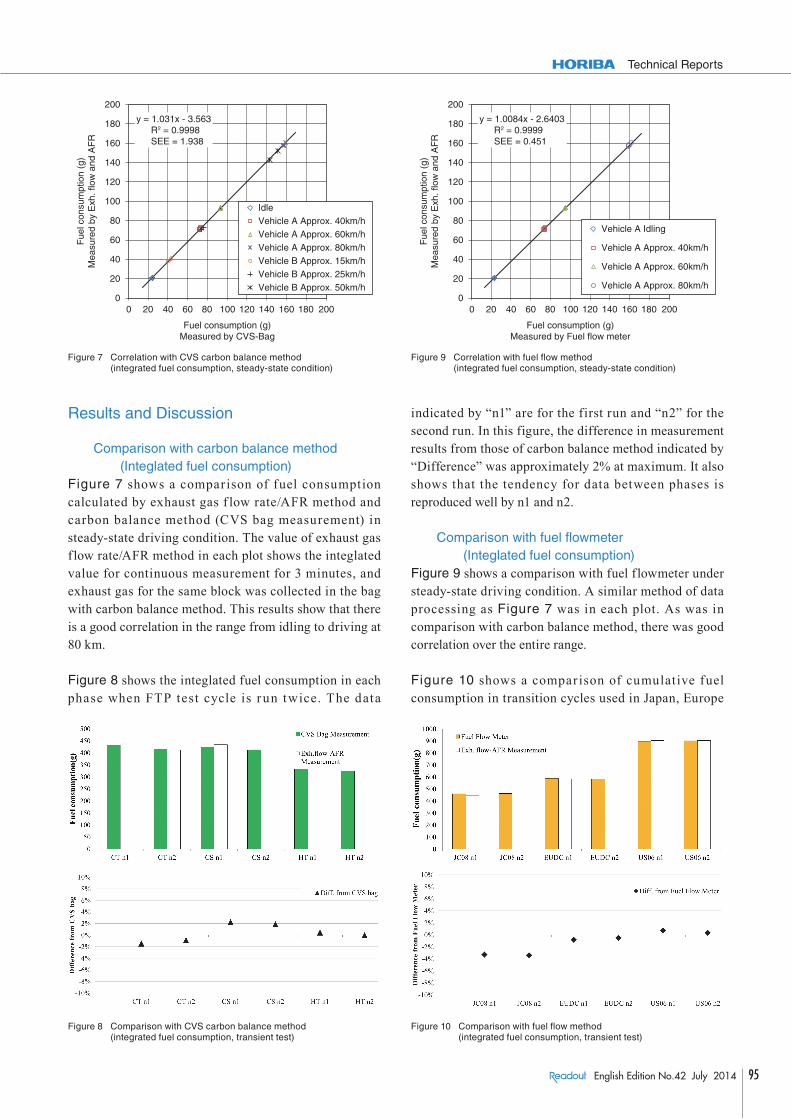
Results and Discussion
Comparison with carbon balance method (Integlated fuel consumption)
Figure 7 shows a comparison of fuel consumption calculated by exhaust gas f low rate/AFR method and carbon balance method (CVS bag measurement) in steady-state driving condition. The value of exhaust gas f low rate/AFR method in each plot shows the integlated value for continuous measurement for 3 minutes, and exhaust gas for the same block was collected in the bag with carbon balance method. This results show that there is a good correlation in the range from idling to driving at 80 km.
Figure 8 shows the integlated fuel consumption in each phase when FTP test cycle is r un twice. The data
indicated by “n1” are for the first run and “n2” for the second run. In this figure, the difference in measurement results from those of carbon balance method indicated by “Difference” was approximately 2% at maximum. It also shows that the tendency for data between phases is reproduced well by n1 and n2.
Comparison with fuel flowmeter (Integlated fuel consumption)
Figure 9 shows a comparison with fuel flowmeter under steady-state driving condition. A similar method of data processing as Figure 7 was in each plot. As was in comparison with carbon balance method, there was good correlation over the entire range.
Figure 10 shows a comparison of cumulative fuel consumption in transition cycles used in Japan, Europe
200
180
160
140
120
100
80
60
40
20
0
Fue
l con
sum
ptio
n (g
)M
easu
red
by E
xh. f
low
and
AF
R
Fuel consumption (g)Measured by Fuel flow meter
0 20 40 60 80 100 120 140 160 180 200
y = 1.0084x - 2.6403R2 = 0.9999SEE = 0.451
Vehicle A Idling
Vehicle A Approx. 40km/h
Vehicle A Approx. 60km/h
Vehicle A Approx. 80km/h
Figure 9 Correlation with fuel flow method (integrated fuel consumption, steady-state condition)
Figure 10 Comparison with fuel flow method (integrated fuel consumption, transient test)
200
180
160
140
120
100
80
60
40
20
0
Fue
l con
sum
ptio
n (g
)M
easu
red
by E
xh. f
low
and
AF
R
Fuel consumption (g)Measured by CVS-Bag
0 20 40 60 80 100 120 140 160 180 200
y = 1.031x - 3.563R2 = 0.9998SEE = 1.938
IdleVehicle A Approx. 40km/hVehicle A Approx. 60km/hVehicle A Approx. 80km/hVehicle B Approx. 15km/hVehicle B Approx. 25km/hVehicle B Approx. 50km/h
Figure 7 Correlation with CVS carbon balance method (integrated fuel consumption, steady-state condition)
Figure 8 Comparison with CVS carbon balance method (integrated fuel consumption, transient test)

96 English Edition No.42 July 2014
Feature ArticleApplication
Real-time Fuel Consumption Measurement Using Raw Exhaust Flow Meter and Zirconia AFR Sensor
and the U.S. The same tendency as shown in Figure 8 is observed.
Comparison with carbon balance method (Real-time fuel consumption)
F igure 11 shows t he r e su l t s of compa r i son on measurement of the real-time fuel consumption in the FPT75 cold start phase using the exhaust gas f low rate/AFR method and carbon balance method (dilute stream measurement). It is evident that the overall behavior matches relatively well. Figure 12 shows the enlarged figure for the time slot from 300 seconds to 500 seconds along with the AFR measurement results. There is a block for vehicle deceleration where AFR drops rapidly from around the theoretical AFR. This indicates that the fuel-cut mechanism is operating to reduce the unnecessary fuel consumption in deceleration. As expected, the measurement value for fuel consumption by exhaust gas
flow rate/AFR method is nearly zero during fuel-cut. On the other hand, there are blocks where fuel consumption does not reach zero even during fuel-cut when carbon balance method is used. It is considered that this is caused by the effect of delay in gas feeding in the sample line and the response time of exhaust gas analyzer. Based on this result, it is surmised that the exhaust gas f low rate/AFR method may be able to deliver the results with better accuracy when real-time measurement corresponding to the engine operation is required.
Conclusion
The greatest advantage of the exhaust gas/AFR method is that it can be used to measure safely and simply by only connecting the f lowmeter to the exhaust pipe. It is expected to be used popularly in benchmark tests with unknown detailed characteristics for the vehicle and the actual fuel efficiency evaluation in completed vehicles. Furthermore, this method is one of the exhaust gas f lowmeter applications. We would like to propose more applications in combination with other HORIBA products and contribute to the development of HORIBA and automotive industry.
Veh
icle
Spe
ed(k
m/h
) F
uel c
onsu
mpt
ion
(g/s
)
100
50
0
0.4
0.3
0.2
0.1
0
Time (s)5004003002001000
Time (s)5004003002001000
CVS-Dilution Measurement
Exh. Flow-AFR Measurement
Figure 11 Example of real time fuel consumption measurement (FTP75 cycle phase 1)
Veh
icle
Spe
ed(k
m/h
) A
ir-to
-Fue
lR
atio
F
uel c
onsu
mpt
ion
(g/s
)
100
50
0
20
18
16
14
0.1
0.05
0
Time (s)500450400350300
Time (s)500450400350300
Time (s)500450400350300
CVS-Dilution Measurement
Exh. Flow-AFR Measurement
Figure 12 Real-time fuel consumption measurement of FTP75 phase 1
References
[ 1 ] Yoshinori, O. et al., Emissions Measurement System for Hybrid and Plug-in Hybrid Electric Vehicles Using Intermittent Sampling Strategy, SAE Paper 2013-01-1047
[ 2 ] Nevius, T. et al., A Comparison of Direct Vehicle Fuel Consumption Measurements With Simultaneous CVS Carbon-Balance Fuel Economy, SAE Paper 2008-36-0274
[ 3 ] Inoue, K. et al., Numerical Analysis of Mass Emission Measurement Systems for Low Emission Vehicles, SAE Paper 1999-01-0150
[ 4 ] Nakamura, H. et al., Development of hydrocarbon analyzer using heated-NDIR method and its application to on-board mass emission measurement system, JSAE Review 24 (2003) 127-133
[ 5 ] Masanobu , A. e t a l . , I n-Sit u Real-Time Fuel Consumpt ion Measurement Using Raw Exhaust Flow Meter and Zirconia AFR Sensor, SAE Paper 2013-01-1058
Masanobu AKITAEnergy System Analysis R&D Dept.Application R&D CenterResearch & Development DivisionHORIBA, Ltd.