Normalizing Flowsheet Data for Continuing Use to...
46
Normalizing Flowsheet Data for Continuing Use to Meet Multiple Clinical Quality & Research Needs Beverly A. Christie, DNP, RN Bonnie L. Westra, PhD, RN, FAAN, FACMI
Transcript of Normalizing Flowsheet Data for Continuing Use to...

Normalizing Flowsheet Data for Continuing Use to Meet Multiple Clinical Quality &
Research Needs Beverly A. Christie, DNP, RN
Bonnie L. Westra, PhD, RN, FAAN, FACMI

Additional Authors
Steven G. Johnson, MS; Matthew D. Byrne, PhD, RN; Anne LaFlamme, DNP, RN; Connie W. Delaney, PhD, RN, FAAN, FACMI; Jung In Park, BS, RN; Lisiane Pruinelli,
MSN, RN; Suzan G. Sherman, PhD, RN; Stuart Speedie, PhD, FACMI
Disclosure We have no relevant financial relationships with commercial interests
Acknowledgment This was supported by Grant Number 1UL1RR033183 from the National Center for Research Resources (NCRR) of the National Institutes of Health (NIH) to the University of Minnesota Clinical and Translational Science Institute (CTSI). Its contents are solely the responsibility of the authors and do not necessarily represent the official views of the CTSI or the NIH. The University of Minnesota CTSI is part of a national Clinical and Translational Science Award (CTSA) consortium created to accelerate laboratory discoveries into treatments for patients.

• https://www.youtube.com/watch?v=g7D6pm_bLyU
• What are the key messages that are similar to documentation, particularly flowsheets?
Data Standardization

Introduction
• Value of continuing (secondary) use of EHR data • Challenges and lessons learned with flowsheet
data • Process for post-hoc standardizing data (ideal is
standardized during the EHR build) • Examples of use of the data • Importance of flowsheet data for quality
improvement and research
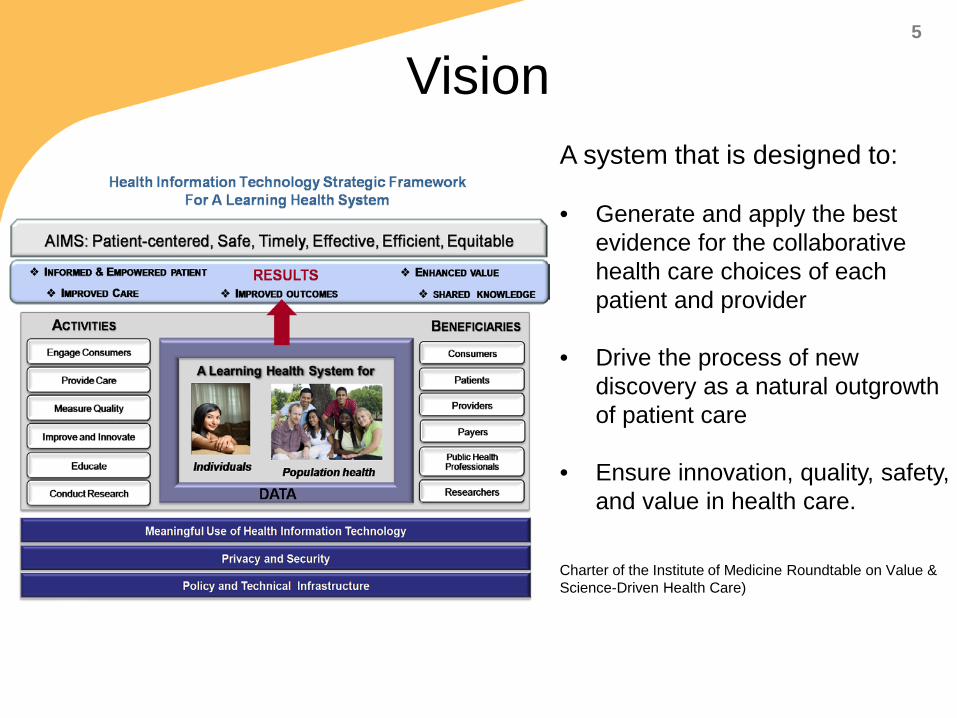
Vision A system that is designed to:
• Generate and apply the best evidence for the collaborative health care choices of each patient and provider
• Drive the process of new discovery as a natural outgrowth of patient care
• Ensure innovation, quality, safety, and value in health care.
Charter of the Institute of Medicine Roundtable on Value & Science-Driven Health Care)
5

http://www.ncats.nih.gov/research/cts/cts.html; https://www.ctsacentral.org/
Clinical and Translational Science Awards (CTSAs)

Vision for Extending Clinical Data Repository (CDR)
Clinical Data Interprofessional
Other (Consumer,
Scheduling, HR, Registries,
Quality)
Administrative Data Sets
Continuum of Care

Data Accessible to Researchers & QI Staff
• Cohort discovery & recruitment
• Observational studies
• Predictive Analytics
Data available to UMN researchers via the Academic Health Center Information Exchange (AHC-IE) 2+ million patients

UMN Health / Fairview Health Services (others in the future)
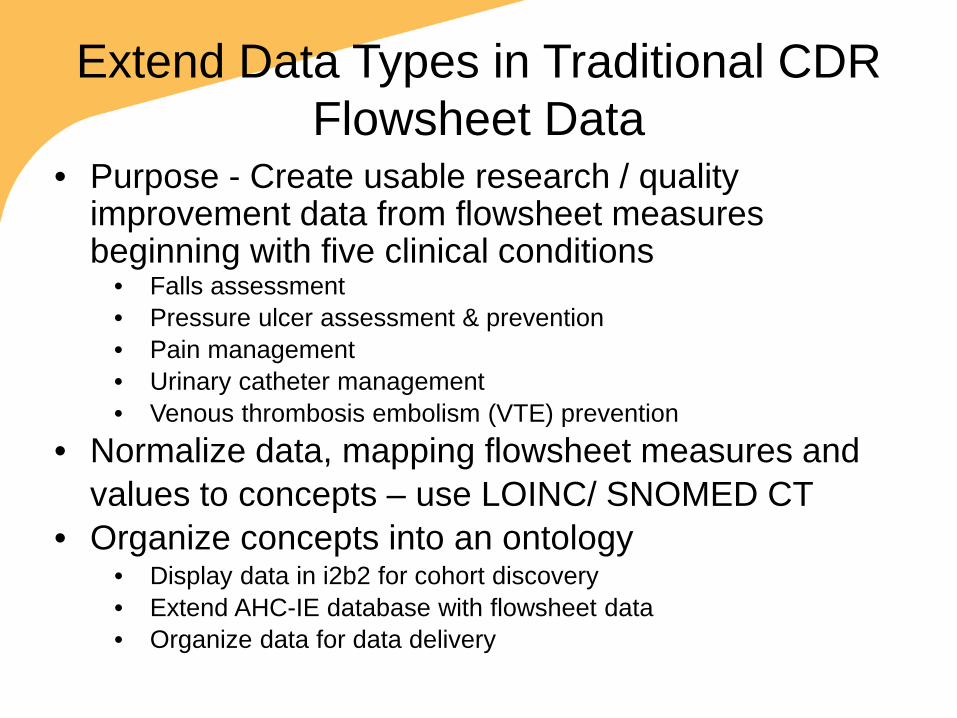
Extend Data Types in Traditional CDR Flowsheet Data
• Purpose - Create usable research / quality improvement data from flowsheet measures beginning with five clinical conditions
• Falls assessment • Pressure ulcer assessment & prevention • Pain management • Urinary catheter management • Venous thrombosis embolism (VTE) prevention
• Normalize data, mapping flowsheet measures and values to concepts – use LOINC/ SNOMED CT
• Organize concepts into an ontology • Display data in i2b2 for cohort discovery • Extend AHC-IE database with flowsheet data • Organize data for data delivery
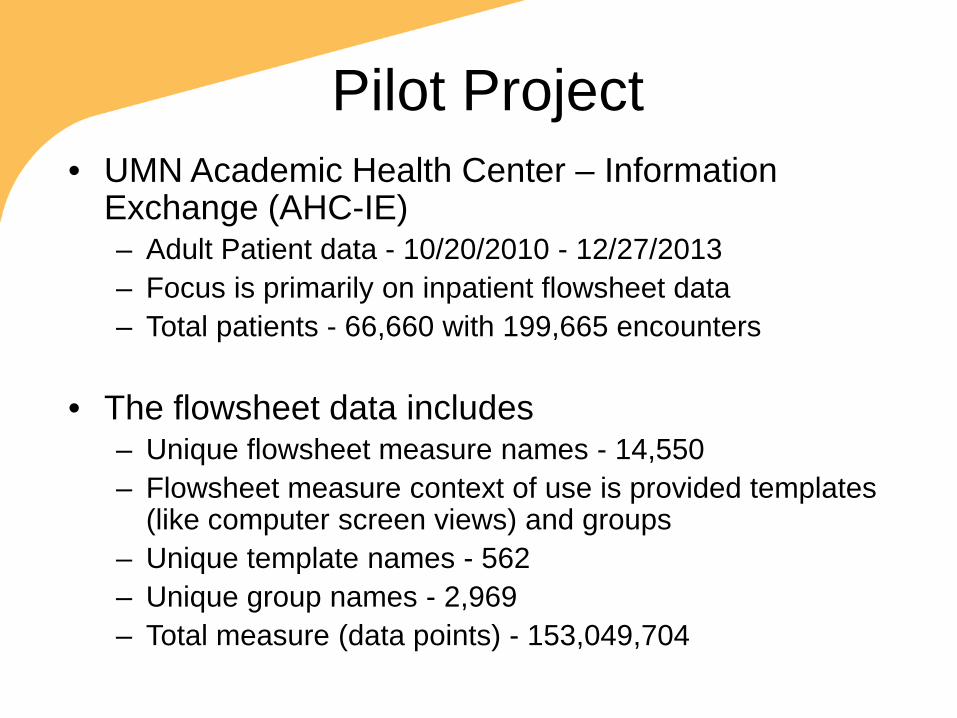
Pilot Project • UMN Academic Health Center – Information
Exchange (AHC-IE) – Adult Patient data - 10/20/2010 - 12/27/2013 – Focus is primarily on inpatient flowsheet data – Total patients - 66,660 with 199,665 encounters
• The flowsheet data includes – Unique flowsheet measure names - 14,550 – Flowsheet measure context of use is provided templates
(like computer screen views) and groups – Unique template names - 562 – Unique group names - 2,969 – Total measure (data points) - 153,049,704
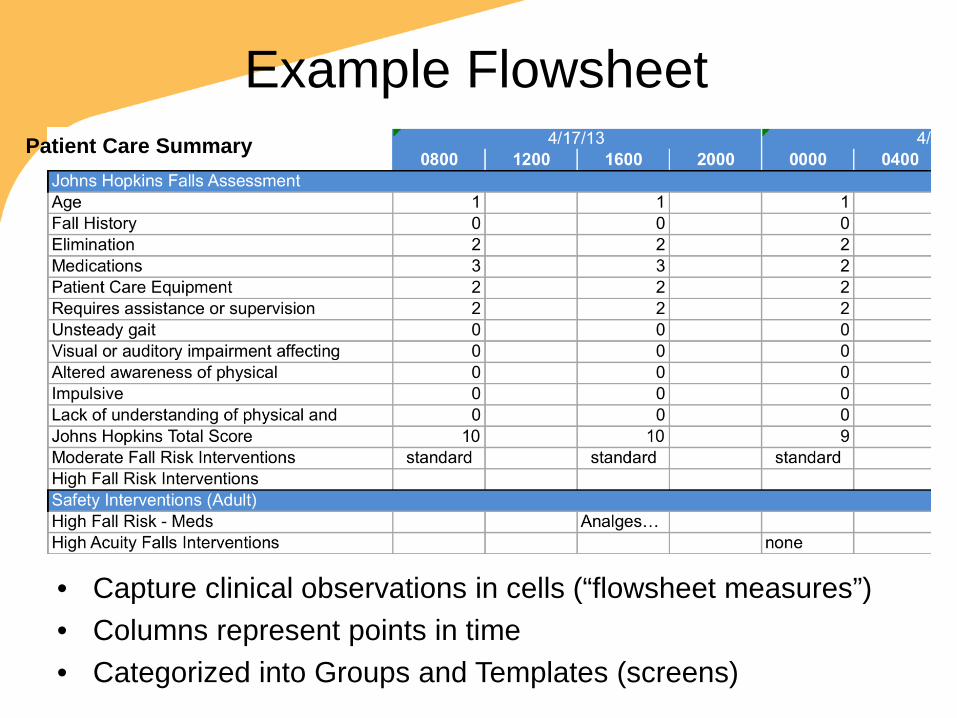
Example Flowsheet
• Capture clinical observations in cells (“flowsheet measures”) • Columns represent points in time • Categorized into Groups and Templates (screens)
Patient Care Summary
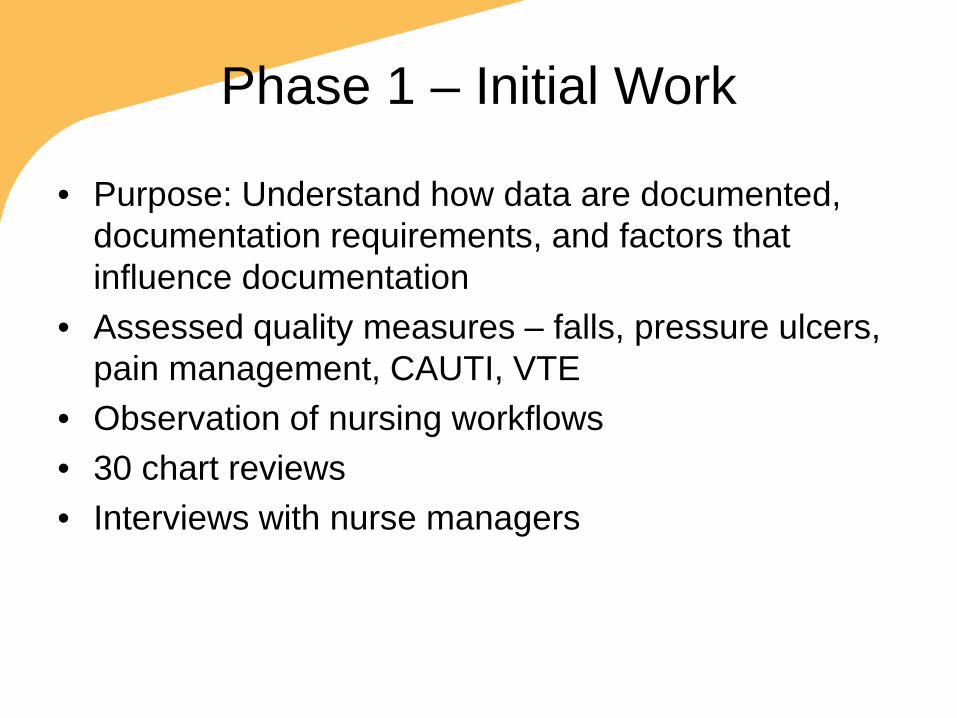
• Purpose: Understand how data are documented, documentation requirements, and factors that influence documentation
• Assessed quality measures – falls, pressure ulcers, pain management, CAUTI, VTE
• Observation of nursing workflows • 30 chart reviews • Interviews with nurse managers
Phase 1 – Initial Work

Timeliness of Assessments
70%
97% 97%
67%
82%

Pressure Ulcer Assessment & Prevention
0
1
2
3
4
5
6
11 13 14 15 16 17 18 19 20 21 22 23
Freq
uenc
y
Braden Score
Care Plan and Education for At Risk Patients
Braden Score
Care Plan Exists
Education Given
At Risk Patients

Lessons Learned • Interdisciplinary team was required to do the work
– Clinical knowledge needed (Heparin flush vs. VTE prophylaxis) – EHR developer/ trainer – Data query skills
• Data are entered over time period (multiple “columns”) – Timeliness of initial assessment – review more than one column
• Data found on multiple screens/ database fields in the EHR • CDR queries easier for some questions, only once you know
how, where, when, and why charting is done • Association between items not clear
– Pain assessment > 0 – Pain medication – Pain reassessment in 30 minutes
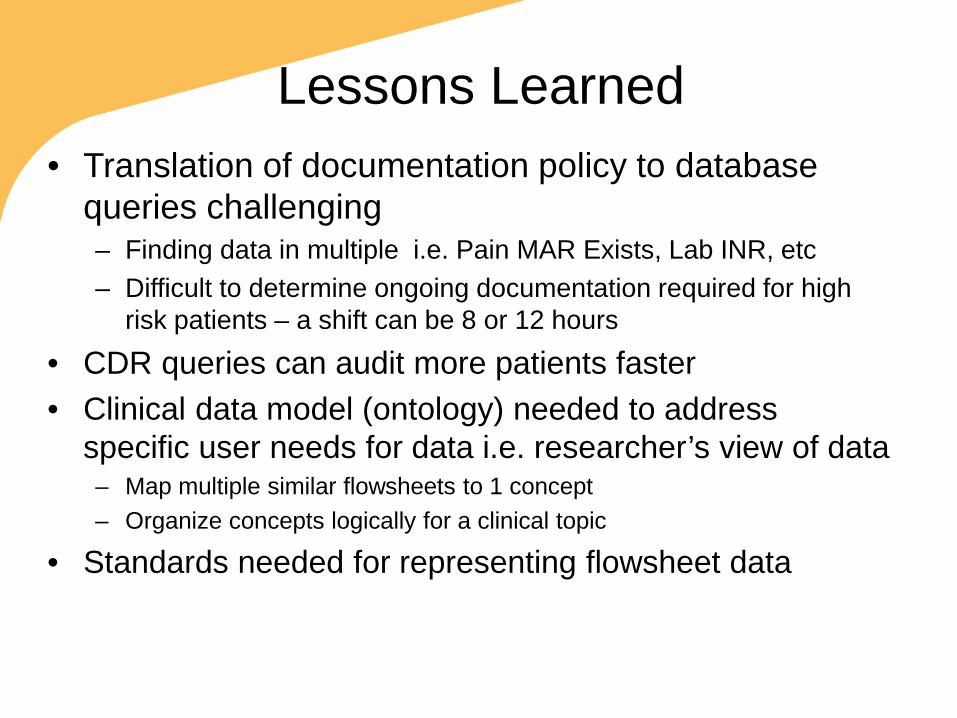
Lessons Learned • Translation of documentation policy to database
queries challenging – Finding data in multiple i.e. Pain MAR Exists, Lab INR, etc – Difficult to determine ongoing documentation required for high
risk patients – a shift can be 8 or 12 hours
• CDR queries can audit more patients faster • Clinical data model (ontology) needed to address
specific user needs for data i.e. researcher’s view of data – Map multiple similar flowsheets to 1 concept – Organize concepts logically for a clinical topic
• Standards needed for representing flowsheet data

What experience have you had with secondary use of flowsheet
data?

Phase 2
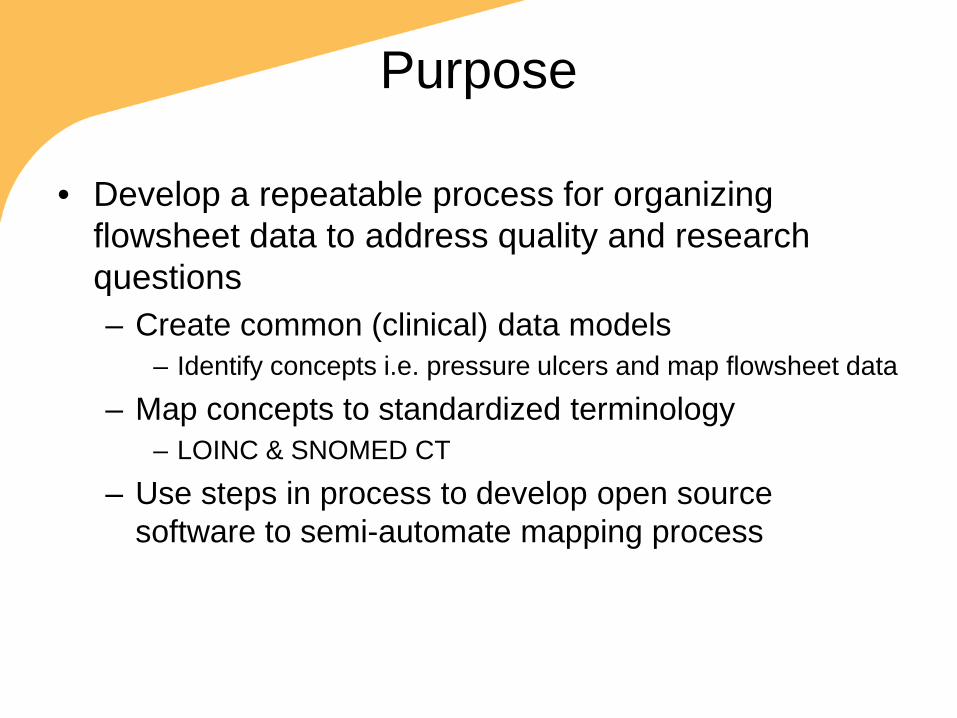
• Develop a repeatable process for organizing flowsheet data to address quality and research questions – Create common (clinical) data models
– Identify concepts i.e. pressure ulcers and map flowsheet data
– Map concepts to standardized terminology – LOINC & SNOMED CT
– Use steps in process to develop open source software to semi-automate mapping process
Purpose

Proposed Ontology for Cohort Discovery i2b2
Warren JJ, Manos EL, Connolly DW, Waitman LR. Ambient Findability: Developing a Flowsheet Ontology for i2B2. Proc 11th Int Congr Nurs Informatics. 2012 Jan;2012(1):432.

Current Organization by Others
• Exported templates (T)/ groups (G)/ measures (M) to i2b2 – Removed spurious build measures – Used hierarchical clustering data mining to
combine similar groups –renamed groups • Then clustered groups into similar templates
– Disregarded T, G, or M if < 35 patient encounters

• Templates are top-level categories – how to select/ combine that is generalizable – 562 templates – need organizing framework
• Same flowsheet measure can be in different groups/ templates
• Variations on names / value sets for similar concepts • Researcher must know data-entry model in order to
locate information if using T/ G/ M • Some data are deprecated and may be missed after an
upgrade • Our approach: develop an ontology (Common/ clinical
data models)
Challenges

• Templates – Groups – Flowsheet Measures – Data base and display names – Counts actual use of flowsheet measures by patient/
patient encounters • Some flowsheets only linked to templates or nothing
– Templates and groups show the context of use – Adult transitional care, Adult patient care summary, Review of Systems (GI/ GU)
• Just Measures – Counts of documentation for flowsheets regardless of
context – Answer type – numerical, date, categorical – Value sets i.e. pain location
Created 2 Excel Resources

Ontology Development Process
• Select clinical topics important for intended audience & create separate spreadsheets for each
• Develop list of concepts for each topic from research questions, clinical guidelines and literature for a clinical topic

Priorities - Physiological

Ontology Development Process • Use Excel spreadsheet
“Templates/groups/measures” – Search for concepts to find matching flowsheet
measures (i.e. pressure ulcer) to populate spreadsheet
– Flowsheet measures often are part of a group of related assessments/ interventions
– Search groups of measures for additional concepts (i.e. pressure ulcer stage, healing status)
– Continue until no additional flowsheet measures found

Organize the concepts for the clinical topic into hierarchy – Pain
• Pain Rating Scale (multiple methods) – Pain rating 0-10 – FLACC
» Face - FLACC Pain Rating » Legs - FLACC Pain Rating: Activity » Activity - FLACC Pain Rating » Cry - FLACC Pain Rating: Activity
– Pain Risk Factors
Ontology Development Process

Ontology Development Process Combine similar concepts that have similar value sets
flo_meas_id DISP_NAME val_type_c Value Set 673797 Pain Rating (0-10) 8 0;1;10;2;3;4;5;6;7;8;9; 301130 Pain Rating 2 8 0;1;10;2;3;4;5;6;7;8;9; 301180 Pain Rating 3 8 0;1;10;2;3;4;5;6;7;8;9; 3040110432 Pain Rating: Rest 8 0;1;10;2;3;4;5;6;7;8;9; 3040110433 Pain Rating: With Activity 8 0;1;10;2;3;4;5;6;7;8;9; 7060860 Pain Rating 4 8 1;10;2;3;4;5;6;7;8;9; 3040100517 0-10 Pain Scale 8 0;1;10;2;3;4;5;6;7;8;9; 6183 Pain Rating 7 8 0;2;3;4;7; 7060910 Pain Rating 5 8 1;10;2;3;4;8
675152 Pain Rating 8
0-->no pain;2-->mild pain;4-->moderate pain;6-->moderate-severe pain;8-->severe pain;
671197 Pain Rating 8
0;0-->no pain;10-->excruciating pain;2-->mild pain;4;4-->moderate pain;6-->moderate-severe pain;8-->severe pain;

• Consensus process • Validated by a second investigator
– Find any new flowsheet measures? – Agree with match between concept name and
flowsheet measures? • Team reviews findings by second investigator
Ontology Development Process

• Excluded measures – < 10 patient encounters (should be larger)
• Excluded templates (some concepts had different meanings and specialized measures) – OB, Peds, Newborn, NICU, Behavioral Health – Specialized Data Collection
• Apheresis Peripheral Blood Progenitor Cell Collection Record
• Card Nuclear Medicine Studies Worksheet • Focused on quality measures, then other physiological
measures
Start Small (Scope Project)
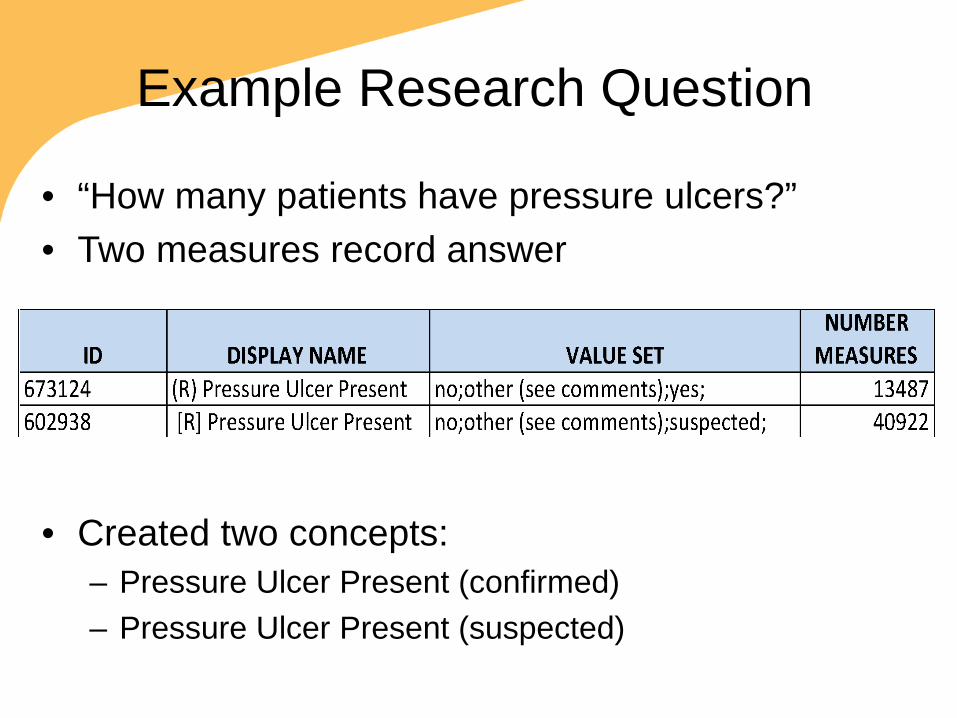
Example Research Question
• “How many patients have pressure ulcers?” • Two measures record answer
• Created two concepts: – Pressure Ulcer Present (confirmed) – Pressure Ulcer Present (suspected)

Example - Pressure Ulcer Ontology
Concepts for pressure ulcer scattered across the EHR depending on patient level of care: • 96 pressure ulcer related measures • Organized into ontology with 84 concepts • Measures appeared on 72 templates • Each concept appeared on average of 12 templates • One concept on 28 templates (Braden Score)

ID MEASURE NAME DISPLAY NAME VALUE SET NUMBER 303830 R PRESSURE
ULCER LOCATION LOCATION Abdomen, arm, back,
breast, buttocks, etc. 1780
605393 R PRESSURE ULCER DRAINAGE
DRAINAGE AMOUNT
Copious, large, moderate, none, other
23925
303870 R PRESSURE ULCER DRAINAGE COLOR
DRAINAGE COLOR, CHARACTERISTICS
Black, brown, clear, clots, creamy, green, odor
4256
303860 R PRESSURE ULCER SITE ASSESSMENT
WOUND BASE Black, erythema, blanchable, non-blanchable
46218
Example Pressure Ulcer Measures

Value Sets Help Determine Similarity

Template / Group / Measure Navigation in i2b2 Workbench
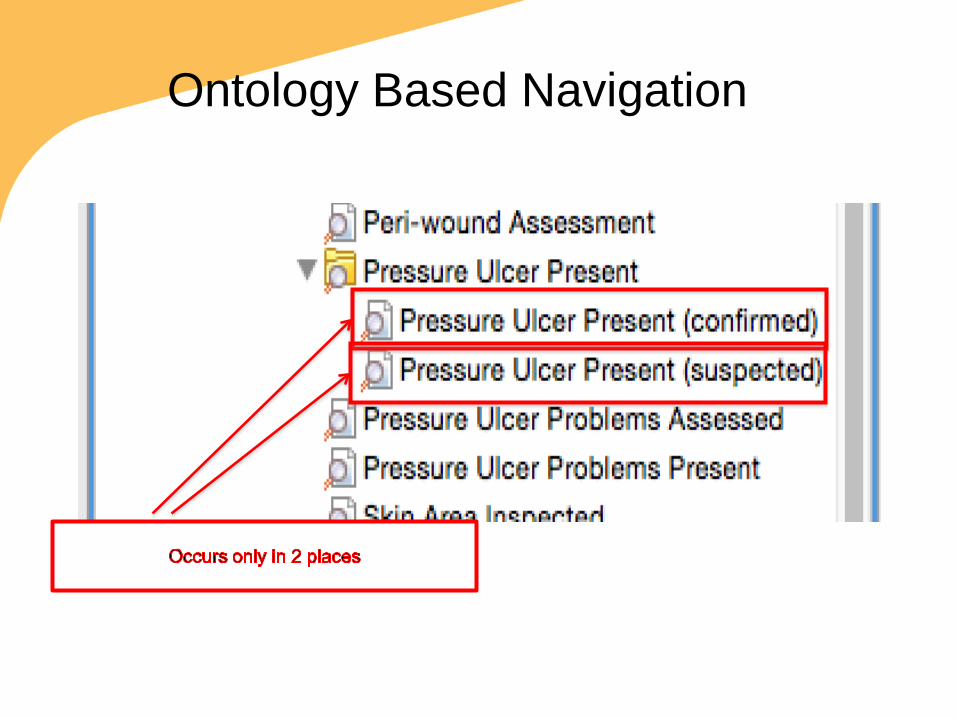
Ontology Based Navigation

Pre
ssur
e U
lcer
Ont
olog
y

Challenges
• When to combine similar measures – Same concept and value set -> combine – Same concept different value set -> unclear
• Union of value sets? • Choice list combined with free text?
• Mapping to standard terminology – How to map all 56,965 values (answers)
• What is the cut off for number of flowsheets uses over time? (>10)

Examples of Research

Index of Predictors Associated with Complications of Diabetes
Health status trajectory for specific subpopulations

Clusters Associated with Improvement in Ambulation

Focus on Sepsis • Predict morbidity and mortality for patients with severe
sepsis/ septic shock • Determine compliance with Surviving Sepsis Campaign
guidelines • Identify unique clusters of patient characteristics and
guidelines for discovering new knowledge to prevent poor outcomes
• Include flowsheet data assessments and interventions – Vital Signs – Cognition, fluid balance – Other

Discussion
• Flowsheet data is important to map for extending the clinical data in CDRs – 34% of all observations
• Manual mapping is difficult - we need to automate
• Flowsheet data important for quality indicators and for discovering new knowledge to predict and improve patient outcomes

Conclusions
• Flowsheet data is important for research, quality reporting and quality improvement
• Organizing as template / group / measure is difficult to navigate
• An ontology organizes concepts better • Automated mapping is needed

Discussion &
Questions?