Module 6: Probabilityalgebra2applications.wikispaces.com/file/view/Module 6...RESOURCES: Bingo...
35
Module 6: Probability This material corresponds to chapter 8 of the textbook, For All Practical Purposes
-
Upload
vuongkhanh -
Category
Documents
-
view
214 -
download
1
Transcript of Module 6: Probabilityalgebra2applications.wikispaces.com/file/view/Module 6...RESOURCES: Bingo...

Module 6: Probability
This material corresponds to chapter 8 of the textbook, For All Practical Purposes

PROBABILITY
CHAPTER 8
TIME FRAME: 7 days (including pre-assessment) ENDURING UNDERSTANDINGS: Events in our world can be measured as to the likelihood of their occurrence. ESSENTIAL (ASSESSMENT) QUESTIONS:
1. What is the likelihood of an event? 2. What is the relationship between empirical or experimental probability and
theoretical probability? 3. What is a geometric probability?
CRMS:
PS/Reasoning: 1.1, 1.2, 1.3 Communication: 2.1, 2.3 Connections: 3.1, 3.3, 3.4 Probability/Statistics: 6.1a, 6.1b, 6.1c AT THE END OF THE MODULE STUDENTS WILL KNOW AND BE ABLE TO:
1. Determine the likelihood of an event both empirically and theoretically. 2. Determine a geometric (continuous) probability. 3. Count using combinations. 4. Determine probabilities of compound events.
PRE-REQUISITE KNOWLEDGE/SKILLS:
1. How to add and multiply fractions. 2. How to determine areas and volumes of some geometric shapes.
PRE-ASSESSMENT ACTIVITY: Fraction pre-assessment. ACTIVITIES:
Bingo Game Pin Flipping POST-ASSESSMENTS: Paper and Pencil Test (From Testbank on FAPP CDROM)
Module 6: Probability - Page 3

RESOURCES: Bingo spreadsheet on Project TIME Teacher Resource DVD Index cards
TI-84 Calculators Thumbtacks FAPP Instructor CDROM
Module 6: Probability - Page 4

DAILY PLAN Remember to pick at least two days each week to begin class with a warm-up question from the
“Algebra Skills Review” found in the Algebra Skills Module to this Teacher Resource Manual.
Day 1
• Pre-assessment for Probability (Pencil-and-Paper Quiz). Day 2
• Ask students to describe or provide examples of a “Fair Game”. • Set up the Bingo Game scenario. • Hook, “Which card would you rather play?”. • Introductory problem, Bingo 1, 4 vs. 2, 3. • Report out on experimental, theoretical and counting from groups. HW: Determine the probability that 1, 10 winning in head to head with 6, 8. Optional: Use the vocabulary and reading anticipation guides.
Day 3 • Continue to report out if time needed. • Discussion of homework. • Show the counting of the combinations on Bingo Spreadsheet (from the Project
TIME Teacher Resource CD-ROM). • Determine if any outies beat tweenies. HW: Have students look for an algebra generalization of the game 1, x versus 2,3.
Day 4
• Explore homework, arrive at generalization, graph and discuss the graph. • Start the Pin Flipping activity (gather data) Take care to have students record
results in order. (Optional, as time permits). • Discuss the advantage of combining data as related to experimental probabilities
converging to theoretical probability. (The law of large numbers). HW: Choose problems from end of the chapter of the 7e pp. 326-329 / 8e pp. 275-277.
Day 5
• Consider problems with homework. • Find experimental probability of pin up. Use 1 minus probability of up to get
probability of down. • Count the number of streaks of 5 in each group’s data set. • Count the number of 4u,1d in the streaks of 5. • Find the experimental and theoretical outcome of 4u, 1d HW: Choose problems from end of the chapter of the 7e pp. 326-329 / 8e pp. 275-277.
Module 6: Probability - Page 5
Day 6 • Ask students to discuss the concept of geometric probabilities. • Pass out the Bird Dropping problem to groups. • Report out the solutions to Bird Dropping problems.
• Look at area under the curve 𝑦𝑦 = 1√2𝜋𝜋
𝑒𝑒(−𝑥𝑥2
2 ) using TI-84 Graphing Calculator. • Look at probability of choosing a number between -1 and 1, -2 and 2 and -3 and
3. Day 7
• Paper and Pencil assessment (see FAPP CD-ROM for samples) Optional Activities:
• X/O Problem • Let’s Make a Deal
Module 6: Probability - Page 6

PROBABILITY PRE-ASSESSMENT ANSWER KEY
1. 12/36 = 1/3 2. 1/3 or 33.33% 3. 9/36 = ¼ 4. ¼ or 25% 5. 2/26 + 9/36 = 21/36 or 7/12 6. 9/36*12/36 = 1/3*1/4=1/12
Students must first determine that there are 7 students who are A students not in track
7. 5/12 8. 24/32 = ¾ 9. 5/12 10. 8/32 = ¼= 25%
Module 6: Probability - Page 7


PRE-ASSESSMENT FOR PROBABILITY
Name: ___________________
Ryan has a collection of 36 toy vehicles. Twelve of the vehicles are race cars.
1. What part (fraction) of Ryan’s toy vehicle collection consists of race cars?
Ryan told Kyler that he’ll bring one of his toy vehicles to Kyler’s house when he visits. Kyler doesn’t know which one Ryan will bring.
2. What is the chance that Ryan will bring a race car?
Ryan has 9 motorcycles in his collection.
3. What part (fraction) of Ryan’s collection consists of motorcycles?
4. What is the chance that Ryan will bring one of the motorcycles to Kyler’s house?
5. What is the chance that Ryan will bring either a motorcycle or a race car to Kyler’s house?
6. If Ryan were to bring two toys to Ryan’s house what is the chance that one would be a motorcycle and one a race car?
Module 6: Probability - Page 9

Problems 7-10 are about Fifth Period, which has 32 students, and the Venn diagram depicts the relationship between those on the Track Team, the A Students and the rest of the class.
7) What fraction of A Students are also on Track Team?
8) What fraction of all students either run track or are A students?
9) What is the chance that a randomly selected member of the class will run track given that that she is an A student?
10) What is the chance that a randomly selected member of the class is neither a track member nor an A student?
Track Team
12 5 A Students
Fifth Period
8
Module 6: Probability - Page 10
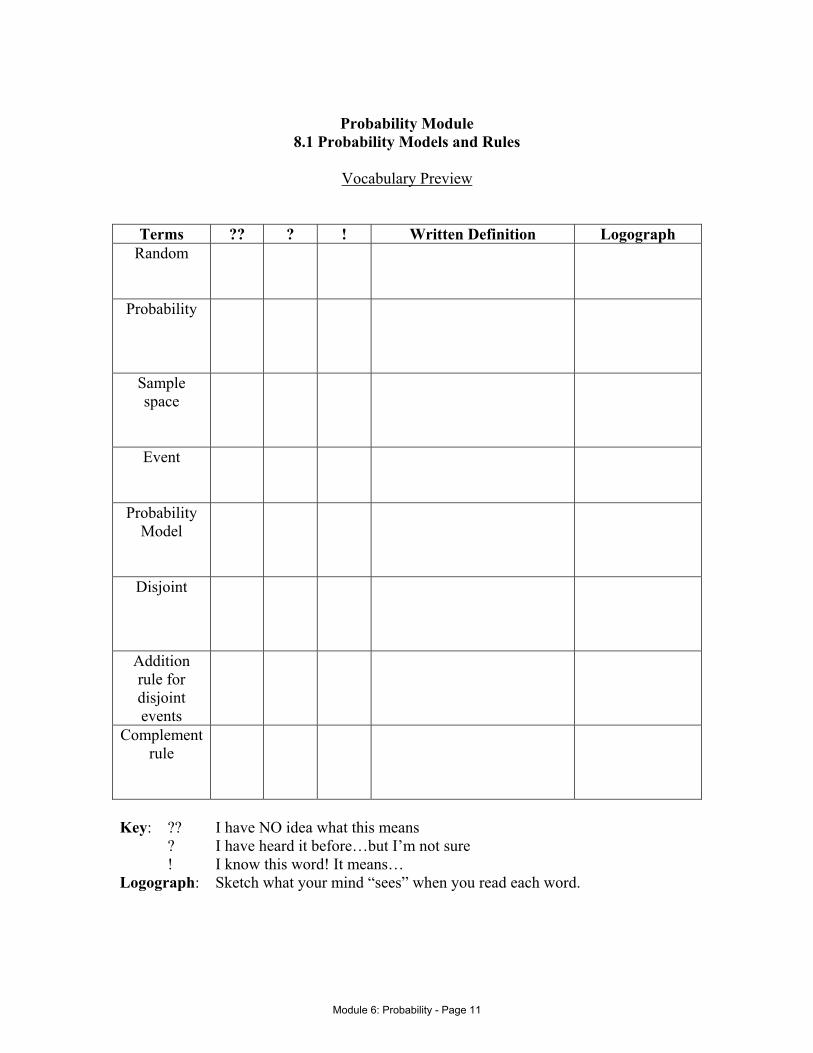
Probability Module
8.1 Probability Models and Rules
Vocabulary Preview
Terms ?? ? ! Written Definition Logograph
Random
Probability
Sample space
Event
Probability Model
Disjoint
Addition rule for disjoint events
Complement rule
Key: ?? I have NO idea what this means ? I have heard it before…but I’m not sure ! I know this word! It means… Logograph: Sketch what your mind “sees” when you read each word.
Module 6: Probability - Page 11
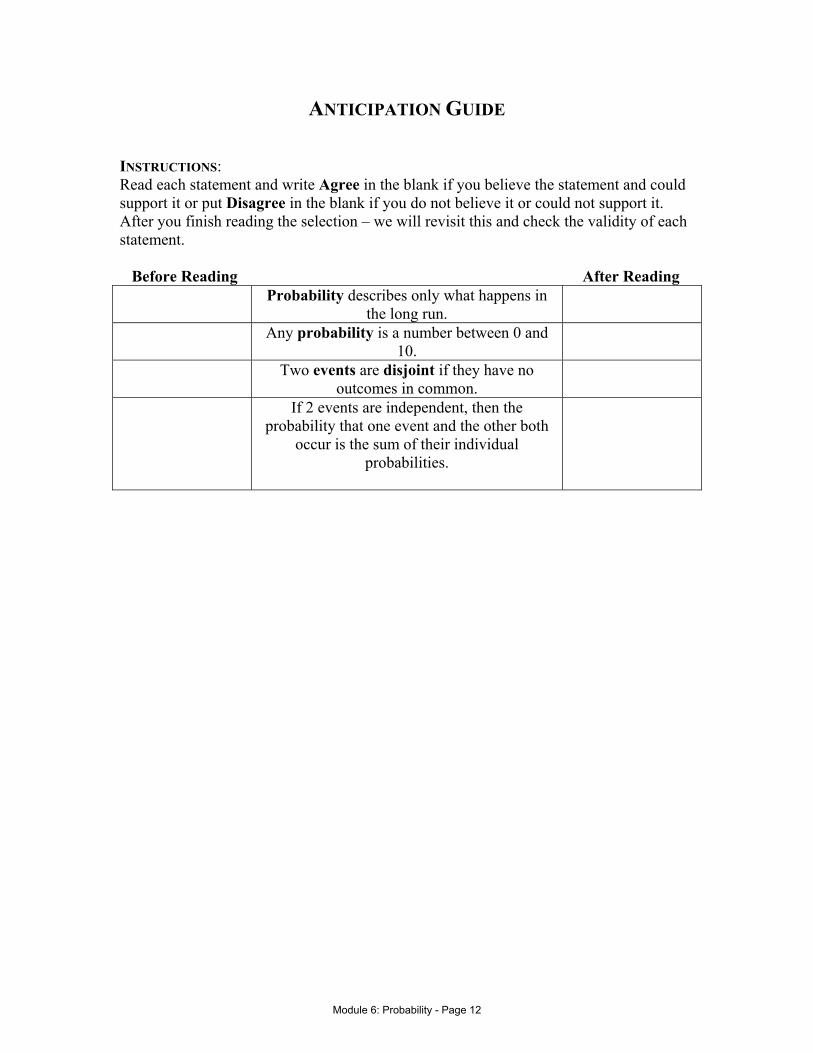
ANTICIPATION GUIDE
INSTRUCTIONS: Read each statement and write Agree in the blank if you believe the statement and could support it or put Disagree in the blank if you do not believe it or could not support it. After you finish reading the selection – we will revisit this and check the validity of each statement. Before Reading After Reading Probability describes only what happens in
the long run.
Any probability is a number between 0 and 10.
Two events are disjoint if they have no outcomes in common.
If 2 events are independent, then the probability that one event and the other both
occur is the sum of their individual probabilities.
Module 6: Probability - Page 12

8.2 DISCRETE PROBABILITY MODELS
Vocabulary Preview
Terms ?? ? ! Written Definition Logograph
Discrete
Key: ?? I have NO idea what this means ? I have heard it before…but I’m not sure ! I know this word! It means… Logograph: Sketch what your mind “sees” when you read each word.
Module 6: Probability - Page 13

ANTICIPATION GUIDE
INSTRUCTIONS: Read each statement and write Agree in the blank if you believe the statement and could support it or put Disagree in the blank if you do not believe it or could not support it. After you finish reading the selection – we will revisit this and check the validity of each statement. Before Reading After Reading A probability model is discrete if its sample
space has an infinite number of outcomes.
The probability of any event is the product of the probabilities of the outcomes making
up the event.
There are 12 outcomes in the sample space of rolling 2 die.
Module 6: Probability - Page 14
8.3 EQUALLY LIKELY OUTCOMES
Vocabulary Preview
Terms ?? ? ! Written Definition Logograph
Equally likely
Combinatorics
Combinations
Permutations
Factorial
Fundamental principle of
counting
Key: ?? I have NO idea what this means ? I have heard it before…but I’m not sure ! I know this word! It means… Logograph: Sketch what your mind “sees” when you read each word.
Module 6: Probability - Page 15

ANTICIPATION GUIDE
INSTRUCTIONS: Read each statement and write Agree in the blank if you believe the statement and could support it or put Disagree in the blank if you do not believe it or could not support it. After you finish reading the selection – we will revisit this and check the validity of each statement. Before Reading After Reading Combinatorics is the study of methods for
counting.
Rolling a die and getting a 1,2,3,4,5,or 6 is equally likely.
For a positive integer n, n! = n + (n-1) + (n-2) + … + 2 + 1
Module 6: Probability - Page 16

8.4 CONTINUOUS PROBABILITY MODELS
Vocabulary Preview
Terms ?? ? ! Written Definition Logograph Density Curve
Continuous probability
model
Key: ?? I have NO idea what this means ? I have heard it before…but I’m not sure ! I know this word! It means… Logograph: Sketch what your mind “sees” when you read each word.
Module 6: Probability - Page 17

ANTICIPATION GUIDE
INSTRUCTIONS: Read each statement and write Agree in the blank if you believe the statement and could support it or put Disagree in the blank if you do not believe it or could not support it. After you finish reading the selection – we will revisit this and check the validity of each statement. Before Reading After Reading Spinning a spinner with 4 unique colors is an
example of a continuous probability model.
A density curve is a graph that has an area of 1 underneath it.
The normal curve is an example of a density curve.
Module 6: Probability - Page 18

8.5 MEAN AND STANDARD DEVIATION OF A PROBABILITY MODEL
Vocabulary Preview
Terms ?? ? ! Written Definition Logograph Mean
Law of large numbers
Variance
Standard deviation
Key: ?? I have NO idea what this means ? I have heard it before…but I’m not sure ! I know this word! It means… Logograph: Sketch what your mind “sees” when you read each word.
Module 6: Probability - Page 19

ANTICIPATION GUIDE
INSTRUCTIONS: Read each statement and write Agree in the blank if you believe the statement and could support it or put Disagree in the blank if you do not believe it or could not support it. After you finish reading the selection – we will revisit this and check the validity of each statement. Before Reading After Reading The Law of Large Numbers helps explain
why casinos make a profit.
Finding the standard deviation of a continuous probability model usually
requires calculus.
The mean of a probability model is also known as the expected value.
Module 6: Probability - Page 20
8.6 CENTRAL LIMIT THEOREM
Vocabulary Preview
Terms ?? ? ! Written Definition Logograph
Central Limit Theorem
Key: ?? I have NO idea what this means ? I have heard it before…but I’m not sure ! I know this word! It means… Logograph: Sketch what your mind “sees” when you read each word.
Module 6: Probability - Page 21

ANTICIPATION GUIDE
INSTRUCTIONS: Read each statement and write Agree in the blank if you believe the statement and could support it or put Disagree in the blank if you do not believe it or could not support it. After you finish reading the selection – we will revisit this and check the validity of each statement. Before Reading After Reading Averages are more variable than individual
observations.
Averages are more normal than individual observations.
The distribution of heights of young adult women is approximately normal.
The Central Limit Theorem states that the average of many individual random outcomes
is approximately normally distributed.
Module 6: Probability - Page 22
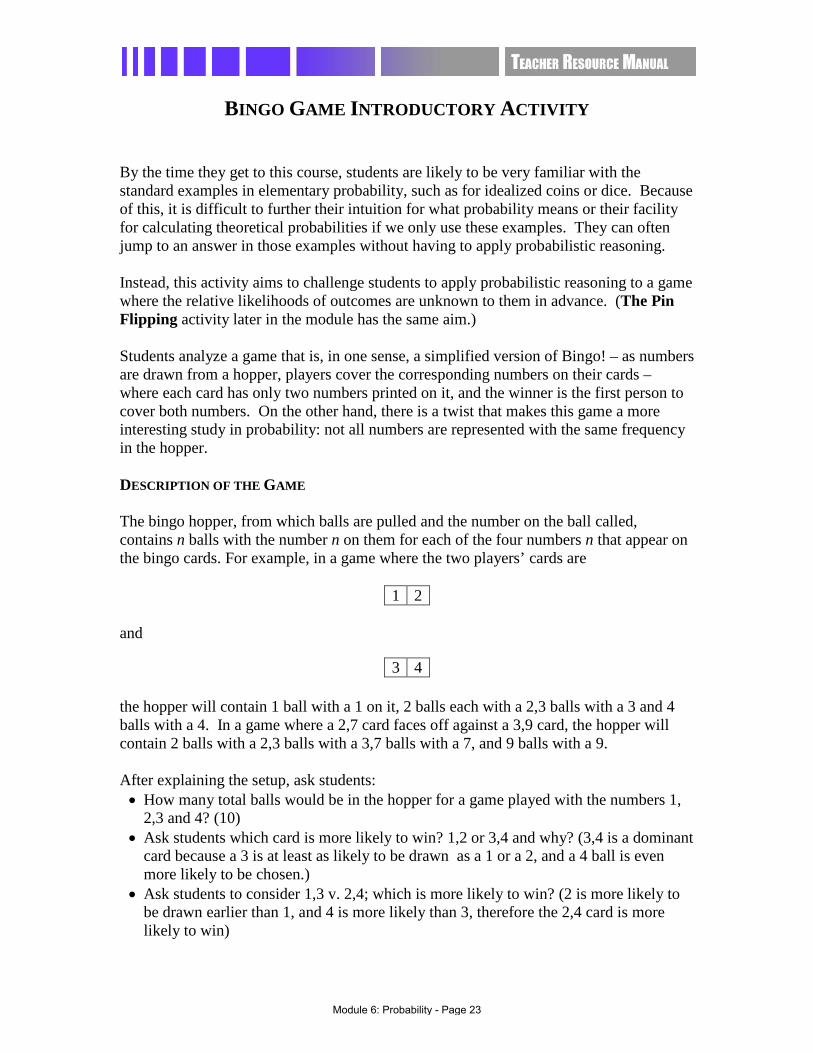
BINGO GAME INTRODUCTORY ACTIVITY By the time they get to this course, students are likely to be very familiar with the standard examples in elementary probability, such as for idealized coins or dice. Because of this, it is difficult to further their intuition for what probability means or their facility for calculating theoretical probabilities if we only use these examples. They can often jump to an answer in those examples without having to apply probabilistic reasoning. Instead, this activity aims to challenge students to apply probabilistic reasoning to a game where the relative likelihoods of outcomes are unknown to them in advance. (The Pin Flipping activity later in the module has the same aim.) Students analyze a game that is, in one sense, a simplified version of Bingo! – as numbers are drawn from a hopper, players cover the corresponding numbers on their cards – where each card has only two numbers printed on it, and the winner is the first person to cover both numbers. On the other hand, there is a twist that makes this game a more interesting study in probability: not all numbers are represented with the same frequency in the hopper. DESCRIPTION OF THE GAME The bingo hopper, from which balls are pulled and the number on the ball called, contains n balls with the number n on them for each of the four numbers n that appear on the bingo cards. For example, in a game where the two players’ cards are
1 2 and the hopper will contain 1 ball with a 1 on it, 2 balls each with a 2,3 balls with a 3 and 4 balls with a 4. In a game where a 2,7 card faces off against a 3,9 card, the hopper will contain 2 balls with a 2,3 balls with a 3,7 balls with a 7, and 9 balls with a 9. After explaining the setup, ask students: • How many total balls would be in the hopper for a game played with the numbers 1,
2,3 and 4? (10) • Ask students which card is more likely to win? 1,2 or 3,4 and why? (3,4 is a dominant
card because a 3 is at least as likely to be drawn as a 1 or a 2, and a 4 ball is even more likely to be chosen.)
• Ask students to consider 1,3 v. 2,4; which is more likely to win? (2 is more likely to be drawn earlier than 1, and 4 is more likely than 3, therefore the 2,4 card is more likely to win)
3 4
Module 6: Probability - Page 23

• Ask students for their guesses about the game of 1,4 v. 2,3 (this type of situation is referred to as outie vs. tweenie – outie refers to a card with one number that is less than both numbers on the other player’s card and one number that is greater than both number on the other player’s card; the other player’s card is called a tweenie in this situation). Some differences in opinion should occur. (The calculations and experimentation in the activity that follows will reveal the answer.)
Then assign projects to groups as described below. Divide the class into 6 groups. They may need some of the materials below to answer their questions, but they should largely be expected to figure out on their own how best to go about answering the questions on the worksheets. USEFUL MATERIALS: Index Cards TI Calculators (if students know how to generate random numbers with them) Distribute copies of the worksheets on the following pages to help students keep focused on what their groups have been asked to do. Two groups (those with Worksheet A) try to determine the probabilities experimentally by executing at least 50 trials of the game of 1,4 vs 2,3. They are asked to develop a simulation of the game and play it 50 times. For example, students may cut index cards into smaller rectangles to serve as “balls” and place them in a hat that becomes the “hopper”. Students with some graphing-calculator sophistication might try to simulate the game by generating random integers between 1 and 10. (An integer 1 would represent a #1 ball, the integers 2 and 3 would represent #2 balls, the integers 4, 5 and 6 would represent #3 balls, etc.) Directions for ProbSim on TI-84:
Use either the marble or the spinner to set up an experimental representation of 1-1, 2-2's, 3-3's, and 4-4's. Go to Apps and then Prob Sim hit enter and then either use spinner or marbles. On spinner set it up where you have 4 sections and then go to advanced and weight the 4 as 4, the 3 as 3 and so on. On marbles set it up where you have 4 types and then go to advanced and assign the number of A marbles = 1, number of B marbles = 2 and so on.
Two groups (using Worksheet B) are asked to consider the theoretical probabilities. This is certainly the harder task on these three worksheets, so they may need some guidance, and you may wish to engineer the groups in advance to make sure there are some stronger students present who can keep things moving. Here is an example of the type of analysis students should start to do to get the theoretical probability. One way that a 1,4 card could win is if the first two balls drawn are 1 then 4. How often does that happen?
Module 6: Probability - Page 24
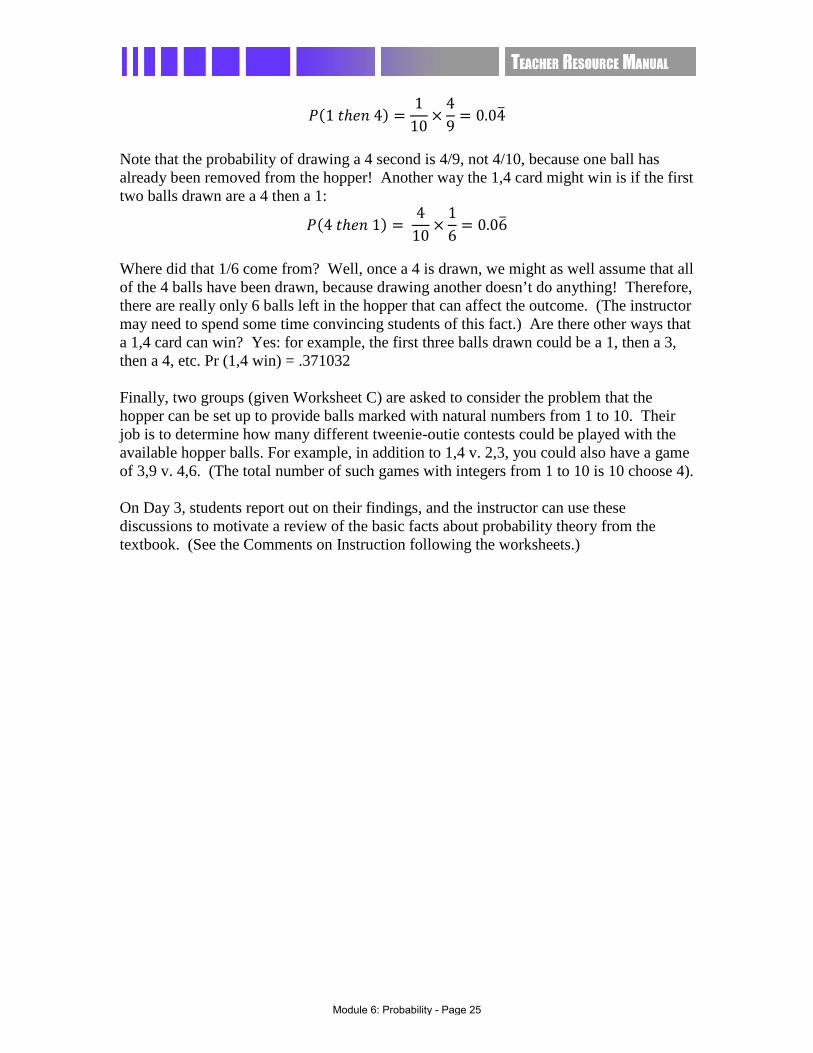
𝑃𝑃(1 𝑡𝑡ℎ𝑒𝑒𝑒𝑒 4) =1
10×
49
= 0.04� Note that the probability of drawing a 4 second is 4/9, not 4/10, because one ball has already been removed from the hopper! Another way the 1,4 card might win is if the first two balls drawn are a 4 then a 1:
𝑃𝑃(4 𝑡𝑡ℎ𝑒𝑒𝑒𝑒 1) = 4
10×
16
= 0.06� Where did that 1/6 come from? Well, once a 4 is drawn, we might as well assume that all of the 4 balls have been drawn, because drawing another doesn’t do anything! Therefore, there are really only 6 balls left in the hopper that can affect the outcome. (The instructor may need to spend some time convincing students of this fact.) Are there other ways that a 1,4 card can win? Yes: for example, the first three balls drawn could be a 1, then a 3, then a 4, etc. Pr (1,4 win) = .371032 Finally, two groups (given Worksheet C) are asked to consider the problem that the hopper can be set up to provide balls marked with natural numbers from 1 to 10. Their job is to determine how many different tweenie-outie contests could be played with the available hopper balls. For example, in addition to 1,4 v. 2,3, you could also have a game of 3,9 v. 4,6. (The total number of such games with integers from 1 to 10 is 10 choose 4). On Day 3, students report out on their findings, and the instructor can use these discussions to motivate a review of the basic facts about probability theory from the textbook. (See the Comments on Instruction following the worksheets.)
Module 6: Probability - Page 25
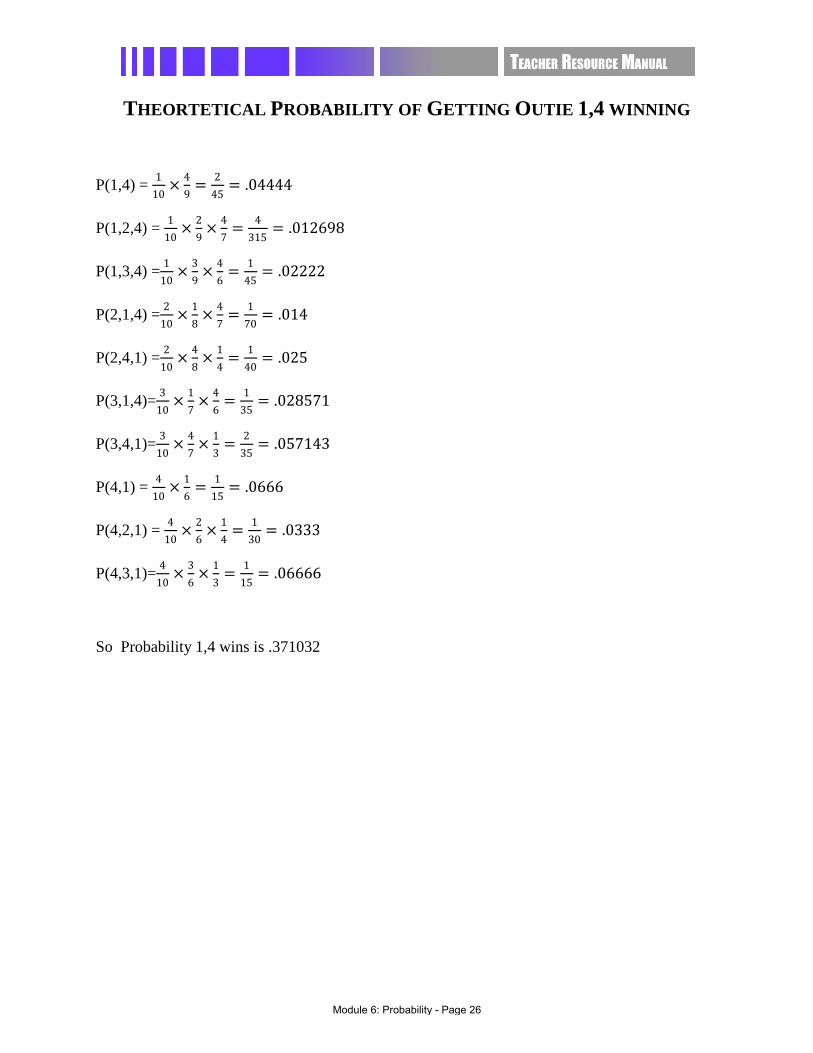
THEORTETICAL PROBABILITY OF GETTING OUTIE 1,4 WINNING
P(1,4) = 110
× 49
= 245
= .04444
P(1,2,4) = 110
× 29
× 47
= 4315
= .012698
P(1,3,4) = 110
× 39
× 46
= 145
= .02222
P(2,1,4) = 210
× 18
× 47
= 170
= .014
P(2,4,1) = 210
× 48
× 14
= 140
= .025
P(3,1,4)= 310
× 17
× 46
= 135
= .028571
P(3,4,1)= 310
× 47
× 13
= 235
= .057143
P(4,1) = 410
× 16
= 115
= .0666
P(4,2,1) = 410
× 26
× 14
= 130
= .0333
P(4,3,1)= 410
× 36
× 13
= 115
= .06666
So Probability 1,4 wins is .371032
Module 6: Probability - Page 26

BINGO WORKSHEET A This activity is based on the following version of the game Bingo. There are two players in this game, each of whom has one bingo card, and each bingo card has only two numbers on it. The numbers on the first player’s card are 4 and 1, while the numbers on the second player’s card are 3 and 2.
Just like in regular Bingo, players cover the numbers on their card when those numbers are called (after they are pulled from a bingo “hopper” or some other randomizing device). The winner is the first person to cover his or her entire card (both numbers) first. But here’s the catch with this game: not all numbers are created equal! At the start of the game, the hopper has 4 balls with the number 4 on them, 3 balls with the number 3, 2 balls with the number 2, and just one ball with the number 1:
This implies, for example, that the number 4 is four times as likely to be the first number drawn as compared to the number 1, and it is twice as likely to be drawn first as compared to the number 2. Once a ball is drawn, that number gets covered up, and it stays that way even if the same number gets called again. QUESTION: What is the probability that Player 1 wins this game? What is the probability that Player 2 wins? YOUR GROUP’S JOB: Find a way to simulate this game at least 50 times and use the resulting data to determine the experimental probabilities of winning.
Module 6: Probability - Page 27
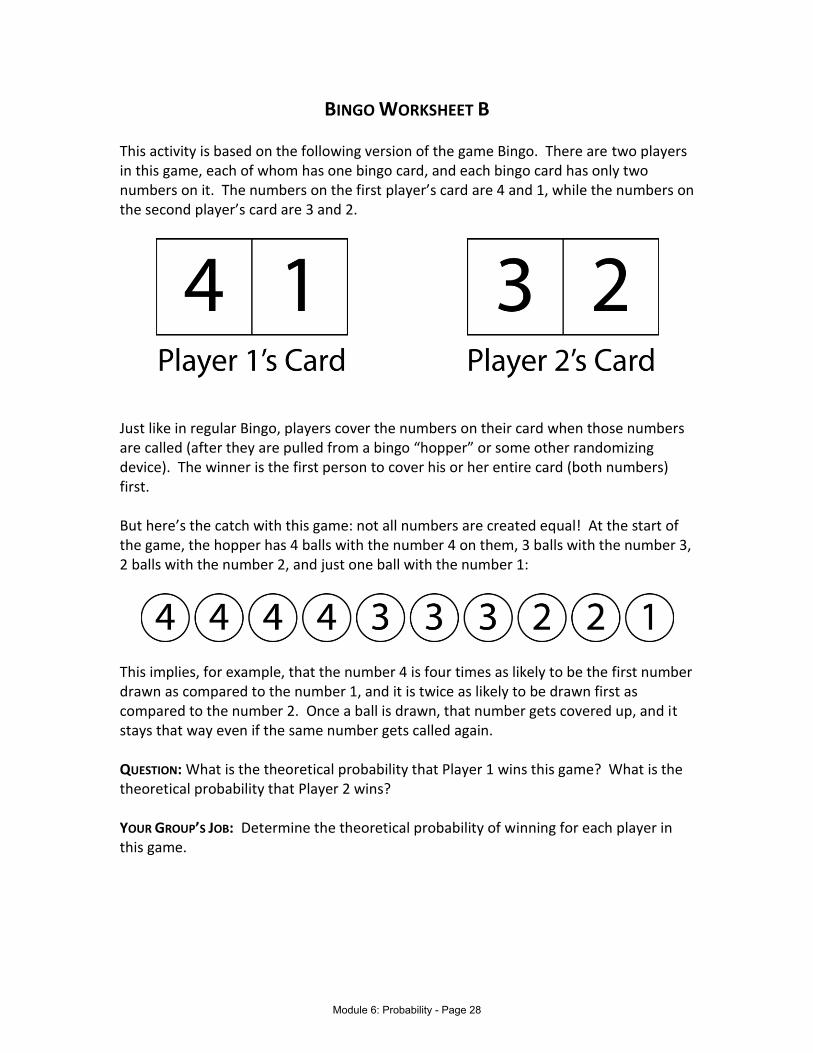
BINGO WORKSHEET B This activity is based on the following version of the game Bingo. There are two players in this game, each of whom has one bingo card, and each bingo card has only two numbers on it. The numbers on the first player’s card are 4 and 1, while the numbers on the second player’s card are 3 and 2.
Just like in regular Bingo, players cover the numbers on their card when those numbers are called (after they are pulled from a bingo “hopper” or some other randomizing device). The winner is the first person to cover his or her entire card (both numbers) first. But here’s the catch with this game: not all numbers are created equal! At the start of the game, the hopper has 4 balls with the number 4 on them, 3 balls with the number 3, 2 balls with the number 2, and just one ball with the number 1:
This implies, for example, that the number 4 is four times as likely to be the first number drawn as compared to the number 1, and it is twice as likely to be drawn first as compared to the number 2. Once a ball is drawn, that number gets covered up, and it stays that way even if the same number gets called again. QUESTION: What is the theoretical probability that Player 1 wins this game? What is the theoretical probability that Player 2 wins? YOUR GROUP’S JOB: Determine the theoretical probability of winning for each player in this game.
Module 6: Probability - Page 28

BINGO WORKSHEET C This activity is based on the following version of the game Bingo. There are two players in this game, each of whom has one bingo card, and each bingo card has only two numbers on it. The numbers on the first player’s card are 4 and 1, whicle the numbers on the second player’s card are 3 and 2.
Just like in regular Bingo, players cover the numbers on their card when those numbers are called (after they are pulled from a bingo “hopper” or some other randomizing device). The winner is the first person to cover his or her entire card (both numbers) first. But here’s the catch with this game: not all numbers are created equal! At the start of the game, the hopper has 4 balls with the number 4 on them, 3 balls with the number 3, 2 balls with the number 2, and just one ball with the number 1:
This implies, for example, that the number 4 is four times as likely to be the first number drawn as compared to the number 1, and it is twice as likely to be drawn first as compared to the number 2. Once a ball is drawn, that number gets covered up, and it stays that way even if the same number gets called again. YOUR GROUP’S JOB: Consider the following variation of this game. Instead of just numbers 1 through 4, the hopper contains balls with numbers 1 through 10. Again, the number indicates also how many such balls there are in the hopper (e.g. there would be eight number “8” balls.) How many different “tweenie-outie” match-ups are there in this game? (A “tweenie” is a card with both numbers between the other player’s numbers, and the other player’s card in this situation is called an “outie”. A game of 1,4 v. 2,3 is one tweenie-outie match-up; a game of 3,9 v. 5, 8 would be another such match-up.)
Module 6: Probability - Page 29


COMMENTS ON INSTRUCTION DAY 3 Students report results from Day 2. The teacher should try to use these discussions to motivate the ideas listed in the beige boxes pp. 298-299, 301 of the FAPP textbook: (7e pp. 248-250 and ideas listed in blue boxes / 8e pp.248-250, 252-253)
a) Probabilities are greater than or equal to 0 and less than or equal to 1. b) If A and B are disjoint then P(A or B) = P(A)+P(B) c) P(A and B) = P(A)*P(B) d) Complement: P(A not occurring)=1-P(A) e) If the only possible outcomes are A, B and C then P(A) +P(B)+P(C)=1
Have students put the 210 cases of tweenie /outie competition on Excel. Look for “fair” games and any outie cards that would be more likely than their tweenie opponent. (See the example spreadsheet on the Project TIME teacher resource CDROM. If you are constrained for time, just show students the prepared spreadsheet rather than asking them to figure out how to create their own from scratch.)
DAY 4 Have students analyze the bingo game played with the numbers 1, 2, 3 and x. Have them generalize the rules from the spreadsheet exercise of Day 3. For example: 𝑃𝑃(1 𝑡𝑡ℎ𝑒𝑒𝑒𝑒 𝑥𝑥) = 1
1+2+3+𝑥𝑥 × 𝑥𝑥
2+3+𝑥𝑥
𝑃𝑃(2 𝑡𝑡ℎ𝑒𝑒𝑒𝑒 𝑥𝑥 𝑡𝑡ℎ𝑒𝑒𝑒𝑒 1) = 2
6+𝑥𝑥× 𝑥𝑥
4+𝑥𝑥× 1
4
Then start the Pin Flipping activity.
Module 6: Probability - Page 31

PIN FLIPPING ACTIVITY This activity asks students to determine the experimental probability that a thumbtack will land pin up (i.e. straight up in the air) or pin down (i.e. on the tip of the pin and the edge of the disc). *Same activity can be done using the game pigs when students toss pigs instead of tacks. One important point of this activity is to help students understand that, just because there are two possible outcomes, the odds are not necessarily 50-50, the way a fair coin is. Another major idea of this activity is emphasizing the difference and the interplay between theoretical and experimental probability. After the activity, the instructor might want to use this as an opportunity to explain away the common misconception that many people have when they think the chance of rain should be 50% because “either it will rain or it won’t” – when meteorologists assign a percentage chance of rain, they are really saying that in their experience, under the current conditions, it tends to rain that percentage of the time. (So weather predictions are really experimental probabilities.) MATERIALS NEEDED: thumbtacks (at least 1 for each pair of students) DESCRIPTION
Hand each pair of students a thumbtack. (If you have an odd number of students in class, let one group work as a trio.) Have one student flip the thumbtack and a second student record whether point was up or down. Make sure that the recorder keeps the record in order (for instance: u-u-d-u-d-d-u-u-d-u). Collect data in sets of 20 trials and record the frequency of “u” (“up”) after 20 trials, 40 trials, 60 trials, 80 trials, 100 trials, 120 trials (by which point 12 students – 6 pairs -- have reported out) and continue until each group reports out. Have whole class discussion of the sequence of probabilities for “u”. Which probability will the students think is most likely to represent the true probability of a pin landing up? Go back to data and have each pair determine sets of 5 consecutive flips (i.e. there would be 6 cases for a sequence of ten flips). Have students determine how many times there were 3 up and 2 down in that order in any set of 5 consecutive flips. Find the experimental probability of 3 up and 2 down by combining student data. Next ask students to determine the theoretical probability of 3 up and 2 down (in terms of P(up)). Hint and help until students get 5𝑐𝑐3 𝑃𝑃(𝑢𝑢𝑢𝑢)3 ∙ 𝑃𝑃(1 − 𝑢𝑢𝑢𝑢)2. Compare the experimental results with the predicted values.
Module 6: Probability - Page 32

FURTHER COMMENTS ON INSTRUCTION DAY 6 Divide the class into 6 groups. Assign to two groups:
Your car is 10 ft long 6 feet wide and 5.5 feet high and it sits in a parking lot that
is 200 feet by 100 feet. Given that an over flying bird randomly drops do on the parking lot what is the chance that the do hits your car? (Area of car / area of the lot) Assign to two groups:
Your car is 10 ft long 6 feet wide and 5.5 feet high; your friend’s car is a sports car 7 .5 feet long, 5.5 feet wide and only 4 feet high with the roof down. What is the probability that one car is hit? ((Area of Car 1 + Area of Car 2)/ Area of the lot) Assign to two groups:
Your car is 10 ft long 6 feet wide and 5.5 feet high; your friend’s car is a sports car 7 .5 feet long, 5.5 feet wide and only 4 feet high with the roof down. What is the probability that on two random droppings your car is hit twice? That the friend’s car is hit twice? That the two do’s hit one car each? (( Area of Car1/Area of Lot )^2 etc.) After groups share the results of these investigations, use this idea of geometric probability via relative areas to lead into the normal distribution:
Have students graph 𝑦𝑦 = 1√2𝜋𝜋
𝑒𝑒(−𝑥𝑥2
2 ) on their calculators. Set the calculator window for −10 ≤ 𝑥𝑥 ≤ 10 and 0 ≤ 𝑦𝑦 ≤ 0.5. Have students press 2nd , Calc and select Integral. Choose left bound -10 and right bound 10, then press Enter. Explain to students that this indicates that the area under the curve is 1 square unit. Ask the students to consider what is the chance a randomly landing dust particle would land under the curve between -3 and 3, between -2 and 2, or between -1 and 1? (the likelihoods are 99.7%, 95% and 68%, respectively). DAY 7
Paper and Pencil Exam (See FAPP CD-ROM for sample exam questions)
Module 6: Probability - Page 33

Mathematical Explanations for the X/O Card Problem
MEC www.mec-math.org - Courtesy of Ruth ParkerModule 6: Probability - Page 34

X/O Problem
Problem Statement: You have three cards marked as follows:
• One card with an X on both sides • One card with an O on both sides • One card with an X on one side and an O on the other
Suppose all three of these cards are in a bag. You reach into the bag, randomly draw a card, and you are looking at an X. Is it more likely that the other side will show an O, an X, or are both equally likely? Necessary Equipment:
• Sandwich bags (one per student) • Three small cards in each bag labeled – X/X, X/O and O/O • A tally sheet:
The Experiment:
• Shake the bag to mix up the cards so that you will get a random draw. • Draw a card and if you are looking at an X, tally whether the other side of
the card is an X or an O. If you are looking at an O, simply replace the card in the bag.
• Shake the bag, and draw again. • Repeat the process above and collect as much data as you can in the next
few minutes. • Remember to only collect data about what is on the other side when you are
looking at an X. • Report how many X’s and how many O’s were on the other side of the
sampled cards.
X O
Module 6: Probability - Page 35
abiggerstaff
Typewritten Text
x o