Improved Fallows in Kenya: History, Farmer Practice, … Nairobi, Kenya ... hermontica, a parasitic...
63
EPTD Discussion Paper No. 115 Environment and Production Technology Division International Food Policy Research Institute 2033 K Street, N.W. Washington, D.C. 20006 U.S.A. and International Center for Research in Agroforestry United Nations Ave. Gigiri, Nairobi, Kenya February 2004 Copyright ' 2004: International Food Policy Research Institute EPTD Discussion Papers contain preliminary material and research results, and are circulated prior to a full peer review in order to stimulate discussion and critical comment. It is expected that most Discussion Papers will eventually be published in some other form, and that their content may also be revised. . Improved Fallows in Kenya: History, Farmer Practice, and Impacts Frank Place, Steve Franzel, Qureish Noordin, Bashir Jama
Transcript of Improved Fallows in Kenya: History, Farmer Practice, … Nairobi, Kenya ... hermontica, a parasitic...
EPTD Discussion Paper No. 115
Environment and Production Technology Division
International Food Policy Research Institute 2033 K Street, N.W.
Washington, D.C. 20006 U.S.A.
and
International Center for Research in Agroforestry United Nations Ave.
Gigiri, Nairobi, Kenya
February 2004
Copyright © 2004: International Food Policy Research Institute
EPTD Discussion Papers contain preliminary material and research results, and are circulated prior to a full peer review in order to stimulate discussion and critical comment. It is expected that most Discussion Papers will eventually be published in some other form, and that their content may also be revised. .
Improved Fallows in Kenya: History, Farmer Practice, and Impacts
Frank Place, Steve Franzel, Qureish Noordin, Bashir Jama

i
ABSTRACT
This case study explores the development, dissemination, adoption, and impact of improved tree fallows in rural western Kenya. The processes of technology development and dissemination throughout the region are described and analyzed. To analyze adoption and impact, the paper applies a variety of different data collection methods as well as samples from both pilot areas where researchers maintained a significant presence and non-pilot areas where farmers learned of the technologies through other channels. Sample sizes for the quantitative analysis ranged from almost 2,000 households for measuring the adoption process to just over 100 households for measuring impact indicators. Qualitative methods included long-term case studies for 40 households and focus group discussions involving 16 different groups. The paper describes the ways in which farmers used and modified improved fallow practices. Discussion also examines the types of households using fallows and benefiting from their use. Empirical results suggest that improved fallows almost always double on-farm maize yields. In addition, the data indicates that poor households use improved fallows at much greater rate (about 30 percent) than they do fertilizer (8 percent), though, on average, the size of fallow plots remains small, at 440m2. As a result, despite these promising signs, the improved fallow systems were not found to be linked to improved household level food security or poverty indicators primarily, primarily because the size of the fields under the agroforestry systems was on average, quite small. Conclusion To conclude, improved fallows represent a technically effective and financially profitable technology that is attractive to poor households with little cash available for investment. They are being used and adopted by a significant proportion of households in areas of western Kenya where they had been disseminated in the late 1990s. On the other hand, farm sizes are small and the ability of farmers to set aside land, even for a season is limited. Hence, the average size improved fallow is small among adopting farmers. Looking to the future, it is best to view improved fallows as a component of a broader integrated soil fertility management strategy for farmers. Farmers will also use manure, compost, and to some degree, fertilizer. Improved fallows have a comparative advantage in that they are relatively labor saving over manure or compost, they have a low risk of failure in supplying nutrients on the farm (because of extensive rooting systems), and they offer some by-products. Our evidence suggests that they may serve as an entry point for improved soil fertility management for farmers who had previously not invested in soil fertility management. Nonetheless, the scaling out of improved fallows to other areas will face challenges. It is not a traditional practice and therefore must be learned. There are several stages involved in managing fallows -- choice of species, fallow establishment, and cutting and incorporation. Technical backstopping may be important for each of these stages. Yet ensuring that it is available is no easy feat with scattered NGOs and sub-optimal extension services. These dissemination problems affect the scaling out of most technologies, but particularly affect the more knowledge-

ii
intensive technologies such as improved fallows. Making germplasm available is also a challenge, though many fallow species are prolific seeders and farmers can in theory become self-sufficient quite easily. Moving germplasm into new areas is more problematic. Markets for seed may play a limited role in this because farmers need a high quantity of seed, but do not care much about quality of these �input trees� and therefore are not willing to pay much, if anything for the seed. These challenges are not minor. But neither are they insurmountable. Many other tree species and other knowledge-intensive practices, such as integrated pest management (IPM), have spread throughout pockets of smallholder Africa. It will require, however, considerably more efforts to mainstream improved fallows � and indeed the concepts of integrated soil fertility management -- into extension systems.
Keywords: agroforestry, soil fertility, Kenya, adoption, impact, technology

iii
TABLE OF CONTENTS
1. Overview 1
2. Process 9
3. Impacts 16
4. Recommendation Domains 46
References 47

Improved Fallows in Kenya: History, Farmer Practice, and Impacts
Frank Place, Steve Franzel, Qureish Noordin, Bashir Jama
1. OVERVIEW
OBJECTIVES
Many scientists consider declining soil fertility to be the fundamental root cause of
agricultural stagnation in Sub-Saharan Africa (Sanchez et al. 1997). With the highest fertility
rate in the world, Sub-Saharan Africa clearly faces increasing demographic pressure on its
natural resource base, the physical capital on which the continent�s agriculture depends.
Consequently, farmers across the continent and agencies working on their behalf have
experimented with a broad range of both soil and water conservation technologies (Reij, Scoones
and Toulmin 1996). Given the high cost of petroleum-based fertilizers imported into Africa,
many agencies and farm groups have focused on solutions using local resources and low external
inputs (Pretty and Hine 2001). Among these technologies, a recent survey of African
agriculturalists has pointed to recent work on improved fallow systems as a budding success
story in African agriculture (Gabre-Madhin and Haggblade 2001).
This paper explores ongoing work on improved fallows in Western Kenya. It describes
the process by which the technology is being developed, tested and scaled up. A companion
paper in this series focuses on related improved fallow technologies developed in the very
different ecological environment of Eastern Zambia, where a single rainy season and surplus
land lead to different technical solutions (Franzel et al. 2003). Using the same diagnostic
procedures and inventories of leguminous species, the roughly 40 partner institutions in Kenya

2
have developed different improved fallow systems appropriate to the high population density,
heavy land pressure, and dual rainy season of Western Kenya. This paper examines the process
by which the Kenyan collaborators developed their situation-specific improved fallow
technologies. It likewise reports early findings on the impact they have had on farm incomes and
welfare.
SCOPE OF THE CASE STUDY
The research in western Kenya is focused largely on medium to high potential highland
areas. Rainfall is good, ranging from 1200 -1800mm/year with two cropping seasons annually:
the long rains from March to July, and the short rains from August to November. The short rainy
season is traditionally less reliable in terms of total rainfall and length of growing season, but the
rains have been good during the post 1998 period. The altitude is between 1250 and 1600 m
above sea level with rather moderate slopes. The topography is undulating with moderate slopes.
Soils are of generally good physical structure but are low in nutrient stocks. In many parts of the
region, phosphorus is the major limiting nutrient, but nitrogen and potassium limitations are also
prevalent (Shepherd et al. 1996; Jama et al. 1998a). Moreover, heavy infestation with Striga
hermontica, a parasitic weed that devastates the maize crops, is common (Oswald et al. 1996).
High population densities prevail, ranging from 500 - 1,200/km2 in Kakamega, Siaya, and
Vihiga Districts. The Luhya inhabit Kakamega and Vihiga Districts while the Luo reside in
Siaya. The farming system incorporates crops, livestock, and trees. Maize (local varieties) and
beans are the most common agricultural enterprise. The food situation was reported as deficient
by 89.5 percent of the households in Siaya and Vihiga, who had to buy food to supplement their
own harvest (Wangila et al. 1999). Only 8.9 percent of the households were food secure from

3
their own production. Average household income for western highland households was only
$1,014 and crop income a paltry $321 according to a recent study (Argwings-Kodhek et al.
1999). Average agricultural labor productivity (per year) was about $76 in western Kenya, only
one-fourth the level achieved by farmers in central Kenya.
In fact, many of the communities under study are among the poorest in all of Kenya and
clearly the poorest among the medium to high potential areas. For example, a recent national
study of poverty found Western Province (including Kakamega and Vihiga among its 4 districts)
to be one of the poorest in the country (Government of Kenya, 2000). It was estimated that 31.5
percent of households in western Kenya are among the hardcore poor, as opposed to 19.6 percent
for all rural areas. Western Province and Nyanza Province (including Siaya District) also had
high incidences of sickness which were twice as high as those reported in Central Kenya, an area
with similar farm sizes (median of about 1 hectare).
HISTORICAL BACKGROUND
Following diagnostic studies revealing perceived poor soil fertility as being a major
constraint, ICRAF tried out the improved fallow technology in Western Kenya in 1991, both
under experimental circumstances and under farm circumstances. At that moment the only
species used was Sesbania sesban, an indigenous species that had proven its potential in
Southern Africa (Kwesiga and Coe 1994) and was a prolific biomass producer under West
Kenyan conditions (Onim et al. 1990). The agronomic performance and economic profitability of
Sesbania fallows were studied in detail (Hartemink et al. 1996; Swinkels et al. 1997; Jama et al.
1998b). At that time, testing of alley farming was also taking place and a major review of that
research raised questions as to its performance and viability in western Kenya. Thus, there was a

4
period of stagnation (1994-95) where there was little dissemination of soil fertility technologies
to farmers.
In 1996, new fallow species had been introduced with promising results and the directors
of ICRAF, KARI, and KEFRI decided to intensify efforts in research and dissemination of
improved fallows (and biomass transfer systems too). This was also catalyzed by recent success
in Zambia where yields and profits were found to increase substantially from improved fallows,
compared to the low-input farmer practice.1 Screening trials resulted in the selection of new
species that in most cases were shrubs and had a shorter life cycle than Sesbania sesban. Most
promising and widely used species are Crotalaria grahamiana and Tephrosia vogelii (Niang et
al. 1999). Other aspects and management options that were tested under research conditions are
planting densities (Niang et al. 1999), the addition of inorganic phosphorus fertilizer (Jama et al.
1997; Jama et al. 1998b), the effect on weeds (Niang et al. 1996), effect on nematodes (Desaeger
and Rao 1999) and minimum-tillage planting. Extensive on-farm experiments have been
conducted to assess the potential of fallows using these species, often in combination with
phosphorus fertilization during the years 1996 to 2001. Agronomic and economic performance
was studied within these trials.
Initial efforts at disseminating information on the fallows were focused in a pilot project
area involving 17 villages distributed mainly in the districts of Vihiga and Siaya at the beginning
of 1997. Village committees were established to help facilitate information flows between the
community and research staff. In addition, field technicians were made available to many of the
villages for a period of about two years. Wide-scale dissemination of improved fallows across
1 Many farmers had been using fertilizer in Zambia, but the government subsidization of fertilizer price and credit halted after structural adjustment policies were adopted.

5
western Kenya started at the end of 1998, initiated by the research institutions that organized the
procurement of seed and trained extension and development organizations.
The research partners trained extension and development organization staff on the
establishment and management of improved fallows and provided them germplasm of species
new to the area. Many field days were conducted first at researcher managed sites and then later
at farmers� own fields. Finally, extension materials were developed for use by development
agents.
BACKGROUND SOCIO-ECONOMIC STUDIES
ICRAF undertook several studies in the main pilot project area (and beyond, in some
cases) at the outset of the project. This includes a characterization census of all households in
the main 17 pilot villages, a participatory wealth ranking exercise in selected pilot villages, and a
survey of traditional fallowing practices in several locations in W. Kenya. The results of these
are summarized here. In addition, subsequent studies were undertaken to assess the performance
of improved fallows, farmers� assessments, dissemination pathways, adoption behavior, and
impact. These results are discussed in the relevant sections below.
A wealth ranking exercise was conducted in five villages to determine indicators of
differences in endowments and assess how these differences can create opportunities and
constraints for adoption of agroforestry technologies among farmers of different economic status
within each village. Farmers identified indicators which make differences in their lives and
which can be used for impact assessment. These criteria included the ability to use fertilizer, hire
labor, and to acquire cattle. These criteria were then included in a census instrument given to all

6
pilot area households. The purpose of this was to be able to include wealth status as a sampling
stratification variable for trials and monitoring surveys.
Some of the results of the characterization survey are presented in order to describe the
rural economy of Siaya and Vihiga Districts (Wangila et al. 1999). Male headed monogamous
households were the dominant household type (63.6 percent), female headed widowed (17.8
percent), female headed with husband absent (7.7 percent), male headed polygamous (6.8
percent), single male headed households (3.7 percent), and male headed widowed (0.3 percent).
The distribution of education of the decision-makers were 39.5 percent with upper primary
school, 23.9 percent with lower primary education, 19.5 percent with no education and 17.0
percent with secondary education. High literacy levels mean that understanding of extension
messages should not be a problem, though formal education levels were lower for female adults
than for male adults. The average household size was 5.81 persons per household.
The average farm sizes are 1.75 acres for owned land and 0.11 for leased land, and per
capita land holdings were 0.42 acres of owned land and 0.43 acres for both owned and leased.
Landholdings were generally small with 95 percent of the population holding less than 5 acres
and only 0.6 percent of households having 10-31 acres of land.
Farm management -- especially land preparation, input use, hiring in and out labor and
use of hybrid seeds -- varies from farm to farm. Most of the households (88 percent) prepare
their land by hand, 11.5 percent use an ox-plow. Only 24.8 percent of the farmers used chemical
fertilizer compared to 68.9 percent who applied animal manure, and 38.3 percent compost. Most
farmers (78.6 percent) used local varieties of maize seed, 16.3 percent used a mixture of local
and hybrid seeds, and only 5.0 percent planted pure hybrid maize. A pattern emerging from this
description is that chemical fertilizer and hybrid maize seed, which are sourced from markets and

7
depend on farmers� purchasing power, are used sparingly. This is despite significant efforts to
extend these modern practices and despite relatively favorable levels of market opportunities in
the region.
Maize was the most predominant crop in the villages with only 10 households not
growing any. Other common crops include local beans, bananas, cassava, sweet potatoes, and
kale/cabbages. The other food crops � sorghum, tomatoes, and groundnuts were found on less
than half of the farms. Sugarcane was grown by 31.2 percent of the households. Other crops not
listed on the questionnaire but known to be grown by farmers include yams, tobacco, millet,
onions, cow peas, groundnuts, finger millet, coffee, sisal, sesame, and soybeans. Some of these
crops are grown for home consumption and others for the market. All production is rainfed�
there is no irrigation used among the households.
Livestock production in western Kenya is mainly based on a semi-intensive dairy-meat-
draft-manure system. Western Province has 10 percent of the national indigenous herd and 3
percent of the dairy herd while Nyanza Province has 21 percent and 5 percent, respectively.
Because of land scarcity, confined grazing on farms or roadsides is dominant. Crops are fed to
cattle and manure used to fertilize crops. Livestock production in the area is based on local
cattle, sheep and goats (sheep & goats), pigs, and poultry. Almost three-quarters of households
had poultry and just over half had local cattle. On the other hand, only 4.3 percent of households
had an improved cow.
In addition to crops and livestock, trees are an important feature of the agricultural
landscape. In the Vihiga / Siaya sample, 80 percent of households reported to have woodlots,
mainly comprised of Eucalyptus. The trees are used for firewood and poles both on-farm and for
sale. About 70 percent of the households derived some income from off-farm activities. For the

8
poor households, the main off-farm source is through agricultural labor provided to other farms.
Households with members who sometimes worked on surrounding farms represented 24.4
percent of all households.
Farmers organize themselves in a large variety of ways. Village groups can vary from a
few members to an entire village and groups are formed around a large variety of issues or
themes. Organization diagrams were developed by the project in each village or group of
villages to identify the major organizations e.g. self-help groups, women and youth groups, and
church groups. Farmers social ties, complemented with wealth and soil fertility classes, can be
used to determine which type of social organization the poor or disadvantaged may belong to.
This information was used to develop a dissemination strategy that targeted such disadvantaged
people. Poor farmers belong to church groups and of course clan-based groups, but few others in
comparison to other wealthier farmers. It was found that the number of farmers not affiliated to
any group in five Luhya villages is higher (14 percent) than in three Luo villages. In one
particular Luo village (Luero), all the farmers were affiliated to at least one group. In Luo
villages, each farmer belonged on average to four groups, whereas in Luhya villages, each
farmer is a member of only two groups.

9
2. PROCESS
HOW DID THE IMPROVED FALLOW PRACTICE ARISE
Soil fertility was long recognized as a problem in the area, as noted in section 1.
Moreover, it was clearly recognized (and later confirmed by formal surveys) that most farmers
were not able to make cash investments in soil fertility management. Following up on this,
testing began on alley farming and improved fallow systems in W. Kenya.
This process is described in more detail above, but a key element in the process was a
survey to study the practice of traditional fallows in various agro-ecological zones of Western
Kenya (the following draws largely from De Wolf and Rommelse 2000). This was done mainly
to see if there was already an existing practice of fallowing in which a niche for improved
fallows could be found. The occurrence, duration, reasons and uses were inventoried.
The study zone was stratified according to rainfall, altitude, soils, population density,
and estimated land occupation by fallow. Five homogeneous but contrasting areas were
identified following this stratification. Within each area 36 farmers (total of 180) were randomly
selected and interviewed.
It was found that fallowing is a common and important practice in the area.
Depending on the location, between 22 and 61 percent of the farmers practice traditional
fallow. On these farms, the fallows occupy between 23 and 47 percent of the total farm size.
About two thirds of these fallows are kept for 2 to 4 seasons. This was confirmed with the
characterization census (n = 1,636) that found 35.2 percent of households reporting some fallow
land. In this case, about 60 percent of fallows lasted for at least 2 seasons. These results

10
surprised many who assumed that fallowing would be negligible in an area with such high
population density. The ages of traditional fallows are as shown in Table 1 below.
Table 1--Traditional fallows by age, characterization census from 17 villages in Siaya and Vihiga Districts
Age of fallow Frequency Percent
1 season 251 41.6
2 seasons 165 27.3
3 seasons 16 2.6
4 seasons 64 10.6
> 2 years 108 17.9
Total 604 100.0
Source: Wangila et al., 1999.
Although some farmers fallow because of lack of labor or seed for planting crops, it was
felt that a niche did indeed exist for improved fallows. The research partnership of ICRAF,
KARI, and KEFRI began some experiments initially based on technology design from Zambia.
This system was a Sesbania sesban multi-season fallowing system. This prototype was not
promising from a socio-economic view as the opportunity costs of foregone maize were too high
and the yield effects of the fallows by themselves were not always high due to widespread
phosphorus deficiency. Early cost-benefit analysis showed that improved fallows could however
be profitable if the fallow period could be trimmed to a single short rain season (Swinkels et al.
1997). Researchers began testing other systems and interactions with farmers led to a focus on
establishing a short fallow system within an existing crop relying on species that could be
directly seeded. The short rain, between October and December, is an ideal fallow niche because
of its increased riskiness for maize production.

11
HOW DID IMPROVED FALLOWS SPREAD
As noted earlier, within the pilot project area, information was actively spread through
the use of village committees. These turned out to have mixed effects. They certainly did help
to organize people and disseminate information fairly cheaply. But in some cases, individuals
used the committees to gain local power, posing as �agents� for ICRAF, and this turned some
households against participating (Omosa 2002). In addition, the fact that some of these contact
farmers had been watchmen at the demonstration site somehow contradicted people�s
perceptions that a good technology should be brought in by knowledgeable and unique persons.
Since the fallows were a highly visible and new feature of the landscape there was also
considerable more informal dissemination of information, for example when relatives came to
visit or large groups gathered for a funeral. As noted earlier, there was considerable technical
backstopping support in many of pilot villages and this no doubt increased the rates of testing in
early years. The technical backstopping was reduced significantly from 1999 when there was a
more concerted effort to reach other locations in western Kenya.
Within the pilot villages several incentives were operating. Most farmers indeed began
testing fallows because of an interest to improve their crop yields. However, in 1997-98 when
there was some significant expansion in the number of farmers trying fallows in nearby villages,
the research project began purchasing tree seed from farmers. That also spawned interest from
another set of farmers. A final incentive that was apparent was a desire for some farmers to
participate in the agroforestry program in the hope that they would gain other benefits, such as
social status from the hosting of high-level visitors or access to benefits from other NGOs.
These other motivations were largely negligible in the non-pilot areas because ICRAF did not
have the resources to visit or backstop them.

12
To broaden the dissemination of the technology, the research partners developed
partnerships with the Ministry of Agriculture, NGOs such as CARE-Kenya, Kenya Woodfuel
Agroforestry Project-Busia, Hortiquip-Vihiga, Siaya Community Development Project-Siaya,
VI-Agroforestry Project-Kitale, Africa 2000 � Vihiga, church groups and many community-
based organizations. Some interaction with these partners took place in earlier phases of the
technology development process, but these were intensified in 1998, beginning with a training
phase. Other organizations heard of the large yield increases from improved fallows from
researcher managed trials and from within the early pilot villages. The NGO partners integrated
agroforestry options into their existing portfolios of options for communities and disseminated
them using their existing developed approaches, including training of primary contact farmers,
field days, and exchange tours.
There were also examples of organizations, communities or individual farmers taking the
initiative to seek information. From 1999, almost every day, the research center at Maseno
received visitors requesting information or germplasm about improved fallows or other
agroforestry systems. One particularly interesting case was of West Kanyaluo, located in
Rachuonyo District. A sub-chief (government appointed leader of a sub-location) heard about
the fallows and led a small group of farmers to Maseno. Having received some seed and
information a few farmers planted the fallows. The following year, he returned to acquire
additional seed for the community. Over 100 farmers are practicing improved fallows in the
community without ever having any technical assistance from research or extension.

13
FARMER PRACTICES USING IMPROVED FALLOWS
During a survey of 1999, farmer preference among improved fallow species was
discussed at length with the farmers. They were asked to score the species they had experience
with on a scale from 1 to 5 (Pisanelli et al. 2000). Crotalaria grahamiana, Tephrosia candida
and Sesbania sesban, received highest ranking from farmers, closely followed by T. vogelii. The
farmers� explanation for these scores related to the good impact on soil and crop production of
Sesbania sesban, Crotalaria grahamiana and Tephrosia candida (in that order); the weed
suppression by Crotalaria grahamiana; and the fuel wood from Sesbania sesban. Tephrosia
vogelii achieved its high overall score mainly from its contribution to pest control (repellent of
moles). As is indicated in Table 2, organizations have recognized these preferences and
responded by giving more attention to the priority species (Tutui 2002). The disadvantage of
Sesbania sesban compared to the other popular species is that it is difficult to establish through
direct seeding and thus there is the added efforts in producing seedlings.
Table 2--Species being promoted for Improved fallows (number of times and percentage of organizations mentioning)
Species Frequency Percentage
Crotalaria grahamiana 31 79
Tephrosia vogelli 27 69
Sesbania sesban 18 46
Crotalaria pancilla 13 33
Tephrosia candida 13 33
Source: Tutui 2000
Most of the fallows are planted during the long rains, which begin in late February or
early March and last into June. In the 1998 survey 61 percent of the fallows were planted during

14
that period and another 13 percent during the preceding months (in 1997 �1998 there was hardly
any dry spell between the short rains and the long rains). In the1999 survey these figures were 47
percent and 23 percent respectively. In most cases, these fallows were allowed to grow
throughout the rest of the year and then cut in January prior to the next long rain season. The
long rains were regarded as the best planting time by 74 percent of the farmers for C.
grahamiana, T. vogelii, T. candida and S. sesban (Pisanelli et al. 2000).
In a 1998 survey, the majority of the fallows (62 percent) were established within a long
rain maize crop, so that the trees would grow as a fallow during the following short rains. During
a 1999 survey, the proportion of fallows planted in between the crop had increased to 70 percent.
This differed slightly according to the species. Purestands of C. grahamiana and purestands of S.
sesban were very often (44 percent of cases) planted in a weedy plot after the harvest of the crop.
The recommended duration of an improved fallow is about 9 months. During the 1998
survey in Yala (Siaya), 83 percent of the fallows were at least that old when they were cut and
the average duration was about 10 months. The situation was different in Emuhaya (Vihiga). On
average fallows lasted only 247 days or about 8 months. The Siaya farmers also reduced their
average fallow period to 8 months in 1999. The best practice is to plant after the long rain maize
crop is maturing so that the tree will not interfere with maize performance � this is typically in
May. The 8-9 month fallow period then lasts until January or February when the trees are cut
down and the biomass ready for incorporation into the soil during land preparation for the long
rainy season, that begins in March. The suggested practice is for farmers to grow maize for 3
seasons after cutting the fallow (a long rain, a short rain, and a long rain) before again
intercropping the tree into the maize. The reason this can be done in many cases is that there
can be a strong residual effect from the accumulation of nitrogen in the biomass.
15
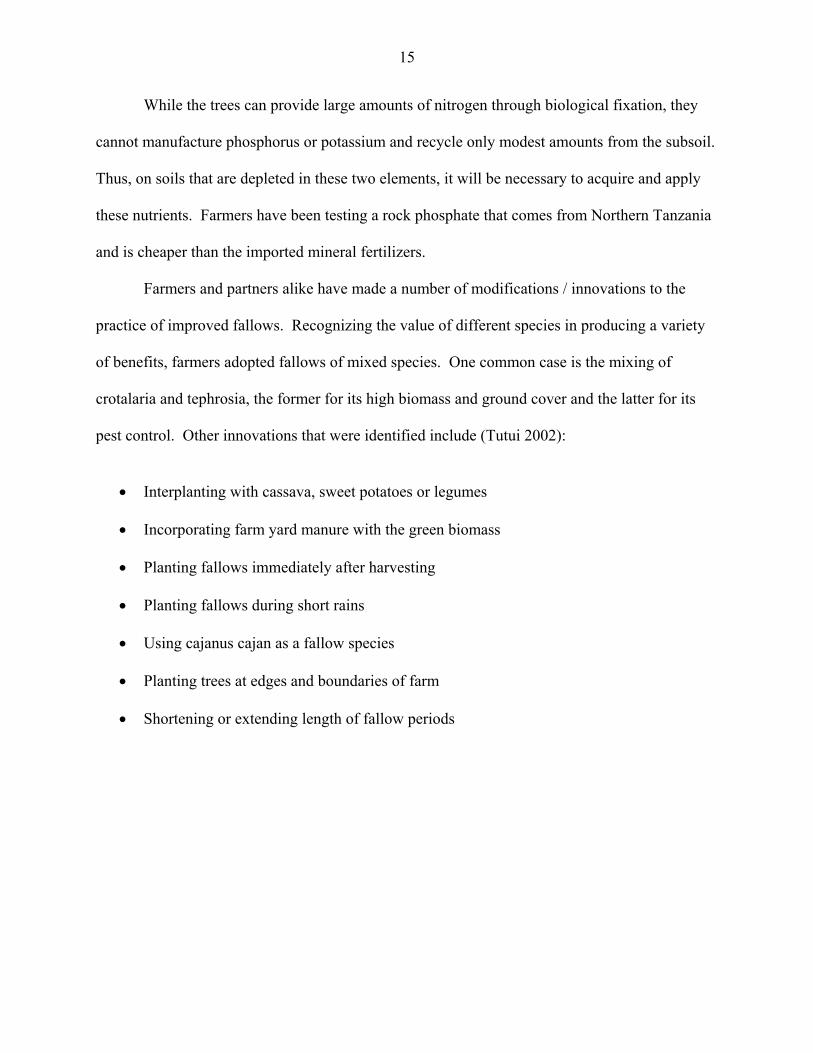
While the trees can provide large amounts of nitrogen through biological fixation, they
cannot manufacture phosphorus or potassium and recycle only modest amounts from the subsoil.
Thus, on soils that are depleted in these two elements, it will be necessary to acquire and apply
these nutrients. Farmers have been testing a rock phosphate that comes from Northern Tanzania
and is cheaper than the imported mineral fertilizers.
Farmers and partners alike have made a number of modifications / innovations to the
practice of improved fallows. Recognizing the value of different species in producing a variety
of benefits, farmers adopted fallows of mixed species. One common case is the mixing of
crotalaria and tephrosia, the former for its high biomass and ground cover and the latter for its
pest control. Other innovations that were identified include (Tutui 2002):
• Interplanting with cassava, sweet potatoes or legumes
• Incorporating farm yard manure with the green biomass
• Planting fallows immediately after harvesting
• Planting fallows during short rains
• Using cajanus cajan as a fallow species
• Planting trees at edges and boundaries of farm
• Shortening or extending length of fallow periods

16
3. IMPACTS
ADOPTION RATE
In this section we discuss separately the data collected from the pilot villages and the
non-pilot villages.
Pilot Villages
In the pilot villages, monitoring of the use of improved fallows has been ongoing each
year since 1997. As might be expected, patterns of use were quite varied and the decision as to
who is an adopter and who is not is not straightforward. After reviewing the data, it was decided
to classify households into one of four mutually exclusive groups:
1. Households that never used an improved fallow (non-adopters)
2. Households who used an improved fallow early on but never again (dis-adopters)
3. Households who did not use improved fallows early on but used recently (recent testers)
4. Households who used improved fallows throughout the period (adopters)
For the most part, adopters will have used fallows more often than dis-adopters and
testers, but some dis-adopters may have used fallows two times (i.e. 1997 and 1998) which could
be equal to the total number of fallows used by some adopters. Table 3 shows that the highest
proportion of households had not tried improved fallows as of 2001, just over 60 percent.
Nonetheless, about one-fifth of households (22 percent) have adopted improved fallows. The
number of recent testers is lower than the number of dis-adopters.

17
Table 3--Patterns of use of improved fallows and biomass transfer (percent of 1,598 households)
Improved fallows
Non-adopters 61.4
Dis-adopters 9.1
Recent testers 7.6
Adopters 22.0
In terms of the intensity of adoption, records were also kept on the size of fallows used.
Table 4 shows that average fallow area was highest in 1998, dropping to a low in 1999 and
recovering somewhat in 2000 and 2001.
Table 4--Size of fallows (square meters) Mean Median
Size in 19981 480 244
Size in 1999 364 225
Size in 2000 457 270
Size in 2001 440 234
Change over time2 -137 -81
1 Size of fallow was not measured in 1997 2 Calculated only for those farmers with at least two fallows occurring at least two years apart (2001 size -1998 size, or 2001 size -1999 size, or 2000 size -1998 size). Sample size is 351 adopting farmers.
Fallow size was reduced in 1999 partly due to lower rainfall and seed supply constraints in
addition to farmer preferences. In 2001, the mean fallow size was 440 meters squared or .04
hectares. While this does not sound like much, it should be recognized that the average farm size
for many is about .6 hectares of which perhaps .3 to .4 is under maize. Further, the fallow
system calls for a rotation of a fallow followed by 3 seasons of maize. If this pattern is followed,
one would expect only one-fourth of the maize area to be under fallow at one time � this would
be between .075 and .1 hectare. Viewed in this way, adoption intensity among those using
fallows, appears to quite high at .4 to .53.

18
Non Pilot Villages
Efforts were underway since 1998 to disseminate information and germplasm to a
number of sites in western Kenya, initially through partnerships with development organizations.
By 2000, training and dissemination activities were ongoing to some degree in as many as 16
districts. This is of course too recent to be able to define and measure �adoption.� Further, there
have not been any thorough attempts by ICRAF to assess the number of �users� of improved
fallows in the entire region. What we describe here are two exercises that provide some
indication of the level of use in some of the sites where follow up was made.
Two exercises were done to assess the uptake of improved fallows outside the pilot area
in western Kenya. The first was a joint monitoring exercise involving development and
extension partners who had decided to disseminate information on and germplasm for improved
fallows (Tutui 2002). Table 5 shows the coverage of these partners, who numbered 39 in all.
This process is conceived to be long-term and it is hoped that more and more partners will
participate over time.
Table 5--Geographical coverage of monitoring exercise with partners District Divisions Kisumu Winam, Maseno Siaya Boro, Ukwala, Wagai, Uranga, Yala, Ugunja Busia Budalangi, Matayos, Nambale, Funyula, Butula Rachuonyo West Karachuonyo, West Karachuonyo Migori Awendo, Rongo Central kisii Mosocho Homabay Nyarangi Vihiga Emuhaya, Tiriki West, Luanda Kakamega Shinyalu Nyando Miwani, Nyando Bondo Madiany Butere�Mumias Khwisero Teso Chakol
Source: Tutui 2002.

19
Table 6 shows that on average the dissemination partners are reaching 70 farmers each
year for training.
Table 6--Number of new farmers trained on using improved fallows from 39 dissemination partners in 28 divisions of western Kenya
Year
Number New Farmers Trained
% Female
2000 2905 51%
2001 (Long rain season only)
2632 42%
Source: Tutui 2002. The 39 respondents reported that between 2,500 and 3,000 farmers had been trained on improved
fallows in 2000 and 2001. The proportion of females to all farmers trained is relatively high, but
is based on information from only half of the disseminating organizations. The reason is that
some respondents did not keep records on gender.
A second exercise was a one-time exercise as part of an impact assessment study.
Censuses were done for 6 different sites outside the pilot villages (about 1,000 households in all).
Using the census, more detailed adoption analysis was completed on 360 households in all.
These sites were selected on the basis of early dissemination (from 1999 or earlier), mainly by
collaborating NGOs, but sometimes CBOs or extension, and the expectation that a significant
number of households would be using fallows (so that quantitative adoption analysis could be
undertaken). Thus, the rates of use found in this exercise may well biased upwards in
comparison with a representative sample.
As indicated in Table 7, rates of use of fallows are quite high, in most cases higher than
the rates of use in the pilot areas.

20
Table 7--Rates of use of improved fallows in early non-pilot area villages Site
Number of Households
Percentage of Households with
Improved Fallows or Biomass Transfer*
Bukhalahire (Busia) 110 33.6
West Kanyaluo (Rachuonyo) 233 58.8
Shinyalu (Kakamega) 90 44.4
Mwitubi (Vihiga) 118 30.5
Muhande-Arude (Siaya) 150 23.3
Central Gem (Siaya) 105 3.8
* In some of the sites improved fallow use was not distinguished from the other agroforestry practice for soil fertility.
This is encouraging, given that technical support from the project in these sites has been
relatively low. In fact, the site with the highest adoption rate (West Kanyaluo) is the site that has
received the least amount of attention, by either ICRAF or any other intermediary. An umbrella
NGO works in the Bukhalahire site and has assisted farmers there. Muhande is a former CARE
village and along with Mwitubi hosts ICRAF technicians from time to time because of their
proximity to the research center in Maseno. Shinyalu is a site that hosts many of the researchers
from KARI-Kakamega. Finally, Central Gem is a site where the main conduit for improved
fallow dissemination was a catchment committee (a group formed by extension for the purpose
of soil and water catchment activity).
In summary, there has yet to be a definitive count of improved fallow users in western
Kenya, but the figure is somewhere between 10,000 -20,000 in any given year. It is a practice
that is sufficiently different from traditional practices to require considerable knowledge transfer.
While in certain localities, farmers have established relatively large improved fallow plots and

21
these can be observed on aerial photos, improved fallow land use represents a yet insignificant
proportion of total land use.
WHO ADOPTS IMPROVED FALLOWS
Qualitative and quantitative studies were undertaken to assess the adoption of improved
fallows. We begin with a review of the quantitative evidence from within the pilot villages and
conclude with a summary of the qualitative evidence.
QUANTITATIVE EVIDENCE -- PILOT VILLAGES
As noted earlier, dissemination of improved fallows in Kenya began in 1997 in about 17
villages in Siaya and Vihiga Districts. These 17 villages were clustered in 3 main areas and
considerable technical backstopping was provided in 10 of the villages (labeled �pilot village� in
table 8). One cluster of many villages is in Siaya District, occupied by the Luos, the other two
being in Luyha Vihiga District. The study of this first dissemination has its advantages and
limitations. The limitation is that early testing and use was affected significantly by the presence
of the project. Besides farmer motivation to test and use fallows, they were also motivated by
increasing their social standing, by the hope that interest might gain them access to other
agricultural technology, and because for some seasons the project purchased tree seed from
farmers. These disadvantages are partially overcome by the advantage of this dataset � that
being its longevity. In covering 5 full years of monitoring, patterns of consistent use, disuse, and
recent testing can be discerned. Since project backstopping ended in 2000, those remaining users
are now motivated mainly by the performance of technology. In addition to the dataset�s
longevity, the monitoring also covered a large number of households � nearly 1,600 in all.

22
A multinomial logit regression was run to examine the effect of several explanatory
variables on the likelihood of being a dis-adopter, a tester, or an adopter relative to having never
tried an improved fallow. We hypothesized that adoption would be positively related to farm
size (due to opportunity costs of land taken out of production), household labor and male headed
households (due to extra labor and physical effort required for cutting of fallows). Researchers
have actually measured some labor savings with the operation of a dynamic fallowing system,
but farmers are not able to reflect on this until after a few years and the initial labor of planting
and cutting may tend to dominate. As for non-land household wealth, the relationship is not
clear since it is expected that the wealthy households are already users of fertilizer, but on the
other hand, the poor may be limited by access to information and other constraints of high
discount rates. For early testers who dis-adopt, one may expect that the wealthy may be willing
to test in order to compare to their other methods for nutrient management and may more likely
find that the advantages of improved fallows are not sufficient to induce change in their
practices.
Table 8 shows the results of a multinomial logit analysis of dynamic use patterns of
improved fallows in the pilot project areas between 1997 and 2001.
Table 8--Household factors related to adoption of improved fallow in the pilot villages 1997-2001 (n= 1583)
Outcome Used early and dropped
Used recently only Used throughout period
Variable Constant -3.0833**
(.000) -2.7064** (.000)
-2.5034** (.000)
Pilot village .6555** (.001)
-.1494 (.451)
.8041** (.000)
Luo household 1.3505** (.000)
.2413 (.268)
.9998** (.000)
Number of adults .2685** (.000)
.1331** (.019)
.0944** (.023)

23
Table 8--Household factors related to adoption of improved fallow in the pilot villages 1997-2001 (n= 1583) (continued)
Outcome Used early and dropped
Used recently only Used throughout period
Female head � husband away
.6750** (.031)
.4922 (.125)
.0461 (.858)
Female head � no husband
.1070 (.691)
.3812 (.151)
.0262 (.893)
Male head � polygamous or single
.6628** (.013)
-.3149 (.423)
.1717 (.416)
Secondary education -.8548** (.024)
-.2650 (.511)
.2335 (.358)
Upper primary education
-.2314 (.399)
-.1058 (.741)
.1763 (.407)
Lower primary education
-.2194 (.434)
.2804 (.346)
-.0686 (.754)
Age -.0168** (.039)
-.0055 (.533)
-.0059 (.307)
Owned land area .1417** (.024)
.0846 (.244)
.2306** (.000)
Wealth index .0418 (.590)
.1270 (.125)
.0395 (0.473)
% of cases observed 9.1 7.6 22.0 Omitted outcome is the group of farmers never trying improved fallow Significance level in parentheses; ** significant at least 5% level; * significant at 10% level
In general, the included variables appear to be very important in distinguishing between dis-
adopters and non-adopters, to some extent between adopters and non-adopters, but not very
relevant to distinguishing between recent testers and non-adopters. Rather than describing
results outcome by outcome, we shall instead analyze by variable across the different outcomes.
First, we shall discuss the variables most closely linked to poverty, the wealth index, the type of
household, and farm size. The wealth index was not statistically significant in any of the
pairwise comparisons suggesting that the different use patterns are neutral with respect to wealth
� e.g. the poor are as likely to be adopting as the wealthy. Household type was also not related
to adopting improved fallows � the technology is being adopted by female headed and other non-

24
traditional household structures as by the more common male headed-monogamous household.
A final variable linked to poverty2 shows a different pattern. Non-adopters of fallows have
smaller farm sizes than dis-adopters and adopters. Somewhat encouraging is that households
who are newly trying improved fallows tend to have farm sizes indistinguishable in size from
non-adopters. Using the land/adult labor ratio in an alternative regression, it is found that greater
ratios are positively related to the adoption of fallows (though not significant for dis-adoption or
recent testing). Thus, for adoption, land is a more important household constraint than is labor.
Among other variables, being in one of the focal pilot villages (10 of 17 villages in the
pilot area) was instrumental in testing fallows at an early date, whether the practice was
continued or not. However, location is not important for recent testers � this is suggestive that
recent testing is less related to technical backstopping, other external motivations and to the
sheer number of existing users. One interpretation is that because fallows and their effects are
highly visible, many farmers were able to make early decisions about whether to test them
(hence the relatively few recent testers) and thus there are few patterns related to recent testers.
Early use was similarly higher among Luos as compared to Luhyas. However, just like the case
with the pilot location variable, new testers are equally likely to be Luhyas as Luos. These
patterns indicate that there was greater early interest among the Luos, especially those in pilot
villages. Observations by field technicians attributed this to stronger leadership and greater
social cohesion. Obviously, many of those who agreed to test the technology at the outset,
became unmotivated to continue its use.
Education levels and age of the household head were not related to adoption of improved
fallows (or to early testers). Thus, those households using fallows in 2000-01 are similar in
2 Note that farmsize is not always identified by rural households as a key criterion for wealth differentiation among households.

25
terms of household head characteristics as households who never tried fallows. Older household
heads and those with a secondary education were less likely to have dis-adopted fallows rather
than having never used one. In other words, younger household heads were more likely to have
been adventurous and try a fallow but then to have abandoned it than the typical household head
who has never tried a fallow.
To better assess the types of households being reached by improved fallows, table 9
shows how the same explanatory variables affect the use of chemical fertilizer, animal manure,
and composting by farmers (Place et al. 2002). Some interesting similarities and contrasts
emerge. The likelihood of practicing most of the options increases as land and labor increases.
The exception to this rule is the use of chemical fertilizer that seems scale neutral. Results on the
wealth variable show that unlike improved fallows, the poor are less likely to use other soil
fertility replenishment methods. In terms of gender, households where females are heads while
husbands are away are much less likely to use chemical fertilizer but more likely to be using
composting, than male headed monogamous households. Education is an important criterion in
the use of chemical fertilizer where the impact is positive, and in the use of composting, where
surprisingly the impact is negative. Lastly, older household heads appear to be less likely to use
compost and chemical fertilizer. Looking at the set of soil fertility management options, there
appears to be some to satisfy different characteristics and demands of households, with the
possible exception that none of the inorganic techniques seemed highly attractive those operating
the smallest farms.

26
Table 9--Logit regression analysis of household factors affecting the use of non-fallow soil fertility replenishment options from 17 villages in Vihiga and Siaya districts, Western Kenya
Independent Variable Chemical fertilizer
Animal manure Compost
Constant -3.3823 (.0000)
-.0555 (.8575)
-.1618 (.5634)
Age of household head -.0111 (.0372)
-.0005 (.9086)
-.0210 (.0000)
Lower primary education .1984 (.4307)
.3382 (.0600)
-.0568 (.0000)
Upper primary education .6334 (.0077)
.0716 (.6924)
-.3768 (.0286)
Secondary education .7877 (.0036)
-.0040 (.9861)
-.3682 (.0761)
Male headed - single or polygamous
-.0692 (.7491)
-.5240 (.0052)
.0829 (.6348)
Female headed � widowed -.1289 (.5326)
-.2370 (.1500)
-.2016 (.1980)
Female headed � husband away -.9199 (.0014)
-.2904 (.1937)
.5487 (.0051)
Wealth index .5904 (.0000)
.3368 (.0000)
.3147 (.0000)
Owned farm land .0414 (.2557)
.0700 (.0903)
.0878 (.0095)
Number of household members .0062 (.7806)
.1010 (.0000)
.0244 (.1564)
Luo 1.5595 (.0000)
-.7975 (.0000)
.0717 (.5288)
Number of observations 1620 1623 1621 % of users of technology 20.5% 71.0% 40.6% % correctly predicted by model 80.8% 72.5% 63.8% Source: Place et al., 2002 Note: p value of Wald ratios in parentheses
There are apparent differences in the types of households using the different soil fertility
practices. A crosstabulation was made to determine the extent to which improved fallow users

27
were reaching farmers who were not using other types of soil fertility practices. Most of the
users of improved fallows also used at least one other soil fertility strategy (because many
households had used animal manure or compost). However, of those not using other soil fertility
practices, 25.4 percent were using improved fallows in the pilot villages and 29.1 percent were
using them in the non-pilot villages. So, while for the most part the improved fallows were seen
as an additional option, they also have spur new activity by some households.
Quantitative evidence � non-pilot villages
For the non-pilot villages, we created three categories of households: (1) non-users/dis-
adopters, (2) infrequent users, and (3) frequent users. The fewer number of categories as
compared to the pilot villages is due to fewer observations (361) and less precise information on
date of information dissemination. In the case of improved fallows, 15.8 percent were frequent
users and 13.6 percent were infrequent users, with the remaining 70.6 percent not having tried
the fallows as of yet.
Table 10--Multinomial logit results for adoption of improved fallows in non-pilot villages (n=361)
Technology Use Variable Infrequent Frequent Constant -4.29878
(.018) -2.17411 (.094)
Luhya 2.12689 (.090)
.07481 (.940)
Female headed household -.85369 (.108)
.54207 (.188)
Polygamous male headed household .314404 (.465)
.63845 (.148)
Primary education of head -.39231 (.448)
.42404 (.433)
Secondary or greater of head -.54811 (.381)
.81062 (.178)
Age of household head -.01312 (.354)
.00523 (.690)

28
Table 10--Multinomial logit results for adoption of improved fallows in non-pilot villages (n=361) (Continued)
Technology Use Infrequent Frequent Number of adult family laborers -.09237
(.489) .01692 (.885)
Farm size .00534 (.921)
.03497 (.442)
Wealth � Log of Assets .14644 (.269)
.06647 (.549)
Wealth � Farmer Generated Index of Wealth Indicators
.12201 (.030)
.15760 (.002)
Wealth � Enumerator generated middle wealth level
.93985 (.015)
.25707 (.458)
Wealth � Enumerator generated high wealth level
1.39998 (.023)
.32137 (.595)
(8 location variables not reported)
We used the same household explanatory variables as in the case of the pilot villages
with the following exceptions. For household type, all female-headed households were combined
into a single dummy variable due to insufficient numbers in several more dis-aggregated
categories. Second, we reduced the number of variables depicting the education level of the
household head to include primary and secondary/above (as opposed to further splitting the
primary education variable in the pilot villages). Third, for wealth we actually have more varied
and rigorous measures and include three alternative specifications in our model. Lastly, because
the non-pilot villages cover a wide geographical area, we include location dummies for each site.
The results for the improved fallow regression are given in Table 10. There are hardly
any statistically significant results among the household variables, contrasting the results from
the pilot villages.3 One statistical reason why this may be expected is that the number of
observations are about 20 percent of those in the pilot villages and standard errors of estimates
will be higher, all else equal. The only household variable that was linked to the frequent use of 3 There were many significant results among the location dummies.

29
improved fallows was one of the wealth variables (farmer perception of relative wealth) in which
case the more wealthy households were more likely to be frequent users as opposed to non-using
households. The same variable was positively related to infrequent use and the enumerator
evaluation of household wealth was also positively related to infrequent use. So although not all
the wealth variables are producing similar results, there are indications that wealth is important
in the use of improved fallows in the non-pilot villages. The only other significant result in the
fallow regression was that Luhya households were more likely to be infrequent users as opposed
to the Luo. This is difficult to interpret because the same variable has almost no influence
whatsoever in regards to frequent use of improved fallows.
It is interesting to note the positive link between wealth and the uptake of the fallows in
contrast to the findings in the pilot villages. This may reflect the extra attention given to reaching
the disadvantaged groups within the pilot villages by project staff as compared to other
dissemination pathways used in other sites, or could also be partly attributable to different
measurements of wealth in the two sets of regressions. It is equally interesting to note that while
farm size and labor constraints were apparent in reducing the uptake of improved fallows in the
pilot villages, such constraints did not emerge in the non-pilot areas. This issue requires further
investigation.
Qualitative evidence
A detailed analysis of adoption factors was made in two pilot and two non-pilot villages
using focus group discussions and household case studies. Factors found to influence both
adoption and the actual choice of improved fallows and soil fertility management practices in
general include the following, in no particular order (Omosa et al. 2002):
• Fluctuation in the price of tree fallow seed

30
• Infestation by pests from introduction of new plant species
• Small land sizes
• Amount of land owned or accessible
• Unavailability of the youth following their dislike for farm work
• Absentee heads of households
• Reluctance by men to stay on the farm
• Discrimination from technology transfer contact farmers
• Attitude of the contact farmers
• Imposition of contact farmers on the community/recipients
• The health status of household members, especially the impact of HIV/AIDS
• The amount of labor/effort demanded by the technology
• The possibility of realizing immediate returns
• The rigorous nature of some of the practices
• Feeling of unequal relations with ICRAF
• Natural calamities such as hailstones
• Theft and other social crimes
• Political alignments
In addition to the above, the case studies uncovered some additional difficulties facing
women farmers (Omosa et al. 2002). Some women have found it difficult to participate because
they lack sufficient land, they cannot attend the demonstrations/ field days due to restrictions
from their spouses, or their domestic workloads are too heavy. It was noted that whereas
majority of the people that went on field trips were men, it was the women that undertook most

31
of the farm work.4 Nevertheless, there are examples of households that cooperate in the conduct
of their farm activities with great success. In other words, while there is evidence to show that
gender disparities have a negative impact on adoption and continued implementation of
improved fallows, it is also the case that this technology has managed to interest men in
(subsistence) farming with some amount of success. And, as would be expected, the direction
taken depends on what else is going on in particular households.
Education was not found to play a major role in the decision of farmers to take up
technologies. In any case, women who were apparently of lower education excelled in the uptake
of the new technologies as long as the explanations are given in the simplest terms possible.
Because many of the technologies were practically taught it was easy for the farmers to pick
them.
SOCIO-ECONOMIC IMPACTS OF IMPROVED FALLOWS
Economic impacts of improved fallows
Input, yield, and profit impacts. The improved fallow system was described above and it
is clear that it adds two labor operations, one for planting of fallows and a second for cutting
them down. Further, there are the possibilities for implications on weeding and land preparation.
We will consider these in turn. As for planting, where seedlings are concerned, that is for
Sesbania sesban, labor required is about 16 days per hectare. Most of the farmers in our villages
and those in the trials described below, use direct seeding methods however, which only require
2-3 days per hectare. As for cutting of the trees, careful monitoring of farmers revealed that on
average, this operation took 9.5 days per hectare (Rommelse 2001a). If a fallow were to be
4 In one case when women did take a field tour, the bus broke down requiring the women to stay overnight away from home. This led to the development of suspicions among the husbands that further entrenched their reluctance to allow wives to travel.

32
planted on a bare field and weeded, it would result in an additional 15 days of weeding (Jama et
al. 1998). However, the majority of farmers establish the fallow in a maize field and the weeding
time is already captured by the cropping labor. Some farmers actually claim that improved
fallows reduce the amount of labor time required in the following season due to weed
suppression, but this has not been quantified. Farmers cut the trees low to the ground and do not
destump. While many claim that the soils are easier to work with, the presence of stumps and
roots on average means that farmers spend an extra 10 days per hectare on land preparation the
season after cutting (66 days/ha as opposed to 56 days/ha). For comparison, the total amount of
labor for a maize/bean crop is 136 during the long rains and slightly less during the short rains
(about 120). The fallow system enables the saving of the 120 days, while adding 23 days (when
direct seeded into a maize field), giving a net savings of about 97 days per hectare. At the
average improved fallow size of .04 hectares, this amounts to about 4 days.
As for non-labor inputs, fallows require that land be taken out of production. The
opportunity cost of this is the production foregone and in all the following analyses these lost
outputs are directly measured. Typically, yields are significantly lower during the short rains
than the long rains (20-30 percent, for instance). As for cash costs, the purchase or production of
seedlings can be costly, which is a reason farmers opt for direct seeding. For the commonly used
species, the cost of tree seed is about $8.50 per hectare.
Table 11 presents an analysis of two farmer-managed trials in western Kenya (Rommelse
2001a). The first trial was for four seasons and the second trial was for three seasons.5 The crop
following the fallow was maize or maize/bean. In both trials, continuous cropping meant the
production of maize/bean for 4 and 3 seasons respectively. Total maize yield from the fallowing
5 For both trials, the pattern was for a fallow-crop combination in season one, a fallow in season two, and then crops in the seasons that followed.

33
systems would be for one fewer season in each trial, with the fallow occurring in the second
season. The only fertilizer applied was TSP (for phosphorus) which was applied at rates of 0, 50
and 250 kg per hectare for different land uses. The results from some of these alternatives are
presented in Table 11.
Table 11--Economic analysis of improved fallows on maize and beans for multiple seasons in Western Kenya (farmer-managed trial)
Land Use System
P rate Average total yield: maize1
Average total yield: beans
Total
Costs2
Return
to
land3
Return
to
labor4
kg kg Kg $ $ $/day
Trial 1 (four seasons, total N = 34)
0 4390 969 585 405 1.74 Continuous
Cropping 250 5025 1191 1047 108 1.14
0 2626 519 442 148 1.36 Natural
Fallow 250 3573 681 904 -131 0.63
0 3964 855 484 397 1.87 Crotalaria
Fallow 50 5191 1035 588 528 2.13
0 5122 962 495 588 2.31 Tephrosia
Fallow 50 5440 867 588 534 2.14
Trial 2 (three seasons, total N = 61)
0 4160 0 388 242 1.53 Continuous
Cropping 50 4505 0 481 189 1.40
0 4498 0 313 351 2.04 Crotalaria
Fallow 50 4414 0 404 249 1.71 1 Average total maize yield is the total yield over the 4 seasons (2 per year) averaged across the farmers applying the system. For continuous cropping it is the cumulative maize yield for all seasons averaged across all farmers. For the fallowing systems, it is the cumulative yield for one fewer season than for continuous maize, with the second season being under fallow. 2 Includes purchased inputs and all labor time valued at current wage rate. All costs except for modest seed costs are labor in the treatments with zero P inputs. 3 This is the per hectare net present value over all seasons of the trial 4 Includes all labor time. Source: Rommelse 2001a
In the first trial, the natural fallow system was found to be unproductive and not financially
attractive compared to all other systems. The tephrosia fallow without phosphorus inputs was

34
the most economically attractive by both returns to land and returns to labor criteria. The
crotalaria system gave poor results in the first season and thus was superior to the continuous
cropping practice only in returns to labor. For this system, the addition of phosphorus increased
returns substantially. A second trial involving more farmers (about 30) found that the crotalaria
fallow system without any additional fertilizer was far superior to that of the continuous cropping
system. The returns to land and labor were 45 percent and 33 percent higher respectively.
Synthesizing across all trials undertaken by ICRAF, improved fallows are found to be attractive
financially. But it is not possible to identify a particular species that is best under all
circumstances nor is it true that using fallows with added phosphorus is always the more
profitable.
We attempted to conduct a similar analysis using farmer recall data in the non-pilot
villages. Responses on maize production increases suggested a median response of about 150
percent over the control of maize with no nutrient inputs. We were not able to calculate a
financial return from these data because plot sizes were not measured and appeared to be highly
rounded upwards. New efforts are ongoing to obtain more precise on-farm data from long rain
season of 2002 in the pilot villages.
The qualitative analysis also indicated that many farmers were pleased with the maize
yield responses to fallows. Many of the respondents that had used improved fallows said that
they realized progressive increased yields (Omosa et al. 2002). The yield increases were
especially felt in the first season following the fallow. However many farmers feel that the
nutrient effect of fallows dwindles over time.
Effect of improved fallows on assets. Our hypothesis is that if yield impacts from
improved fallow investments are to lead to sustainable increases in livelihoods, then we would
35
expect to observe some degree of asset accumulation. The qualitative research found that this
was indeed occurring for some households, but not all. For example, the case studies showed one
Luhya farmer has been able to educate three children up to form four from sale of tomatoes and
kales. These were grown on a piece of land that was under an improved fallow, and was then
supplemented by farmyard manure and tithonia organic manure. Other farmers were able to sell
extra yields to buy books and pay fees, and the increased yields helped reduced the period of
buying maize from two months to one month for one case. But it was evident that because of
rampant poverty, most households were hard placed to convert any gains from increased yields
into tangible assets. The case studies are replete with stories of observed doubling of yields, yet
an inability to religiously apply or even expand the systems. The reasons for this are manifold,
including focus on other livelihoods and unpredictable shocks to the health and economy of the
household. The few that were able to increase assets reported gains in livestock and housing.
Several quantitative analyses were undertaken to confirm whether these mixed results hold
across larger populations.
Before discussing the links between improved fallows and assets, it is extremely
important to understand the context of assets and their change during the study period. Looking
at the actual values, livestock comprises about 70-80 percent of the value of all liquid assets.
The mean total liquid wealth held by households was $408 in the current year in the non-pilot
villages and $236 in the pilot villages, while that of livestock was $302 and $178 respectively. A
large number of households suffered through dis-investment in both livestock assets and total
assets over the period. This is remarkably consistent in both sites with percentages incurring dis-
investment ranging tightly between 47 percent and 54 percent. In general, households with
higher initial wealth fared poorly compared to the less wealthy. Some of the more wealthy

36
households saw their livestock holdings collapse, through the selling for obligations (e.g. a huge
number of funerals) and disease (most notably for poultry).
Two-stage methods are used to first predict the use of improved fallows and the second
stage to measure the effect of the predicted improved fallows variable on assets (similarly, the
two-stage method is used for consumption and expenditure below). One requirement for this
analysis is the identification of variables that may affect adoption intensity but not impact. This
is not easy to do from a theoretical point of view because adoption and impact on assets are very
closely related. The variables we selected as instruments to explain adoption but not impact
relate to household perceptions of the importance of agro-climatic shocks for the village (the
risks of drought, hail, and pests/diseases perceived prior to the period of study), the father�s farm
size, and the jobs and social positions held by their fathers. We also included whether either of
the adult members of the household had previously held a job in the formal sector.
Results from the non-pilot and pilot villages are given in tables 12 and 13. The use of
improved fallows is not significantly related to asset change in the pilot and non-pilot villages.
The only consistency in results between the two sites is that it was mainly the wealthy who were
most likely to worsen their liquid asset holding situation. In the non-pilot villages, additional
variables positively impacting on asset change were farm size, household size, and education
level of household head. However, none of these were significant in the pilot villages regression
(note, however, that the number of observations in the pilot villages asset analysis was only 97).
The mixed results suggest that there are considerable mitigating factors shaping asset
management strategies of households and that these factors are not easy to discern.

37
Table 12--Econometric results from second stage regression of agroforestry on changes in assets in the non-pilot villages (n=359)
Two-stage Least Squares Tobit / OLS combination Variable Coefficient
estimate Significance
level Coefficient
estimate Significance
level Predicted area under improved fallow
-2090.67 .81 -2902.80 .18
Predicted area under biomass transfer
11522.56 .03 6072.48 .00
Luhya ethnic group -6308.54 .57 -7893.04 .34 Female headed household 1604.48 .76 4433.43 .26 Polygamous male headed household
508.77 .92 2497.60 .54
HH head obtained primary education
9754.96 .07 9352.13 .02
HH head obtained secondary education
17436.74 .01 18919.06 .00
HH head age 112.07 .44 129.43 .21 Household size 1763.52 .05 1735.32 .01 Farm size 1494.70 .02 1652.82 .00 Initial asset wealth -0.9321 .00 -0.9487 .00 Constant -2529.90 .88 9818.23 .44 Adjusted R-Square .698 .835 Note: 8 sub-location dummy variables were included but are not reported in the table. Table 13--Econometric results from second stage regression of agroforestry on changes in
assets in the pilot villages (n=97) Two-stage Least Squares Tobit / OLS combination Variable Coefficient
estimate Significance
level Coefficient
estimate Significance
level Predicted area under improved fallow
3.99 .49 2.89 .55
Predicted area under biomass transfer
-1260.62 .59 -777.09 .70
Luhya ethnic group -3653.86 .17 -3511.64 .13 Female headed household 2326.88 .47 2144.49 .58 HH head obtained primary education
3033.91 .37 3652.72 .31
HH head obtained secondary education
-413.52 .90 122.31 .97
HH head age 2.03 .98 7.80 .09 Household size 699.03 .17 726.37 .16 Farm size -265.80 .73 -301.84 .70 Initial asset wealth -0.3258 .00 -0.3334 .00 Constant -2832.33 .64 -3036.17 .59 Adjusted R-Square .285 .265

38
Effect of improved fallow on expenditure. In this section we examine the effect of the
use of the improved fallow technology on household expenditures. We begin with a brief
description of expenditures and then follow up with econometric analysis. Expenditures were
collected for the pilot village subsample of 103 households both in 1999-2000 and in 2002.
Rommelse (2001b) describes the methods used and presents some empirical results from the
1999-2000 survey. The April 2000 survey matches exactly the time period of the 2002 resurvey
and thus we report on and examine only the expenditures reported at these two visits.
Expenditures were collected on a 3-month recall and therefore we exclude all food expenditures
from this analysis (they are too hard to estimate over 3 months and food consumption is handled
separately below).
We analyzed changes in non-food expenditures per household and also per capita. For
the latter we divided by the number of household members. Mean non-food expenditures in 2000
were $97 while the median was $60, indicating that there are relatively wealthy households
bringing up the mean. The mean level of non-food expenditures rose slightly to $104 over the
period and the median behaved similarly over time. Per capita non-food expenditures, on the
hand, were flat over time with a mean and median of $16 and $10 respectively. However, there
is also a large number of households (44 � 48 percent) experiencing a setback in welfare as
measured by non-food expenditures.
Turning to the econometric analysis (Table 14), the use of improved fallows is not found
to be significantly related to changes in expenditure levels.

39
Table 14--Econometric results from second stage regressions of agroforestry on changes in non-food expenditures and per capita non-food expenditures in the pilot villages (n=102)
Variable
Changes in non-food expenditures per household
Changes in non-food expenditures per capita
Predicted improved fallow area -1.8371 (.793)
-.6042 (.612)
Predicted # seasons with biomass transfer
1987.402 (.323)
443.1089 (.196)
Luhya ethnic group -336.3096 (.865)
15.5879 (.964)
Female headed household 32.0576 (.990)
88.5444 (.839)
HH head obtained primary education
1428.062 (.609)
175.0361 (.717)
HH head obtained secondary education
7529.403 (.008)
1064.504 (.027)
HH head age 77.3741 (.222)
12.7443 (.244)
Household size 54.5092 (.892)
-108.9548 (.115)
Farm size 242.5165 (.666)
66.9287 (.496)
Initial level of expenditures (per household or per capita)
-.7914 (.000)
-.7602 (.000)
Constant -2290.494 (.639)
225.6572 (.788)
Adjusted R-Square .41 .29
Initial level of expenditure is the key conditioning factor and these are found to be negatively
related to change over the period (similar to the asset change regressions). Thus, of the many
declines in expenditures, most are occurring among households who had relatively high
expenditure levels in 2000. In addition, some households with relatively low expenditures in
2000 were able to increase them by 2002.
Effect of improved fallows on food consumption. Food consumption and nutritional
measures were based upon 24-hour recall surveys of households (3 visits in 2000 and 2 visits in
2002) during a relatively hungry period before the long rain harvest. Household level indicators
of intake and nutrition were calculated based on age requirements of consuming members.

40
Nutritional indicators were taken from FAO and USDA sources, depending on which was able to
more accurately reflect the specific type of food consumed (e.g. cooked kales).
The average household scores well in terms of energy, carbohydrates, iron, riboflavin,
and niacin in both years. Much of this comes from maize, as an analysis of baseline data
revealed that maize accounts for 75 percent of total energy. There is some diminished
sufficiency in folic acid in 2002 and there are low levels of protein sufficiency reported in 2002.
But even for those indicators that appear favorable in the aggregate, often there is a large number
of households unable to meet their recommended needs. For instance, in 2002, 42 percent of
households had less than required intake of energy, 53 percent for folic acid, and 73 percent for
protein. It is also interesting to note that there is a general decline in nutritional status over the
two-year period � in fact, none of the variables exhibits improvement over time.
Econometric analyses focused on those that exhibited significant change over time:
energy, protein, iron, and folic acid. These are presented in Table 15.
Table 15--Econometric results from second stage regression of agroforestry use on nutritional measurements (n=102)
Variable Energy Protein Iron Folic Acid Predicted improved fallow area .0471
(.198) .0520 (.231)
.1672 (.101)
.1104 (.172)
Predicted # seasons with biomass transfer
-9.4007 (.383)
-9.8129 (.455)
-33.3081 (.285)
-28.2815 (.240)
Luhya ethnic group 10.3813 (.342)
7.5572 (.577)
1.7205 (.956)
15.7095 (.513)
Female headed household 12.3909 (.401)
1.8963 (.921)
33.0904 (.435)
-5.5660 (.864)
HH head obtained primary education 22.4161 (.144)
23.4920 (.215)
49.7851 (.259)
27.5557 (.432)
HH head obtained secondary education
13.7830 (.353)
14.8131 (.417)
11.6058 (.783)
1.0233 (.975)
HH head age .1173 (.741)
.1814 (.676)
.4492 (.664)
.0225 (.977)
Household size -.8934 (.691)
-.3030 (.915)
-1.4307 (.836)
.4175 (.936)

41
Table 15--Econometric results from second stage regression of agroforestry use on nutritional measurements (n=102) (Continued)
Variable Energy Protein Iron Folic Acid Farm size -4.1624
(.196) -4.1243 (.290)
-11.1446 (.219)
-7.5496 (.279)
Initial level of indicator (energy, protein, iron, or folic acid)
-.9251 (.000)
-.9863 (.000)
-.8796 (.000)
-.9905 (.000)
Constant 85.3049 (.016)
63.3129 (.145)
115.2536 (.220)
99.3109 (.155)
Adjusted R-Square .29 .46 .42 .77
None of the household characteristics, including the improved fallow adoption variable, were
found to be significantly related to changes in food intake and nutritional status. The only
significant variable in each regression was the beginning of period measure of the dependent
variable. In all cases, this was found to be negative, indicating that the households whose
nutritional status fell by larger amounts were mainly those with high initial levels (note that for
decreases in sufficiency levels do not necessarily mean that the household is now facing
nutritional insecurity).
Other economic impacts. In 1999, a village level workshop was held in Siaya District to
discuss the impacts from the use of improved fallows (Place 1999). It was attended by about 60
farmers from 3 surrounding villages. They were asked to discuss impacts, positive and negative,
of the improved fallows at plot and household levels. The socio-economic impacts are discussed
here while the plot level ecological impacts can be found in section 3.4 below.
The first finding from the workshop is that on many farms, the size of plots under
agroforestry system was still small, and therefore, the visible effects at the plot level did not
always translate into significant effects at the household level. Another effect of improved
fallows is on labor. Households like improved fallows because they save labor on an annual
basis (Swinkels et al. 1997), and labor for land preparation can be saved because soils are easier

42
to work with following an improved fallow. The saving in labor combined with greater
productivity leads to the significantly higher returns to labor from improved fallows compared to
the situation of continuous cropping with no nutrient inputs. A fertilizer strategy is superior in
terms of returns to labor, but this is of course not a feasible option for the poor households. One
indirect effect on labor is that money saved from reduced food purchases can be used to hire
additional labor or oxen plough to allow for more timely land preparation. It was felt that the
introduction of the systems have led to more labor demand at the village level simply because of
the promise of better returns.
Social impacts
Findings from focus groups discussions and individual case studies further show that the
various soil fertility replenishment technologies have given some members of the community
some amount of social capital, especially in terms of their being seen as successful farmers and
people who attract visitors from �far away� (Omosa et al. 2002). Indeed, some of these visits
have been so eventful that several families have named their children after these personalities.
On the other hand, it is evident from some of the case studies that the decision to adopt or not to
adopt has brought about disagreements, some of them at the level of the family unit. In one
particular case, both the husband and wife pursue different farming practices just because they
would like to be different and even be seen to be pursuing different styles. In this particular case,
it was the man that came into contact with the agroforestry technologies and because he had been
a drunkard and with low social esteem within his community, the wife was not convinced that
his farm practices were anything to emulate. Instead, she viewed them as a continuation and
probably even a perpetuation of his wayward ways. In many ways therefore, the introduction of
these agroforestry technologies has resulted in status inversion. This particular farmer is now a

43
point of reference when it comes to describing a farmer that has adopted the ICRAF technologies
successfully. However, the information gathered thus far does not show whether there is an
emerging common identity amongst the adopters.
At the 1999 village workshop, there was some discussion about husband-wife relations.
It was noted that with increased yields some of the men were taking a greater interest in the farm
and putting in more labor. Increased job satisfaction was noted. With some positive outcomes,
others noted a reduction in domestic violence. On the other hand, there are cases where wives
may be trying the new practice on �their� plot while the husband does not and this was noted to
create more domestic problems. Related to this was a feeling of more food security on the part
of households. Some participants mentioned that there was better health and nutrition among the
children and that they were less likely to miss school.
The 1999 village workshop also revealed a greater sense of unity and togetherness and
that communication among households has increased. There is greater networking between
different organizations and between different villages. Villagers in the pilot areas felt that they
have helped to enhance adoption of the agroforestry practices in other villages. There was a
noted increase in capacity building. Farmers� understanding of their soils and options for
improvement has been greatly enhanced and this has given them greater confidence to engage
extension, NGOs, and other technical persons for assistance. One negative effect of the fallow
systems noted was that the bushy fallows could become hiding places for wildcats or thugs.
There was an echo of the concern about the communication mechanism between ICRAF and the
village whereby certain contact farmers were not representing the interests of the wider
community.

44
ECOLOGICAL IMPACTS
From the village workshop, the main benefits from improved fallows at the plot level are:
improved maize crop performance, increased soil organic matter, improved color of soil, and
elimination of serious weed. This was confirmed by a formal survey of farmers who also
mentioned wood production and soil erosion control as other ecological benefits (De Wolf and
Rommelse 2000). They assessed or likened soil organic matter by the ease of working soils.
They insisted that soil color has changed in some plots even after one fallow due to high litter
fall from the fallow species. In this particular aspect, Crotalaria grahamiana performed well
and was able to smother all weeds. Farmers in the non-pilot villages were asked in the formal
survey whether their soil fertility has decreased, increased, or remained the same between 1997
and 2001. These responses were then compared to the use of improved fallows. Of improved
fallow users, 35.1 percent said that their soils had improved, while only 16.9 percent of non-
users reported increased soil fertility. In turn, soil fertility change is strongly linked to maize
yield change.
As for negative aspects, the main issue is with pests. The farmers have noted that
Crotalaria, while being the highest biomass producer can also attract pests. One is a caterpillar
that invaded the village in 1997-98. This pest eats the green vegetation of Crotalaria
grahamiana (not other Crotalaria spp) but not other plants. The sheer number of caterpillars and
then butterflies also put fear into some farmers and may cause delayed labor activities. The
second pest that is also associated with Crotalaria grahamiana is the mole. Moles move
underground and eat roots and will also damage food crops. Farmers noted however, that the
moles do not like Tephrosia and an indigenous method is to sow Tephrosia around the
predominantly Crotalaria fallow. A last problem noted concerns the cutting of the more woody

45
species, such as Tephrosia candida, when they are allowed to grow for more than a season. The
removal of stumps was cited as a difficult task but not a major deterrent.
SUMMARY OF IMPACTS
The main findings from the study of the impact of improved fallows on households in
western Kenya are the following:
The poor are adopting SFR strategies at the same rates as the non-poor
Adoption rates are not outstanding but they are encouraging with about 20 percent of all
farmers using improved fallows on a regular basis (a similar percentage among the poor) and a
sizeable percentage of farmers newly testing. This suggests that improved fallows are not biased
towards people controlling and managing resources above a certain threshold.
Adoption at early stage is at low levels of intensity
While an encouraging number of households are using or testing the improved fallows,
the size of plots on which they are applied remain small. It is not yet known whether this is
indeed a ceiling or whether this is a consequence of the early stage of dissemination.
Improved fallows do significantly raise crop yields
Respondents in the case studies and formal surveys consistently report very significant
increases in yields (>150 percent) from the use of improved fallows compared with the
continuous maize cropping system with no nutrient inputs. This is consistent with farmer-
managed trial data.
Improved fallows on their own cannot bring about a turn in poverty reduction.
This conclusion is drawn from the body of impact assessment work. Despite the fact that
improved fallows are being used by a number of poor households and having an impact on
46
yields, its impact at the household level is modest. This is due to the small land sizes under
improved fallows and because the weak rural economy is not conducive for investment and
development. This means that technological innovations alone are likely to have a limited short-
term impact. Poverty alleviation should encompass other sectors as well.
4. RECOMMENDATION DOMAINS
The results from western Kenya show that improved fallows may be viable even in high
population areas. Their potential recommendation domain may therefore be quite large in Sub-
Saharan Africa. Moreover, evidence has indicated that improved fallows are not biased against
the poor or women. Thus, extension agents should have no reservations about disseminating
information about improved fallows as an option for soil fertility management.
There are some situations, however, that would appear to be less suited to improved
fallows. Households that are landless or near-landless are unlikely to be able to leave even
modest areas uncultivated. Small farms located in unimodal rain systems are equally less likely
to set aside land for improved fallows when that would mean foregoing production on that field
for at least one year. In this case, nutrient management systems that enable continuous cropping
are preferred, such as biomass transfer or intercropping systems. Two other agricultural
enterprise systems may compete with improved fallows. The first is intensive livestock
production systems in which case non-cropped land may be put under fodder production. The
second is where perennial cropping systems, e.g. coffee, predominate and offer few niches for
improved fallows.

47
REFERENCES
Argwings-Kodhek, G., T. Jayne, G, Nyambane, T. Awuor, and T. Yamano. 1999. How can micro-level household information make a difference for agricultural policy making? Tegemeo Institute of Agricultural Policy and Development, Kenya Agricultural Research Institute, and Michigan State University. Mimeo.
Desaeger, J. and M.R. Rao. 1999. The root-knot nematode problem is sesbania fallows and scope for managing it in western Kenya. Agroforestry Systems, 47:273-288.
Dewolf, J. and R. Rommelse. 2000. Improved fallow technology in western Kenya: Potential and reception by farmers. Unpublished Mimeo.
Government of Kenya, Ministry of Planning. 2000. Second Report on Poverty in Kenya: Volume 1, Incidence and Depth of Poverty, Nairobi.
Hartemink, A. E., R.J. Buresh, B. Jama, and B.H. Janssen. 1996. Soil nitrate and water dynamics in sesbania fallows, weed fallows and maize. Soil Science Society of America Journal, 60: 568-574.
Jama, B., R.A. Swinkels,. and R.J. Buresh. 1997. Agronomic and economic evaluation of organic and inorganic sources of phosphorus in western Kenya. Agronomy Journal 89:597-604.
Jama, B., A. Niang, J. De Wolf, B. Amadalo, and M.R. Rao. 1998a. Sources of nutrients in nutrient depleted soils of Western Kenya. Proceedings of CIMMYT's Sixth Regional Maize Conference for Eastern and Southern Africa, Addis Abeba, Ethiopia. September 1998.
Jama, B. , R.J. Buresh. and F. Place. 1998b. Sesbania tree fallows on phosphorus-deficient sites: Maize yield and financial benefit. Agronomy Journal, 90 (6): 717-726.
Kwesiga, F. and Coe, R. 1994. The effect of short rotation Sesbania sesban planted fallows on maize yield. Forest and Ecology, 44: 403-428.
Niang, A., B. Amadalo, M. Adongo, and J. De Wolf. 1996. Weed dynamics under improved fallow systems. Poster at the International Symposium on the Science and Practice of Short-Term Improved Fallows in Humid and Sub-Humid Tropics Lilongwe, Malawi. March 11-15.
Niang, A., J. De Wolf, S. Gathumbi, and B. Amadalo. 1999. The Potential of Short Duration Improved Fallow with Selected Trees and Shrubs for Crop Productivity Enhancement in the Densely Populated Highlands of Western Kenya. In: Eds. Ja Jachere en Afrique Tropicale: Roles, Amenagements, Alternatives. Dakar. April 13 -16.

48
Omosa, M., E. Ontita, P. Hebinck, and M. Adato. 2002. The Impact of agro-forestry-based soil fertility replenishment interventions on the poor in western Kenya: Progress report October 2001 � January 2002, Institute of Development Studies, University of Nairobi Mimeo.
Onim, J.F.M. , K. Otieno, and B. Dzowela. 1990. The role of sesbania as multi-purpose tree in small-scale farms in western Kenya. In: Perennial Sesbania Species in Agroforestry Systems. Eds. B. Macklin and D. O. Evans. Proceedings of a workshop held in Nairobi, March 27-31, 1989. The Nitrogen Fixing Tree Association, Hawaii, USA.
Oswald, A., H. Frost, J. Ransom, J.K. Kroschel, K.Shepherd. and D. Sauerborn. 1996. Studies on potential for improved fallow using trees and shrubs to reduce striga infestations in Kenya. Proceedings of the Sixth Parasitic Weed Symposium, Cordoba, Spain. April 16-18.
Pisanelli, A., S. Franzel, J. DeWolf, R. Rommelse, and J. Poole. 2000. Adoption of improved tree fallows in Western Kenya: Farmer practices, knowledge and perception. Nairobi, Kenya: International Centre for Research in Agroforestry.
Place, F. 1999. Village impact assessment workshop for agroforestry-based soil fertility replenishment practices in Western Kenya. Nairobi, Kenya: International Centre for Research in Agroforestry.
Place, F., S. Franzel, J. Dewolf, R. Rommelse, F. Kwesiga, A. Niang, and B. Jama. 2002. Agroforestry for soil fertility replenishment: evidence on adoption processes in Kenya and Zambia. Accepted for publication in Natural Resources Management in African agriculture: Understanding and improving current practices, ed. Barrett, C., F. Place, and A. Abdillahi Wallingford, UK: CABI.
Pretty, J. and R. Hine. 2001. Reducing food poverty with sustainable agriculture: A summary of new evidence. Final Report from the SAFE-World Research Project. Colchester, UK: University of Essex.
Reij, C., I. Scoones, and C. Toulmin (eds.). 1996. Sustaining the soil: Indigenous soil and water conservation in Africa. London: Earthscan Publications.
Rommelse, R. 2001a. Economic analyses of on-farm biomass transfer and improved fallow trials in western Kenya. Natural Resources Problems, Priorities, and Policies Working Paper 2001-3. Nairobi, Kenya: International Centre for Research in Agroforestry.
Rommelse, R. 2001b. The impact of improved fallows and biomass transfer on household poverty indicators in western Kenya: Methodology and empirical results from baseline survey. Natural Resources Problems, Priorities, and Policies Working Paper 2001-2. Nairobi, Kenya: International Centre for Research in Agroforestry.

49
Sanchez, P. A., et al. 1997. Soil Fertility Replenishment in Africa: An Investment in Natural Resource Capital. In Replenishing soil fertility in Africa, SSSA Special Publication No. 51:1-46. Madison, Wisconsin: Soil Science Society of America.
Shepherd, K. D., E. Ohlsson, J.R. Okalebo, and J.K. Ndufa. 1996. Potential impact of agroforestry on soil nutrient balances at the farm scale in the East African highlands. Fertilizer Research, 44:87-99.
Swinkels, R., S. Franzel, K.D. Shepherd, E. Ohlsson, J.K. Ndufa. 1997. The economics of short rotation improved fallows: Evidence from areas of high population density in western Kenya. Agricultural Systems, 55: 99-121.
Tutui, N. 2002. Monitoring and evaluation of improved fallows and biomass transfer dissemination in western Kenya. Nairobi, Kenya: International Centre for Research in Agroforestry. Mimeo.
Wangila, J., R. Rommelse, and J. De Wolf. 1999. An insight into the socioeconomics of agroforestry client-farmers in western Kenya. Pilot Project Report No. 12. Nairobi, Kenya: International Centre for Research in Agroforestry.

EPTD DISCUSSION PAPERS
LIST OF EPTD DISCUSSION PAPERS
01 Sustainable Agricultural Development Strategies in Fragile Lands, by Sara J. Scherr and Peter B.R. Hazell, June 1994.
02 Confronting the Environmental Consequences of the Green Revolution in Asia, by Prabhu L. Pingali and Mark W. Rosegrant, August 1994.
03 Infrastructure and Technology Constraints to Agricultural Development in the Humid and Subhumid Tropics of Africa, by Dunstan S.C. Spencer, August 1994.
04 Water Markets in Pakistan: Participation and Productivity, by Ruth Meinzen-Dick and Martha Sullins, September 1994.
05 The Impact of Technical Change in Agriculture on Human Fertility: District-level Evidence From India, by Stephen A. Vosti, Julie Witcover, and Michael Lipton, October 1994.
06 Reforming Water Allocation Policy Through Markets in Tradable Water Rights: Lessons from Chile, Mexico, and California, by Mark W. Rosegrant and Renato Gazri S, October 1994.
07 Total Factor Productivity and Sources of Long-Term Growth in Indian Agriculture, by Mark W. Rosegrant and Robert E. Evenson, April 1995.
08 Farm-Nonfarm Growth Linkages in Zambia, by Peter B.R. Hazell and Behjat Hoijati, April 1995.
09 Livestock and Deforestation in Central America in the 1980s and 1990s: A Policy Perspective, by David Kaimowitz (Interamerican Institute for Cooperation on Agriculture. June 1995.
10 Effects of the Structural Adjustment Program on Agricultural Production and Resource Use in Egypt, by Peter B.R. Hazell, Nicostrato Perez, Gamal Siam, and Ibrahim Soliman, August 1995.
11 Local Organizations for Natural Resource Management: Lessons from Theoretical and Empirical Literature, by Lise Nordvig Rasmussen and Ruth Meinzen-Dick, August 1995.

EPTD DISCUSSION PAPERS
12 Quality-Equivalent and Cost-Adjusted Measurement of International Competitiveness in Japanese Rice Markets, by Shoichi Ito, Mark W. Rosegrant, and Mercedita C. Agcaoili-Sombilla, August 1995.
13 Role of Inputs, Institutions, and Technical Innovations in Stimulating Growth in Chinese Agriculture, by Shenggen Fan and Philip G. Pardey, September 1995.
14 Investments in African Agricultural Research, by Philip G. Pardey, Johannes Roseboom, and Nienke Beintema, October 1995.
15 Role of Terms of Trade in Indian Agricultural Growth: A National and State Level Analysis, by Peter B.R. Hazell, V.N. Misra, and Behjat Hoijati, December 1995.
16 Policies and Markets for Non-Timber Tree Products, by Peter A. Dewees and Sara J. Scherr, March 1996.
17 Determinants of Farmers� Indigenous Soil and Water Conservation Investments in India�s Semi-Arid Tropics, by John Pender and John Kerr, August 1996.
18 Summary of a Productive Partnership: The Benefits from U.S. Participation in the CGIAR, by Philip G. Pardey, Julian M. Alston, Jason E. Christian, and Shenggen Fan, October 1996.
19 Crop Genetic Resource Policy: Towards a Research Agenda, by Brian D. Wright, October 1996.
20 Sustainable Development of Rainfed Agriculture in India, by John M. Kerr, November 1996.
21 Impact of Market and Population Pressure on Production, Incomes and Natural Resources in the Dryland Savannas of West Africa: Bioeconomic Modeling at the Village Level, by Bruno Barbier, November 1996.
22 Why Do Projections on China�s Future Food Supply and Demand Differ? by Shenggen Fan and Mercedita Agcaoili-Sombilla, March 1997.
23 Agroecological Aspects of Evaluating Agricultural R&D, by Stanley Wood and Philip G. Pardey, March 1997.
24 Population Pressure, Land Tenure, and Tree Resource Management in Uganda, by Frank Place and Keijiro Otsuka, March 1997.

EPTD DISCUSSION PAPERS
25 Should India Invest More in Less-favored Areas? by Shenggen Fan and Peter Hazell, April 1997.
26 Population Pressure and the Microeconomy of Land Management in Hills and Mountains of Developing Countries, by Scott R. Templeton and Sara J. Scherr, April 1997.
27 Population Land Tenure and Natural Resource Management: The Case of Customary Land Area in Malawi, by Frank Place and Keijiro Otsuka, April 1997.
28 Water Resources Development in Africa: A Review and Synthesis of Issues, Potentials, and Strategies for the Future, by Mark W. Rosegrant and Nicostrato D. Perez, September 1997.
29 Financing Agricultural R&D in Rich Countries: What�s Happening and Why? by Julian M. Alston, Philip G. Pardey, and Vincent H. Smith, September 1997.
30 How Fast Have China�s Agricultural Production and Productivity Really Been Growing? by Shenggen Fan, September 1997.
31 Does Land Tenure Insecurity Discourage Tree Planting? Evolution of Customary Land Tenure and Agroforestry Management in Sumatra, by Keijiro Otsuka, S. Suyanto, and Thomas P. Tomich, December 1997.
32 Natural Resource Management in the Hillsides of Honduras: Bioeconomic Modeling at the Micro-Watershed Level, by Bruno Barbier and Gilles Bergeron, January 1998.
33 Government Spending, Growth, and Poverty: An Analysis of Interlinkages in Rural India, by Shenggen Fan, Peter Hazell, and Sukhadeo Thorat, March 1998. Revised December 1998.
34 Coalitions and the Organization of Multiple-Stakeholder Action: A Case Study of Agricultural Research and Extension in Rajasthan, India, by Ruth Alsop, April 1998.
35 Dynamics in the Creation and Depreciation of Knowledge and the Returns to Research, by Julian Alston, Barbara Craig, and Philip Pardey, July, 1998.
36 Educating Agricultural Researchers: A Review of the Role of African Universities, by Nienke M. Beintema, Philip G. Pardey, and Johannes Roseboom, August 1998.

EPTD DISCUSSION PAPERS
37 The Changing Organizational Basis of African Agricultural Research, by Johannes Roseboom, Philip G. Pardey, and Nienke M. Beintema, November 1998.
38 Research Returns Redux: A Meta-Analysis of the Returns to Agricultural R&D, by Julian M. Alston, Michele C. Marra, Philip G. Pardey, and T.J. Wyatt, November 1998.
39 Technological Change, Technical and Allocative Efficiency in Chinese Agriculture: The Case of Rice Production in Jiangsu, by Shenggen Fan, January 1999.
40 The Substance of Interaction: Design and Policy Implications of NGO-Government Projects in India, by Ruth Alsop with Ved Arya, January 1999.
41 Strategies for Sustainable Agricultural Development in the East African Highlands, by John Pender, Frank Place, and Simeon Ehui, April 1999.
42 Cost Aspects of African Agricultural Research, by Philip G. Pardey, Johannes Roseboom, Nienke M. Beintema, and Connie Chan-Kang, April 1999.
43 Are Returns to Public Investment Lower in Less-favored Rural Areas? An Empirical Analysis of India, by Shenggen Fan and Peter Hazell, May 1999.
44 Spatial Aspects of the Design and Targeting of Agricultural Development Strategies, by Stanley Wood, Kate Sebastian, Freddy Nachtergaele, Daniel Nielsen, and Aiguo Dai, May 1999.
45 Pathways of Development in the Hillsides of Honduras: Causes and Implications for Agricultural Production, Poverty, and Sustainable Resource Use, by John Pender, Sara J. Scherr, and Guadalupe Durón, May 1999.
46 Determinants of Land Use Change: Evidence from a Community Study in Honduras, by Gilles Bergeron and John Pender, July 1999.
47 Impact on Food Security and Rural Development of Reallocating Water from Agriculture, by Mark W. Rosegrant and Claudia Ringler, August 1999.
48 Rural Population Growth, Agricultural Change and Natural Resource Management in Developing Countries: A Review of Hypotheses and Some Evidence from Honduras, by John Pender, August 1999.
49 Organizational Development and Natural Resource Management: Evidence from Central Honduras, by John Pender and Sara J. Scherr, November 1999.

EPTD DISCUSSION PAPERS
50 Estimating Crop-Specific Production Technologies in Chinese Agriculture: A Generalized Maximum Entropy Approach, by Xiaobo Zhang and Shenggen Fan, September 1999.
51 Dynamic Implications of Patenting for Crop Genetic Resources, by Bonwoo Koo and Brian D. Wright, October 1999.
52 Costing the Ex Situ Conservation of Genetic Resources: Maize and Wheat at CIMMYT, by Philip G. Pardey, Bonwoo Koo, Brian D. Wright, M. Eric van Dusen, Bent Skovmand, and Suketoshi Taba, October 1999.
53 Past and Future Sources of Growth for China, by Shenggen Fan, Xiaobo Zhang, and Sherman Robinson, October 1999.
54 The Timing of Evaluation of Genebank Accessions and the Effects of Biotechnology, by Bonwoo Koo and Brian D. Wright, October 1999.
55 New Approaches to Crop Yield Insurance in Developing Countries, by Jerry Skees, Peter Hazell, and Mario Miranda, November 1999.
56 Impact of Agricultural Research on Poverty Alleviation: Conceptual Framework with Illustrations from the Literature, by John Kerr and Shashi Kolavalli, December 1999.
57 Could Futures Markets Help Growers Better Manage Coffee Price Risks in Costa Rica? by Peter Hazell, January 2000.
58 Industrialization, Urbanization, and Land Use in China, by Xiaobo Zhang, Tim Mount, and Richard Boisvert, January 2000.
59 Water Rights and Multiple Water Uses: Framework and Application to Kirindi Oya Irrigation System, Sri Lanka, by Ruth Meinzen-Dick and Margaretha Bakker, March 2000.
60 Community natural Resource Management: The Case of Woodlots in Northern Ethiopia, by Berhanu Gebremedhin, John Pender and Girmay Tesfaye, April 2000.
61 What Affects Organization and Collective Action for Managing Resources? Evidence from Canal Irrigation Systems in India, by Ruth Meinzen-Dick, K.V. Raju, and Ashok Gulati, June 2000.

EPTD DISCUSSION PAPERS
62 The Effects of the U.S. Plant Variety Protection Act on Wheat Genetic Improvement, by Julian M. Alston and Raymond J. Venner, May 2000.
63 Integrated Economic-Hydrologic Water Modeling at the Basin Scale: The Maipo River Basin, by M. W. Rosegrant, C. Ringler, DC McKinney, X. Cai, A. Keller, and G. Donoso, May 2000.
64 Irrigation and Water Resources in Latin America and he Caribbean: Challenges and Strategies, by Claudia Ringler, Mark W. Rosegrant, and Michael S. Paisner, June 2000.
65 The Role of Trees for Sustainable Management of Less-favored Lands: The Case of Eucalyptus in Ethiopia, by Pamela Jagger & John Pender, June 2000.
66 Growth and Poverty in Rural China: The Role of Public Investments, by Shenggen Fan, Linxiu Zhang, and Xiaobo Zhang, June 2000.
67 Small-Scale Farms in the Western Brazilian Amazon: Can They Benefit from Carbon Trade? by Chantal Carpentier, Steve Vosti, and Julie Witcover, September 2000.
68 An Evaluation of Dryland Watershed Development Projects in India, by John Kerr, Ganesh Pangare, Vasudha Lokur Pangare, and P.J. George, October 2000.
69 Consumption Effects of Genetic Modification: What If Consumers Are Right? by Konstantinos Giannakas and Murray Fulton, November 2000.
70 South-North Trade, Intellectual Property Jurisdictions, and Freedom to Operate in Agricultural Research on Staple Crops, by Eran Binenbaum, Carol Nottenburg, Philip G. Pardey, Brian D. Wright, and Patricia Zambrano, December 2000.
71 Public Investment and Regional Inequality in Rural China, by Xiaobo Zhang and Shenggen Fan, December 2000.
72 Does Efficient Water Management Matter? Physical and Economic Efficiency of Water Use in the River Basin, by Ximing Cai, Claudia Ringler, and Mark W. Rosegrant, March 2001.
73 Monitoring Systems for Managing Natural Resources: Economics, Indicators and Environmental Externalities in a Costa Rican Watershed, by Peter Hazell, Ujjayant Chakravorty, John Dixon, and Rafael Celis, March 2001.
74 Does Quanxi Matter to NonFarm Employment? by Xiaobo Zhang and Guo Li, June 2001.

EPTD DISCUSSION PAPERS
75 The Effect of Environmental Variability on Livestock and Land-Use Management: The Borana Plateau, Southern Ethiopia, by Nancy McCarthy, Abdul Kamara, and Michael Kirk, June 2001.
76 Market Imperfections and Land Productivity in the Ethiopian Highlands, by Stein Holden, Bekele Shiferaw, and John Pender, August 2001.
77 Strategies for Sustainable Agricultural Development in the Ethiopian Highlands, by John Pender, Berhanu Gebremedhin, Samuel Benin, and Simeon Ehui, August 2001.
78 Managing Droughts in the Low-Rainfall Areas of the Middle East and North Africa: Policy Issues, by Peter Hazell, Peter Oram, Nabil Chaherli, September 2001.
79 Accessing Other People�s Technology: Do Non-Profit Agencies Need It? How To Obtain It, by Carol Nottenburg, Philip G. Pardey, and Brian D. Wright, September 2001.
80 The Economics of Intellectual Property Rights Under Imperfect Enforcement: Developing Countries, Biotechnology, and the TRIPS Agreement, by Konstantinos Giannakas, September 2001.
81 Land Lease Markets and Agricultural Efficiency: Theory and Evidence from Ethiopia, by John Pender and Marcel Fafchamps, October 2001.
82 The Demand for Crop Genetic Resources: International Use of the U.S. National Plant Germplasm System, by M. Smale, K. Day-Rubenstein, A. Zohrabian, and T. Hodgkin, October 2001.
83 How Agricultural Research Affects Urban Poverty in Developing Countries: The Case of China, by Shenggen Fan, Cheng Fang, and Xiaobo Zhang, October 2001.
84 How Productive is Infrastructure? New Approach and Evidence From Rural India, by Xiaobo Zhang and Shenggen Fan, October 2001.
85 Development Pathways and Land Management in Uganda: Causes and Implications, by John Pender, Pamela Jagger, Ephraim Nkonya, and Dick Sserunkuuma, December 2001.
86 Sustainability Analysis for Irrigation Water Management: Concepts, Methodology, and Application to the Aral Sea Region, by Ximing Cai, Daene C. McKinney, and Mark W. Rosegrant, December 2001.

EPTD DISCUSSION PAPERS
87 The Payoffs to Agricultural Biotechnology: An Assessment of the Evidence, by Michele C. Marra, Philip G. Pardey, and Julian M. Alston, January 2002.
88 Economics of Patenting a Research Tool, by Bonwoo Koo and Brian D. Wright, January 2002.
89 Assessing the Impact of Agricultural Research On Poverty Using the Sustainable Livelihoods Framework, by Michelle Adato and Ruth Meinzen-Dick, March 2002.
90 The Role of Rainfed Agriculture in the Future of Global Food Production, by Mark Rosegrant, Ximing Cai, Sarah Cline, and Naoko Nakagawa, March 2002.
91 Why TVEs Have Contributed to Interregional Imbalances in China, by Junichi Ito, March 2002.
92 Strategies for Stimulating Poverty Alleviating Growth in the Rural Nonfarm Economy in Developing Countries, by Steven Haggblade, Peter Hazell, and Thomas Reardon, July 2002.
93 Local Governance and Public Goods Provisions in Rural China, by Xiaobo Zhang, Shenggen Fan, Linxiu Zhang, and Jikun Huang, July 2002.
94 Agricultural Research and Urban Poverty in India, by Shenggen Fan, September 2002.
95 Assessing and Attributing the Benefits from Varietal Improvement Research: Evidence from Embrapa, Brazil, by Philip G. Pardey, Julian M. Alston, Connie Chan-Kang, Eduardo C. Magalhães, and Stephen A. Vosti, August 2002.
96 India�s Plant Variety and Farmers� Rights Legislation: Potential Impact on Stakeholders Access to Genetic Resources, by Anitha Ramanna, January 2003.
97 Maize in Eastern and Southern Africa: Seeds of Success in Retrospect, by Melinda Smale and Thom Jayne, January 2003.
98 Alternative Growth Scenarios for Ugandan Coffee to 2020, by Liangzhi You and Simon Bolwig, February 2003.
99 Public Spending in Developing Countries: Trends, Determination, and Impact, by Shenggen Fan and Neetha Rao, March 2003.

EPTD DISCUSSION PAPERS
100 The Economics of Generating and Maintaining Plant Variety Rights in China, by Bonwoo Koo, Philip G. Pardey, Keming Qian, and Yi Zhang, February 2003.
101 Impacts of Programs and Organizations on the Adoption of Sustainable Land Management Technologies in Uganda, Pamela Jagger and John Pender, March 2003.
102 Productivity and Land Enhancing Technologies in Northern Ethiopia: Health, Public Investments, and Sequential Adoption, Lire Ersado, Gregory Amacher, and Jeffrey Alwang, April 2003.
103 Animal Health and the Role of Communities: An Example of Trypanasomosis Control Options in Uganda, by Nancy McCarthy, John McDermott, and Paul Coleman, May 2003.
104 Determinantes de Estrategias Comunitarias de Subsistencia y el uso de Prácticas Conservacionistas de Producción Agrícola en las Zonas de Ladera en Honduras, Hans G.P. Jansen, Angel Rodríguez, Amy Damon, y John Pender, Juno 2003.
105 Determinants of Cereal Diversity in Communities and on Household Farms of the Northern Ethiopian Highlands, by Samuel Benin, Berhanu Gebremedhin, Melinda Smale, John Pender, and Simeon Ehui, June 2003.
106 Demand for Rainfall-Based Index Insurance: A Case Study from Morocco, by Nancy McCarthy, July 2003.
107 Woodlot Devolution in Northern Ethiopia: Opportunities for Empowerment, Smallholder Income Diversification, and Sustainable Land Management, by Pamela Jagger, John Pender, and Berhanu Gebremedhin, September 2003.
108 Conservation Farming in Zambia, by Steven Haggblade, October 2003.
109 National and International Agricultural Research and Rural Poverty: The Case of Rice Research in India and China, by Shenggen Fan, Connie Chan-Kang, Keming Qian, and K. Krishnaiah, September 2003.
110 Rice Research, Technological Progress, and Impacts on the Poor: The Bangladesh Case (Summary Report), by Mahabub Hossain, David Lewis, Manik L. Bose, and Alamgir Chowdhury, October 2003.

EPTD DISCUSSION PAPERS
111 Impacts of Agricultural Research on Poverty: Findings of an Integrated Economic and Social Analysis, by Ruth Meinzen-Dick, Michelle Adato, Lawrence Haddad, and Peter Hazell, October 2003.
112 An Integrated Economic and Social Analysis to Assess the Impact of Vegetable and Fishpond Technologies on Poverty in Rural Bangladesh, by Kelly Hallman, David Lewis, and Suraiya Begum, October 2003.
113 Public-Private Partnerships in Agricultural Research: An Analysis of Challenges Facing Industry and the Consultative Group on International Agricultural Research, by David J. Spielman and Klaus von Grebmer, January 2004.
114 The Emergence and Spreading of an Improved Traditional Soil and Water Conservation Practice in Burkina Faso, by Daniel Kaboré and Chris Reij, February 2004.