Street Racing By: Danny Aquino 2000 Civic Si 2000 Civic Si 2000 Civic Si 2000 Civic Si.

1
Familism, Social Capital and Civic Culture: A Multifaceted Test of Survey Data in Eleven Asian Societies
Zong-Rong Lee and Hsin-Huang Michael Hsiao
Institute of Sociology Academia Sinica
1 Introduction Over the last two decades or so, scholars of political science and sociology have witnessed a new spark of interest in the concept of social capital, particularly in its proactive role in maintaining the operation of Western democracies as well as its recent decline. One key common inquiry among the diverse threads of the literature is the determinants and consequences of social capital, and its broader implications for a large number of diverse phenomena – from the sustained prosperity of regional economies (such as the case of newly industrializing economies of East Asia) to the stability of established democracies, as well as the role political culture and active citizenry plays in consolidating its function. Indeed, just as reviewers of the literature have pointed out, studies on social capital and political culture have continuously generated intriguing empirical studies not to mention heated debate such that its appeal to the scholarly community seems unlikely to wane in the near future (Newton 2007; Jackman and Miller 1998). In this paper we hope to join this growing line of studies but from the peculiar angle of the cultural experience of Asia; specifically, we examine how familism has been associated with social capital and civic culture in major Asian societies. While the core principle underpinning social capital is general trust and the broader communal norms that sustain associational life and confer collective benefits for one and all, familism has been used to describe a cultural norm specifically characterized by the prominence of parochial family bonds above all other social loyalties. The concept of social capital is distinctively different from that of familism, and the two are intuitively antithetical. Nevertheless, empirical studies on the connection between the two are rare and have only recently attracted scholarly attention. We consider our study a timely response to the recent development of literature in this field as the cultural tradition of familism in Asia is as resilient as its recent striding progress in economic, political and social lives, and yet its influence on social capital and civic culture is still vaguely understood.
2
Our study follows Edward Banfield’s (1958) lead and also current scholarly
interest in the connection between familism and civic culture, and hopes to conduct a multifaceted and systematic test of Banfield’s thesis in Asia region. Empirically, we examine several dimensions related to social capital and civic culture that may be associated with the influence of familism. The major questions being asked are as follows: 1. Will familism impede the generation of general trust (and hence social capital) in Asia just as theory suggests? Will it also hinder Asian citizenry’s confidence in public and private institutions that are deemed as the modern pillars of political progress and economic prosperity? 2. Will familism in Asia have an impact on Asian citizenry’s confidence in political processes? Will it also influence their tactical choices of political action when faced with bureaucratic procedures that more than often fail to deliver efficiency and fairness? 3. Will familism also influence individuals’ collective sentiments such as national pride or ideological preference related to economic inequality?
In the following presentation we firstly review major theoretical arguments connecting familism and social capital, and derive an empirical hypothesis accordingly. Our major thesis is that familism is a kin-centered particularism that implies weak voluntary associations, lack of civicness, and a void of interpersonal and institutional trust. It will not only compel a particularistic kind of political action to get by bureaucratic rules via personal tactics, but also impede the fostering of a collective identity such as the sentiment of national pride. In other words, familism will be negatively related to the generation of social capital and civic culture. We test this thesis by examining data from eleven major Asian societies collated through an AsiaBarometer survey, and provide empirical evidence that substantiates our argument. 2. Familism, Social Capital, and Civic Culture In its classical definition of social capital, late sociologist James S. Coleman (1988) considered social capital as a form of obligations and expectations which usually depend on trustworthiness of the social environment and norms accompanied by sanctions. Central aspects are trust and social networks, and resulting public goods shared by community. Recent treatment of social capital has drawn a strong connection to political culture. For example, Putnam (1995) and Inglehart (1997) have defined social capital as a culture of trust and tolerance, and extensive networks of voluntary associations through which shared interests can be looked after. Both

3
studies can trace their intellectual origins back to Weber, Banfield (1958), and Amond & Verba (1963). In Almond and Verba’s (1963) now classic treatment of civic culture, which suggested that engagement in cooperative activity within the political processes might develop more fully as individuals discover among themselves “a set of social values that stress cooperative behavior” (p. 284). In this seminal study, civic culture encompasses values and attitudes that support the functioning of a participatory democracy. A pluralistic value in essence, it is deemed as “based on communication and persuasion, and a culture of consensus and diversity” (Almond & Verba 1963, p. 8). Accompanying this pluralist attitude is an associational tendency. This tendency toward cooperation is reflected in citizens’ sense of confidence in political systems as well as their tendency to engage in political discussion and participation. Their evidence shows that in both America and Britain, where citizens tend to participate more in political activities, people report engaging in political conversations more often (p. 116). Civic culture is thus created and emerges through a collective bond melded through social interactions and discourse on public affairs.
In a similar vein, Putnam (1993, 2000) regarded associational participation and strong communal properties of trust and reciprocity as prerequisites for local institutional performance. According to his view, the recent decline in civic involvement in the West has resulted in diminished social capital among citizens—with underdeveloped associational life and political participation as its symptoms. Drawing on the Tocqueville tradition, Putnam posited a civic community characterized by active participation in public affairs, a vibrant associational life, horizontal relations of reciprocity and cooperation, as well as mutual trust. Such “civicness” can be broadly regarded as “social capital”, and in Putnam’s theory, is the crucial factor in making democracy work and in fostering economic prosperity.
Contrasting with the idea of civic culture and social capital – in which public trust and associational interactions are emphasized-- familism represents a particularized trust usually bonding close-knit family circles. Fukuyama (1995) argued that familism undermines interpersonal trust. People with strong tendencies toward familism are generally greater disposed to work with the family members, outside their immediate family circle. They will also try to look, on the basis of interpersonal relations, for someone with whom they can form family-like ties, most obviously a blood relation but also individuals in their social networks that share some common traits, such as birthplace and hometown. In other words, a society with a strong cultural tendency toward familism is likely to be organized by networks mediated by certain particularistic affiliations. In essence, familism is a special kind
4
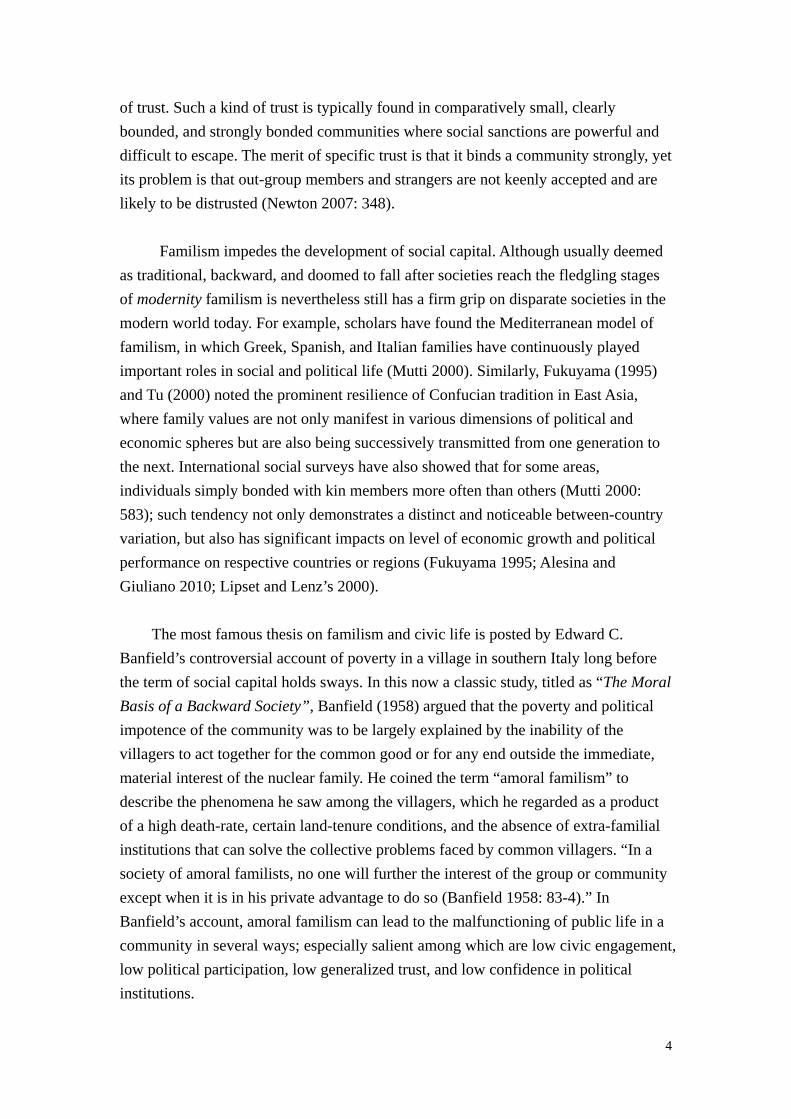
of trust. Such a kind of trust is typically found in comparatively small, clearly bounded, and strongly bonded communities where social sanctions are powerful and difficult to escape. The merit of specific trust is that it binds a community strongly, yet its problem is that out-group members and strangers are not keenly accepted and are likely to be distrusted (Newton 2007: 348).
Familism impedes the development of social capital. Although usually deemed
as traditional, backward, and doomed to fall after societies reach the fledgling stages of modernity familism is nevertheless still has a firm grip on disparate societies in the modern world today. For example, scholars have found the Mediterranean model of familism, in which Greek, Spanish, and Italian families have continuously played important roles in social and political life (Mutti 2000). Similarly, Fukuyama (1995) and Tu (2000) noted the prominent resilience of Confucian tradition in East Asia, where family values are not only manifest in various dimensions of political and economic spheres but are also being successively transmitted from one generation to the next. International social surveys have also showed that for some areas, individuals simply bonded with kin members more often than others (Mutti 2000: 583); such tendency not only demonstrates a distinct and noticeable between-country variation, but also has significant impacts on level of economic growth and political performance on respective countries or regions (Fukuyama 1995; Alesina and Giuliano 2010; Lipset and Lenz’s 2000).
The most famous thesis on familism and civic life is posted by Edward C. Banfield’s controversial account of poverty in a village in southern Italy long before the term of social capital holds sways. In this now a classic study, titled as “The Moral Basis of a Backward Society”, Banfield (1958) argued that the poverty and political impotence of the community was to be largely explained by the inability of the villagers to act together for the common good or for any end outside the immediate, material interest of the nuclear family. He coined the term “amoral familism” to describe the phenomena he saw among the villagers, which he regarded as a product of a high death-rate, certain land-tenure conditions, and the absence of extra-familial institutions that can solve the collective problems faced by common villagers. “In a society of amoral familists, no one will further the interest of the group or community except when it is in his private advantage to do so (Banfield 1958: 83-4).” In Banfield’s account, amoral familism can lead to the malfunctioning of public life in a community in several ways; especially salient among which are low civic engagement, low political participation, low generalized trust, and low confidence in political institutions.

5
Banfield's thesis has been influential and provoked considerable debate about the
nature of ‘familism’ and the general role of culture in impeding or facilitating the functioning of public institutions and modernization; and his arguments have important implications for our concerns. For one thing, systematic examination of his thesis in the context of contemporary Asian societies has been unusual, if ever heard of. A recent endeavor by Alesina and Giuliano (2009) has followed this line of research and tried to investigate the hypothesis put forward by Banfield on European societies. By examining two data sets from World Value Survey (WVS) and European Social Survey (ESS), they established an inverse relationship between family ties and generalized trust. They defined family ties as the belief in the importance of the family in an individual’s life, and the duties and responsibilities of an individual within the family. They found that the more one can trust only family members the lower is generalized trust; in other words strong family ties lead to a reduction in social capital. They also established a negative correlation between the strength of family ties and political participation. Underlining their investigation is the intuition that “the more people rely on the family as a provider of services, insurance, transfer of resources, the lower civic engagement and political participation is. The more the family is all that matters for an individual the less he/she will care about the rest of society or the state (Alesina and Giuliano 2009: 3).”
Although it is evident that familism may have a negative impact on the level of general trust and political participation, it may also hinder the generation of general trust and confidence in institutions as well as the confidence of citizenry in playing a proactive role within political processes. In other words, familism is antithetical to the genesis of a healthy civic culture. In Almond and Verba’s famous treaties on civic culture (1963, Ch. 6), they consider the extent to which individuals think they can influence the government and the ways in which they believe they can do so are important elements of civic culture: “if an individual believes he has influence, he is more likely to attempt to use it. A subjectively competent citizen is more likely to be an active citizen (Almond and Verba 1963: 139).” Nevertheless, in Banfield’s account, familism is the most important factor behind the lack of such a civic culture in Southern Italy. In his vivid description of the Metegrano village permeated with amoral familism, behavior took the form of a war of all against all, and the atmosphere filled with pessimism and suspicion, such that formation of locally inspired organizations was almost unimaginable and those introduced by state, Church, and political parties were for all intensive purposes defunct. The only political life to speak of was the routine tasks performed by appointed officials which

6
they were paid to do and who were likely to take bribes when they could get away with it.
Newton and Norris (2000) noted that an erosion of confidence in the major
institutions of society, especially those of a representative democracy, is a far more serious threat to democracy than a loss of trust in other citizens or politicians. Political leaders come and go; yet institutions are mostly large, impersonal, and possess a broad base. The absence of civic competence and a loss of confidence in public institutions may well be better indicators of public disaffection with the modern world, because they are the basic pillars of society (Coleman 1990; Newton and Norris 2000). Such phenomena is related to scholarly studies on how an individual in an “antimodern” society would act to get things done when modern formal organizations often fail to operate impersonally, predictably, and in accordance with the rule of law (Rose 2000). In underdeveloped societies, organizational failure often reflects a combination of complicated regulations and too little adherence to bureaucratic norms. Confronted with this institutional void, individuals mobilize informal networks as the alternatives and thus substitute by their own means for the failure of modern bureaucratic organizations. Salient tactics include trying to personalize relations with impersonal bureaucrats or using connections or bribery in an attempt to get bureaucrats to violate rules (Rose 2000: 155).
Be it the tapping of personalized networks or public corruption, neither transaction can take openly place in public, only trustworthy insiders are allowed access to the network and are entrusted with such responsibilities. Such a situation may be especially salient in a totalitarian society, in which the rule of law usually does not function properly, in such a way that the system unintentionally encourages people to create informal networks, or guanxi, as protection against the state and to influence bureaucratic outcomes (Rose 2000: 166; see also Shih1997). And that’s where familism plays a mediating role. Just as Harris (2007) indicated, public corruption is often gains through fare via the avenues social capital opens up since close social relations create a high level of trust as well as in-group loyalty, which enforces specific reciprocity within the in-group and not extended to outsiders. Similarly, in Lipset and Lenz’s (2000) argument, such malfunctioning of political life is assumed for the large part to be an expression of this cultural particularism—the feeling of obligation to help and to give resources to persons to whom one has a personal obligation, mostly to one’s family above all, but also to friends and close peer groups with whom strong emotional bonds and trust is shared. In their empirical examination of the effect of familism on corruption, Lipset and Lenz found that the

7
countries with a higher score on the familism scale tended to be among the more corrupt. Especially for Asian countries and regions known for a strong cultural tradition of familism, whose scores on corruption are the highest, compared to Scandinavians, which scoring the lowest on the familism scale, are found be the least corrupt (see also Harris 2007).
When a formal organization fails to operate routinely and transparently, individuals may call upon a familistic type of social network to get things done. In principle, such a tactic conflicts with public interest and the rule-abiding ethos of modernity. Moreover, familism may also hinder the fostering of collective sentiments such as national identity or nationalism. Just as Ernest Gellner (1997) noted, passionate identification with a nation is an invention of modernity and a distinctive and corollary feature of recent world which may conflict with the parochial trust bounded with limited circles of family. Although specifically referring to the political allegiances of Chinese people, Fukuyama actually (1995) makes an acute observation about this potentially incongruent coupling between familism and nationalism. Fukuyama noted that in traditional Chinese society, national identity was undergirded by political Confucianism, which laid down a series of obligations to a hierarchy of political authorities culminating with the emperor at its apex. But in Chinese Confucianism, there is no such thing as a universal moral obligation to all human beings as there is in the Christian faith. What political Confucianism has characterized is essentially a political structure usually considered as a “super family” of the Chinese people, with the relationship of the emperor to his people likened to that of a father toward his children. Deep down in the central core of this ethical teaching was apotheosis of the family, and duty to the family trumping all others, including to higher political authorities such as the emperor or the state (Fukuyama 1995: 84). In such a context, “The priority of family in Chinese culture gives an entirely different meaning to nationalism and citizenship. In contrast to China’s neighbors such as Vietnam or Japan, the Chinese sense of national identity is weaker, as are citizenship and public spiritedness (Fukuyama 1995:92)”. Such an observation provides an insightful association between familism and national identity, and from this we conjecture about the negative connection between the two. In other words, individuals with a higher tendency of familism may exhibit a lower level of national identity.
Finally, we consider a possible negative relationship between familism and
equalitarian ideology. Specifically, we suggest that individuals with a stronger tendency of familism are less likely to support measures that may lessen social inequality. This conjecture comes from several sources of observations. First, in
8
societies where familism is prominent, equalitarian ideology is less likely to exist. For example, scholars have found that societies demonstrating strong family ties are characterized by the existence of traditional family solidarity and an unequal division of family work between men and women, and in contrast, societies with weak family ties foster egalitarian gender roles in which men and women participate equally in employment and housework (Esping-Andersen 1999; Alesina and Giuliano 2010). In her study of family control of economies around the world, Fogel (2006) showed that greater oligarchic family control over large corporations is associated with worse social economic outcomes. In such economies, powerful and wealthy families usually benefit from nepotism and political rent-seeking, in securing their rapid expansion and reap lucrative gains in doing so; eventually such measures exacerbate social inequality as well as dampening already slow economic growth. From a broader perspective, market societies where the cultural norm of familism is endemic may become incongruent with the ideology of the welfare state, which does not emphasize gender divisions and for which equality is given preference over the economic growth. 3. Hypotheses
From deliberations on various related literature reviewed above, we derive
several empirical hypotheses about the impacts of familism upon various dimensions of social capital and civic culture: They are:
H1. Other things being equal, people with a stronger tendency of familism are more likely to demonstrate a lower level of generalized trust.
H2. Other things being equal, people with a stronger tendency of familism are more likely to demonstrate a lower level of confidence in public institutions.
H3. Other things being equal, people with a stronger tendency of familism are more likely to demonstrate a lower level of confidence in private and non-profit institutions.
H4. Other things being equal, people with a stronger tendency of familism are more likely to demonstrate a lower level of civic competence.
H5. Other things being equal, people with a stronger tendency of familism are more likely to mobilize particularistic connections for political ends.

9
H6. Other things being equal, people with stronger tendency of familism are more likely to demonstrate lower level of national identity.
H7. Other things being equal, people with stronger tendency of familism are less likely to demonstrate equalitarian ideology.
4 Data and Methodology 4.1 Data Description The data that we use in this study comes from an AsiaBarometer survey conducted by a team led by Takashi Inoguchi at Tokyo University. The survey covered more than thirty countries across Asia from 2003 to 2008; here we only select data relevant to the theoretical concerns of this paper, which are mainly from eleven major East and Southeast Asian countries or regions: China, Hong Kong, India, Indonesia, Japan, Korea, Malaysia, Philippines, Singapore, Taiwan and Thailand. For comparative purposes, we also include two Western countries, Australia and the United States, in our analysis. There are in total thirteen countries reported in our analyses. The survey was conducted during the period 2006-2008. 4.2 Measuring of Familism We measure familism by looking at one variable in the AsiaBarometer Survey that captures respondents’ tendency of employing family members in a hypothetical situation where the respondent’s relative scored marginally less than an unrelated competitor: “in the company's employment examination, a relative of yours got the second highest grade, scoring only marginally less than the candidate with the highest grade. In such a case, which person would you employ?” This variable takes the value of 1 if respondents report “The person with the highest grade”, and 0 if they answer “Your relative.” 4.3 Dependent Variables Generalized Trust One way to measure social capital is to look at the levels at which individuals express general trust. This is now a standardized operationalization of the concept of social capital in most survey studies. We use one standard question about trust to capture this cultural feature and the question is: “generally, do you think

10
people can be trusted or do you think that you can't be too careful in dealing with people (that it pays to be wary of people)?” The answer could be either (1) most people can be trusted, or (2) can't be too careful in dealing with people. We create a dummy variable Trust and code 1 for respondents who take the first answer and 0 otherwise. We expect a negative relationship between the level of general trust and familism. Confidence in Institutions We create two variables that measure the extent to which the respondent shows his/her trust in public institutions as well as private/non-profit institutions. The respondent is asked to: “indicate to what extent [ they] trust the following institutions to operate in the best interests of society”, and the list of indicated institutions includes central government, local government, army, legal system, police, parliament or congress, political party, public education system, public health system, large domestic companies, multinational companies operating in the respondent’s country, trade/labor unions, media, non-governmental organizations, and the World Bank, in total 15 institutions. The answer for each institution could take the following four values: trust a lot (1), trust to a degree (2), don't really trust (3), don't trust at all (4). To be congruent with early studies on political trust (Newton and Norris 2000; Wong, Hisao, and Wan 2009), we create the variable confidence in public institutions by adding the values for the answers given for five public institutions: they are central government, local government, army, legal system, and parliament or congress. And to classify the second variable confidence in private/non-profit institutions we add values answered on public education system, large domestic companies, trade/labor unions, media, non governmental organizations. We reverse the order of the values for each variable, so that the aggregated numbers positive correlate with respondent’s levels of confidence. We expect that familism is negatively related to these two variables. Civic Competence We create a variable of civic competence by measuring respondents’ attitudes toward political participation and perceptions of his/her role within the political process. This variable is directly related to Almond and Verba’s idea of “civic culture”, of which a proactive attitude and citizenry confidence are emphasized within the democratic system. The variable is a composite measure of the following four questions: “Please indicate how much you agree or disagree with each statement: i) citizens have a duty to vote in elections; ii) generally speaking, people like me don't have the power to influence government policy or actions; iii) politics and government are so complicated that sometimes I don't understand what's happening; iv) since so many people vote in elections, it really doesn’t matter whether

11
I vote or not.” For each question, the answer could take the following five values: strongly agree (1), agree (2), neither agree nor disagree (3), disagree (4) and strongly disagree (5). We firstly perform a factor analysis of these four variables and take the value of the principle component from this factor score. We label this new variable as civic competence and its value is related to the proactive tendency of political participation and confidence in his/her role within the political process is indicated. We expect a negative relation between familism and civic competence. Political Favoritism This variable asks the following question: “what should a person who needs a government permit do if the response of the official handling the application is: 'just be patient and wait?” For this hypothetical question, several answers indicate alternative strategies that the respondent may be likely to initiate; these include i) use connections to obtain the permit, ii) accept that nothing can be done, iii) wait and hope that things will work out, iv) write a letter, v) act without a permit, and vi) bribe an official. We create a new variable for respondents who take the first scenario (by using connections in order to obtain the permit). We consider this variable to capture the tendency for respondents to mobilize informal and particularistic ties to get around bureaucratic rules; such tendency, as often indicated in social capital literature, is usually the method of recourse of choice when the organizational rules fail to deliver as they should. We label this variable political favoritism and expect it to be positively associated with familism. Nationalism We create a variable on the collective sentiment of national pride that we term as nationalism. Specifically we use the measure that takes the following question: “how proud are you of being [YOUR COUNTRY'S PEOPLE]?” The answer could be (1) very proud, (2) somewhat proud, (3) not really proud, and (4) not proud at all. We recode the values in reverse order such that a higher value indicates greater level of national pride. We expect a negative relationship between familism and nationalism. Equalitarian Ideology We create this composite variable by taking the principle component from the factor analysis on three related questions: “I am going to read out some statements about the economy. Please indicate how much you agree or disagree with each statement. i) women's employment should be promoted to attain gender equality, ii) it is desirable that people are equal, even if the economy is stagnant, rather than unequal but developing, and iii) it is natural that those who work harder should get more money.” For each question, the answer could take the form of one of the following five values: strongly agree (1), agree (2), neither agree nor disagree (3), disagree (4), and strongly disagree (5). Again, we firstly perform a

12
factor analysis from these three variables and take the value of the principle component from this factor score. We label this variable equalitarian ideology, in which the higher the value, the stronger the support for gender or social equality. We expect familism to be negatively related to this variable. 4.4 Specifications of Empirical Analysis
For empirical analysis, we run a series of regressions using Familism as our major variable of interest. Our estimation also adjusts for different types of dependent variables. For Civic Competence, Confidence in Institutions and Equalitarian Ideology we run OLS regressions; for Nationalism we run an ordered logit regression, and for Generalized Trust and Political Favoritism, we run binary logit regressions. For more details of statistical estimation on categorical variables, please see Long (1997). In the following tables we present the outcomes of our analysis for each individual society as well as for the pooled observations of all eleven societies. We also use several control variables, the choice of which is standard and is consistent with methods used in other relevant literature. Those control variables include gender (male, using female as baseline variable); reported age of the respondent (age); marital status (married, using non-married as baseline), education level (Middle_Education and High_Education, using low education level as baseline); and income level (Middle_Income and High_Income, using low income level as baseline). In order to estimate the impact of the country or regional characteristics on our dependent variables, we include several macro level factors into our regression analyses. We use gross domestic product per capital (GDP) to represent the level of economic growth of each country, and the Gini coefficient to capture the level of social inequality within the particular region. The Gini coefficient is a ratio between 0 and 1, the higher the coefficient the greater the inequality. The numbers are retrieved from World Income Inequality Database. In order to estimate the impact of institutional governance we also include two related variables. The first is one of the more commonly used indicators of political corruption, Transparency International’s Corruption Perceptions Index (CPI). The CPI is scaled from 0 (least corrupt) to 10 (most corrupt). Published by the Freedom House, the Civil Liberty Score (CLS) measures citizens’ level of political freedom. It includes freedom and independence in the media, freedom of speech, assembly, equality under the law, access to an independent, non-discriminatory judiciary, and protection from political terror and unjustified imprisonment. For CLS, each country is rated on a seven-point scale, 1 representing the most free and 7 the least.

13
5. Results We now come to results of the formal analysis of this study. Table 1 shows the sample characteristics of thirteen societies and descriptive statistics of each variable. We include eleven Asian societies, as well as two Western ones (Australia and the United States) for comparative purposes. Tables 2 to 8 are regression analyses on respective dependent variables considered in this paper. From the descriptive statistics we see that on the macro level, Asian citizenry show remarkable differences in familism, social capital, and civic culture. In particular, civic competence, tendency to trust others, and using personal connections to achieve political end are especially divergent in their distribution. Nevertheless, there also seem to be a discernable pattern among these numbers. With the exception of Singapore, the cultural norm of familism is more evident East Asian societies (Hong Kong, Taiwan, China, Korea, and Japan) than in their Southeast Asian counterparts, a finding quite consistent with earlier scholarly observations on the region. Moreover, the difference is also quite distinct for institutional confidence, nationalism, and equalitarian ideology: all of which show a clear difference between these two major clusters. In general, the results for those same variables are lower for East Asian societies (again, except for Singapore) than for Southeast Asian ones.
[Table 1 here]
Tables 2 to 8 are results of regression analyses on the hypothesized association between familism and respective dependent variables that we considered earlier. Except for the variable of general trust, the outcomes generally support our propositions; the variable familism shows significant effect upon six concerned dependent variables in the directions also anticipated. This claim is however in need of one qualification; it holds strongly particularly for data pooled from all eleven societies but not every regression equation performed for each individual society. Moreover, for regressions performed on each individual society, the goodness of fit (in terms of R square or pseudo R square) is by and large quite low. More than often, models based on individual attributes, such as gender, age, education, and income levels, do not even yield any significant impacts for some individual countries. Yet, the explanatory power and goodness of fit become greatly improved, after the data are pooled and additional macro level variables are added. This implies that individual attributes may not be sufficient determinants of concepts like social capital and civic culture are more than often also influenced by macro factors such as level of economic growth and governance qualities.

14
Bearing these general patterns of empirical findings in mind, we now move to
the detailed results of the analysis of each dependent variable. Just as indicated earlier, our analysis in Table 2 shows no impact of familism on generalized trust, neither on an individual society nor region as a whole. This is to our great surprise, however, as the theory of amoral familism proposed by Banfield also puts forward a strong case on the negative association between familism and general social trust. This finding may be attributed to the fact that measures of familism and general trust are all on a personal level and conceptually similar. Trusting family members and “trust in general” are by nature associated in one way or another; as the result, it may become difficult to discern the difference between the two.
[Table 2 here]
Our hypothesis that familism is negatively associated with confidence in institutions is strongly supported by the numbers. Table 3 reports OLS regression on confidence in public institutions and Table 4 in private/non-profit institutions. In pooled data for all eleven societies, the effect of familism is significant and negative in its direction. Individuals that have a stronger inclination toward trusting only family members, tend to demonstrate lower confidence in public institutions (such as government, congress, or legal system etc) as well as in private/non-profit institutions. This association does however not hold for all societies; only India, Malaysia, Philippines, China, and Korea, show such impacts. Interestingly, for Philippines, the direction of the estimated coefficients of familism is positive for two related dependent variables, making Philippines a marked exception. As it is the only society dominated by the Catholic religion in our sample, we suspect that the positive effect of the family on trust in public and private institutions is associated with the prominent and yet associated influence of Catholic Church in both family and political life. Besides, in Table 3 and 4, macro level variables also show a strong impact. In general, societies that are richer (by looking at the level of GDP per capital), have a higher levels of economic inequality (higher Gini coefficient), are relatively free from corruption (higher CPI) or have higher levels of civic liberties (lower CLS score) tend to show higher levels of confidence in formal institutions.
[Table 3 & 4 here] In our previous discussion, we also hypothesized that familism represses
citizenry’s confidence in their engaging in political participation and the processes
15
themselves, and it is generally supported by the numbers in Table 5. As the regression coefficients show, a stronger tendency of familism leads to lower civic competence; the association is very strong for pooled data, as well as for individual societies, such as Indonesia, Hong Kong, and China (on a comparable level, also for the United States). Macro level variables also deliver salient impacts, yet the directions, except for the Gini coefficient, are opposite to the ones we found from previous analyses on confidence in institutions. Higher civic competence is associated with societies that are economically less developed, have less civil liberties, and whose governments are more corrupt.
[Table 5 here]
Will familism also have an impact on the individual’s tendency to utilize personal networks to get by bureaucracy when encountering organizational failure? We hypothesized a positive association of familism with this tendency. Table 6 reports the results from logistic regression and supports our hypothesis. People that have stronger tendency of familism are more likely to try to mobilize personal contacts to get favors when confronted with inefficient government procedures. In the pooled data, the estimated odds ratio of familism are larger than one, indicating a positive association between familism and political favoritism, and the association also holds strongly for societies like Thailand, Taiwan, China, Korea, as well as their western counterpart Australia and the U.S. Individual’s tendency of political favoritism is also influenced by the society he or she lives in; societies that are poorer, more corrupt, economically less equal, and with less civil liberties are more likely to impel their citizens to engage with such particularized political action.
[Table 6 here] And how will familism influence the level of national identity and equalitarian ideology? We expect that familism to have a negative impact on both variables and the results support our conjecture. In Table 7, the estimated odds ratio of familism within pooled data is smaller than one, implying the negative influence of familism on individual’s national sentiment. This association also holds for India, Malaysia, Philippines, and China. In Table 8, estimated regression coefficients show that familism has a negative impact on identification with equalitarian ideology among Asians, also confirming our hypothesis. Although the estimated coefficient of familism is very strong in pooled data for whole region, it only shows significance in India and Indonesia, and the directions are different respectively.

16
[Table 7 & 8 here]
Overall, our hypotheses are confirmed by the regression analysis in all dependent variables, except for trust. Having evaluated from both the significance level and the consistency in the directions of the coefficients, we consider the evidence strong for institutional confidence, political favoritism, and nationalism; and relatively weak for civic competence and equalitarian ideology. Familism does have a negative impact on the genesis of social capital and civic culture as Banfield’s thesis suggested. The influence is significant and consistent, especially for the regression analysis of pooled data from all sampled societies. Our results suggest that macro factors, such as level of economic growth, government corruption or conditions of institutional governance, also have important, if not stronger, impacts on all citizens. In contrast, individual attributes, such as education or income level and so forth, explain only a small proportion of the variance. This is consistent with reviewer’s observation that individual-level studies somehow do not produce robust results that help explain the origins of social or political trust (Newton 2007: 356). Moreover, because individuals in the same society are affected by similar levels of institutional influence, government performance and cultural tradition, variability in the distribution of the estimated coefficients associated with social and political trust tends to be small, unable to generate significant statistical power. This may also explain why in our analysis, for some societies our main independent variable does not deliver a significant impact or does but in the opposite direction, whereas for the pooled data, the effect is usually significant and directionally consistent.
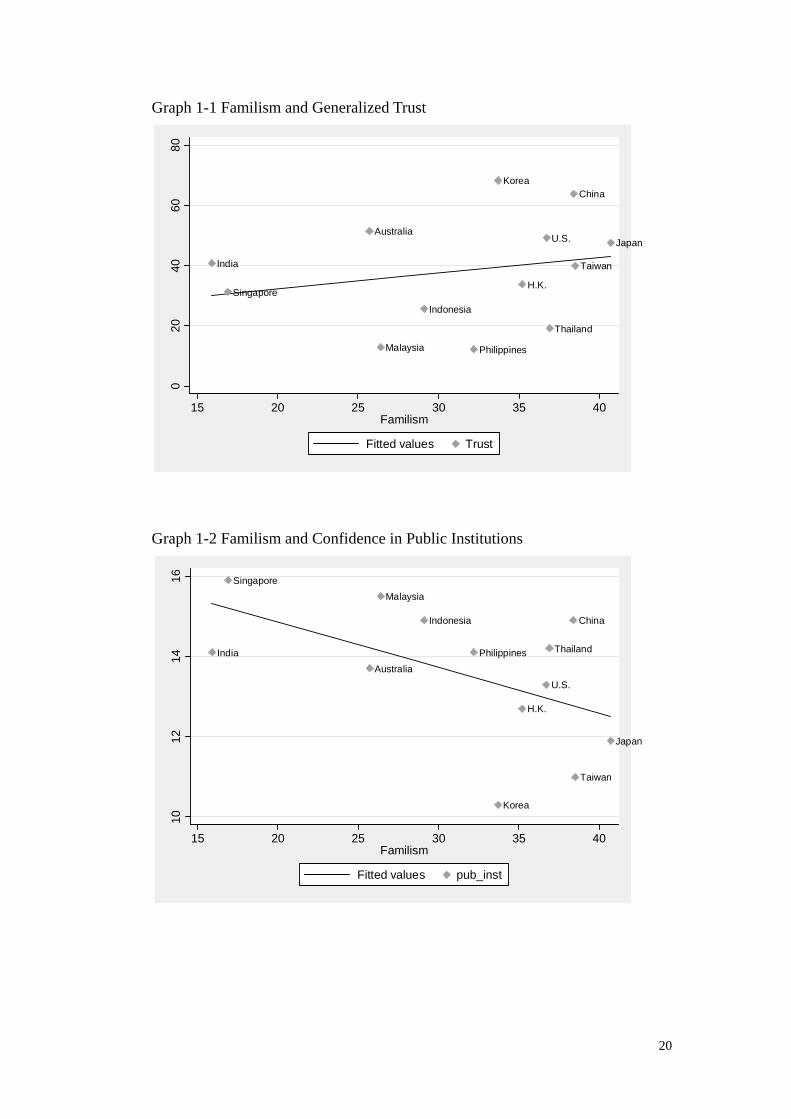
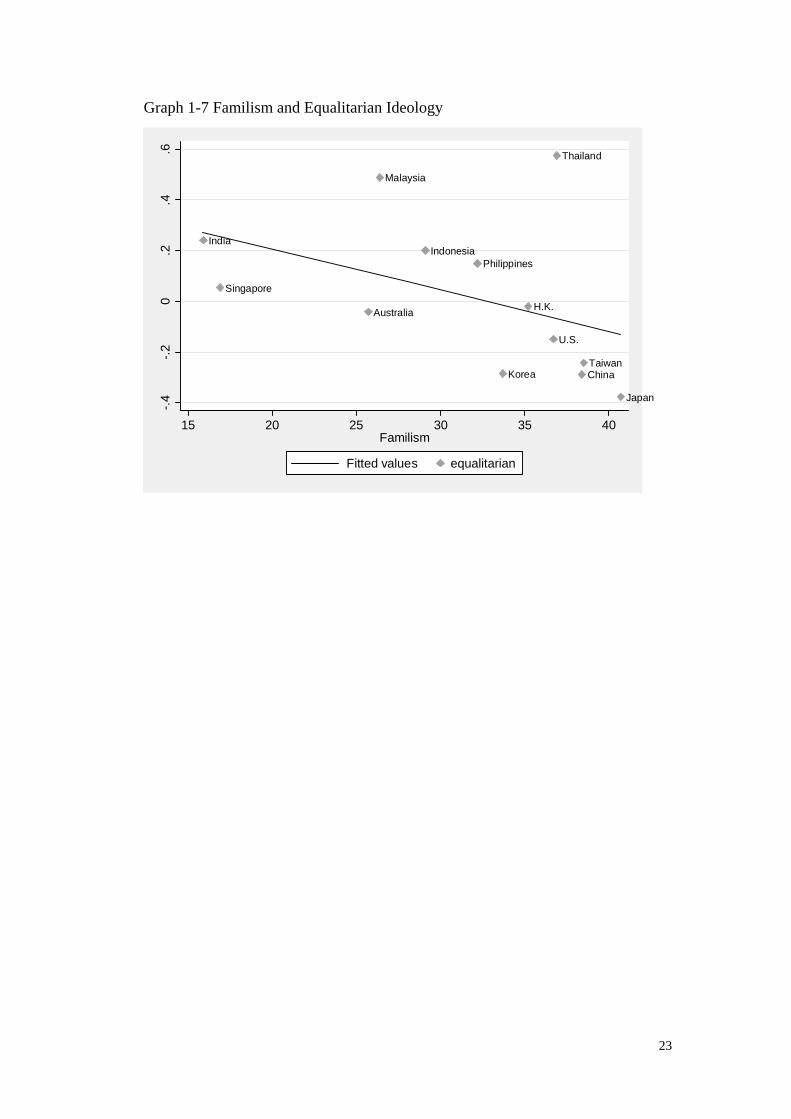
This prompts us to further consider the possibility of testing our proposition from a macro level perspective. For this reason, we provide a simple graphical presentation for relationships between familism and the various dependent variables considered along with the aggregate data. Graphs 1-1 to 1-7 demonstrate these associations accordingly. From these graphs we see a salient negative relationship especially between familism and confidence in public institutions as well as private/non-profit institutions, level of nationalism, and equalitarian ideology (Pearson correlation coefficients are -.54, -.45, -.41and -.44 respectively); associations with civic competence, trust, and favoritism are small and visual inspection reveals a somewhat random distribution of the numbers. Here we have very limited observations (only thirteen societies) and the analysis is exploratory in nature, as a result, we are unable to make strong claim from this simple exercise. Yet, the pattern seems to be clear and consistent; on a global level, familism does have a negative impact on citizenry’s proactive civic culture. Zooming into the details of the graphical presentation we can

17
also reveal additional findings. For example, down in the bottom right corners of Graphs 1-2, 1-3, 1-6, and 1-7, we consistently find the East Asian cluster (i.e., Hong Kong, China, Taiwan, Korea, and Japan) gravitated together with a similar strong tendency toward familism and equally low scores in various aggregated measures on institutional confidence, levels of national pride, and equalitarian ideology. Unlikely to be a coincidence, this distinct pattern confirms a long time scholarly observation of the persistent influence of this cultural norm across the region.
[Graph 1-1 to Graph1-7 here]
6. Conclusion
Our study confirms that familism does lower the level of confidence in public and private institutions, negatively influence attitude toward political processes, increase the likelihood of mobilizing particularistic connection to bypass bureaucracy, inhibit the collective sentiment of national pride as well as remain unsympathetic in the face of ever increasing economic inequality. In a nutshell, our study suggests that familism impedes the development of social capital and civic culture. The observation that Edward Banfield has made from a poor village in Southern Italy more than half century ago seem to resonate with distant Asian cousins. Modern society is based on large-scale, heterogeneous, and impersonal institutions that cannot function on just particularized trust. And just as Inglehart has noted: “People live in the past much more than they realize (Inglehart 1990:422).” Our research suggests that familism is more resilient than we imagined, and its impacts on various dimensions of civic culture are still salient across Asian societies. If Banfield’s thesis is right, a fully modernized Asia cannot possibly be maintained under the conditions of amoral familism and efforts at community improvement and providing of collective goods are doomed to fail unless such ethos is overturned. The influence of familism and the broader implications of such particular cultural expression seem to be worth further scholarly explorations for political scientists and sociologists alike.

18
References Alesina, Alberto, and Paola Giuliano. 2010 "Family Ties and Political Participation."
Journal of the European Economic Association. —. 2010. "The Power of the Family." Journal of Economic Growth 15:93-125. Almond, Gabriel A., and Sidney Verba. 1963. The civic culture; political attitudes
and democracy in five nations. Princeton, N.J.,: Princeton University Press. Banfield, Edward C. 1958. Moral Basis of a Backward Society. Ontario: The Free
Press. Dyer, W. Gibb. 2006. "Examining the Family Effect on Firm Performance." Family
Business Review 19:253-273. Fogel, Kathy. 2006. "Oligarchic family control, social economic outcomes, and the
quality of government." Journal of International Business Studies 37:603-622. Fukuyama, Francis. 1995. Trust : the social virtues and the creation of prosperity.
New York: Free Press. Gellner, Ernest. 1997. Nationalism. London Weidenfeld and Nicolson. Harris, Donna. 2007. "Bonding Social Capital and Corruption: A Cross-National
Empirical Analysis." in Environmental Economy and Policy Research Working Papers. Cambridge: University of Cambridge, Department of Land Economics.
Inglehart, Ronald. 1997. Modernization and Postmodernization. NJ: Princeton University Press.
Jackman, Robert W., and Ross A. Miller. 1998. "Social Capital and Politics." Annual Review of Political Science 1:47-73.
Lipset, Seymour Martin, and Gabriel Salman Lenz. 2000. "Corruption, Culture, and Markets." Pp. 112-124 in Culture matters : how values shape human progress, edited by Samuel P. Huntington and Lawrence E. Harrison. New York: Basic Books.
Mutti, Antonio. 2000. "Particularism and the Modernization Process in Southern Italy." International Sociology 15:579-90.
Newton, Kenneth. 2001. "Trust, Social Capital, Civil Society, and Democracy." International Political Science Review 22:201-214.
—. 2007. "Social and Political Trust." Pp. 342-361 in Oxford handbook of political behavior, edited by Russell J. Dalton and Hans-Dieter Klingemann. Oxford ; New York: Oxford University Press.
Newton, Kenneth, and Pippa Norris. 1999. "Confidence In Public Institutions: Faith, Culture or Performance?" in Annual Meeting of the American Political Science Association. Altanta.

19
Putnam, Robert D., Robert Leonardi, and Raffaella Nanetti. 1993. Making democracy work : civic traditions in modern Italy. Princeton, N.J.: Princeton University Press.
Rose, Richard. 2000. "Getting Things Done in an Anti-Modern Society: Social Capital Networks in Russia." Pp. 147-171 in Social Capital: A Multifaceted Perspective, edited by Partha Dasgupta and Ismail Serageldin. Washington, D.C.: The World Bank.
Tu, Wei-Ming. 2000. "Multiple Modernities: A preliminary Inquiry into the Implications of East Asian Modernity." Pp. 256-266 in Culture matters : how values shape human progress, edited by Samuel P. Huntington and Lawrence E. Harrison. New York: Basic Books.
Wong, Timothy Ka-Ying, Hsin-Huang Michael Hisao, and Po-San Wan. 2009. "Comparing Political Trust in Hong Kong and Taiwan: Levels, Determinants, and Implications." Japanese Journal of Political Science 10:147-174.
20
Graph 1-1 Familism and Generalized Trust
India
Indonesia
Malaysia Philippines
Thailand
SingaporeH.K.
Taiwan
ChinaKorea
JapanAustralia
U.S.
020
4060
80
15 20 25 30 35 40Familism
Fitted values Trust
Graph 1-2 Familism and Confidence in Public Institutions
India
Indonesia
Malaysia
Philippines Thailand
Singapore
H.K.
Taiwan
China
Korea
Japan
AustraliaU.S.
1012
1416
15 20 25 30 35 40Familism
Fitted values pub_inst

21
Graph 1-3 Familism and Confidence in Private/Non-Profit Institutions
India
IndonesiaMalaysia
Philippines
Thailand
Singapore
H.K.
Taiwan
China
Korea
Japan
AustraliaU.S.
1112
1314
15
15 20 25 30 35 40Familism
Fitted values npo
Graph 1-4 Familism and Civic Competence
India
Indonesia
Malaysia
Philippines
Thailand
Singapore
H.K.
Taiwan
China
Korea
JapanAustralia
U.S.
-.4-.2
0.2
.4
15 20 25 30 35 40Familism
Fitted values Civic

22
Graph 1-5 Familism and Political Favoritism
India
Indonesia
Malaysia
Philippines
Thailand
Singapore
H.K.
Taiwan
China
Korea
Japan
Australia
U.S.
1020
3040
50
15 20 25 30 35 40Familism
Fitted values favoritism
Graph 1-6 Familism and Nationalism
India Indonesia
Malaysia
PhilippinesThailand
Singapore
H.K. Taiwan
China
Korea
Japan
AustraliaU.S.
2.5
33.
54
15 20 25 30 35 40Familism
Fitted values nationalism
23
Graph 1-7 Familism and Equalitarian Ideology
IndiaIndonesia
Malaysia
Philippines
Thailand
Singapore
H.K.
TaiwanChinaKorea
Japan
Australia
U.S.
-.4-.2
0.2
.4.6
15 20 25 30 35 40Familism
Fitted values equalitarian

Table 1. Sample Characteristics and Descriptive Statistics Education
(%)
Household Income
(%)
Region / Society Male
(%)
Age Married
(%)
Middle High Middle High
South & Southeast Asia
India 49.3 36.0(12.4) 74.8 51.6 34.4 28.2 7.8
Indonesia 43.1 35.4(11.3) 75.6 33.1 5.6 42.0 35.3
Malaysia 49.7 37.6(12.8) 67.4 43.9 14.4 53.8 25.8
Philippines 49.4 39.7(13.2) 77.2 40.3 26.7 27.3 29.3
Thailand 47.6 40.1(12.7) 71.1 15.1 26.5 47.0 47.0
East Asia
Singapore 45.8 40.9(11.9) 69.7 24.3 18.2 38.0 34.2
H.K. 48.4 40.9(12.8) 63.1 42.0 15.9 49.7 9.7
Taiwan 51.1 40.6(12.3) 70.5 39.3 28.4 61.9 16.6
China 50.8 40.8(12.7) 78.7 24.4 25.9 15.1 16.3
Korea 50.0 42.0(13.2) 74.7 43.2 37.8 32.4 18.5
Japan 44.3 47.8(13.6) 75.1 43.3 45.5 27.3 25.4
The West
Australia 39.5 42.5 (15.1) 55.0 35.7 51.0 30.2 27.1
U.S. 49.4 43.8(14.2) 57.2 37.0 58.2 34.9 19.8

Table 1. (continued) Sample Characteristics and Descriptive Statistics Region / Society Familism
(%)
Civic
Competence
General Trust
(%)
Confidence in
Public Institutions
Confidence in
Private/NPO
Institutions
Political
Favoritism
(%)
Nationalism Equalitarian
Ideology
South & Southeast Asia
India 15.9 -.294(.71) 40.8 14.1(3.16) 13.8(2.86) 32.5 3.868(.36) -.232(.61).
Indonesia 29.1 .015(.72) 25.6 14.9(2.70) 15.0(2.33) 9.2 3.861(.38) .104(.64)
Malaysia 26.4 -.272(.71) 12.9 15.5(2.73) 14.8(2.15) 13.3 3.488(.74) .359(.62)
Philippines 32.2 .069(.85) 12.2 14.1(2.98) 15.2(2.36) 51.6 3.854(.43) .185(.58)
Thailand 36.9 -.026(.81) 19.1 14.2(2.66) 14.6(2.17) 8.2 3.954(.24) .441(.63)
East Asia
Singapore 16.9 .195(.81) 31.2 15.9(2.56) 14.3(2.38) 12.3 3.445(.66) .001(.71)
H.K. 35.2 .083(.83) 33.7 12.7(2.19) 11.7(2.20) 6.4 2.809(.65) -.146(.68)
Taiwan 38.5 -.207(.68) 40.0 11.0(2.81) 12.3(2.47) 19.0 2.838(.86) -.296(.59)
China 38.4 -.009(.75) 63.9 14.9(2.51) 12.7(2.19) 26.3 3.364(.78) -.161(.60)
Korea 33.7 -.309(.66) 68.3 10.3(2.43) 11.3(2.28) 20.3 3.052(.67) -.130(.62)
Japan 40.7 .216(.76) 47.7 11.9(2.62) 12.2(2.28) 5.9 3.178(.73) -.265(.54)
The West
Australia 25.7 .174(.90) 51.5 13.7(2.96) 12.9(2.47) 12.9 3.762(.50) .019(.70)
U.S. 36.7 .384(.93) 49.2 13.3(3.06) 12.7(2.62) 33.3 3.674(.60) -.188(.77)

Table 1. (continued) Sample Characteristics and Descriptive Statistics Region / Society Year N CPI GINI CLS GDP Population
(2010)
Religious Culture
South & Southeast Asia
India 2008 1052 3.4 36.8 3 1065 1,173,108,018 Hindu
Indonesia 2007 1000 2.3 36.3 3 1924 242,968,342 Islamic
Malaysia 2007 1000 5.1 40.3 4 7003 28,274,729 Islamic
Philippines 2007 1000 2.5 44.5 3 1624 99,900,177 Catholic
Thailand 2007 1000 3.6 42.0 4 3689 67,089,500 Buddhism
East Asia
Singapore 2006 1038 9.4 52.2 4 32960 4,701,069 Confucian
H.K. 2006 1000 8.3 53.3 2 27699 7,089,705 Confucian
Taiwan 2006 1006 5.9 33.9 1 17520 23,024,956 Confucian
China 2006 2000 3.3 44 6 2072 1,330,141,295 Confucian
Korea 2006 1023 5.1 35.1 2 19707 48,636,068 Confucian
Japan 2008 1012 7.3 38.1 2 38268 126,804,433 Japanese
The West
Australia 2008 1000 8.7 30.5 1 48499 21,515,754 Protestant
U.S. 2008 1002 n/a 45 1 47210 310,232,863 Protestant
Note: CPI= Transparency International’s Corruption Perceptions Index; scaled from 0 (least corrupt) to 10 (most corrupt). CLS= Civil Liberty Score, published by the Freedom House; each country is rated on a seven-category scale, 1 representing the most free and 7 the least free.

Table 2. Binary Logistic Regression of Familism and Generalize Trust [exp (β): odds ratio] South & Southeast Asia East Asia The West 11 Asian Societies Generalized
Trust India Indonesia Malaysia Philippines Thailand Singapore H.K. Taiwan China Korea Japan Australia U.S.
Male 1.099 1.175 1.446 1.165 1.468* 1.067 1.023 .975 1.147 .946 1.063 .769 1.057 1.098* 1.120** 1.118**
Age .989 1.007 1.008 .998 1.009 1.011 .991 1.019* 1.014** .997 1.011 1.011* 1.016** 1.011*** 1.004* 1.004*
Married .993 .826 .898 .959 1.005 1.416 1.138 1.028 .951 1.543* 1.074 .980 .932 1.149** 1.071 1.070
Mid Edu .901 .975 .544* 1.124 1.044 1.964** 1.595** 1.593* 1.040 1.227 1.521 1.681* 1.092 1.428*** 1.303*** 1.296***
High Edu .755 .471 1.138 .616 .738 3.440*** 2.120** 2.415*** 2.288*** 1.683 1.569 2.336** 1.213 2.297*** 1.777*** 1.763***
Mid Income 1.251 .987 .567* .416** 1.209 1.324 .728* 1.361 1.006 1.719** 1.204 .979 1.497* .634*** .848** .851**
High Income 1.123 .913 .480* .985 1.343 1.483 .792 1.553 .808 1.581* 1.297 2.050** 2.238** .585*** .702*** .704***
Familism .918 .883 1.525 1.160 .862 .960 .898 .873 .939 .843 1.102 1.040 .840 1.062 1.011 .477
CPI .676*** .672***
Gini .949*** .948***
CLS 1.641*** 1.610***
Log(GDP) .000*** .000***
[Log(GDP)]2 14.473*** 14.370***
F* CPI 1.021
F* Gini 1.004
F* CLS 1.065
F*Log(GDP) 1.068
N 985 941 851 815 989 883 918 920 1983 948 706 708 698 10939 10939 10939
Pseudo 2R .007 .009 .029 .020 .011 .063 .023 .026 .025 .036 .013 .053 .089 .031 .089 .089
Note: “Mid Edu”= Middle Education; “High Edu”= High Education; “Mid Income”= Middle Household Income; “High Income”= High Household Income; “CPI”= Corruption Perceptions Index;
“Gini”= Gini Coefficient; “CLS”= Civil Liberties Score; “Log(GDP)”= Log(Gross Domestic Product per capita); “F*CPI”= Familism*CPI; “F*Gini”= Familism*Gini; “F*CLS”= Familism*CLS;
“F* Log(GDP)”= Familism* Log(GDP).
* p<.05, ** p<.01, *** p<.001

Table 3. OLS Regression of Familism and Confidence in Public Institutions [standardized β coefficients] South and Southeast Asia East Asia The West 11 Asian Societies Public
Institutions India Indonesia Malaysia Philippines Thailand Singapore H.K. Taiwan China Korea Japan Australia U.S.
Male -.004 -.006 .056 .001 .062 -.020 .106** -.058 -.055* -.046 -.036 .045 .006 .004 -.007 -.006
Age -.018 .048 -.008 .030 -.033 .005 -.025 .033 .053* .051 .120** -.013 -.018 -.096*** -.007 -.006
Married .045 .004 -.053 .063 -.021 .061 .051 -.089* .006 .001 -.056 .046 .020 .019 .001 .001
Mid Edu -.026 -.038 -.081 -.128** .033 .020 -.058 -.070 .012 -.043 .082 .087 -.225* -.167*** -.072*** -.069***
High Edu .048 -.043 .037 -.142** .018 .088* -.036 -.093 -.074* -.061 .150* .196** -.192* -.194*** -.094*** -.091***
Mid Income -.118** .031 -.117* .014 -.017 -.034 .084* .064 .067** -.053 .062 -.041 .017 -.014 .054*** .055***
High Income .017 -.056 -.224*** .030 -.085 -.052 .097* .080 .050* .012 .097* -.080 .064 .055*** .079*** .080***
Familism -.192*** .068 -.067 .129*** -.044 .019 .044 .022 -.087*** .081* .073 .020 -.072 -.041*** -.017 -1.022***
CPI .693*** .793***
Gini .014 -.025
CLS .215*** .262***
Log(GDP) 1.350*** 1.303***
[Log(GDP)]2 -2.138*** -2.166***
F* CPI -.499***
F* Gini .490***
F* CLS -.157***
F*Log(GDP) 1.117***
N 882 827 794 791 933 814 776 796 1839 869 659 653 648 9980 9980 9980
2R .060 .022 .050 .050 .013 .009 .026 .017 .023 .021 .034 .023 .019 .038 .239 .244
Note: “Mid Edu”= Middle Education; “High Edu”= High Education; “Mid Income”= Middle Household Income; “High Income”= High Household Income; “CPI”= Corruption Perceptions Index;
“Gini”= Gini Coefficient; “CLS”= Civil Liberties Score; “Log(GDP)”= Log(Gross Domestic Product per capita); “F*CPI”= Familism*CPI; “F*Gini”= Familism*Gini; “F*CLS”= Familism*CLS;
“F* Log(GDP)”= Familism* Log(GDP).
* p<.05, ** p<.01, *** p<.001

Table 4. OLS Regression of Familism and Confidence in Private/Non-Profit Institutions [standardized β coefficients] South and Southeast Asia East Asia The West 11 Asia Societies Private
Institutions India Indonesia Malaysia Philippines Thailand Singapore H.K. Taiwan China Korea Japan Australia U.S.
Male -.034 -.003 -.005 -.004 .037 -.004 -.001 -.027 -.031 -.101** -.088* -.017 -.033 -.018 -.023* -.022*
Age -.033 .059 .038 -.023 -.131*** -.011 .002 -.005 .080** -.016 -.011 -.051 .011 -.097*** -.018 -.017
Married -.016 -.016 -.029 .001 .010 .007 .018 -.042 .023 .047 -.046 .016 -.029 .019 .001 .001
Mid Edu -.025 -.016 .006 -.078 -.057 -.009 -.025 -.039 .027 -.138* .163* .085 -.161 -.116*** -.075*** -.072***
High Edu .023 -.090* .024 -.098* -.046 -.026 -.062 -.086 -.012 -.195** .152 .157* -.132 -.180*** -.118*** -.116***
Mid Income -.005 -.064 .032 -.049 .007 -.084 .035 .140** .066** -.019 -.010 -.021 -.008 .085*** .093*** .093***
High Income .085* .034 -.079 -.017 -.036 -.103 -.010 .107* .058* .060 -.009 -.097* -.047 .151*** .148*** .149***
Familism -.183*** -.055 -.118** .096** .013 .003 -.023 .009 -.045* .008 .079 -.025 .030 -.052*** -.042*** -1.045***
CPI .376*** .487***
Gini .041** .013
CLS -.165*** -.137***
Log(GDP) 2.414*** 2.370***
[Log(GDP)]2 -3.110*** -3.148***
F* CPI -.547***
F* Gini .398**
F* CLS -.101**
F*Log(GDP) 1.201***
N 769 762 726 796 914 685 765 730 1921 805 607 618 568 9480 9480 9480
2R .048 .018 .025 .025 .019 .009 .006 .016 .018 .033 .024 .019 .011 .041 .121 .126
Note: “Mid Edu”= Middle Education; “High Edu”= High Education; “Mid Income”= Middle Household Income; “High Income”= High Household Income; “CPI”= Corruption Perceptions Index;
“Gini”= Gini Coefficient; “CLS”= Civil Liberties Score; “Log(GDP)”= Log(Gross Domestic Product per capita); “F*CPI”= Familism*CPI; “F*Gini”= Familism*Gini; “F*CLS”= Familism*CLS;
“F* Log(GDP)”= Familism* Log(GDP).
* p<.05, ** p<.01, *** p<.001

Table 5. OLS Regression of Familism and Civic Competence [standardized β coefficients] South and Southeast Asia East Asia The West 11 Asian Societies Civic
Competence India Indonesia Malaysia Philippines Thailand Singapore H.K. Taiwan China Korea Japan Australia U.S.
Male .077* .020 .120** .035 .029 -.033 .144*** .063* .038 .066* .114 .047 .042 .051*** .053*** .053***
Age -.025 .011 -.016 -.061 .011 .054 .047 .020 -.024 .027 .180 .117** .062* .026* .002 .002
Married .001 .027 .109** -.035 .012 -.009 .031 .086* -.030 -.004 -.008 -.034 -.017 -.003 .004 .004
Mid Edu .045 .129*** .055 -.035 .012 .045 .088* .044 -.026 .102 .061 .105* .072 -.007 -.002 .000
High Edu .077 .071* .156*** -.054 .013 .087* .069 .075 -.047 .212** .140 .278** .275** .017 .011 .014
Mid Income -.069* .034 -.058 -.047 -.042 -.069 .099** .067 .024 .011 .083 .087* .148*** .011 .042*** .041***
High Income .061 .039 -.105* .078* .027 -.115* .053 .041 .081** .041 .090 .192*** .149** .063*** .077*** .075***
Familism -.003 -.121*** .028 -.012 .026 -.061 -.115*** .015 -.156*** -.048 -.069 -.041 -.077* -.053*** -.054*** .591**
CPI -.392*** -.421***
Gini .201*** .225***
CLS .066*** .089***
Log(GDP) -3.205*** -3.209***
[Log(GDP)]2 3.609*** 3.639***
F* CPI .129
F* Gini -.268*
F* CLS -.090**
F*Log(GDP) -.425
N 974 911 834 813 984 889 920 917 1951 948 711 702 705 10852 10852 10852
2R .021 .038 .038 .018 .007 .015 .055 .016 .033 .036 .059 .102 .106 .010 .045 .047
Note: “Mid Edu”= Middle Education; “High Edu”= High Education; “Mid Income”= Middle Household Income; “High Income”= High Household Income; “CPI”= Corruption Perceptions Index;
“Gini”= Gini Coefficient; “CLS”= Civil Liberties Score; “Log(GDP)”= Log(Gross Domestic Product per capita); “F*CPI”= Familism*CPI; “F*Gini”= Familism*Gini; “F*CLS”= Familism*CLS;
“F* Log(GDP)”= Familism* Log(GDP).
* p<.05, ** p<.01, *** p<.001

Table 6. Binary Logistic Regression of Familism and Political Favoritism [exp (β): odds ratio] South and Southeast Asia East Asia The West 11 Asian Societies Political
Favoritism India Indonesia Malaysia Philippines Thailand Singapore H.K. Taiwan China Korea Japan Australia U.S.
Male .820 1.393 1.088 1.093 .887 .903 1.152 1.097 1.241* 1.265 3.617** .961 1.030 1.160** 1.147** 1.147**
Age .999 .983 1.002 1.004 .993 .986 .983 .988 .995 1.006 .984 .993 .995 .990*** .998 .998
Married .779 1.155 1.321 .720* 1.201 .737 .919 1.041 1.125 1.006 .901 .994 .935 1.196** 1.023 1.022
Mid Edu .962 1.380 1.896* .908 .963 1.247 1.521 1.158 1.257* 1.789* 2.310 1.651 2.205* 1.401*** 1.480*** 1.488***
High Edu .957 2.485* 2.731** .764 1.934* .630 1.470 1.112 1.611** 2.474** 1.414 1.140 1.740 1.638*** 1.745*** 1.754***
Mid Income .848 .758 1.224 .819 1.925 .865 1.070 1.249 1.268 .920 .758 .754 1.623* .693*** .865* .862*
High Income .856 .845 .859 .737 2.171 .227*** 2.054* 1.612* 2.045*** 1.160 1.248 .966 1.952** .735*** .824** .826**
Familism .952 1.044 .866 1.171 1.601* .433* 1.104 1.843*** 1.926*** 1.853*** .876 1.888* 1.749** 1.288*** 1.340*** .135
CPI .806*** .877*
Gini 1.040*** 1.046***
CLS .932** .905**
Log(GDP) .001*** .001***
[Log(GDP)]2 2.556*** 2.468***
F* CPI .715***
F* Gini .990
F* CLS 1.071
F* Log(GDP) 2.917***
N 984 904 842 815 989 904 914 907 1978 933 678 699 660 10848 10848 10848
Pseudo 2R .005 .011 .017 .015 .015 .057 .014 .021 .051 .029 .026 .015 .036 .014 .052 .055
Note: “Mid Edu”= Middle Education; “High Edu”= High Education; “Mid Income”= Middle Household Income; “High Income”= High Household Income; “CPI”= Corruption Perceptions Index;
“Gini”= Gini Coefficient; “CLS”= Civil Liberties Score; “Log(GDP)”= Log(Gross Domestic Product per capita); “F*CPI”= Familism*CPI; “F*Gini”= Familism*Gini; “F*CLS”= Familism*CLS;
“F* Log(GDP)”= Familism* Log(GDP).
* p<.05, ** p<.01, *** p<.001

Table 7. Ordered Logistic Regression of Familism and Nationalism [exp (β): odds ratio] South and Southeast Asia East Asia The West 11 Asian Societies Nationalism
India Indonesia Malaysia Philippines Thailand Singapore H.K. Taiwan China Korea Japan Australia U.S.
Male 1.407 .571** .870 1.317 1.618 .911 .759* 1.107 1.011 .968 1.241 1.070 .928 1.020 .971 .975
Age 1.006 .995 .976*** .993 .983 1.016* 1.000 1.001 1.012** 1.010 1.021*** 1.003 1.018** .986*** 1.002 1.002
Married 1.253 1.708* 1.542* .772 2.141* .922 .809 .831 .934 .823 1.104 1.386 1.602* 1.229*** .954 .951
Mid Edu 1.034 1.114 1.048 .985 .304* .856 .996 .965 1.005 .562** 1.039 1.378 1.342 .651*** .726*** .731***
High Edu 1.372 .561 1.658* 1.012 .239** .522** 1.048 .677* .947 .458** 1.355 .721 1.268 .551*** .616*** .623***
Mid Income .517** .744 .828 .976 2.38e-07 1.000 1.132 1.269 .863 .919 1.080 .969 .871 1.008 1.430*** 1.430***
High Income .358** .975 .429*** 1.210 2.14e-07 .877 1.487 1.435* 1.456** 1.153 1.099 1.154 .810 1.579*** 2.047*** 2.036***
Familism .355*** .888 .673* .408*** .629 .811 1.128 1.149 .512*** .816 1.031 1.436 .743 .667*** .670*** .010***
CPI 1.152*** 1.247***
Gini .990* .982*
CLS .938** 1.008
Log(GDP) .001*** .001***
[Log(GDP)]2 1.919*** 1.919***
F* CPI .707***
F* Gini 1.033**
F* CLS .837***
F*Log(GDP) 3.856***
Cut 1 -4.800 -4.627 -5.231 -5.817 -22.435 -4.468 -3.318 -2.673 -3.150 -5.204 -3.243 -4.740 -3.442 -4.762 -22.278 -23.249
Cut 2 -1.844 -2.207 -3.300 -4.404 -21.737 -2.268 -1.243 -.589 -1.902 -1.893 -.198 -3.399 -2.193 -2.845 -20.313 -21.283
Cut 3 -1.522 -2.556 -19.361 .149 2.128 1.264 .164 .835 2.067 -.896 -.022 -.997 -18.214 -19.178
N 1002 940 857 817 989 911 912 902 1979 966 717 653 693 10992 10092 10992
Pseudo 2R .054 .023 .031 .032 .078 .020 .006 .005 .020 .018 .012 .018 .021 .017 .109 .113
Note: “Mid Edu”= Middle Education; “High Edu”= High Education; “Mid Income”= Middle Household Income; “High Income”= High Household Income; “CPI”= Corruption Perceptions Index;
“Gini”= Gini Coefficient; “CLS”= Civil Liberties Score; “Log(GDP)”= Log(Gross Domestic Product per capita); “F*CPI”= Familism*CPI; “F*Gini”= Familism*Gini; “F*CLS”= Familism*CLS;
“F* Log(GDP)”= Familism* Log(GDP).
* p<.05, ** p<.01, *** p<.001

Table 8. OLS Regression of Familism and Equalitarian Ideology [standardized β coefficients] South and Southeast Asia East Asia The West 11 Asian Societies Equalitarian
Ideology India Indonesia Malaysia Philippines Thailand Singapore H.K. Taiwan China Korea Japan Australia U.S.
Male -.033 -.043 -.099** .014 -.118*** -.056 -.081* -.085* -.054* -.140*** -.023 -.121** -.143*** -.062*** -.068*** -.068***
Age -.027 .011 .105* .028 .023 -.021 .066 -.060 .055* -.039 .110** -.016 .031 -.038*** .026* .026*
Married -.045 .046 -.118** .030 -.011 -.011 -.058 .014 .071** .028 .020 .061 -.084* -.002 -.009 -.009
Mid Edu -.043 .020 -.028 .027 -.021 -.022 .059 -.085 .008 -.048 .033 -.022 -.134 -.049*** -.010 -.009
High Edu -.081 .013 .049 .034 -.015 -.110** .015 -.175*** .028 -.120 -.037 -.107 -.181* -.110*** -.050*** -.049***
Mid Income -.005 .001 .062 .016 .019 -.039 .143*** .017 -.064** -.028 -.010 -.017 -.004 .058*** .038** .038**
High Income -.036 .015 .064 .062 .006 -.091* .027 .061 -.122*** -.005 -.019 -.059 -.101* .070*** .051*** .051***
Familism -.077* .093** .018 .046 -.061 -.023 .018 -.031 -.040 -.044 .056 -.077* .013 -.034*** -.028** -.754**
CPI .416*** .488***
Gini .006 -.018
CLS -.143*** -.124***
Log(GDP) 3.890*** 3.869***
[Log(GDP)]2 -4.513*** -4.546***
F* CPI -.356***
F* Gini .316**
F* CLS -.067
F*Log(GDP) .802***
N 936 895 817 811 979 878 893 900 1971 938 708 679 636 10726 10726 10726
2R .013 .013 .026 .007 .020 .029 .031 .027 .028 .034 .027 .039 .054 .017 .064 .066
Note: “Mid Edu”= Middle Education; “High Edu”= High Education; “Mid Income”= Middle Household Income; “High Income”= High Household Income; “CPI”= Corruption Perceptions Index;
“Gini”= Gini Coefficient; “CLS”= Civil Liberties Score; “Log(GDP)”= Log(Gross Domestic Product per capita); “F*CPI”= Familism*CPI; “F*Gini”= Familism*Gini; “F*CLS”= Familism*CLS;
“F* Log(GDP)”= Familism* Log(GDP).
* p<.05, ** p<.01, *** p<.001