Energy market reform in Europe European energy and … market reform in Europe European energy and...
156
Energy market reform in Europe European energy and climate policies: achievements and challenges to 2020 and beyond
Transcript of Energy market reform in Europe European energy and … market reform in Europe European energy and...

Energy market reform in EuropeEuropean energy and climate policies: achievements and challenges to 2020 and beyond

Contents
Executive summary 2
Introduction 6
3 x 20: Are we going to make it? 7
1. Energy and climate 2020 targets, an interim target 7 en route to 2050
2. The 20-20-20 Member State achievements 8
a) Reduction in greenhouse gas (GHG) emissions 8
b) Share of renewable energy in final energy 12 consumption
c) Reduction of final energy consumption: 15 energy efficiency target
3. Conclusion 18
Unintended outcomes in the power sector 19
1. Electricity markets have been most affected 20
a) Power market distortion 20
b) Electricity markets facing both over-supply 21 and blackouts
2. Subsidised REN did not make producers profitable, 21 quite the contrary…
3. …and it did not make consumers better off either… 22
a) REN support policies have been costly 22
b) Wholesale and retail prices moving in opposite 22 directions
What has gone wrong? 24
1. Have we ticked each box of the main energy policy 24 roadmap: sustainability, affordability/competitiveness and security of supply?
2. The carbon market did not help 26
3. The EU 3 x 20 policies were set up in a different world: 27 the paradigm shift
a) The EU energy context has unfolded very differently 27 from what was anticipated at the outset
b) Some technical potential for improvement has been 28 less developed than initially planned
c) The economic crisis accelerated and completed 28 this paradigm shift
4. EU energy policy: still a patchwork of national policies 28
a) Energy policies have largely remained at Member 28 State level
b) No coordination on energy mix 29
c) The energy and climate policies have moved the EU 31 away from the original objective of creating a single, integrated energy market
5. Conclusion 31
Road ahead and main challenges: the path to 32 2030 and beyond
1. EU energy policy beyond 2020 – what is to change? 32
2. EU energy policy beyond 2020 – What are the solutions? 32
3. The challenges ahead 35
a) The internal energy market is supposed to have been 35 “completed” by now
b) REN targets versus affordability: how can we 35 reach REN targets without pushing electricity prices up for consumers?
c) GHG: are we going to fix the ETS market and have 36 a market mechanism that produces the right price of carbon?
d) Carbon, renewables, energy efficiency: do we need 37 so many objectives?
e) To what extent can technology be part of the solution? 37
List of acronyms 39
Selected bibliographic references 40
Appendix – County profiles 42
Belgium 43
France 57
Germany 74
Italy 92
Netherlands 106
Spain 119
UK 135
Contacts 152

To start a new section, hold down the apple+shift keys and click
to release this object and type the section title in the box below.
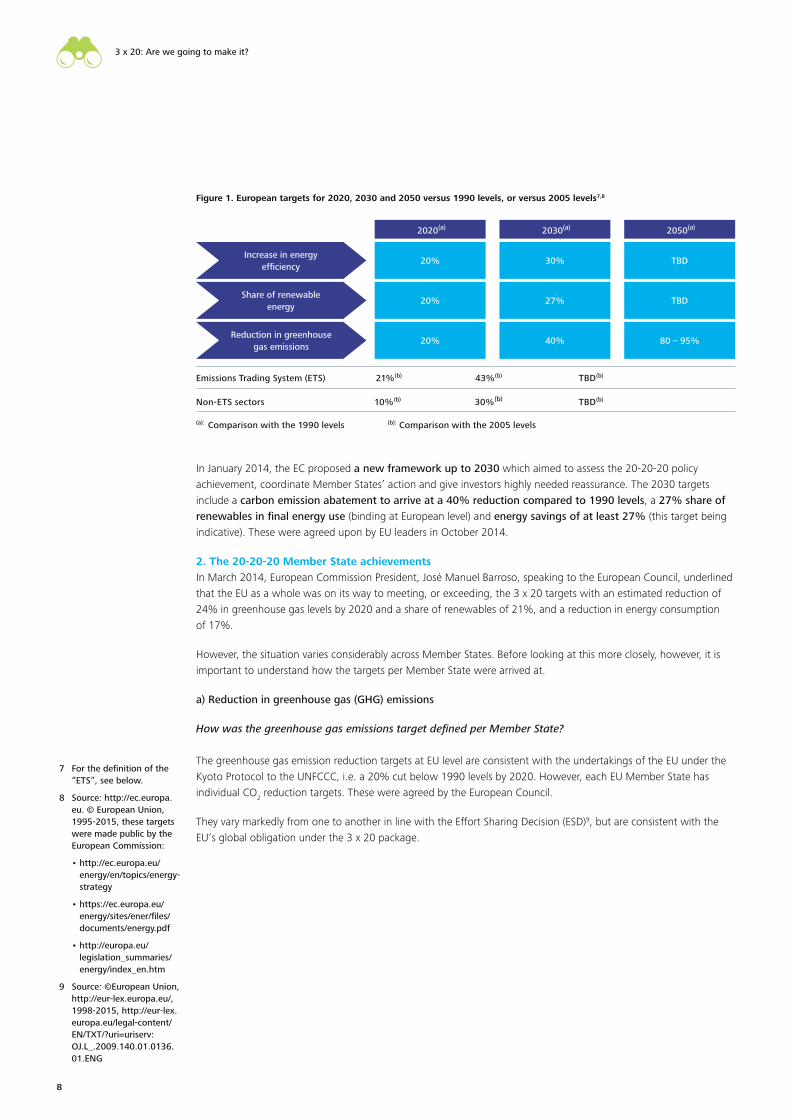
Figure 1. European targets for 2020, 2030 and 2050 8versus 1990 levels, or versus 2005 levels
Figure 2. GHG emission reduction national targets 9in the non-ETS sector, compared to 2005 levels
Figure 3. EU-28 GHG emissions by sector, 1990-2012, 10and 2020 target (MtCO2eq)
Figure 4. Percentage of the GHG emission target already 10achieved between 2005 and 2012 for seven countries
Figure 5. Reducing greenhouse gas emissions: 11achievements in seven countries in 2012
Figure 6. RES share in gross fi nal energy consumption (%) 13
Figure 7. Percentage of the renewable energy target already 13 achieved between 2005 and 2012 for seven countries
Figure 8. Renewable energy achievements in seven countries 14in 2012
Figure 9. EU-28 primary energy consumption 2005-2012 and 17 target (Mtoe)
Figure 10. EU-28 fi nal energy consumption 2005-2012 17and target (Mtoe)
Figure 11. Change in fi nal energy consumption (FEC) 17compared to 2005 (%)
Figure 12. Energy effi ciency achievements in seven countries 18in 2012
Figure 13. EU-28 electrical energy in fi nal energy 19 consumption 1990-2012 (Mtoe) (%)
Figure 14. EU-28 GHG emissions by sector 1990-2012 19(MtCO2eq)
Figure 15. Breakdown by renewable technologies for 19 electricity, heating and cooling and transport for EU-28 (Mtoe), in 2005 and 2012 and targets for 2020
Figure 16. EU-28 change in electricity capacity source 192010-2012 (GW)
Figure 17. Wholesale electricity prices. Baseload Spot 21Day Ahead (€/MWh) in four countries
Figure 18. UK clean dark and spark spreads (£/MWh) 22
Figure 19. German clean dark and spark spreads (€/MWh) 22
Figure 20. EU-28 weighted average retail electricity prices, 232008-2012 (percentage change by component)
Figure 21. EU-28 energy intensity 2000-2012 24
Figure 22. EU-28 GHG emissions per inhabitant 1990-2010 24 (tCO2eq/inhabitant)
Figure 23. EU-28 GHG emissions per euro of GDP 2000-2012 24 (tCO2eq/€)
Figure 24. Share of fossil fuels in gross inland energy 25consumption of seven countries
Figure 25. Evolution of European average household price 25 components (in €/MWh) between 2008 and 2012
Figure 26. Evolution of European average industrial price 25 components (in €/MWh) between 2008 and 2012
Figure 27. EU-28 energy import dependence by fuel, 261995-2012 (% (toe/toe))
Figure 28. Price of the CO2 allowances on the ETS (€/ton) 27
Figure 29. 2012 Gross inland energy consumption in 29 seven countries (Mtoe)
Figure 30. 2012 Power production mix in seven countries 29 (percentages of generation)
Figure 31. Yearly sum of global irradiation at horizontal 30plane (2001-2008 average kWh/m2)
Table 1. The diversity of national energy effi ciency targets 16
Table 2. 2014 feed-in tariffs (in c€/kWh) in Germany, 20France and the UK
Table 3. Troubleshooting synthesis 32-33
List of fi gures and tables
To start a new section, hold down the apple+shift keys and click
to release this object and type the section title in the box below.
To start a new section, hold down the apple+shift keys and click
to release this object and type the section title in the box below.
For more than 20 years, the European Union has consistently been at the forefront of global action to combat climate change. It has developed ambitious energy and climate policies, including the target of reducing its greenhouse gas (GHG) emissions by 80% by 2050. In a century where the environment will be challenged and the price of energies will be high, the EU’s view is that the winners will be energy-sober and low-carbon economies.
As an interim step for 2020, the EU set a number of ambitious climate and energy targets known as “20-20-20 targets by 2020” or the “3 x 20” policy. This included pledges to reduce GHG emissions by 20% from 1990 levels, raise the share of EU fi nal energy consumption1 produced from renewable resources to 20% and improve energy effi ciency by 20%. This 3 x 20 package is part of a wider European energy strategy aimed at achieving energy sustainability, competitiveness and affordability, and security of supply.
The EU energy and climate package has attracted criticism in recent years, however, for failing to bring the expected results and for having had numerous unexpected, or unintended, impacts on energy markets and the industry.
3 x 20: Are we going to make it?Many countries are on track to meet their 3 x 20 targets and the EU-28 as a whole has made considerable progress towards realising the objectives. But whether this is mainly due to dedicated policies or to external factors is highly questionable. The economic crisis has meant achievements look better than they otherwise might in countries such as Italy, the Netherlands and Spain because the crisis has reduced the demand and consumption levels against which the targets are measured.
Any improvement in EU business activity could rapidly push CO2 emissions up and reverse the good trajectory
that most countries seem now to be on. Nuclear phase-outs and a potential rise in coal-fi red capacities are creating uncertainties that could also make the achievement of the CO2 target problematic as 2020 approaches.
Today, it is hard to see how the objective of reaching 20% of renewable energy use in fi nal consumption will be met: major EU economies (including France and the UK) still need to make signifi cant efforts to meet their targets. In addition, since the fi nal REN target for 2020 is expressed as a percentage of fi nal energy consumption in 2020, reaching the renewable energy target will depend critically on the denominator of the ratio, i.e. fi nal energy consumption in 2020, something which it will not be possible to determine until after 2020.
Moreover, policies supporting renewable energies have been very costly: in Germany, the renewable energy sector is currently subsidized with approximately EUR 19.4 billion per year (EUR 240 per inhabitant in 20142); and in France, the global cost for the support of renewables in power production is estimated to be around EUR 40.5 billion for the 2012-2020 period3. Some of these costs still lie ahead of several Member States and will further increase tariffs in the future. And, last but not least, the foreknowledge of this cost overhang and the decrease in public sector expenditure in the aftermath of the 2008 economic crisis have slowed progress in this area.
The bases for measuring the energy effi ciency objectives are so variable that it will be hard to say whether the target has been met or not. Currently, EU energy effi ciency targets are expressed in all sorts of ways for each Member State, using different units, based on different assumptions and with varying levels of ambition. The relative targets expressed in energy savings are most often calculated ex post. In a nutshell, it took a long time to defi ne criteria which are diffi cult-to-understand and measure and may not be met in the end. The key question is whether they are going to reduce EU energy consumption or the EU economy’s energy intensity other than as a result of economic contraction.
Unintended outcomes in the power sectorTaking a closer look at the power generation sector, we can see that some outcomes of the 3 x 20 policy in this sector have been unintended. They have produced results which were sometime counter-productive, thereby exposing the whole climate policy to general criticism.
The 3 x 20 targets have, overall, contributed to distorting electricity markets. In a context of sluggish demand, the development of renewables has been driven by policy support and incentives, rather than by supply and demand adequacy, and market signals.
Abundant electricity supplies on the market have sent the wholesale price of electricity to record lows, thereby driving producers to mothball new gas-fi red capacity.
1 See the defi nition in the ‘List of acronyms’ part, at the end of the document
2 http://www.wiwo.de/politik/deutschland/trotz-reform-verbraucher-werden-2015-eine-milliarde-euro-mehr-eeg-umlage-bezahlen/9414526.html
3 Cour des comptes (2013) – La politique de développement des énergies renouvelables – juillet 2013; http://www.ccomptes.fr/Publications/Publications/La-politique-de-developpement-des-energies-renouvelables
Executive summary
22
To start a new section, hold down the apple+shift keys and click
to release this object and type the section title in the box below.
To start a new section, hold down the apple+shift keys and click
to release this object and type the section title in the box below.
For more than 20 years, the European Union has consistently been at the forefront of global action to combat climate change. It has developed ambitious energy and climate policies, including the target of reducing its greenhouse gas (GHG) emissions by 80% by 2050. In a century where the environment will be challenged and the price of energies will be high, the EU’s view is that the winners will be energy-sober and low-carbon economies.
As an interim step for 2020, the EU set a number of ambitious climate and energy targets known as “20-20-20 targets by 2020” or the “3 x 20” policy. This included pledges to reduce GHG emissions by 20% from 1990 levels, raise the share of EU fi nal energy consumption1 produced from renewable resources to 20% and improve energy effi ciency by 20%. This 3 x 20 package is part of a wider European energy strategy aimed at achieving energy sustainability, competitiveness and affordability, and security of supply.
The EU energy and climate package has attracted criticism in recent years, however, for failing to bring the expected results and for having had numerous unexpected, or unintended, impacts on energy markets and the industry.
3 x 20: Are we going to make it?Many countries are on track to meet their 3 x 20 targets and the EU-28 as a whole has made considerable progress towards realising the objectives. But whether this is mainly due to dedicated policies or to external factors is highly questionable. The economic crisis has meant achievements look better than they otherwise might in countries such as Italy, the Netherlands and Spain because the crisis has reduced the demand and consumption levels against which the targets are measured.
Any improvement in EU business activity could rapidly push CO2 emissions up and reverse the good trajectory
that most countries seem now to be on. Nuclear phase-outs and a potential rise in coal-fi red capacities are creating uncertainties that could also make the achievement of the CO2 target problematic as 2020 approaches.
Today, it is hard to see how the objective of reaching 20% of renewable energy use in fi nal consumption will be met: major EU economies (including France and the UK) still need to make signifi cant efforts to meet their targets. In addition, since the fi nal REN target for 2020 is expressed as a percentage of fi nal energy consumption in 2020, reaching the renewable energy target will depend critically on the denominator of the ratio, i.e. fi nal energy consumption in 2020, something which it will not be possible to determine until after 2020.
Moreover, policies supporting renewable energies have been very costly: in Germany, the renewable energy sector is currently subsidized with approximately EUR 19.4 billion per year (EUR 240 per inhabitant in 20142); and in France, the global cost for the support of renewables in power production is estimated to be around EUR 40.5 billion for the 2012-2020 period3. Some of these costs still lie ahead of several Member States and will further increase tariffs in the future. And, last but not least, the foreknowledge of this cost overhang and the decrease in public sector expenditure in the aftermath of the 2008 economic crisis have slowed progress in this area.
The bases for measuring the energy effi ciency objectives are so variable that it will be hard to say whether the target has been met or not. Currently, EU energy effi ciency targets are expressed in all sorts of ways for each Member State, using different units, based on different assumptions and with varying levels of ambition. The relative targets expressed in energy savings are most often calculated ex post. In a nutshell, it took a long time to defi ne criteria which are diffi cult-to-understand and measure and may not be met in the end. The key question is whether they are going to reduce EU energy consumption or the EU economy’s energy intensity other than as a result of economic contraction.
Unintended outcomes in the power sectorTaking a closer look at the power generation sector, we can see that some outcomes of the 3 x 20 policy in this sector have been unintended. They have produced results which were sometime counter-productive, thereby exposing the whole climate policy to general criticism.
The 3 x 20 targets have, overall, contributed to distorting electricity markets. In a context of sluggish demand, the development of renewables has been driven by policy support and incentives, rather than by supply and demand adequacy, and market signals.
Abundant electricity supplies on the market have sent the wholesale price of electricity to record lows, thereby driving producers to mothball new gas-fi red capacity.
1 See the defi nition in the ‘List of acronyms’ part, at the end of the document
2 http://www.wiwo.de/politik/deutschland/trotz-reform-verbraucher-werden-2015-eine-milliarde-euro-mehr-eeg-umlage-bezahlen/9414526.html
3 Cour des comptes (2013) – La politique de développement des énergies renouvelables – juillet 2013; http://www.ccomptes.fr/Publications/Publications/La-politique-de-developpement-des-energies-renouvelables
Executive summary
2
To start a new section, hold down the apple+shift keys and click
to release this object and type the section title in the box below.
This has resulted in signifi cant overcapacity in arithmetic terms. At the same time, several electricity TSOs (e.g. the UK and France) have pointed to the risk of blackouts, the intermittent capacity has crowded out conventional capacity and investments in new cross-border interconnections have been neglected.
Furthermore, the decrease in wholesale prices has not made consumers better off either. End-user prices for electricity paid by companies and households have increased over the last decade in real terms, because – inter alia – of the impacts of passing on to customers the high costs of the policies required to support renewable energies.
Have we ticked the three boxes of EU energy strategy?
• Sustainability: the EU has considerably reduced its energy intensity and has decreased its carbon intensity; the 3 x 20 targets should be achieved in a lot of countries, but this is to a signifi cant extent because of the economic crisis;
• Affordabilityh prices to end-consumers rose by nearly 20% between 2008 and 2012, while wholesale electricity prices dropped by 35-45% over the same period; and
• Security of supply: the energy dependence of the EU on foreign sources of supply has increased slightly (reaching 53% in 2012, versus 52% in 2005 and 43% 20 years ago), but gas imports have had to make up for a domestic resource base that is contracting.
What has gone wrong?
• The world has changed since the EU 3 x 20 policies were agreed: the EU energy context has not unfolded in the way that was anticipated at the outset; the economic crisis was not expected; it caused a signifi cant slowdown in global activity and prompted a downward review of public budgets;
• Some potential for improvement has developed less rapidly than initially expected, such as second generation biofuels or CCS (Carbon Capture and Storage), demand side response, energy effi ciency in buildings etc.
• The carbon market did not help: the over-supplied Emissions Trading System (ETS) failed to send the right price signals to promote low-carbon technologies; the “fuel-switching” carbon price today, i.e. the carbon price, which would make it a matter of indifference whether to burn gas or coal for power generation, is in the EUR 35-45/tonne of CO2 range, a long way away from the current carbon market price of EUR 6-7/tonne; and
• Energy policy is still a patchwork of national policies, with limited, if any, coordination on energy mix or generation adequacy, creating energy tax based competition between Member States to protect their energy intensive industries.
Nevertheless, it is important to note that the EU is the only great economic power in the world that is adopting a new economic model that is less carbon-intensive and more renewables-oriented.
Executive summary
3 3Energy market reform in Europe

To start a new section, hold down the apple+shift keys and click
to release this object and type the section title in the box below.
To start a new section, hold down the apple+shift keys and click
to release this object and type the section title in the box below.
4 EEA (2014), Trends and projections in Europe 2014
The road ahead and the main challenges: the path to 2030 and beyondMany roadblocks still need to be overcome. The EU is far from achieving the carbon and energy revolution. The EU has recently decided upon new policy measures, including updated targets for 2030. This 2030 Framework aims to address four current failures of the 3 x 20 policy actions:
• The long-term climate objective of reducing GHG emissions by 80-95% in 2050 compared to 1990 is unlikely to be met based on current trends;
• Long-term security of energy supply remains an issue due to continuing energy import dependence;
• The energy system needs signifi cant investments in renewables, interconnections and energy effi ciency: the EC wants to send the right signal to investors in order to restore confi dence and reduce regulatory risk; and
• The EU needs to achieve energy cost reduction and competitiveness.
Even though the 2030 Framework may alleviate some of the diffi culties we have outlined, more challenges lie ahead:
• The EU needs to revisit its energy market design: energy-only markets have failed to deliver a price signal that provides incentives for investment, especially in countries with large shares of renewables with zero marginal costs. A European-wide capacity market is critical for solving the energy “trilemma” of delivering green, reliable electricity for the future at the lowest possible cost. This implies further development of cross-border connections and more coordination amongst national Transmission System Operators (TSOs).
• Renewable targets versus affordability: how can we reach REN targets without pushing energy prices up for consumers? The EU needs to fi nd alternative ways of fi nancing smart grids, energy effi ciency and renewables while integrating them fully into a competitive market, without leaving the burden mostly borne by household and SME electricity bills: feed-in premia, tax incentive mechanisms, systems of Energy Investment Allowances, or a carbon price fl oor are among the options.
• Are we going to fi x the ETS market and have a market mechanism that produces the right price of carbon? This must start with elimination of the credit surplus. The proposed reforms, including a “backloading” of emission quotas, the creation of a market stability reserve to be used as a “credit buffer” to regulate the price after 2020, and a CO2 reduction target increase from 1.74% annually to 2.2%, are to take place only from 2021 onwards. This is too late to have a carbon price constituting a driver for low-carbon technologies by 2020. Nevertheless, the ambitious 2030 GHG emissions targets (-43% between 2005 and 2030 in the ETS sector) should at last push the carbon price upward. EU lawmakers are perhaps optimistic about the 2030 GHG emissions objective in believing that the EU Member States will be able to reduce their emissions collectively by another 20% in ten years from 2020, given that it took almost 30 years to reduce carbon levels to under 20%, and this was against a backdrop of severe economic contraction.
• The potential for greenhouse gas emissions reduction in non-ETS sectors (which represented around 60% of the European greenhouse gas emissions in 20134) seems to have been underutilised until now, especially in transportation, buildings and forestry.
Executive summary
44
To start a new section, hold down the apple+shift keys and click
to release this object and type the section title in the box below.
To start a new section, hold down the apple+shift keys and click
to release this object and type the section title in the box below.
4 EEA (2014), Trends and projections in Europe 2014
The road ahead and the main challenges: the path to 2030 and beyondMany roadblocks still need to be overcome. The EU is far from achieving the carbon and energy revolution. The EU has recently decided upon new policy measures, including updated targets for 2030. This 2030 Framework aims to address four current failures of the 3 x 20 policy actions:
• The long-term climate objective of reducing GHG emissions by 80-95% in 2050 compared to 1990 is unlikely to be met based on current trends;
• Long-term security of energy supply remains an issue due to continuing energy import dependence;
• The energy system needs signifi cant investments in renewables, interconnections and energy effi ciency: the EC wants to send the right signal to investors in order to restore confi dence and reduce regulatory risk; and
• The EU needs to achieve energy cost reduction and competitiveness.
Even though the 2030 Framework may alleviate some of the diffi culties we have outlined, more challenges lie ahead:
• The EU needs to revisit its energy market design: energy-only markets have failed to deliver a price signal that provides incentives for investment, especially in countries with large shares of renewables with zero marginal costs. A European-wide capacity market is critical for solving the energy “trilemma” of delivering green, reliable electricity for the future at the lowest possible cost. This implies further development of cross-border connections and more coordination amongst national Transmission System Operators (TSOs).
• Renewable targets versus affordability: how can we reach REN targets without pushing energy prices up for consumers? The EU needs to fi nd alternative ways of fi nancing smart grids, energy effi ciency and renewables while integrating them fully into a competitive market, without leaving the burden mostly borne by household and SME electricity bills: feed-in premia, tax incentive mechanisms, systems of Energy Investment Allowances, or a carbon price fl oor are among the options.
• Are we going to fi x the ETS market and have a market mechanism that produces the right price of carbon? This must start with elimination of the credit surplus. The proposed reforms, including a “backloading” of emission quotas, the creation of a market stability reserve to be used as a “credit buffer” to regulate the price after 2020, and a CO2 reduction target increase from 1.74% annually to 2.2%, are to take place only from 2021 onwards. This is too late to have a carbon price constituting a driver for low-carbon technologies by 2020. Nevertheless, the ambitious 2030 GHG emissions targets (-43% between 2005 and 2030 in the ETS sector) should at last push the carbon price upward. EU lawmakers are perhaps optimistic about the 2030 GHG emissions objective in believing that the EU Member States will be able to reduce their emissions collectively by another 20% in ten years from 2020, given that it took almost 30 years to reduce carbon levels to under 20%, and this was against a backdrop of severe economic contraction.
• The potential for greenhouse gas emissions reduction in non-ETS sectors (which represented around 60% of the European greenhouse gas emissions in 20134) seems to have been underutilised until now, especially in transportation, buildings and forestry.
Executive summary
4
To start a new section, hold down the apple+shift keys and click
to release this object and type the section title in the box below.
• Carbon, renewables and energy effi ciency: do we need so many objectives? Multiple targets create a very complex regulatory context with little visibility, both for investors and fi nal energy consumers. This is relatively burdensome and in some instances may be counterproductive. There is a case for sticking to a single GHG emissions reduction target rather than multiple targets, including for renewable energy and energy effi ciency. Countries and markets would then select the technology they think makes more sense or with a better cost-benefi t ratio. This could be a more effi cient route to a low-carbon and innovative economy in Europe.
• To what extent can technology be part of the solution? One of the biggest challenges ahead may be the role that trends in technology and behaviour will be able to play to alleviate the burden required to meet the ambitious targets for 2030 and 2050. Expectations were high in this regard when the initial targets were set. While we may have witnessed a few breakthroughs (e.g. solar PV), few successes were in sight until this decade despite the political ambitions and the millions of euro spent on research and development (R&D) (e.g. on carbon capture and storage and second generation biofuels). However, over the last few years, things may have begun to change; technological and behavioural innovation has begun to take off. Examples are hybrid and electric vehicles, car sharing, smart meters and smart grids, all of which pave the way for a better demand-side energy management etc.
According to offi cial ex ante evaluations by the EC, the benefi ts of saving energy and resources as the single path to achieving a carbon-free society would by far exceed the cost of the investment requirements. Given the very high costs involved, it would be worthwhile to reassess this ex ante evaluation regularly, once the costs and benefi ts can be evaluated a posteriori – and to adapt policies, if necessary, before they lead us once more into unexpected and unwanted territory.
Executive summary
5 5Energy market reform in Europe

To start a new section, hold down the apple+shift keys and click
to release this object and type the section title in the box below.
To start a new section, hold down the apple+shift keys and click
to release this object and type the section title in the box below.
Introduction
Since the 1992 Earth Summit in Rio and the negotiation of the United Nations Framework Convention on Climate Change (UNFCCC), the European Union has consistently been at the forefront of global action to combat climate change, leading the world to a low-carbon economy. The EU has set itself greenhouse gas emission targets designed to produce an almost carbon-free economy by 2050 in order to make a major contribution to limiting the global temperature increase by the end of the century to 2°C, compared to the pre-industrial average.
As an interim step on the way to 2050, EU leaders in March 2007 set a number of ambitious climate and energy targets known as the “20-20-20 targets by 2020” or the 3 x 20 policy. In this, the EU committed to:
• A 20% reduction in EU greenhouse gas emissions from 1990 levels;
• Raising the share of EU energy consumption produced from renewable resources to 20%; and
• A 20% improvement in the EU’s energy effi ciency.
This 3 x 20 package is a part of a wider European energy strategy5 that aims at enhancing:
• Sustainability;
• Competitiveness and affordability; and
• Security of supply.
The EU energy and climate package has attracted criticism in the last few years, as each day brought more evidence that the policy measures had numerous unexpected, or unintended impacts on the energy markets and industry: an excess of intermittent sources of electricity causing disruption for grid operators, surplus electricity resulting in a price collapse of the wholesale electricity market, electricity price increase at retail level, exit of gas from the fuels for power generation and the advent of coal as an electricity price-setter… At the same time, it has also become evident that EU policy has failed to solve the existing EU energy imbalances in general. Ironically, after years of huge investments aimed at achieving the ambitious policy targets, a number of the objectives still seem to be a long way away. Indeed some may not even be reached, although the economic crisis has placed them within easier reach.
This study aims to:
• Evaluate the current achievements of the EU and a few selected Member States in meeting the 3 x 20 targets on greenhouse emissions, renewables and energy effi ciency;
• Analyse why EU policies did not live up to expectations in terms of achieving a more secure, consistent, competitive and ultimately cleaner energy market; and
• Identify the main challenges on the way to the post-2020 (2030 and 2050) policy targets in the context of the EU’s ultimate goal of achieving “affordability, sustainability and security of supply”.
Our study is based on global analysis at the European level and on more detailed analyses for seven countries (Belgium, France, Germany, Italy, Netherlands, Spain and UK). These are provided in seven dedicated country profi les (available in the appendix) in which Deloitte member fi rms present their view of where each country stands in achieving the 3 x 20 targets, the policies implemented and the remaining challenges.
5 See, for instance “Energy Roadmap 2050 [COM/2011/885]”, “Energy 2020: A strategy for competitive, secure, and sustainable energy [COM(2010)639]”, etc.
66

To start a new section, hold down the apple+shift keys and click
to release this object and type the section title in the box below.
To start a new section, hold down the apple+shift keys and click
to release this object and type the section title in the box below.
Introduction
Since the 1992 Earth Summit in Rio and the negotiation of the United Nations Framework Convention on Climate Change (UNFCCC), the European Union has consistently been at the forefront of global action to combat climate change, leading the world to a low-carbon economy. The EU has set itself greenhouse gas emission targets designed to produce an almost carbon-free economy by 2050 in order to make a major contribution to limiting the global temperature increase by the end of the century to 2°C, compared to the pre-industrial average.
As an interim step on the way to 2050, EU leaders in March 2007 set a number of ambitious climate and energy targets known as the “20-20-20 targets by 2020” or the 3 x 20 policy. In this, the EU committed to:
• A 20% reduction in EU greenhouse gas emissions from 1990 levels;
• Raising the share of EU energy consumption produced from renewable resources to 20%; and
• A 20% improvement in the EU’s energy effi ciency.
This 3 x 20 package is a part of a wider European energy strategy5 that aims at enhancing:
• Sustainability;
• Competitiveness and affordability; and
• Security of supply.
The EU energy and climate package has attracted criticism in the last few years, as each day brought more evidence that the policy measures had numerous unexpected, or unintended impacts on the energy markets and industry: an excess of intermittent sources of electricity causing disruption for grid operators, surplus electricity resulting in a price collapse of the wholesale electricity market, electricity price increase at retail level, exit of gas from the fuels for power generation and the advent of coal as an electricity price-setter… At the same time, it has also become evident that EU policy has failed to solve the existing EU energy imbalances in general. Ironically, after years of huge investments aimed at achieving the ambitious policy targets, a number of the objectives still seem to be a long way away. Indeed some may not even be reached, although the economic crisis has placed them within easier reach.
This study aims to:
• Evaluate the current achievements of the EU and a few selected Member States in meeting the 3 x 20 targets on greenhouse emissions, renewables and energy effi ciency;
• Analyse why EU policies did not live up to expectations in terms of achieving a more secure, consistent, competitive and ultimately cleaner energy market; and
• Identify the main challenges on the way to the post-2020 (2030 and 2050) policy targets in the context of the EU’s ultimate goal of achieving “affordability, sustainability and security of supply”.
Our study is based on global analysis at the European level and on more detailed analyses for seven countries (Belgium, France, Germany, Italy, Netherlands, Spain and UK). These are provided in seven dedicated country profi les (available in the appendix) in which Deloitte member fi rms present their view of where each country stands in achieving the 3 x 20 targets, the policies implemented and the remaining challenges.
5 See, for instance “Energy Roadmap 2050 [COM/2011/885]”, “Energy 2020: A strategy for competitive, secure, and sustainable energy [COM(2010)639]”, etc.
6
To start a new section, hold down the apple+shift keys and click
to release this object and type the section title in the box below.
3 x 20: Are we going to make it?
1. Energy and climate 2020 targets, an interim target en route to 2050With the emerging economies’ insatiable thirst for fossil fuels showing no signs of subsiding and the rise of unconventional hydrocarbon resources, notably the shale oil and gas boom in the US, the geopolitical order of the energy world keeps changing. In the meantime, Europe has embarked upon an unprecedented move towards a low-carbon economy, turning its back on the rest of the world.
For Europe, generating its own renewable-based energy has considerable merit: it mitigates its excessive dependence on outside sources and it gives Europe control over production costs whilst severing (or weakening) the impact of oil prices on the European economies. The policy intention of developing large-scale renewable capacities not only opens up the prospect of a greener world. For EU leaders, it also solves the long-standing geopolitical weakness of Europe as a net energy importer vis-à-vis the resource-rich regions of the world.
Furthermore, the EU’s leaders have developed the view that the move to a low carbon economy will ensure sustainability and cost competitiveness over the mid to long-term for European business: with the increasing development of carbon pricing mechanisms, this will penalise Europe’s carbon intensive competitors.
European energy policy action is driven by the four guiding principles defi ned by the Treaty of Lisbon 20076: (a) ensure the functioning of the energy market; (b) ensure security of energy supply in the Union; (c) promote energy effi ciency and energy saving, and the development of new and renewable forms of energy; and (d) promote the interconnection of energy networks.
The EU authorities have translated this strategy into the following regulatory and policy objectives:
• Creating an EU-wide integrated energy market, through the development of optimised use of interconnections, as a guarantee of price transparency and cost effi ciency;
• Achieving security of supply through an energy effi ciency and renewable energy development policy, with a view to solving Europe’s long-standing, excessive dependence on outside sources as well as keeping control over production costs in the face of dwindling EU hydrocarbon reserves and rising imports; and
• Moving to a sustainable low-carbon economy by reducing carbon emissions and increasing the use of renewable sources in order to achieve sustainability and price competitiveness, thereby weakening the impact of oil prices on the European economies.
The 2050 Energy Roadmap published in March 2011, which charts indicative pathways for EU Member States to move to a low carbon economy6, eventually leads to an unprecedented 80% reduction in GHG emissions compared to the 1990 baseline. This is an objective which some EU countries have already incorporated into national laws.
In addition, several interim targets have been defi ned between now and 2050.
6 Article 194 of the Treaty on the functioning of the European Union as amended by the Treaty of Lisbon 2007. http://eur-lex.europa.eu/legal-content/EN/TXT/?uri=CELEX:12012E/TXT
7 7Energy market reform in Europe
To start a new section, hold down the apple+shift keys and click
to release this object and type the section title in the box below.
To start a new section, hold down the apple+shift keys and click
to release this object and type the section title in the box below.
Figure 1. European targets for 2020, 2030 and 2050 versus 1990 levels, or versus 2005 levels7,8
7 For the defi nition of the “ETS”, see below.
8 Source: http://ec.europa.eu. © European Union, 1995-2015, these targets were made public by the European Commission:
• http://ec.europa.eu/energy/en/topics/energy-strategy
• https://ec.europa.eu/energy/sites/ener/fi les/documents/energy.pdf
• http://europa.eu/legislation_summaries/energy/index_en.htm
9 Source: ©European Union,http://eur-lex.europa.eu/, 1998-2015, http://eur-lex.europa.eu/legal-content/EN/TXT/?uri=uriserv:OJ.L_.2009.140.01.0136.01.ENG
In January 2014, the EC proposed a new framework up to 2030 which aimed to assess the 20-20-20 policy achievement, coordinate Member States’ action and give investors highly needed reassurance. The 2030 targets include a carbon emission abatement to arrive at a 40% reduction compared to 1990 levels, a 27% share of renewables in fi nal energy use (binding at European level) and energy savings of at least 27% (this target being indicative). These were agreed upon by EU leaders in October 2014.
2. The 20-20-20 Member State achievementsIn March 2014, European Commission President, José Manuel Barroso, speaking to the European Council, underlined that the EU as a whole was on its way to meeting, or exceeding, the 3 x 20 targets with an estimated reduction of 24% in greenhouse gas levels by 2020 and a share of renewables of 21%, and a reduction in energy consumption of 17%.
However, the situation varies considerably across Member States. Before looking at this more closely, however, it is important to understand how the targets per Member State were arrived at.
a) Reduction in greenhouse gas (GHG) emissions
How was the greenhouse gas emissions target defi ned per Member State?
The greenhouse gas emission reduction targets at EU level are consistent with the undertakings of the EU under the Kyoto Protocol to the UNFCCC, i.e. a 20% cut below 1990 levels by 2020. However, each EU Member State has individual CO2 reduction targets. These were agreed by the European Council.
They vary markedly from one to another in line with the Effort Sharing Decision (ESD)9, but are consistent with the EU‘s global obligation under the 3 x 20 package.
2020(a) 2030(a) 2050(a)
Increase in energy effi ciency
20% 30% TBD
Share of renewable energy
20% 27% TBD
Reduction in greenhousegas emissions
20% 40% 80 – 95%
Emissions Trading System (ETS) 21%(b) 43%(b) TBD(b)
Non-ETS sectors 10%(b) 30%(b) TBD(b)
(a): Comparison with the 1990 levels (b): Comparison with the 2005 levels
3 x 20: Are we going to make it?
88

To start a new section, hold down the apple+shift keys and click
to release this object and type the section title in the box below.
To start a new section, hold down the apple+shift keys and click
to release this object and type the section title in the box below.
Figure 1. European targets for 2020, 2030 and 2050 versus 1990 levels, or versus 2005 levels7,8
7 For the defi nition of the “ETS”, see below.
8 Source: http://ec.europa.eu. © European Union, 1995-2015, these targets were made public by the European Commission:
• http://ec.europa.eu/energy/en/topics/energy-strategy
• https://ec.europa.eu/energy/sites/ener/fi les/documents/energy.pdf
• http://europa.eu/legislation_summaries/energy/index_en.htm
9 Source: ©European Union,http://eur-lex.europa.eu/, 1998-2015, http://eur-lex.europa.eu/legal-content/EN/TXT/?uri=uriserv:OJ.L_.2009.140.01.0136.01.ENG
In January 2014, the EC proposed a new framework up to 2030 which aimed to assess the 20-20-20 policy achievement, coordinate Member States’ action and give investors highly needed reassurance. The 2030 targets include a carbon emission abatement to arrive at a 40% reduction compared to 1990 levels, a 27% share of renewables in fi nal energy use (binding at European level) and energy savings of at least 27% (this target being indicative). These were agreed upon by EU leaders in October 2014.
2. The 20-20-20 Member State achievementsIn March 2014, European Commission President, José Manuel Barroso, speaking to the European Council, underlined that the EU as a whole was on its way to meeting, or exceeding, the 3 x 20 targets with an estimated reduction of 24% in greenhouse gas levels by 2020 and a share of renewables of 21%, and a reduction in energy consumption of 17%.
However, the situation varies considerably across Member States. Before looking at this more closely, however, it is important to understand how the targets per Member State were arrived at.
a) Reduction in greenhouse gas (GHG) emissions
How was the greenhouse gas emissions target defi ned per Member State?
The greenhouse gas emission reduction targets at EU level are consistent with the undertakings of the EU under the Kyoto Protocol to the UNFCCC, i.e. a 20% cut below 1990 levels by 2020. However, each EU Member State has individual CO2 reduction targets. These were agreed by the European Council.
They vary markedly from one to another in line with the Effort Sharing Decision (ESD)9, but are consistent with the EU‘s global obligation under the 3 x 20 package.
2020(a) 2030(a) 2050(a)
Increase in energy effi ciency
20% 30% TBD
Share of renewable energy
20% 27% TBD
Reduction in greenhousegas emissions
20% 40% 80 – 95%
Emissions Trading System (ETS) 21%(b) 43%(b) TBD(b)
Non-ETS sectors 10%(b) 30%(b) TBD(b)
(a): Comparison with the 1990 levels (b): Comparison with the 2005 levels
3 x 20: Are we going to make it?
8
To start a new section, hold down the apple+shift keys and click
to release this object and type the section title in the box below.
10 Source: http://ec.europa.eu. © European Union, 1995-2015, European Commission, chart available here: http://ec.europa.eu/clima/policies/effort/index_en.htm
11 EEA (2014), Trends and projections in Europe 2014
12 Directive 2009/30/EC of the European Parliament and of the Council of 23 April 2009 amending Directive 98/70/EC as regards the specifi cation of petrol, diesel and gas-oil and introducing a mechanism to monitor and reduce greenhouse gas emissions (http://eur-lex.europa.eu/legal-content/EN/TXT/?uri=CELEX:32009L0030)
13 Regulation No 443/2009 of 23 April 2009 setting emission performance standards for new passenger cars as part of the Community’s integrated approach toreduce CO2 emissions from light-duty vehicles
14 EEA (2015), Trends and projections in Europe 2014
Figure 2. GHG emission reduction national targets in the non-ETS sector, compared to 2005 levels10
By 2020, the national targets will collectively deliver a reduction of around 10% in total emissions from the non-ETS sectors (CO2 emissions from sectors outside the Emissions Trading System) and a 21% reduction in emissions for the sectors covered by the ETS (both compared to 2005 levels).
In 2013, according to the European Environment Agency (EEA), all installations covered by the EU ETS emitted 1,908 MtCO2eq, which represents about 40% of total GHG emissions11. More ambitious reduction targets were set for the ETS sectors than for the non-ETS sectors partly because the ETS sector is more concentrated (a relatively low number of major industrial installations), and partly not to penalise the industrial development of new Member States in particular. The split between ETS and non-ETS GHG emissions varies greatly amongst Member States and so do national reduction targets.
In the non-ETS sector, targets range from -20% for Denmark and -17% for Sweden, to +14% for Poland and +20% for Bulgaria. Several policy measures are tackling GHG emissions from transport. The Fuel Quality Directive (FQD)12 requires that transportation fuel suppliers reduce life cycle greenhouse gas emissions per unit of energy from fuel and energy supplied by up to 10% by 31 December 2020.
Additionally, a 2009 Regulation13 set CO2 emission limit values for new cars: it set legally-binding emission targets for new cars (fl eet average) of 130 gCO2/km by 2015 and of 95 gCO2/km by 2021.
In the ETS sector, targets are set by way of a GHG emission quota allocation for each industrial site covered. As a result, ETS abatement is not reported at national level, but at manufacturing sector level or globally at EU level. Any European citizen will fi nd it hard to understand the rationale behind the ETS objectives at EU Member State level: a country like Poland, with more than 90% coal-based electricity, is allowed to increase its emissions whilst Sweden, which is almost half hydro and half nuclear, is committed to reducing its emissions by 17%. The main rationale behind ETS objectives, when they were decided upon at national level in 2005, was to allow Eastern European countries to catch up with the West and avoid impeding their economic development.
EU Emissions Trading System (ETS)Launched in 2005, the EU ETS (Emissions Trading System) is the cornerstone of the European Union’s drive to reduce its emissions of greenhouse gases (GHG). It covers more than 11,000 power stations and manufacturing plants in the 28 EU Member States as well as Iceland, Liechtenstein and Norway. Aviation operators fl ying within and between most of these countries have also been included since 2012. In total, around 40% of total EU emissions were limited by the EU ETS in 201314. In 2020, emissions from sectors covered by the EU ETS are due to be 21% lower than in 2005. By 2030, the Commission proposes that they be 43% lower.
-20%
-15%
-10%
-5%
0%
5%
10%
15%
20%
EU28BGROLVLTPLSKJREEHUCZMTSIPTGRCYESITFRDEBEUKNLFIATSEIEDKLU
3 x 20: Are we going to make it?
9 9Energy market reform in Europe

To start a new section, hold down the apple+shift keys and click
to release this object and type the section title in the box below.
To start a new section, hold down the apple+shift keys and click
to release this object and type the section title in the box below.
Where do we stand with greenhouse gas emissions targets?
Figure 3. EU-28 GHG emissions by sector, 1990-2012, and 2020 target (MtCO2eq)15
The EU-28 are well on their way to meeting their overall GHG emissions target, especially thanks to a reduction in emissions during the last few years: GHG emissions decreased by 3% in the 15 years between 1990 and 2005, and by 11% in the seven years between 2005 and 2012. A reduction of 7% is still needed between 2012 and 2020.
The graph below measures the positions of our EU Member State sample relative to each other. It depicts the results achieved by each country in meeting their 2020 objective and the distance each still has to go.
Partly due to the economic crisis, three countries (Belgium, Italy and Spain) have already met their GHG emission targets. The UK and France seem to be well on the way to reaching theirs, but there is a high level of uncertainty still about Germany and the Netherlands.
As of 2012, the Netherlands was till 53% short of the target. However, there was a signifi cant decrease in non-ETS GHG emissions in 2013 (from 117 MtCO2eq in 2012 to 108 MtCO2eq in 2013).
Figure 4. Percentage of the GHG emission target already achieved between 2005 and 2012 for seven countries16
15 EEA GHG emissions Data Viewer
16 This percentage of achievement is calculated as the ratio between the “current” distance to target (i.e. the distance to target between 2012 and 2020) and the “initial” distance to target (i.e. the distance to target between 2005 and 2020). The calculations are based on the data presented in the country profi le of each of the seven countries. These country profi les are available in appendix.
0
500
1000
1500
2000
2500
3000
3500
4000
2020201220051990
Energy Industries Transport Industry Agriculture Waste Target
0% 100%
Netherlands
France
Italy
Germany Spain
Belgium
N
Percentage of the target already achieved between 2005 and 2012
GHG
UK
3 x 20: Are we going to make it?
1010

To start a new section, hold down the apple+shift keys and click
to release this object and type the section title in the box below.
To start a new section, hold down the apple+shift keys and click
to release this object and type the section title in the box below.
Where do we stand with greenhouse gas emissions targets?
Figure 3. EU-28 GHG emissions by sector, 1990-2012, and 2020 target (MtCO2eq)15
The EU-28 are well on their way to meeting their overall GHG emissions target, especially thanks to a reduction in emissions during the last few years: GHG emissions decreased by 3% in the 15 years between 1990 and 2005, and by 11% in the seven years between 2005 and 2012. A reduction of 7% is still needed between 2012 and 2020.
The graph below measures the positions of our EU Member State sample relative to each other. It depicts the results achieved by each country in meeting their 2020 objective and the distance each still has to go.
Partly due to the economic crisis, three countries (Belgium, Italy and Spain) have already met their GHG emission targets. The UK and France seem to be well on the way to reaching theirs, but there is a high level of uncertainty still about Germany and the Netherlands.
As of 2012, the Netherlands was till 53% short of the target. However, there was a signifi cant decrease in non-ETS GHG emissions in 2013 (from 117 MtCO2eq in 2012 to 108 MtCO2eq in 2013).
Figure 4. Percentage of the GHG emission target already achieved between 2005 and 2012 for seven countries16
15 EEA GHG emissions Data Viewer
16 This percentage of achievement is calculated as the ratio between the “current” distance to target (i.e. the distance to target between 2012 and 2020) and the “initial” distance to target (i.e. the distance to target between 2005 and 2020). The calculations are based on the data presented in the country profi le of each of the seven countries. These country profi les are available in appendix.
0
500
1000
1500
2000
2500
3000
3500
4000
2020201220051990
Energy Industries Transport Industry Agriculture Waste Target
0% 100%
Netherlands
France
Italy
Germany Spain
Belgium
N
Percentage of the target already achieved between 2005 and 2012
GHG
UK
3 x 20: Are we going to make it?
10
To start a new section, hold down the apple+shift keys and click
to release this object and type the section title in the box below.
In Germany, the phasing out of nuclear power combined with the commissioning of more coal fi red capacity could lead to a notable increase in CO2 emissions, thus jeopardising reaching the GHG emission target.
According to the European Environment Agency (EEA)17, a comparison of national non-ETS GHG emissions in 2013 relative to the indicative 2013 target (calculated on the basis of a linear decrease between 2005 and the 2020 target) shows that most countries have reached their target. The exceptions are Germany, Luxembourg and Poland.
Figure 5. Reducing greenhouse gas emissions: achievements in seven countries in 2012
17 EEA (2014), Trends and projections in Europe 2014
UK:
• 81% of the objectives already achieved in 2012.
• Under the 2008 Climate Change Act, the UK has set highly ambitious targets in a bid to be a champion in the fi ght against climate change.
• Numerous policies affect energy pricing mechanisms, including Carbon Price Floor.
Belgium:
• In 2012, GHG emissions were already below the 2020 target but emissions might rise.
• The nuclear phase-out might prove to be counter-productive to keep carbon and energy prices, low.
Netherlands:
• 47% of 2020 target met in 2012.
• Will need a number of additional measures to meet 2020 targets.
Germany:
• Already 62% of target achieved in 2012, but GHG emissions are on the rise.
• Emissions have gone up since Germany shut down eight nuclear plants in 2011.
• With its planned phase out of nuclear power, its high dependence on coal and 11.5 GW of coal plants under construction, it is highly questionable if the remaining 38% of CO2 reduction can be achieved by 2020.
France:
• 76% of the target already achieved in 2012.
• With its large nuclear and hydro power base, the 2020 GHG emissions target for France seems reasonably attainable’, especially in the ETS sector.
• In the non-ETS sector, reaching the target mostly depends on energy effi ciency measures applied to buildings and Light Duty Vehicles as well as the development of more renewables.
Spain:
• In 2012, GHG emissions were below the targets for 2020, because of the economic contraction.
• Achieving targets could prove problematic if the economy picks up.
Italy:
• 2020 target already over-achieved in 2012, partly because of the economic crisis.
• But Italy committed to more ambitious emission reduction targets.
• Additional reductions in GHG emissions are expected through energy effi ciency and renewable energy measures.
• Economic recovery might result in an emissions increase.
Greenhouse gas emissions
3 x 20: Are we going to make it?
11 11Energy market reform in Europe

To start a new section, hold down the apple+shift keys and click
to release this object and type the section title in the box below.
To start a new section, hold down the apple+shift keys and click
to release this object and type the section title in the box below.
The EU-28 are well on their way to meeting their overall GHG emissions target, especially thanks to a reduction in emissions during the last few years.
However, the key challenges in greenhouse gas emissions reductions in the next few years will be:
• Economic recovery: It should be borne in mind that the relative success of a few EU Member States in reducing their carbon emissions is a result which was made easier by (if not entirely attributable to) the sharp economic decline resulting from the fi nancial crisis. A European economic recovery could wipe out part of the GHG emissions reductions that have already been achieved.
• Nuclear phase-out: Several European countries have decided during the last few years to phase out nuclear power, either completely or partially. Most substitutes for this carbon-free generation technology are likely to generate an increase in carbon emissions.
• Coal dilemma: The low cost of generation and plentiful supply are tempting to investors, but coal has a high environmental impact and most CCS (carbon capture and storage) projects have stalled, or have been cancelled.
b) Share of renewable energy in fi nal energy consumption
How was the REN target defi ned per Member State?
The Renewable Energy Directive (RED)18 sets legally binding individual targets for each Member State (art. 3.1). Individual targets differ considerably from one country to another. They are however consistent with a 20% share of energy from renewable sources in fi nal energy consumption at European Union level in 2020. They range from 11% for Luxembourg to 30% for Denmark and even 49% for Sweden, where the share of renewable energy use is already high, however for Germany it is only 18%.
The rationale for these differentiated objectives refl ects the diversity of national energy mixes and the potential for development of renewable energy sources across the EU, the discrepancy in economic development of Eastern and Western Europe, as well as the capital investment which would be needed to meet these policy targets. But the RED also sets a target for the share of energy from renewable sources in transport in 2020, which is identical for all Member States: at least 10% of the fi nal consumption of energy in transport (art. 3.4).
It is worth noting that the REN target is expressed as a percentage of fi nal energy consumption in 2020. As a consequence, the percentage of REN will critically depend on the denominator of the ratio, which is fi nal energy consumption in 2020. The latter will not be determined until after 2020.
Where do we stand with the renewable energy target? At EU level, the target is for renewable energy to account for 20% of the overall energy consumption mix by 2020 (vs. 8.7% in 2005 and 14.0% 2012).
18 Directive 2009/28/EC of 23 April 2009 on the promotion of the use of energy from renewable sources and amending and subsequently repealing Directives 2001/77/EC and 2003/30/EC.
3 x 20: Are we going to make it?
1212

To start a new section, hold down the apple+shift keys and click
to release this object and type the section title in the box below.
To start a new section, hold down the apple+shift keys and click
to release this object and type the section title in the box below.
The EU-28 are well on their way to meeting their overall GHG emissions target, especially thanks to a reduction in emissions during the last few years.
However, the key challenges in greenhouse gas emissions reductions in the next few years will be:
• Economic recovery: It should be borne in mind that the relative success of a few EU Member States in reducing their carbon emissions is a result which was made easier by (if not entirely attributable to) the sharp economic decline resulting from the fi nancial crisis. A European economic recovery could wipe out part of the GHG emissions reductions that have already been achieved.
• Nuclear phase-out: Several European countries have decided during the last few years to phase out nuclear power, either completely or partially. Most substitutes for this carbon-free generation technology are likely to generate an increase in carbon emissions.
• Coal dilemma: The low cost of generation and plentiful supply are tempting to investors, but coal has a high environmental impact and most CCS (carbon capture and storage) projects have stalled, or have been cancelled.
b) Share of renewable energy in fi nal energy consumption
How was the REN target defi ned per Member State?
The Renewable Energy Directive (RED)18 sets legally binding individual targets for each Member State (art. 3.1). Individual targets differ considerably from one country to another. They are however consistent with a 20% share of energy from renewable sources in fi nal energy consumption at European Union level in 2020. They range from 11% for Luxembourg to 30% for Denmark and even 49% for Sweden, where the share of renewable energy use is already high, however for Germany it is only 18%.
The rationale for these differentiated objectives refl ects the diversity of national energy mixes and the potential for development of renewable energy sources across the EU, the discrepancy in economic development of Eastern and Western Europe, as well as the capital investment which would be needed to meet these policy targets. But the RED also sets a target for the share of energy from renewable sources in transport in 2020, which is identical for all Member States: at least 10% of the fi nal consumption of energy in transport (art. 3.4).
It is worth noting that the REN target is expressed as a percentage of fi nal energy consumption in 2020. As a consequence, the percentage of REN will critically depend on the denominator of the ratio, which is fi nal energy consumption in 2020. The latter will not be determined until after 2020.
Where do we stand with the renewable energy target? At EU level, the target is for renewable energy to account for 20% of the overall energy consumption mix by 2020 (vs. 8.7% in 2005 and 14.0% 2012).
18 Directive 2009/28/EC of 23 April 2009 on the promotion of the use of energy from renewable sources and amending and subsequently repealing Directives 2001/77/EC and 2003/30/EC.
3 x 20: Are we going to make it?
12
To start a new section, hold down the apple+shift keys and click
to release this object and type the section title in the box below.
Figure 6. RES19 share in gross fi nal energy consumption (%)20
The fi gure above compares the share of renewable energy sources in fi nal energy consumption in 2011-2012 with the targeted share in 2020.
The picture is different if we compare the efforts made by individual countries between 2005 and 2012 with what needs to be done between 2005 and 2020, as the graph below shows.
This fi gure makes it possible to visualise the achievement between 2005 and 2012 and the effort to be made between 2005 and 2020. France, the Netherlands and the UK need to make an additional effort equivalent to increasing their existing (non-hydro) renewable energy share in fi nal energy consumption by 50%, 220% and 320% respectively.
Despite all of its efforts to develop and fi nance renewable electricity generation, a country like the Netherlands needs to decarbonise its energy mix by 5 Mtoe, essentially through offshore wind development. This is equivalent to 60 TWh of renewables or more than 20 GW of wind capacity.
Figure 7. Percentage of the renewable energy target already achieved between 2005 and 2012 for seven countries21
19 RES stands for Renewable Energy Source
20 Figure extracted from: EEA (2014), Trends and projections in Europe 2014, available online on: http://www.eea.europa.eu/publications/trends-and-projections-in-europe-2014
21 This percentage of achievement is calculated as the ratio between the “current” distance to target (i.e. the distance to target between 2012 and 2020) and the “initial” distance to target (i.e. the distance to target between 2005 and 2020). The calculations are based on the data presented in the country profi le of each of the seven countries. These country profi les are available in appendix0% 100%
Netherlands
UK
France
Italy
Germany
Spain
Belgium
Percentage of the target already achieved between 2005 and 2012
Renewable energy
Swed
en
Bulga
ria
Esto
niaItaly
Lithu
ania
Greec
e
Denm
ark
Rom
ania
Austri
a
Finlan
d
Hunga
ry
Germ
any
Slova
kia
Croa
tia
Slove
nia
Czec
h Re
publi
c
Belgi
um
Cypr
us
Polan
d
Latv
iaSp
ain
Irelan
d
Luxe
mbo
urg
United
King
dom
Portu
gal
Fran
ce
Nethe
rland
s
Malt
a* EU
Norway
Icelan
d
Average 2011–2012 RES share 2011–2012 RED indicative target 2020 target
– 10
0
10
20
30
40
50
60
70
80
90
RES share in gross final energy consumption (%)
3 x 20: Are we going to make it?
13 13Energy market reform in Europe
To start a new section, hold down the apple+shift keys and click
to release this object and type the section title in the box below.
To start a new section, hold down the apple+shift keys and click
to release this object and type the section title in the box below.
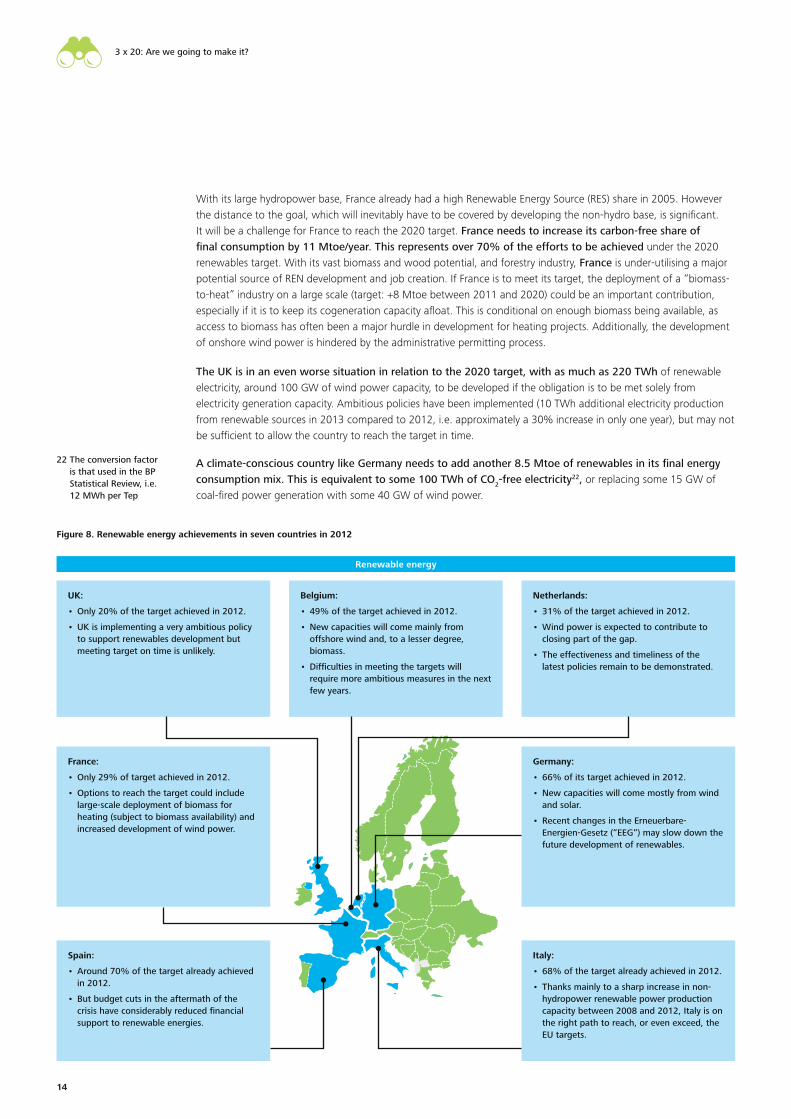
With its large hydropower base, France already had a high Renewable Energy Source (RES) share in 2005. However the distance to the goal, which will inevitably have to be covered by developing the non-hydro base, is signifi cant. It will be a challenge for France to reach the 2020 target. France needs to increase its carbon-free share of fi nal consumption by 11 Mtoe/year. This represents over 70% of the efforts to be achieved under the 2020 renewables target. With its vast biomass and wood potential, and forestry industry, France is under-utilising a major potential source of REN development and job creation. If France is to meet its target, the deployment of a “biomass-to-heat” industry on a large scale (target: +8 Mtoe between 2011 and 2020) could be an important contribution, especially if it is to keep its cogeneration capacity afl oat. This is conditional on enough biomass being available, as access to biomass has often been a major hurdle in development for heating projects. Additionally, the development of onshore wind power is hindered by the administrative permitting process.
The UK is in an even worse situation in relation to the 2020 target, with as much as 220 TWh of renewable electricity, around 100 GW of wind power capacity, to be developed if the obligation is to be met solely from electricity generation capacity. Ambitious policies have been implemented (10 TWh additional electricity production from renewable sources in 2013 compared to 2012, i.e. approximately a 30% increase in only one year), but may not be suffi cient to allow the country to reach the target in time.
A climate-conscious country like Germany needs to add another 8.5 Mtoe of renewables in its fi nal energy consumption mix. This is equivalent to some 100 TWh of CO2-free electricity22, or replacing some 15 GW of coal-fi red power generation with some 40 GW of wind power.
Figure 8. Renewable energy achievements in seven countries in 2012
UK:
• Only 20% of the target achieved in 2012.
• UK is implementing a very ambitious policy to support renewables development but meeting target on time is unlikely.
Belgium:
• 49% of the target achieved in 2012.
• New capacities will come mainly from offshore wind and, to a lesser degree, biomass.
• Diffi culties in meeting the targets will require more ambitious measures in the next few years.
Netherlands:
• 31% of the target achieved in 2012.
• Wind power is expected to contribute to closing part of the gap.
• The effectiveness and timeliness of the latest policies remain to be demonstrated.
Germany:
• 66% of its target achieved in 2012.
• New capacities will come mostly from wind and solar.
• Recent changes in the Erneuerbare-Energien-Gesetz (“EEG“) may slow down the future development of renewables.
France:
• Only 29% of target achieved in 2012.
• Options to reach the target could include large-scale deployment of biomass for heating (subject to biomass availability) and increased development of wind power.
Spain:
• Around 70% of the target already achieved in 2012.
• But budget cuts in the aftermath of the crisis have considerably reduced fi nancial support to renewable energies.
Italy:
• 68% of the target already achieved in 2012.
• Thanks mainly to a sharp increase in non-hydropower renewable power production capacity between 2008 and 2012, Italy is on the right path to reach, or even exceed, the EU targets.
Renewable energy
22 The conversion factor is that used in the BP Statistical Review, i.e. 12 MWh per Tep
3 x 20: Are we going to make it?
1414

To start a new section, hold down the apple+shift keys and click
to release this object and type the section title in the box below.
To start a new section, hold down the apple+shift keys and click
to release this object and type the section title in the box below.
With its large hydropower base, France already had a high Renewable Energy Source (RES) share in 2005. However the distance to the goal, which will inevitably have to be covered by developing the non-hydro base, is signifi cant. It will be a challenge for France to reach the 2020 target. France needs to increase its carbon-free share of fi nal consumption by 11 Mtoe/year. This represents over 70% of the efforts to be achieved under the 2020 renewables target. With its vast biomass and wood potential, and forestry industry, France is under-utilising a major potential source of REN development and job creation. If France is to meet its target, the deployment of a “biomass-to-heat” industry on a large scale (target: +8 Mtoe between 2011 and 2020) could be an important contribution, especially if it is to keep its cogeneration capacity afl oat. This is conditional on enough biomass being available, as access to biomass has often been a major hurdle in development for heating projects. Additionally, the development of onshore wind power is hindered by the administrative permitting process.
The UK is in an even worse situation in relation to the 2020 target, with as much as 220 TWh of renewable electricity, around 100 GW of wind power capacity, to be developed if the obligation is to be met solely from electricity generation capacity. Ambitious policies have been implemented (10 TWh additional electricity production from renewable sources in 2013 compared to 2012, i.e. approximately a 30% increase in only one year), but may not be suffi cient to allow the country to reach the target in time.
A climate-conscious country like Germany needs to add another 8.5 Mtoe of renewables in its fi nal energy consumption mix. This is equivalent to some 100 TWh of CO2-free electricity22, or replacing some 15 GW of coal-fi red power generation with some 40 GW of wind power.
Figure 8. Renewable energy achievements in seven countries in 2012
UK:
• Only 20% of the target achieved in 2012.
• UK is implementing a very ambitious policy to support renewables development but meeting target on time is unlikely.
Belgium:
• 49% of the target achieved in 2012.
• New capacities will come mainly from offshore wind and, to a lesser degree, biomass.
• Diffi culties in meeting the targets will require more ambitious measures in the next few years.
Netherlands:
• 31% of the target achieved in 2012.
• Wind power is expected to contribute to closing part of the gap.
• The effectiveness and timeliness of the latest policies remain to be demonstrated.
Germany:
• 66% of its target achieved in 2012.
• New capacities will come mostly from wind and solar.
• Recent changes in the Erneuerbare-Energien-Gesetz (“EEG“) may slow down the future development of renewables.
France:
• Only 29% of target achieved in 2012.
• Options to reach the target could include large-scale deployment of biomass for heating (subject to biomass availability) and increased development of wind power.
Spain:
• Around 70% of the target already achieved in 2012.
• But budget cuts in the aftermath of the crisis have considerably reduced fi nancial support to renewable energies.
Italy:
• 68% of the target already achieved in 2012.
• Thanks mainly to a sharp increase in non-hydropower renewable power production capacity between 2008 and 2012, Italy is on the right path to reach, or even exceed, the EU targets.
Renewable energy
22 The conversion factor is that used in the BP Statistical Review, i.e. 12 MWh per Tep
3 x 20: Are we going to make it?
14
To start a new section, hold down the apple+shift keys and click
to release this object and type the section title in the box below.
c) Reduction of fi nal energy consumption: energy effi ciency target
How was the energy effi ciency target defi ned per Member State?
EU energy effi ciency targets are expressed in all sorts of ways for each Member State, using different units, based on different assumptions and with varying levels of ambition. The relative targets expressed in energy savings are most often calculated ex post.
The Energy Effi ciency Directive25 set several targets for 2020 at European level:
• A target expressed in relative terms: a 20% headline target on energy effi ciency (art. 1); the Directive does not defi ne the baseline for estimating this 20% EE target.
• Targets expressed in absolute terms, i.e. in the form of a 1,474 Mtoe ceiling on primary energy consumption or a 1,078 Mtoe cap on fi nal energy (art. 3.1.a)26.
Savings objectives for primary and fi nal energy consumption have been calculated for the EU only, not for individual Member States.
The Member States have set indicative, and not mandatory, national energy effi ciency targets for 2020, as required by the Energy Effi ciency Directive. Each Member State is at liberty to express its efforts in terms of primary energy consumption (PEC), or fi nal energy consumption (FEC)27, primary or fi nal energy savings, or energy intensity. Each is required to explain how, and on the basis of which data, this has been calculated (art. 3.1).
23 http://www.wiwo.de/politik/deutschland/trotz-reform-verbraucher-werden-2015-eine-milliarde-euro-mehr-eeg-umlage-bezahlen/9414526.html
24 Cour des comptes (2013), La politique de développement des énergies renouvelables – juillet 2013
25 Directive 2012/27/EU of the European Parliament and of the Council of 25 October 2012 on energy effi ciency, amending Directives 2009/125/EC and 2010/30/EU and repealing Directives 2004/8/EC and 2006/32/EC
26 With the accession of Croatia the target was revised to 1,483 Mtoe primary energy or no more than 1,086 Mtoe of fi nal energy
27 See the defi nition in the ‘List of acronyms’ part, at the end of the document
The increase in the share of renewables in the energy mix has been supported by heavy public fi nancial packages (fi nancial or fi scal incentives, feed-in tariffs based on a guaranteed price for a given number of years, frequently 20 years and green certifi cates) which have attracted signifi cant investment. For instance, in Germany, the renewable energy sector is currently subsidized with approximately EUR 19.4 billion per year (EUR 240 per inhabitant in 201423); in France, the cost of supporting renewables in power production was estimated to be around €14.3 billion for the period 2006-2011 and is expected to be around € 40.5 billion for the 2012-2020 period24. Some of this capital expenditure was passed through to energy prices, thus pushing up prices signifi cantly for fi nal consumers in most countries (e.g. around +32% in Germany between 2008 and 2013).
It is hard to see how the renewables objective will be met:
• Some major economies in the EU (including France and the UK) still need to make signifi cant efforts to meet their targets. They need to consider serious capacity development in a short space of time. This will result in more public spending or support, or another electricity price increase in a context of ailing European business.
• The development of biofuels on a large scale could help in getting closer to target, but concerns about biofuel sustainability (the food versus fuel debate), biomass availability or the development of mature and economic processes for producing second generation biofuels have led European legislators to put any evolution of biofuel incorporation rate on standby; there is no sign today that the legislation on incorporating a higher share of biofuels in gasoline or diesel will be modifi ed any time soon.
• Achieving the renewables objective will therefore depend on the baseline against which the percentage of renewables is ultimately based, i.e. what the fi nal energy consumption will actually be for each Member State by 2020. If the recovery drives energy consumption up, energy production from renewable sources will have to increase further to reach the targets expressed as a share of energy consumption.
3 x 20: Are we going to make it?
15 15Energy market reform in Europe

To start a new section, hold down the apple+shift keys and click
to release this object and type the section title in the box below.
To start a new section, hold down the apple+shift keys and click
to release this object and type the section title in the box below.
Table 1. The diversity of national energy effi ciency targets
Targets regarding PEC and FEC
Energy savings targetExpressed in relative
termsExpressed in absolute terms
Relative targetPrimary energy
consumption targetFinal energy
consumption target
Belgium -18% of PEC, as compared to a 2020 projection (calculated using the PRIMES 2007 model)
France 20% energy savings versus 2020 energy demand projections
236 Mtoe 131 Mtoe
Germany -20% of PEC compared to 2008
277 Mtoe
Italy 126 Mtoe (indicative) Minimum energy savings of 15.5 Mtoe in 2020 (binding)
Netherlands 52 Mtoe Energy savings of 482 PJ (11.5 Mtoe) in 2020 compared to 2007.
Spain 119.9 Mtoe (i.e. 26.4% reduction in BAU)
UK 129 Mtoe (indicative), i.e. -18% compared to a BAU scenario (calculated in 2007).
BAU: Business as usual
The diversity of criteria and the number of different units and interpretations make it diffi cult to assess or even measure the materiality of each Member State’s efforts towards reducing primary energy demand, especially as the reference dates or objectives were not defi ned until late. The confusion makes it very diffi cult for any EU citizen to understand EU energy policies and see how their individual action can help in this area.
Where do we stand with the energy effi ciency target? By 2012, the European Union had already achieved 56% of its primary energy consumption target and 83% of its fi nal energy consumption target.
3 x 20: Are we going to make it?
1616

To start a new section, hold down the apple+shift keys and click
to release this object and type the section title in the box below.
To start a new section, hold down the apple+shift keys and click
to release this object and type the section title in the box below.
Table 1. The diversity of national energy effi ciency targets
Targets regarding PEC and FEC
Energy savings targetExpressed in relative
termsExpressed in absolute terms
Relative targetPrimary energy
consumption targetFinal energy
consumption target
Belgium -18% of PEC, as compared to a 2020 projection (calculated using the PRIMES 2007 model)
France 20% energy savings versus 2020 energy demand projections
236 Mtoe 131 Mtoe
Germany -20% of PEC compared to 2008
277 Mtoe
Italy 126 Mtoe (indicative) Minimum energy savings of 15.5 Mtoe in 2020 (binding)
Netherlands 52 Mtoe Energy savings of 482 PJ (11.5 Mtoe) in 2020 compared to 2007.
Spain 119.9 Mtoe (i.e. 26.4% reduction in BAU)
UK 129 Mtoe (indicative), i.e. -18% compared to a BAU scenario (calculated in 2007).
BAU: Business as usual
The diversity of criteria and the number of different units and interpretations make it diffi cult to assess or even measure the materiality of each Member State’s efforts towards reducing primary energy demand, especially as the reference dates or objectives were not defi ned until late. The confusion makes it very diffi cult for any EU citizen to understand EU energy policies and see how their individual action can help in this area.
Where do we stand with the energy effi ciency target? By 2012, the European Union had already achieved 56% of its primary energy consumption target and 83% of its fi nal energy consumption target.
3 x 20: Are we going to make it?
16
To start a new section, hold down the apple+shift keys and click
to release this object and type the section title in the box below.
In 2012, the targets in absolute terms were reached or nearly met by a few Member States, including Spain, Italy and the Netherlands. Here again, the economic crisis and subsequent energy demand reduction played a role. But if economic recovery occurs as planned, energy consumption may rise again, endangering achievement of the target in 2020.
On the effi ciency criterion, as in the case of the GHG emissions reduction or renewables targets, the major economies seem to be a long way off. Germany is a little more than one fi fth of the way towards the target and France just about a third.
Figure 11. Change in fi nal energy consumption (FEC) compared to 2005 (%)30
It can be seen from the fi gure above that the countries that have been most successful in reducing their fi nal energy consumption and moving this closer to the target are those worst hit by the fi nancial crisis, including Ireland, Portugal, Greece, Italy, Spain and Hungary.
This picture is somewhat misleading, however, since it is based on a single criterion (fi nal energy consumption), which most often represents only a part, or even an interpretation of multi-indicator national targets.
28 Calculations based on Eurostat data, Source: Eurostat. © European Union, 1995-2015, http://ec.europa.eu/eurostat/tgm/refreshTableAction.do?tab=table&plugin=1&pcode=t2020_33&language=en
29 Calculations based on Eurostat data, Source: Eurostat. © European Union, 1995-2015, http://ec.europa.eu/eurostat/tgm/table.do?tab=table&init=1&language=en&pcode=tsdpc320&plugin=1
30 Figure extracted from EEA (2014), Trends and projections in Europe 2014, available online on: http://www.eea.europa.eu/publications/trends-and-projections-in-europe-2014
Figure 9. EU-28 primary energy consumption 2005-2012 and target (Mtoe)28
Figure 10. EU-28 fi nal energy consumption 2005-2012 and target (Mtoe)29
1,400
1,450
1,500
1,550
1,600
1,650
1,700
1,750
202020122005
1,712 Mtoe
1,584 Mtoe
1,483 Mtoe
1,000
1,050
1,100
1,150
1,200
1,250
202020122005
1,189 Mtoe
1,103 Mtoe1,086 Mtoe
EU
Lithu
ania
Hunga
ry
Rom
ania
Portu
gal
Greec
eLa
tvia
Italy
Cypr
us
Slova
kia
Irelan
dSp
ain
Luxe
mbo
urg
Finlan
a
Denm
ark
Slove
nia
United
King
dom
Czec
h Re
publi
cM
alta
Fran
ce
Austri
a
Germ
any
Polan
d
Esto
nia
Bulga
ria
Belgi
um
Nethe
rland
s
Swed
en
Croa
tia-30
-20
-10
0
10
20
30
40
50
% change compared to 2005 final energy consumption (FEC)
2012 FEC 2020 FEC target
3 x 20: Are we going to make it?
17 17Energy market reform in Europe
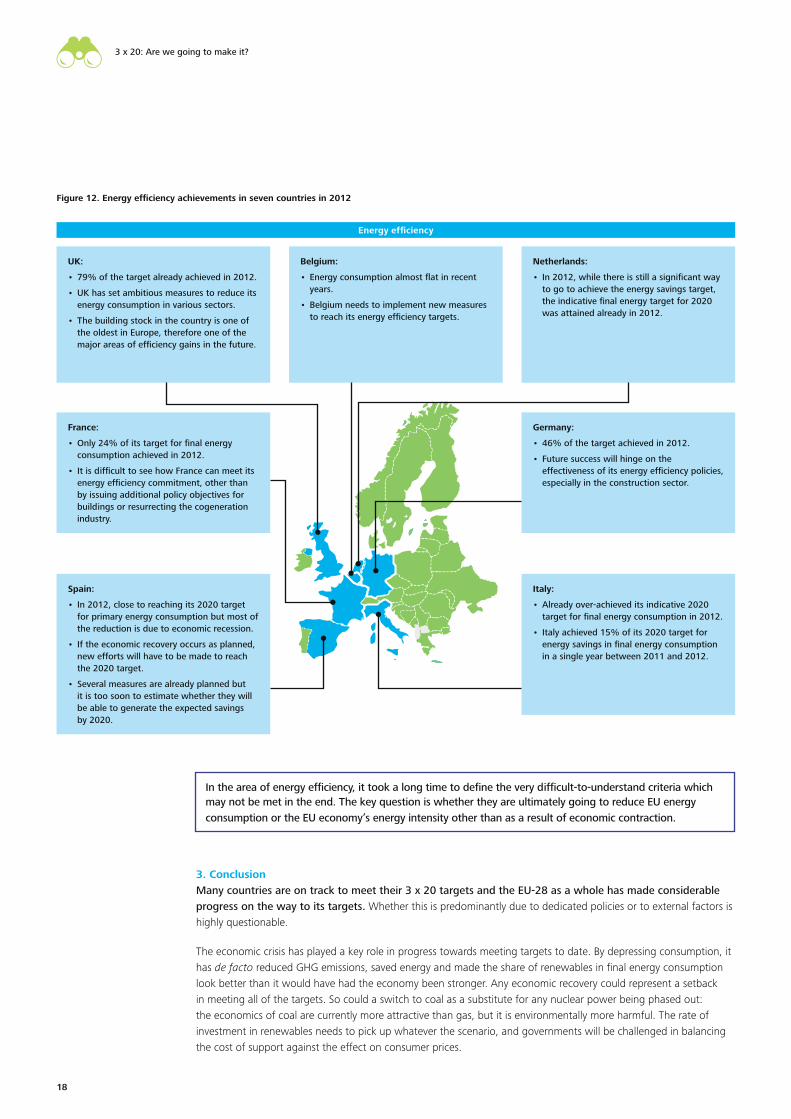
To start a new section, hold down the apple+shift keys and click
to release this object and type the section title in the box below.
To start a new section, hold down the apple+shift keys and click
to release this object and type the section title in the box below.
Figure 12. Energy effi ciency achievements in seven countries in 2012
3. Conclusion Many countries are on track to meet their 3 x 20 targets and the EU-28 as a whole has made considerable progress on the way to its targets. Whether this is predominantly due to dedicated policies or to external factors is highly questionable.
The economic crisis has played a key role in progress towards meeting targets to date. By depressing consumption, it has de facto reduced GHG emissions, saved energy and made the share of renewables in fi nal energy consumption look better than it would have had the economy been stronger. Any economic recovery could represent a setback in meeting all of the targets. So could a switch to coal as a substitute for any nuclear power being phased out: the economics of coal are currently more attractive than gas, but it is environmentally more harmful. The rate of investment in renewables needs to pick up whatever the scenario, and governments will be challenged in balancing the cost of support against the effect on consumer prices.
In the area of energy effi ciency, it took a long time to defi ne the very diffi cult-to-understand criteria which may not be met in the end. The key question is whether they are ultimately going to reduce EU energy consumption or the EU economy’s energy intensity other than as a result of economic contraction.
UK:
• 79% of the target already achieved in 2012.
• UK has set ambitious measures to reduce its energy consumption in various sectors.
• The building stock in the country is one of the oldest in Europe, therefore one of the major areas of effi ciency gains in the future.
Belgium:
• Energy consumption almost fl at in recent years.
• Belgium needs to implement new measures to reach its energy effi ciency targets.
Netherlands:
• In 2012, while there is still a signifi cant way to go to achieve the energy savings target, the indicative fi nal energy target for 2020 was attained already in 2012.
Germany:
• 46% of the target achieved in 2012.
• Future success will hinge on the effectiveness of its energy effi ciency policies, especially in the construction sector.
France:
• Only 24% of its target for fi nal energy consumption achieved in 2012.
• It is diffi cult to see how France can meet its energy effi ciency commitment, other than by issuing additional policy objectives for buildings or resurrecting the cogeneration industry.
Spain:
• In 2012, close to reaching its 2020 target for primary energy consumption but most of the reduction is due to economic recession.
• If the economic recovery occurs as planned, new efforts will have to be made to reach the 2020 target.
• Several measures are already planned but it is too soon to estimate whether they will be able to generate the expected savings by 2020.
Italy:
• Already over-achieved its indicative 2020 target for fi nal energy consumption in 2012.
• Italy achieved 15% of its 2020 target for energy savings in fi nal energy consumption in a single year between 2011 and 2012.
Energy effi ciency
3 x 20: Are we going to make it?
1818

To start a new section, hold down the apple+shift keys and click
to release this object and type the section title in the box below.
To start a new section, hold down the apple+shift keys and click
to release this object and type the section title in the box below.
Figure 12. Energy effi ciency achievements in seven countries in 2012
3. Conclusion Many countries are on track to meet their 3 x 20 targets and the EU-28 as a whole has made considerable progress on the way to its targets. Whether this is predominantly due to dedicated policies or to external factors is highly questionable.
The economic crisis has played a key role in progress towards meeting targets to date. By depressing consumption, it has de facto reduced GHG emissions, saved energy and made the share of renewables in fi nal energy consumption look better than it would have had the economy been stronger. Any economic recovery could represent a setback in meeting all of the targets. So could a switch to coal as a substitute for any nuclear power being phased out: the economics of coal are currently more attractive than gas, but it is environmentally more harmful. The rate of investment in renewables needs to pick up whatever the scenario, and governments will be challenged in balancing the cost of support against the effect on consumer prices.
In the area of energy effi ciency, it took a long time to defi ne the very diffi cult-to-understand criteria which may not be met in the end. The key question is whether they are ultimately going to reduce EU energy consumption or the EU economy’s energy intensity other than as a result of economic contraction.
UK:
• 79% of the target already achieved in 2012.
• UK has set ambitious measures to reduce its energy consumption in various sectors.
• The building stock in the country is one of the oldest in Europe, therefore one of the major areas of effi ciency gains in the future.
Belgium:
• Energy consumption almost fl at in recent years.
• Belgium needs to implement new measures to reach its energy effi ciency targets.
Netherlands:
• In 2012, while there is still a signifi cant way to go to achieve the energy savings target, the indicative fi nal energy target for 2020 was attained already in 2012.
Germany:
• 46% of the target achieved in 2012.
• Future success will hinge on the effectiveness of its energy effi ciency policies, especially in the construction sector.
France:
• Only 24% of its target for fi nal energy consumption achieved in 2012.
• It is diffi cult to see how France can meet its energy effi ciency commitment, other than by issuing additional policy objectives for buildings or resurrecting the cogeneration industry.
Spain:
• In 2012, close to reaching its 2020 target for primary energy consumption but most of the reduction is due to economic recession.
• If the economic recovery occurs as planned, new efforts will have to be made to reach the 2020 target.
• Several measures are already planned but it is too soon to estimate whether they will be able to generate the expected savings by 2020.
Italy:
• Already over-achieved its indicative 2020 target for fi nal energy consumption in 2012.
• Italy achieved 15% of its 2020 target for energy savings in fi nal energy consumption in a single year between 2011 and 2012.
Energy effi ciency
3 x 20: Are we going to make it?
18
To start a new section, hold down the apple+shift keys and click
to release this object and type the section title in the box below.
Unintended outcomes in the power sector
Electricity accounts for around 20% of fi nal energy consumption, a fi gure which has been steadily increasing (see Figure 13). Power production accounts for less than 30% of GHG emissions (see Figure 14) but for around 40% of energy production from renewable sources (see Figure 15). Its rather concentrated structure (a small number of energy-intensive, high-GHG emitting power plants) makes it an easy target for energy and climate policies.
Figure 13. EU-28 electrical energy in fi nal energy consumption 1990-2012 (Mtoe) (%)31
Figure 14. EU-28 GHG emissions by sector 1990-2012 (MtCO2eq)32
Figure 16. EU-28 change in electricity capacity source 2010-2012 (GW)34
Figure 15. Breakdown by renewable technologies for electricity, heating and cooling and transport for EU-28 (Mtoe), in 2005 and 2012 and targets for 202033
31 Calculations based on Eurostat data , Eurostat. © European Union, 1995-2015: http://appsso.eurostat.ec.europa.eu/nui/show.do?dataset=nrg_110a&lang=en
32 EEA GHG Data Viewer: http://www.eea.europa.eu/data-and-maps/data/data-viewers/greenhouse-gases-viewer
33 EEA (2014), Trends and projections in Europe 2014
34 Calculations based on Eurostat data, Eurostat.© European Union, 1995-2014: http://appsso.eurostat.ec.europa.eu/nui/show.o?dataset=nrg_113a&lang=en
Between 2010 and 2012, while nuclear capacities were shut down and consequently nuclear generating capacity at EU level decreased in the aftermath of the Fukushima disaster (-6.5%), hydropower capacity remained stable, while there was a net increase in fossil-powered capacity (+2.7%) and wind and photovoltaic solar increased very signifi cantly (+24% and +134%).
In many respects, the outcomes of the 3 x 20 policy in the electricity sector have been unintended and led to results which were sometimes counter-productive, thereby exposing the whole climate policy to general criticism.
0%
5%
10%
15%
20%
25%
201220102005200019900
1,000
2,000
3,000
4,000
5,000
6,000
20122010200520001990
Energy industries Manufacturing Transport
Industry Agriculture Waste Other
0
50
100
150
200
250
300
202020122005
Transport Heating & cooling
Non-hydropower electricity Hydropower electricity
-20
-10
0
10
20
30
40
50
SolarPV
WindGeo-theromal
HydroNuclearFossilFuels
19 19Energy market reform in Europe
To start a new section, hold down the apple+shift keys and click
to release this object and type the section title in the box below.
To start a new section, hold down the apple+shift keys and click
to release this object and type the section title in the box below.
1. Electricity markets have been most affectedFirst and foremost, EU policies have resulted in a dramatic change in the rules governing the electricity industry, so that EU consumers and producers have had to come to terms with completely new market mechanisms.
a) Power market distortion
In the context of sluggish demand, the development of renewables driven by policy support and incentives, rather than by supply and demand adequacy and market signals, has resulted in signifi cant overcapacities in the power generation segment.
Renewables capacity has been growing independently of the market’s need for new generation capacity. Even now, it is anticipated that the increase in renewable capacity will outpace electricity demand growth under most scenarios going forward: for example, non-hydro renewable installed capacity will increase by 60% over 11 years (379 GW in 2014 to 608 GW in 2025), or a CAGR of 4.4% per annum. Electricity demand is expected to grow by little more than 1% per annum over the same period (ENTSOE-E Adequacy Report, 2014). Restoring generation adequacy will therefore only be achieved through the closure of existing capacities, i.e. shutting down a mix of old, ineffi cient plants as well as newer high-performing power plants.
• Generous feed-in tariffs have distorted the marketBecause renewable systems are not yet technically or economically mature, support schemes for renewables have been based on feed-in tariffs, i.e. a guaranteed price level determined by public authorities which makes renewable energy producers immune to market signals. These tariffs can be compared to the wholesale electricity prices in these countries (see Figure 17): in 2014, they were around 3.2-4.0 EUR cents/kWh in Germany, 2.5-4.4 in France and 4.5 and 6.0 in the UK.
Table 2. 2014 feed-in tariffs (in c€/kWh) in Germany, France and the UK
Onshore wind Offshore wind Solar Geothermal Biomass (CHP35)
Germany 4.9-8.9 3.9-19.4 8.7-12.8 25.2 5.8-13.6
France 2.8-8.2 3-13 7.17-27.94 20 + bonus 4.5 + bonus
UK 3.7-17.78 177 6.38-14.38 13.4
• “Priority dispatch” principle for renewablesThe Transmission System Operators’ (TSO) obligation to dispatch renewables ahead of any other source of electricity in the merit order, have made renewable sources of electricity immune from market mechanisms, or any market mechanism at all. In addition, they create an extra challenge for the grid operators in achieving grid balancing and fi nancing a vast number of new connections to the grid.
• Public sector support for domestic renewable generation capacity may have deterred investments in new cross-border interconnectors which would have been a more effi cient solution for ensuring security of supplyAdditional investments in transmission grids of EUR 68 billion are projected from 2020 to 2030. They will help keep progress on track for the 2030 and 2050 objectives: they enable the construction of around 109 GW of additional transmission capacity, including offshore wind connections36 – a 50% increase from the planned network in 2020 and a near doubling of today’s existing capacity. Most of the additional interconnections are projected across borders (between southern UK and Ireland (13 GW), between south-western France and north-eastern Spain (9 GW)), however large transmission upgrades are also required within countries (north-western to western Germany (10 GW) and north to southern UK (8 GW))37. In October 2014, the European Council called for an urgent implementation of all the measures to meet the target of achieving interconnection of at least 10% of their installed electricity production capacity for all Member States by 202038. Upgrading the interconnection capacity at EU level is perhaps what should have been started with, before thinking about increasing capacities39.
35 CHP stands for Combined Heat and Power
36 Power Perspectives 2030: On the road to a decarbonized power sector; available on: http://www.roadmap2050.eu/project/power-perspective-2030
37 EU Roadmap 2050, Power Perspectives
38 Communication from the European Council (EUCO 169/14), 24 October 2014; available on: http://www.consilium.europa.eu/uedocs/cms_data/docs/pressdata/en/ec/145397.pdf
39 In 2006, the EC launched the TEN-E programme, in application of previous EU decisions 1996 and 2003. This programme deals with the interconnection, interoperability and development of trans-European networks for transporting electricity and gas. It has listed a number of projects of European interest which are essential for the effective operation of the internal energy market. But the TEN-E programme action was only limited to a budget of around EUR 20 million per year, mainly intended for fi nancing feasibility studies. (http://europa.eu/legislation_summaries/other/l24096_en.htm)
Unintended outcomes in the power sector
2020
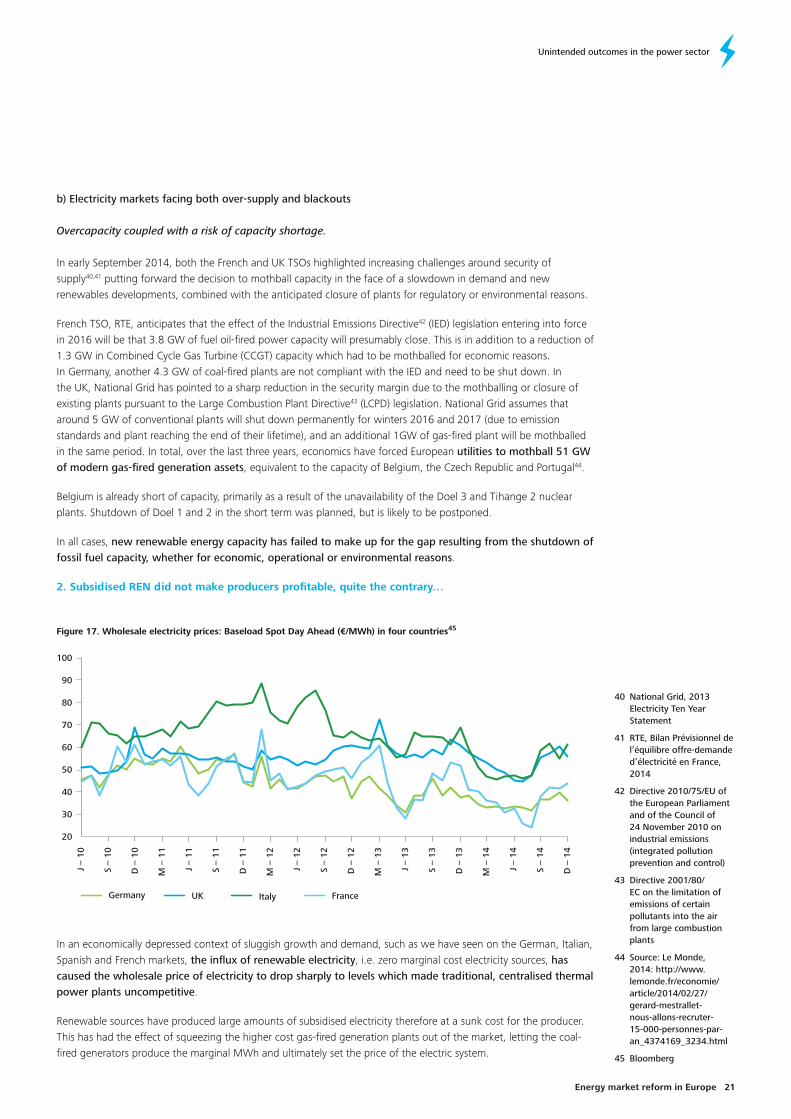
To start a new section, hold down the apple+shift keys and click
to release this object and type the section title in the box below.
To start a new section, hold down the apple+shift keys and click
to release this object and type the section title in the box below.
1. Electricity markets have been most affectedFirst and foremost, EU policies have resulted in a dramatic change in the rules governing the electricity industry, so that EU consumers and producers have had to come to terms with completely new market mechanisms.
a) Power market distortion
In the context of sluggish demand, the development of renewables driven by policy support and incentives, rather than by supply and demand adequacy and market signals, has resulted in signifi cant overcapacities in the power generation segment.
Renewables capacity has been growing independently of the market’s need for new generation capacity. Even now, it is anticipated that the increase in renewable capacity will outpace electricity demand growth under most scenarios going forward: for example, non-hydro renewable installed capacity will increase by 60% over 11 years (379 GW in 2014 to 608 GW in 2025), or a CAGR of 4.4% per annum. Electricity demand is expected to grow by little more than 1% per annum over the same period (ENTSOE-E Adequacy Report, 2014). Restoring generation adequacy will therefore only be achieved through the closure of existing capacities, i.e. shutting down a mix of old, ineffi cient plants as well as newer high-performing power plants.
• Generous feed-in tariffs have distorted the marketBecause renewable systems are not yet technically or economically mature, support schemes for renewables have been based on feed-in tariffs, i.e. a guaranteed price level determined by public authorities which makes renewable energy producers immune to market signals. These tariffs can be compared to the wholesale electricity prices in these countries (see Figure 17): in 2014, they were around 3.2-4.0 EUR cents/kWh in Germany, 2.5-4.4 in France and 4.5 and 6.0 in the UK.
Table 2. 2014 feed-in tariffs (in c€/kWh) in Germany, France and the UK
Onshore wind Offshore wind Solar Geothermal Biomass (CHP35)
Germany 4.9-8.9 3.9-19.4 8.7-12.8 25.2 5.8-13.6
France 2.8-8.2 3-13 7.17-27.94 20 + bonus 4.5 + bonus
UK 3.7-17.78 177 6.38-14.38 13.4
• “Priority dispatch” principle for renewablesThe Transmission System Operators’ (TSO) obligation to dispatch renewables ahead of any other source of electricity in the merit order, have made renewable sources of electricity immune from market mechanisms, or any market mechanism at all. In addition, they create an extra challenge for the grid operators in achieving grid balancing and fi nancing a vast number of new connections to the grid.
• Public sector support for domestic renewable generation capacity may have deterred investments in new cross-border interconnectors which would have been a more effi cient solution for ensuring security of supplyAdditional investments in transmission grids of EUR 68 billion are projected from 2020 to 2030. They will help keep progress on track for the 2030 and 2050 objectives: they enable the construction of around 109 GW of additional transmission capacity, including offshore wind connections36 – a 50% increase from the planned network in 2020 and a near doubling of today’s existing capacity. Most of the additional interconnections are projected across borders (between southern UK and Ireland (13 GW), between south-western France and north-eastern Spain (9 GW)), however large transmission upgrades are also required within countries (north-western to western Germany (10 GW) and north to southern UK (8 GW))37. In October 2014, the European Council called for an urgent implementation of all the measures to meet the target of achieving interconnection of at least 10% of their installed electricity production capacity for all Member States by 202038. Upgrading the interconnection capacity at EU level is perhaps what should have been started with, before thinking about increasing capacities39.
35 CHP stands for Combined Heat and Power
36 Power Perspectives 2030: On the road to a decarbonized power sector; available on: http://www.roadmap2050.eu/project/power-perspective-2030
37 EU Roadmap 2050, Power Perspectives
38 Communication from the European Council (EUCO 169/14), 24 October 2014; available on: http://www.consilium.europa.eu/uedocs/cms_data/docs/pressdata/en/ec/145397.pdf
39 In 2006, the EC launched the TEN-E programme, in application of previous EU decisions 1996 and 2003. This programme deals with the interconnection, interoperability and development of trans-European networks for transporting electricity and gas. It has listed a number of projects of European interest which are essential for the effective operation of the internal energy market. But the TEN-E programme action was only limited to a budget of around EUR 20 million per year, mainly intended for fi nancing feasibility studies. (http://europa.eu/legislation_summaries/other/l24096_en.htm)
Unintended outcomes in the power sector
20
To start a new section, hold down the apple+shift keys and click
to release this object and type the section title in the box below.
b) Electricity markets facing both over-supply and blackouts
Overcapacity coupled with a risk of capacity shortage.
In early September 2014, both the French and UK TSOs highlighted increasing challenges around security of supply40,41 putting forward the decision to mothball capacity in the face of a slowdown in demand and new renewables developments, combined with the anticipated closure of plants for regulatory or environmental reasons.
French TSO, RTE, anticipates that the effect of the Industrial Emissions Directive42 (IED) legislation entering into force in 2016 will be that 3.8 GW of fuel oil-fi red power capacity will presumably close. This is in addition to a reduction of 1.3 GW in Combined Cycle Gas Turbine (CCGT) capacity which had to be mothballed for economic reasons. In Germany, another 4.3 GW of coal-fi red plants are not compliant with the IED and need to be shut down. In the UK, National Grid has pointed to a sharp reduction in the security margin due to the mothballing or closure of existing plants pursuant to the Large Combustion Plant Directive43 (LCPD) legislation. National Grid assumes that around 5 GW of conventional plants will shut down permanently for winters 2016 and 2017 (due to emission standards and plant reaching the end of their lifetime), and an additional 1GW of gas-fi red plant will be mothballed in the same period. In total, over the last three years, economics have forced European utilities to mothball 51 GW of modern gas-fi red generation assets, equivalent to the capacity of Belgium, the Czech Republic and Portugal44.
Belgium is already short of capacity, primarily as a result of the unavailability of the Doel 3 and Tihange 2 nuclear plants. Shutdown of Doel 1 and 2 in the short term was planned, but is likely to be postponed.
In all cases, new renewable energy capacity has failed to make up for the gap resulting from the shutdown of fossil fuel capacity, whether for economic, operational or environmental reasons.
2. Subsidised REN did not make producers profi table, quite the contrary…
Figure 17. Wholesale electricity prices: Baseload Spot Day Ahead (€/MWh) in four countries45
In an economically depressed context of sluggish growth and demand, such as we have seen on the German, Italian, Spanish and French markets, the infl ux of renewable electricity, i.e. zero marginal cost electricity sources, has caused the wholesale price of electricity to drop sharply to levels which made traditional, centralised thermal power plants uncompetitive.
Renewable sources have produced large amounts of subsidised electricity therefore at a sunk cost for the producer. This has had the effect of squeezing the higher cost gas-fi red generation plants out of the market, letting the coal-fi red generators produce the marginal MWh and ultimately set the price of the electric system.
40 National Grid, 2013 Electricity Ten Year Statement
41 RTE, Bilan Prévisionnel de l’équilibre offre-demande d’électricité en France, 2014
42 Directive 2010/75/EU of the European Parliament and of the Council of 24 November 2010 on industrial emissions (integrated pollution prevention and control)
43 Directive 2001/80/EC on the limitation of emissions of certain pollutants into the air from large combustion plants
44 Source: Le Monde, 2014: http://www.lemonde.fr/economie/article/2014/02/27/gerard-mestrallet-nous-allons-recruter-15-000-personnes-par-an_4374169_3234.html
45 Bloomberg
Germany
20
30
40
50
60
70
80
90
100
UK Italy France
J –
10
S –
10
D –
10
M –
11
J –
11
S –
11
D –
11
M –
12
J –
12
S –
12
D –
12
M –
13
J –
13
S –
13
D –
13
M –
14
J –
14
S –
14
D –
14
Unintended outcomes in the power sector
21 21Energy market reform in Europe

To start a new section, hold down the apple+shift keys and click
to release this object and type the section title in the box below.
To start a new section, hold down the apple+shift keys and click
to release this object and type the section title in the box below.
These wholesale prices sometimes do not even cover the variable costs of gas-fi red, and even coal-fi red, power generators.
The low price of wholesale electricity led utilities to mothball new gas-fi red capacities which although newly built, effi cient, fl exible and high-performing were simply no longer needed. This has deterred investment in the electricity sector with the exception of the subsidised renewable generation industry, ultimately putting the mid to long-term security of electricity supply in jeopardy.
As the UK and Germany’s Clean Dark and Clean Spark Spreads48 demonstrate, the combination of low wholesale electricity prices and low carbon prices, low coal prices and high contracted gas prices has made it diffi cult to make a profi t from gas-fi red generation. Most gas-fi red power generation units are generating losses. Coal-fi red plants – a number of which are polluting and ineffi cient – are supplying electricity for both mid-merit and baseload. Their being largely profi table is a paradox in the context of an EU policy that wants to go green and underpins the problem with the ETS system.
3. …and it did not make consumers better off either…Ironically, the end-customer has not benefi ted from the decline in wholesale power prices. On the contrary retail electricity prices have increased signifi cantly in most markets, pushed up by the cost of fi nancing renewable capacity.
a) REN support policies have been costly
The costs of renewable development are supported by the public sector via several schemes which are often hard to compare: The SDE+ (Sustainable Energy Incentive) in the Netherlands comes straight from the state budget (and is passed on through the tariff), whilst France, the UK or Germany tender 20 year-contracts based on a guaranteed price through feed-in tariffs or feed-in premium.
Estimates of support for renewables show that a high level of public sector support is necessary to balance the cost of renewables: in Germany, the renewable energy sector is currently subsidised with approximately EUR 19.4 billion per year (EUR 240 per inhabitant in 201449); in Belgium, public sector support to Combined Heat and Power (CHP) and RES amounted to around EUR 1.5 billion in 201350; and in France, the global cost for the support of renewables in power production is estimated to be around EUR 40.5 billion for the 2012-2020 period51.
b) Wholesale and retail prices moving in opposite directionsEnd-user prices for electricity paid by companies and households have increased over the last decade in real terms. The reasons for this are high and increasing taxes and levies on the fi nal electricity price, the cost of networks and fuel. In most countries, taxes including the fi nancial charge of supporting renewables, and the network cost component in the retail price of electricity, now represent more than two thirds of the price paid by fi nal consumers.
46 Bloomberg
47 Bloomberg
48 The UK Clean Dark Spread, is the indicator of the theoretical profi tability of UK coal-fi red power plants operating at 35% effi ciency, allowing for the cost of coal and emissions and incorporating the cost of the UK government’s Carbon Price Support (CPS) levy. Conversely, the UK Clean Spark Spread, is the indicator of the theoretical profi tability of a gas-fi red power plants in the UK. The German Clean Dark Spread is the indicator of the theoretical profi tability of a coal-fi red power plants operating at 35% effi ciency in Germany, allowing for the cost of coal and EUA (EU Allowance Unit under the ETS) emissions.
49 http://www.wiwo.de/politik/deutschland/trotz-reform-verbraucher-werden-2015-eine-milliarde-euro-mehr-eeg-umlage-bezahlen/9414526.html
50 See calculation in Belgium country profi le
51 Cour des comptes (2013) – La politique de développement des énergies renouvelables – juillet 2013
Figure 18. UK clean dark and spark spreads (£/MWh)46 Figure 19. German clean dark and spark spreads (€/MWh)47
30
25
20
15
10
15
0
-5
Clean spark spread Clean dark spread
Jun-
10
Dec-1
0
Jun-
11
Dec-1
1
Jun-
12
Dec-1
2
Jun-
13
Dec-1
3
Jun-
14
Dec-1
4
Clean spark spread Clean dark spread
Jun-
10
Dec-1
0
Jun-
11
Dec-1
1
Jun-
12
Dec-1
2
Jun-
13
Dec-1
3
Jun-
14
Dec-1
4
15
10
5
0
-5
-10
-15
-25
-20
Unintended outcomes in the power sector
2222

To start a new section, hold down the apple+shift keys and click
to release this object and type the section title in the box below.
To start a new section, hold down the apple+shift keys and click
to release this object and type the section title in the box below.
These wholesale prices sometimes do not even cover the variable costs of gas-fi red, and even coal-fi red, power generators.
The low price of wholesale electricity led utilities to mothball new gas-fi red capacities which although newly built, effi cient, fl exible and high-performing were simply no longer needed. This has deterred investment in the electricity sector with the exception of the subsidised renewable generation industry, ultimately putting the mid to long-term security of electricity supply in jeopardy.
As the UK and Germany’s Clean Dark and Clean Spark Spreads48 demonstrate, the combination of low wholesale electricity prices and low carbon prices, low coal prices and high contracted gas prices has made it diffi cult to make a profi t from gas-fi red generation. Most gas-fi red power generation units are generating losses. Coal-fi red plants – a number of which are polluting and ineffi cient – are supplying electricity for both mid-merit and baseload. Their being largely profi table is a paradox in the context of an EU policy that wants to go green and underpins the problem with the ETS system.
3. …and it did not make consumers better off either…Ironically, the end-customer has not benefi ted from the decline in wholesale power prices. On the contrary retail electricity prices have increased signifi cantly in most markets, pushed up by the cost of fi nancing renewable capacity.
a) REN support policies have been costly
The costs of renewable development are supported by the public sector via several schemes which are often hard to compare: The SDE+ (Sustainable Energy Incentive) in the Netherlands comes straight from the state budget (and is passed on through the tariff), whilst France, the UK or Germany tender 20 year-contracts based on a guaranteed price through feed-in tariffs or feed-in premium.
Estimates of support for renewables show that a high level of public sector support is necessary to balance the cost of renewables: in Germany, the renewable energy sector is currently subsidised with approximately EUR 19.4 billion per year (EUR 240 per inhabitant in 201449); in Belgium, public sector support to Combined Heat and Power (CHP) and RES amounted to around EUR 1.5 billion in 201350; and in France, the global cost for the support of renewables in power production is estimated to be around EUR 40.5 billion for the 2012-2020 period51.
b) Wholesale and retail prices moving in opposite directionsEnd-user prices for electricity paid by companies and households have increased over the last decade in real terms. The reasons for this are high and increasing taxes and levies on the fi nal electricity price, the cost of networks and fuel. In most countries, taxes including the fi nancial charge of supporting renewables, and the network cost component in the retail price of electricity, now represent more than two thirds of the price paid by fi nal consumers.
46 Bloomberg
47 Bloomberg
48 The UK Clean Dark Spread, is the indicator of the theoretical profi tability of UK coal-fi red power plants operating at 35% effi ciency, allowing for the cost of coal and emissions and incorporating the cost of the UK government’s Carbon Price Support (CPS) levy. Conversely, the UK Clean Spark Spread, is the indicator of the theoretical profi tability of a gas-fi red power plants in the UK. The German Clean Dark Spread is the indicator of the theoretical profi tability of a coal-fi red power plants operating at 35% effi ciency in Germany, allowing for the cost of coal and EUA (EU Allowance Unit under the ETS) emissions.
49 http://www.wiwo.de/politik/deutschland/trotz-reform-verbraucher-werden-2015-eine-milliarde-euro-mehr-eeg-umlage-bezahlen/9414526.html
50 See calculation in Belgium country profi le
51 Cour des comptes (2013) – La politique de développement des énergies renouvelables – juillet 2013
Figure 18. UK clean dark and spark spreads (£/MWh)46 Figure 19. German clean dark and spark spreads (€/MWh)47
30
25
20
15
10
15
0
-5
Clean spark spread Clean dark spread
Jun-
10
Dec-1
0
Jun-
11
Dec-1
1
Jun-
12
Dec-1
2
Jun-
13
Dec-1
3
Jun-
14
Dec-1
4
Clean spark spread Clean dark spread
Jun-
10
Dec-1
0
Jun-
11
Dec-1
1
Jun-
12
Dec-1
2
Jun-
13
Dec-1
3
Jun-
14
Dec-1
4
15
10
5
0
-5
-10
-15
-25
-20
Unintended outcomes in the power sector
22
To start a new section, hold down the apple+shift keys and click
to release this object and type the section title in the box below.
The wholesale electricity price went down by as much as 35-45% between 2008 and 2012 as a result of abundant renewable electricity supplies reaching the market, however few European consumers have benefi tted from the global commodity price decrease, as the average weighted tax on electricity across Europe has increased by 127%, while network charges have gone up by 30% for industrial users and 18% for residential consumers over the period 2008 – 2012.
Figure 20. EU-28 weighted average retail electricity prices, 2008-2012 (percentage change by component),52, 53
Germany stands out as a good example of a market where the taxes and levies to support renewable energies have called EU energy policies into question. The EEG-Levy to fi nance renewable generation can go as high as EUR 60/MWh, compared to EUR 40/MWh for the sole cost component of energy54. Considering the components of household electricity prices in Germany, it is interesting to note that, fi fteen years after the liberalization of the power markets, the energy component proper, which refl ects the wholesale market price and is driven by the supply and demand balance, accounts for less than 24% of the costs today (according to fi gures from the EEX), and will continue to decline in percentage terms, whilst the levies or taxes for fi nancing the green economy and the public sector exceed both the derivatives market price for the front year and the spot market price. This fi gure compares an EU average of 40% for the energy component and 30% each for the network charge and the tax portion55.
Moreover, part of the costs of public policies (in favor of renewable energy, combined heat and power, social access to energy, etc.) have not completely been passed on to fi nal users, thus generating huge defi cits: in Spain, the electricity tariff defi cit – the share of investment that still needs to supported by end-users and is still expected to increase the retail price of electricity – was € 30 billion by 2014, equivalent to € 100/MWh over one year; in France, the tariff defi cit of the CSPE (public support to renewable development and to social tariffs) amounted to € 5.8 billion at the end of 201456. These tariff defi cits will drive further tariff increases in the future.
52 © European Union, http://eur-lex.europa.eu, 1998-2015, “Energy prices and costs report”, Commission staff working document [SWD(2014) 20 fi nal], part 1/4, available at: http://eur-lex.europa.eu/resource.html?uri=cellar:ba385885-8433-11e3-9b7d-01aa75ed71a1.0001.01/DOC_1&format=PDF
53 Prices include all taxes in the case of households. Prices exclude VAT and other recoverable taxes in the case of industry, as well as industry exemptions (data not available).
54 EPEX Spot
55 EPEX SPOT – Powernext
56 EDF
-20%
0%
20%
40%
60%
80%
100%
120%
140%
TotalTaxes and levelsNetwork costsEnergy and Supply
Households, consumption band DC Industrial consumers, consumption band IC
Unintended outcomes in the power sector
23 23Energy market reform in Europe

To start a new section, hold down the apple+shift keys and click
to release this object and type the section title in the box below.
To start a new section, hold down the apple+shift keys and click
to release this object and type the section title in the box below.
What has gone wrong?
1. Have we ticked each box of the main energy policy roadmap: sustainability, affordability competitiveness and security of supply?
Figure 22. EU-28 GHG emissions per inhabitant 1990-2010 (tCO2eq/inhabitant)58
57 Calculations based on Eurostat data, Eurostat. © European Union, 1995-2015: http://epp.eurostat.ec.europa.eu/tgm/table.do?tab=table&init=1&language=en&pcode=tsdcc320&plugin=1 and http://appsso.eurostat.ec.europa.eu/nui/submitViewTableAction.do
58 Calculations based on Eurostat data; Eurostat. © European Union, 1995-2015: http://appsso.eurostat.ec.europa.eu/nui/show.do?dataset=env_air_gge&lang=en; http://appsso.eurostat.ec.europa.eu/nui/show.do?dataset=demo_pjan&lang=en; http://appsso.eurostat.ec.europa.eu/nui/show.do?dataset=nama_gdp_c&lang=en;
59 Calculations based on Eurostat data, Eurostat. © European Union, 1995-2015: http://ec.europa.eu/eurostat/tgm/table.do?tab=table&init=1&language=en&pcode=tsdcc210&plugin=1
80
100
120
140
2012201020082006200420022000
Gross inland energy consumption (indexed to 100)
GDP (indexed to 100)
6
8
10
12
14
20102005200019900.0000
0.0002
0.0004
0.0006
0.0008
201220052000
• Sustainability?
– The EU has considerably reduced its energy intensity. The European economy has experienced a real decoupling of economic growth and energy consumption (with its GDP increasing by 40% from 2000 to 2012, while its gross inland energy consumption has gone down by some 2.5%) (Figure 21).
– The EU has reduced its carbon intensity, both in relation to population and to GDP. EU-28 GHG emissions per inhabitant have decreased by 24% between 1990 and 2010 and EU-28 GHG emissions per euro of GDP have decreased by 37% between 200 and 2012.
Figure 21. EU-28 energy intensity 2000-201257
Figure 23. EU-28 GHG emissions per euro of GDP 2000-2012 (tCO2eq/€)59
2424

To start a new section, hold down the apple+shift keys and click
to release this object and type the section title in the box below.
To start a new section, hold down the apple+shift keys and click
to release this object and type the section title in the box below.
What has gone wrong?
1. Have we ticked each box of the main energy policy roadmap: sustainability, affordability competitiveness and security of supply?
Figure 22. EU-28 GHG emissions per inhabitant 1990-2010 (tCO2eq/inhabitant)58
57 Calculations based on Eurostat data, Eurostat. © European Union, 1995-2015: http://epp.eurostat.ec.europa.eu/tgm/table.do?tab=table&init=1&language=en&pcode=tsdcc320&plugin=1 and http://appsso.eurostat.ec.europa.eu/nui/submitViewTableAction.do
58 Calculations based on Eurostat data; Eurostat. © European Union, 1995-2015: http://appsso.eurostat.ec.europa.eu/nui/show.do?dataset=env_air_gge&lang=en; http://appsso.eurostat.ec.europa.eu/nui/show.do?dataset=demo_pjan&lang=en; http://appsso.eurostat.ec.europa.eu/nui/show.do?dataset=nama_gdp_c&lang=en;
59 Calculations based on Eurostat data, Eurostat. © European Union, 1995-2015: http://ec.europa.eu/eurostat/tgm/table.do?tab=table&init=1&language=en&pcode=tsdcc210&plugin=1
80
100
120
140
2012201020082006200420022000
Gross inland energy consumption (indexed to 100)
GDP (indexed to 100)
6
8
10
12
14
20102005200019900.0000
0.0002
0.0004
0.0006
0.0008
201220052000
• Sustainability?
– The EU has considerably reduced its energy intensity. The European economy has experienced a real decoupling of economic growth and energy consumption (with its GDP increasing by 40% from 2000 to 2012, while its gross inland energy consumption has gone down by some 2.5%) (Figure 21).
– The EU has reduced its carbon intensity, both in relation to population and to GDP. EU-28 GHG emissions per inhabitant have decreased by 24% between 1990 and 2010 and EU-28 GHG emissions per euro of GDP have decreased by 37% between 200 and 2012.
Figure 21. EU-28 energy intensity 2000-201257
Figure 23. EU-28 GHG emissions per euro of GDP 2000-2012 (tCO2eq/€)59
24
To start a new section, hold down the apple+shift keys and click
to release this object and type the section title in the box below.
60 Calculations based on Eurostat data, Eurostat. © European Union, 1995-2015, http://ec.europa.eu/eurostat/tgm/table.do?tab=table&init=1&language=en&pcode=tsdcc320&plugin=1
61 © OECD/IEA 2014 Energy Policies of IEA Countries, IEA Publishing. Licence: http://www.iea.org/t&c/
62 Eurelectric (2014), Analysis of European Power Price Increase Drivers, A Eurelectric study, May 2014; http://www.eurelectric.org/media/131606/prices_study_fi nal-2014-2500-0001-01-e.pdf
63 © European Union, 1995-2015. European Commission (2014), “Energy prices and costs report”, Commission staff working document [SWD(2014) 20 fi nal], available at: http://www.cep.eu/Analysen/COM_2014_21_Energiepreise/Staff_Working_Document_SWD_2014__20.pdf
Figure 24. Share of fossil fuels in gross inland energy consumption of seven countries60
A number of EU Member States have a ratio of fossil fuel to total energy consumption which is close to, or even in excess of, 90%, including Italy, the Netherlands and the UK. At the end of 2012, the ratio of fossil fuel to total primary energy was 74% compared with 83% in 199061. Oil is still the leading carbon-based source of energy, with a 32% share, followed by gas (23%). Coal however stands at 18% of the EU-28 energy mix, dramatically down from 28% in 1990.
• Affordability and competitiveness?
Prices to fi nal customers have risen.
Looking at the various tax regimes across the EU, it is interesting to note that taxes on electricity have risen by 31% on average between 2008 and 2012 for households; and, at a time when political decision makers are calling for an industrial renaissance in Europe, taxes on electricity have risen by 109% on average between 2008 and 2012 for industrial users62. However, government policies are also keen on limiting the tax hit on industries in order to protect Europe’s ailing competitiveness63.
0%
20%
40%
60%
80%
100%
UKSpainNetherlandsItalyGermanyFranceBelgium
Coal Crude oil Gas
2008 2009 2010 2011 2012
EUR/MWh
Energy Network Taxes & Levies
40
45
50
55
60
65
70
75
80
85
+31%
-4%
+10%
Figure 25. Evolution of European average household price components (in €/MWh) between 2008 and 2012
0
10
20
30
40
50
60
70
2008 2009 2010 2011 2012
EUR/MWh
Energy Network Taxes & Levies
+109%
-10%
+17%
Figure 26. Evolution of European average industrial price components (in €/MWh) between 2008 and 2012
What has gone wrong?
25 25Energy market reform in Europe

To start a new section, hold down the apple+shift keys and click
to release this object and type the section title in the box below.
To start a new section, hold down the apple+shift keys and click
to release this object and type the section title in the box below.
• Security of supply?
The EU’s energy dependence on foreign sources of supply has also increased. In 2012, energy import dependence stood at 53%, 1 percentage point more than in 2005 and 10 more than twenty years ago, despite strong renewables development and energy effi ciency measures. Dependence on natural gas imports has increased as the resource base of the North Sea has depleted and reached 66% in 2012. Coal dependence also increased signifi cantly (62% for hard coal in 2012), and oil import dependency remains very high: 95% in 2012.
The lesson of the Ukraine crises is that the EU should press on with its decarbonisation strategy, with a view to developing indigenous renewable energy and improving energy effi ciency. This strategy has the key benefi t of reducing the degree to which Europe depends on fossil fuels – oil, gas and coal – that it currently imports from Russia for the most part, and from the Middle East and North Africa for much of the balance. These fi gures have actually gone up, not down, although the 3 x 20 policy was also meant to reduce energy dependence. The countries most vulnerable to any cut-off of Russian energy exports are the Eastern European countries which are, at the same time, the EU’s most energy-intensive Member States with the least renewable objectives.
Figure 27. EU-28 energy import dependence by fuel, 1995-2012 (% (toe/toe))64
The security of energy supply in an increasingly dependent EU also relies upon a diversifi cation of energy suppliers and routes, in addition to a a diversifi ed energy mix.
EU policies were well intentioned but went in a direction which took the market where one did not want it to go.
2. The carbon market did not help
An over-supplied carbon market failed to send the right price signals.
The long-standing low carbon price on the European ETS market has failed to establish the real value of the climate liability. It also failed to give investors the price signal necessary to consider investment in technologies, including CCS (carbon capture and storage) for example, which would have ultimately led to a large reduction in physical emissions.
The reasons for such a dysfunctional carbon market are to be found in the over-allocation of carbon credits under the ETS. This was itself fuelled by the extra impact of investment vehicles established by the Kyoto Protocol and known as CERs (Certifi ed Emissions Reductions) and ERUs (Emission Reduction Units) implementing Joint Implementation or Clean Development Mechanisms investments in or outside the Annex B countries of the Kyoto Protocol. This surplus of EUAs under the EU ETS is in fact the pure refl ection of a dysfunctional Kyoto Protocol, namely the over-allocation of national carbon credits (known as AAUs) above the actual GHG emissions of the countries in the 2012 amended Annex B list under the Kyoto Protocol65.
This surplus today represents up to 7 billion tons of CO2 credits66 (around two thirds of one year of CO2 emissions), two billion of which are held by the Ukraine alone, with the EU-28 holding the balance, i.e. just under 5 billion tons of CO2 credits. This total surplus, when carried over in the years ahead, could represent an annual 10% of base-year emissions for all countries participating in the second Kyoto commitment period 2013-2020.
64 Eurostat data in EU Energy in fi gures. Statistical pocketbook 2014. © European Union, 2014http://ec.europa.eu/energy/sites/ener/fi les/documents/2014_pocketbook.pdf
65 There are however restrictions as to the yearly volumes of CERs or ERUs that can be converted into EUAs. From 2008, EU ETS installations have also been allowed to use Kyoto offset credits (CERs or ERUs) up to a limit of 13.5% of their allocation on average (source: Key Figures on Climate, 2014 Edition, CDC Climat, French Ministère de l’Écologie, du Développement Durable et de l’Énergie)
66 Romain Morel and Igor Shishlov (2012), “Ex-post evaluation of the Kyoto Protocol: Four key lessons for the 2015 Paris agreement”, CDC Climat research: http://www.cdcclimat.com/IMG/pdf/14-05_climate_report_no44_-_analysis_of_the_kp-2.pdf
0
10
20
30
40
50
60
70
80
90
201220112005 201020001995
Total Solid Fuels Hard Coal Petroleum and Products
Crude and NGL
Natural Gas
What has gone wrong?
2626

To start a new section, hold down the apple+shift keys and click
to release this object and type the section title in the box below.
In spite of the EC’s decision to back-load most of the surplus within the Reserve Margin Mechanism starting in 2021, the carbon price signal could stay low across the EU for the foreseeable future and fail to support the fi nancing of the transition to a low carbon economy.
With a signifi cant surplus of carbon credits from the outset, it might have been foreseen that the EU ETS market would imperfectly refl ect the CO2 liability. This initial over-allocation was made even more damaging when the economic crisis caused a downturn in industrial activity.
With a low carbon price as a result, the ETS was doomed to remain a weak incentive to reducing carbon emissions.
Figure 28. Price of the CO2 allowances on the ETS (€/ton)
During the very early years of carbon trading, most analysts and brokers were forecasting an average CO2 price of EUR 20/t for 2008-2010, EUR 30/t in 2012 rising to EUR 35/t for 2013-2015 because of strong liquidity on the ETS market. The “fuel-switching” carbon price today, i.e. the price of carbon which would make burning gas indifferent to burning coal for power generation, is in the EUR 35-45/ton of CO2 range, a long way away from the current carbon market price of EUR 6 7/ton. And certainly an even longer way away from fi nancing any renewable generation facility or any carbon-abatement project, not to mention the Carbon Capture and Storage (CCS) projects which are reported to break even at EUR 80/ton of carbon at today’s prices.
In a way, it could be considered that the initial general objective of the ETS, i.e. reaching a given level of GHG emissions at the lowest possible cost, was a success, but whether the ETS mechanism actually proves to be responsible for the decrease in EU carbon emissions is highly questionable.
3. The EU 3 x 20 policies were set up in a different world: the paradigm shift
a) The EU energy context has unfolded very differently from what was anticipated at the outset
Before passing any judgment on the relevance or the irrelevance of the EU climate and energy package and what it has achieved, it is necessary to look back to the years when the policies were initially designed. One has to remember that EU policies were developed against a set of assumptions whereby energy demand was going to be robust, the priority was to avoid further development of carbon-intensive technologies, and incentives were necessary to support the development of renewable technologies in order to make them competitive in the not so distant future.
For instance, in 2002, the IEA’s World Energy Outlook assumed that electricity demand in the EU would grow by 1% per annum over the 2000–2020 period (with 5% yearly growth for both gas-fi red and renewable electricity) and globally by 0.8% for the period 2000-2030, as opposed to just 0.5% yearly growth currently envisaged by the IEA until 204067.
67 © OECD/IEA 2014 World Energy Outlook, IEA Publishing. Licence: http://www.iea.org/t&c/
0
5
10
15
20
Spot ETS Future ETS
Jun-10 Dec-10 Jun-11 Dec-11 Jun-12 Dec-12 Jun-13 Dec-13 Jun-14 Dec-14 Jun-15 Dec-15 Jun-16
What has gone wrong?
27 27Energy market reform in Europe
To start a new section, hold down the apple+shift keys and click
to release this object and type the section title in the box below.
To start a new section, hold down the apple+shift keys and click
to release this object and type the section title in the box below.
b) Some technical potential for improvement has been less developed than initially planned
When the EU’s ’20-20-20’ targets were endorsed by the European Council in 2007, there was obviously much uncertainty about what technology would deliver in the years ahead. Many more technology breakthroughs than really happened were expected in various areas such as second generation biofuels, CCS, electric cars, etc. Unfortunately, progress has proved to be slower than planned in these sectors and caused the burden to shift from certain economic sectors to others.
From the 1990s to around 2007, biofuels were considered to be a fully sustainable source of energy which was able to reduce GHG emissions and to increase renewable energy’s share in transport. For instance in 2006, France set more ambitious targets than the other European Member States and decided to set a target of a 10% share of biofuels in transport in 2015, fi ve years ahead of the European target. But a world food crisis occurred in 2007-2008. Biofuels were subject to criticism for being responsible for huge increases in world food prices, thus jeopardising the poorer populations’ access to food.
As a consequence, the European Union stopped promoting fi rst generation biofuels (biofuels produced from the edible parts of plants) and tried to encourage a second generation of biofuels produced from the non-edible parts. Unfortunately, the industrial development of the latter is diffi cult and very few commercial facilities have been built as of now. This makes the future of biofuels in Europe highly uncertain, and has meant no political consensus could be reached to date. The revision of the renewable energy Directive, which the European Commission announced in mid-2012, has been stalled for two years. No progress is in sight today. The proposed revision included a suggested 5% cap on the amount of food crop-derived biofuels (fi rst generation), which implied that the rest of the target should be reached through second generation biofuels. Unfortunately for these plans, these advanced biofuels are not yet widely available on an industrial scale.
These rather disappointing developments in the biofuels sector were repeated in other areas, including construction (where the implementation of best practices in energy effi ciency has been much lower than planned. This was especially true during the economic crisis, which had a strong impact on the construction of new buildings). The same happened in green cogeneration, etc.
This is why most governments, regulators and public attention turned to renewable technologies for electricity. Thus, less important development in some fi elds has been compensated for by greater action in others. So, part of the burden has shifted from sector to sector.
c) The economic crisis accelerated and completed this paradigm shift
In addition to withdrawing public sector support from green policies, the economic crisis was responsible for slowing down the renewal of the European car fl eet or the upgrading of old buildings. Much of the progress expected from the construction of new, energy-effi cient buildings also did not take place, especially in southern Europe.
In the aftermath of the fi nancial crisis, public budgets had to be severely cut and public sector support for investments in renewables and in energy effi ciency were reduced. Between 2010 and 2012, Spain, in particular, issued several regulations lowering the level of support to renewables in order to reduce the annual electricity tariff defi cit. The target of a zero defi cit was not completely reached. Moreover, these measures created a lot of uncertainty in the electricity generation sector.
4. EU energy policy: still a patchwork of national policies
a) Energy policies have largely remained at Member State level
Whilst energy policy is a shared competence under the EU Treaties, much of the electricity regulation has been designed at national level, and investments have been little coordinated at EU level so far.
The need for “Generation Adequacy”, a proxy for capacity supply and demand, has been addressed at the Member State level and has often refl ected sovereign objectives rather than a market analysis based on regional supply and demand equilibria.
What has gone wrong?
2828

To start a new section, hold down the apple+shift keys and click
to release this object and type the section title in the box below.
As a result, Member States have often considered new public intervention in isolation, such as support schemes for investments in new electricity generation capacity or capacity payment schemes to make up for intermittent sources. Some of these measures have led to ineffi cient plants being artifi cially kept in operation through public support, or unnecessary new generation capacity being built. Today, there is as yet no EU supra-entity in charge of monitoring unruly capacity development, particularly of renewable energy, or excessive capital expenditure being channelled to creating unnecessary capacities.
b) No coordination on energy mix
The EU is still divided over its energy mix and more specifi cally over its fuels for power generation, with the German electricity generation capacity mix consisting of roughly 50% fossil energy, 12% nuclear and 38% renewables, France being 52% nuclear, Italy over 68% fossil fuel-based, the UK with a 73% fossil-fuel generation mix and Poland over 85% coal-based etc.
Figure 29. 2012 Gross inland energy consumption in seven countries (Mtoe)68
Figure 30. 2012 Power production mix in seven countries (percentages of generation)69
0%
50%
100%
150%
200%
250%
300%
350%
UKSpainNetherlandsItalyGermanyFranceBelgium
Coal Crude oil Gas Nuclear Renewable energies and waste Waste (Non-renewable)
Nuclear Gas, Oli & Cogeneration Coal Hydro wind PV Biomass & other renewables
0%
20%
40%
60%
80%
100%
UKSpainNetherlandsItalyGermanyFranceBelgium
68 Calculations based on Eurostat data, Source: Eurostat. © European Union, 1995-2015: http://epp.eurostat.ec.europa.eu/tgm/table.do?tab=table&init=1&plugin=1&language=en&pcode=tsdcc320
69 Elia, Rapport Annuel 2013; RTE Bilan Electrique Français 2013; RWE, BMWi ; Terna Group, Dati Statistici sull’energia elettrica in Italia, 2013 ; IEA, Energy Policies of IE Countries, 2014 ; RED, El Sistema Eléctrico Español, 2013 ; EC, EU Country Factsheet, 2012
What has gone wrong?
29 29Energy market reform in Europe

To start a new section, hold down the apple+shift keys and click
to release this object and type the section title in the box below.
To start a new section, hold down the apple+shift keys and click
to release this object and type the section title in the box below.
There are various reasons for these differences in the energy mix:
• Some relate to the climate or geographic nature of the EU Member States, e.g. the hydropower potential is much higher in Scandinavian or Alpine countries. The solar potential is higher in Southern Europe. The average irradiation is much higher in Italy and Spain than in the UK, the Netherlands or Belgium (Figure 31).
• Other differences are political, especially with respect to nuclear. Italy has no nuclear plants and its opposition to nuclear power was restated through a popular referendum in June 2011 at a time when the largest Italian utility was considering nuclear reactors outside of Italy. Germany and Belgium have decided on a nuclear power phase out (by 2022 in Germany and by 2025 in Belgium). France, the country with the highest share of nuclear power, has decided to cap its nuclear generation capacity (i.e. any new plant has to be compensated by the closure of an old one) and to decrease the share of nuclear power from 75% to 50% of the electricity mix by 2025. On the other hand, the Dutch Government is in favor of constructing new nuclear power plants, even if no fi rm investment decision has been taken yet. And the UK is currently building a fi rst-of-a-kind nuclear capacity to benefi t from a contract for difference mechanism.
EU Member States are strongly divided over which source of energy they prefer. Poland argues that ‘coal should be rehabilitated in the EU as a contributor to energy independence’71, a move that would certainly constitute a major change in EU policy. The UK, for its part, insists that ‘the development of coal reserves should only be encouraged in the context of carbon capture and storage’70, and the EU should ‘avoid the temptation to reverse existing policies or undertake new ones that would be contrary to its overall energy and climate policies’. Germany never consulted its big nuclear neighbor when it decided to close down its nuclear reactors. Poland has been actively trying to unleash its shale gas potential in the context of high dependence on Russian gas, whilst France has adopted a legal ban on hydraulic fracturing and has no concerns about long-term gas import contracts.
70 PVGIS © European Communities, 2001-2008, Šúri, M, Huld, T. A., Dunlop E. D., Ossenbrink, H. A., 2007. Potential of solar electricity generation in the European Union Member States and candidate countries. Solar energy, 81, 1295-1305.: http://re.jrc.ec.europa.eu/pvgis/solres/solreseurope.htm
71 Quoted by David Buchan (2013) in “Why Europe Energy and Climate policies are coming apart?” (Oxford Institute of Energy Studies), available online at: http://www.oxfordenergy.org/wpcms/wp-content/uploads/2013/07/SP-28.pdf
Figure 31. Yearly sum of global irradiation at horizontal plane (2001-2008 average kWh/m2)70
0
200
400
600
800
1,000
1,200
PortugalSpainItalyFranceGermanyNetherlandsBelgiumUK
Average kWh/m2
What has gone wrong?
3030
To start a new section, hold down the apple+shift keys and click
to release this object and type the section title in the box below.
c) The energy and climate policies have moved the EU away from the original objective of creating a single, integrated energy market
Huge price differentials at retail and industrial levels distort competition between Member States and hamper the development of a proper integrated energy market. In a price review published in early 2014 by the European Commission72, it appears that a typical household in Denmark pays EUR 0.30/kWh for its electricity, of which EUR 0.10/kWh are taxes, whilst a typical household in France pays some EUR 0.15/kWh for the same. Of this just over EUR 0.03/kWh are taxes. A mid-size industrial company with two similar production facilities in Finland and in Italy will receive an electricity bill of EUR 0.75/kWh in Finland and EUR 0.20/kWh in Italy. VAT on electricity further ranges from 6% in Luxembourg to 27% in Hungary.
Energy prices are a clear differentiator amongst Europeans whilst at the same time, EPEX SPOT, the European electricity spot market operator, working with most EU TSOs, has successfully achieved a European market coupling system which stretches from Italy to Finland and Norway, and from Portugal to the Baltics. This generates a real-time spot electricity price which is expected to become the only electricity reference price in the EU-28 in the near future. With an almost unique market price, bottlenecks on interconnections, taxes and grid costs make retail prices from one country to another vastly different.
5. ConclusionRecent EU energy history is full of irony:
• The policy intention was fi rst and foremost to move away from a hydrocarbon-based economy to a more sustainable and greener industry centred on the price of carbon, but it was unable to foresee the collapse of the carbon market, which was a central plank of implementation.
• The EU thought that the development of renewable energy sources would reduce its dependence on imported, foreign fossil energy supplies: this development has not been important enough to avoid the increase of the EU’s dependence on foreign sources of energy supply. The policy has tied the European economy to high-cost and intermittent sources of energy, while not enough effort has been made to see how fossil fuel imports could be effi ciently reduced.
• The EU has moved from a consistent energy and climate policy addressing sustainability, security of supply and affordability through a set of three objectives to inconsistent policy implementation and practice where sustainability undermines affordability and security.
• The EU has worked hard on liberalizing EU energy markets and “unbundling” European utilities to introduce more market mechanisms into the European economy. Yet the price of electricity in the EU has never been so uncompetitive when compared with other large economies, and the share of regulated components in the electricity price has now reached 75% in Germany, for instance.
In just ten or twelve years, it seems that European policy has taken EU-28 somewhere it had no intention of going when it started.
The European Union is one of the only great economic powers in the world that is adopting a new economic model, which is less carbon-intensive and more renewable-intensive.
In the last few years, in the aftermath of the economic crisis, the focus of energy and climate and energy policies has been evolving. These policies have to be justifi ed to a greater extent not only on climate and renewable grounds, but for their positive impacts in terms of growth enhancement and job creation.
72 © European Union, http://eur-lex.europa.eu, 1998-2015,, “Energy prices and costs report”, Commission staff working document [SWD(2014) 20 fi nal], available at: http://www.cep.eu/Analysen/COM_2014_21_Energiepreise/Staff_Working_Document_SWD_2014__20.pdf
What has gone wrong?
31 31Energy market reform in Europe

To start a new section, hold down the apple+shift keys and click
to release this object and type the section title in the box below.
To start a new section, hold down the apple+shift keys and click
to release this object and type the section title in the box below.
Road ahead and main challenges: the path to 2030 and beyond
1. EU energy policy beyond 2020 – what is to change?The major policy changes envisaged for the post-2020 era in the policy framework for 2030 include a renewable energy target which will be at EU level only, and not be differentiated by Member State, and a greenhouse gas reduction obligation which will be set at 43% versus 1990 emissions for the ETS sector, and at 30% for the non-ETS sector. There will be differentiated obligations at national level for the non-ETS sector.
The EU has also added urgently needed measures in order to ensure that the existing minimum target of electricity interconnector capacity being equal to 10% of production capacity be achieved by 2020, and has set a target of 15% by 2030.
Furthermore, a decision at EU level on establishing a Market Stability Reserve after 2021 will absorb the EUA surplus.
This comes on top of the previously published EU Energy Roadmap 2050 which established the ambition of decar-bonizing the EU economy by 80% in 2050 compared to 1990 emissions levels. The EU Energy Roadmap further includes fi ve decarbonization scenarios to achieve this emissions reduction, all assuming a primary energy demand reduction of 33-40% versus 2005 at EU-28 level.
Looking forward, beyond 2020 and until 2050, many questions remain: to what extent will the 2030 package make it possible to overcome the diffi culties encountered so far? To what extent can these new targets be reached without endangering further security of supply and the affordability of energy? And, how are we going to make the most of the currently untapped industrial potential of Europe: biofuel development, energy effi ciency in buildings, effi cient cars, smart grids and decentralised energy systems etc.
2. EU energy policy beyond 2020 – What are the solutions?
Table 3. Troubleshooting synthesis
Issues EC Proposal73 Challenges
Renewables
Their development has been driven by state support schemes independent of any adequacy mechanism
They should be developed as and when needed in accordance with generation adequacy requirements at EU and national levels and based on a bidding process
Effi cient technologies still in their infancy and require support (e g marine…) may suffer signifi cant delays
Support schemes based on guaranteed prices are inappropriate and have kept market participants immune from market signals
They should be based on guaranteed volumes agreed to in advance by market participants under a power purchase agreement
For market participants to commit to guaranteed volumes via a bidding process is likely to result in a higher risk premium and higher capital costs
Incentives today based on feed-in-tariff
Should come on top of market price through some form of Contract for Difference, not in lieu of market price
As the market price goes down, the incentive goes up for the Treasury
Should come on top of market price PLUS carbon price through some form of ETS-related Contract for Difference, rather than ignoring the CO2 price
As the carbon credit price goes down, the incentive goes up for the Treasury
GHG ETS
Over-allocation of carbon credits will keep growing until 2020 and weaken the carbon price signal
Reform the ETS market with a view to transferring the CO2 credit surplus to a Market Stability Reserve after 2020 in order to regulate the carbon price
Adoption of a Market Stability Reserve in 2021 is too far out.
GHG – Non-ETS
Non-ETS sector accounts for around half or more than half of the GHG physical emissions and only accounts for 10% of the effort sharing
A clear, single and binding approach should be established with unique binding targets for all Member States in order to achieve domestic objectives on greenhouse gas emissions in the non-ETS sector
Energy Effi ciency
Member States disagree on targets. Western Europe well ahead of Eastern Europe
Energy Effi ciency Directive should be, or could be, the single key target which would allow all technologies to compete
Achievements diffi cult to measure based on single EE objective. Many sectors concerned
73 © European Union, 1995-2015. These proposals are taken from the following documents by the European Commission:
• Commission staff working document impact assessment: A policy framework for climate and energy in the period from 2020 up to 2030, 22 01 2014
• Communication from the Commission to the European Parliament, the Council, the European Economic and Social Committee and the Committee of the Regions – A policy framework for climate and energy in the period from 2020 to 2030
• Green Paper on energy and climate policy, March 2013
3232

To start a new section, hold down the apple+shift keys and click
to release this object and type the section title in the box below.
Issues EC Proposal73 Challenges
Public Policies
Risk of under capacity: capacity development and new power plant construction
Should be supported by long-term contracts between generators and off-takers (including consortia of companies), subject to those contracts complying with competition law provisions: long-term contracts will provide both generators and companies with the predictability and price outlook that is needed to support their fi nancing, including contracting hedges against peak prices, better planning and more effi cient operations
Long-term contracts take volumes out of the liquid, day-ahead market. But, the example of the oil market demonstrates a market may still be active, liquid and effi cient when a predominantly OTC market uses a spot price which is estab-lished by only a small share of the physical volumes. The NYMEX spot contract accounts for only 5% of the physical volumes
Lagging integrated market: dilemma of how to speed up integration
Review market rules, including network access rules (network codes), as well as intraday access rules for electricity suppliers, putting all competitors from different Member States on the same footing: when Member States develop intraday, balancing and ancillary services markets, all players, including end-users, should be able to participate in those markets. This will stimulate demand response
Complexity of intraday market and pricing mechanism
Few incentives for small end-users to become market participants in the intraday market
An “Insuffi cient level of genera-tion adequacy” remains
The EC wants to align and streamline the rules with respect to increasing reserve capacity margins, in particular through capacity payment mechanisms, in order to ensure generation adequacy.
Public support schemes will therefore be offered for investments in new electricity generation capacity or for remunerating existing plants to remain operational.
At the same time, the EC establishes as a principle that no investment in generation from fossil fuel plants will be rewarded unless it can be shown that “a less harmful alternative to achieve generation adequacy does not exist”.
The proposal will be conditional upon the Commission’s assessment that the capacity remuneration mechanisms do not result in over-compensation.
Alternatively, Member States will have to demonstrate that generation adequacy cannot be addressed through alternative measures to new generation capacity, such as demand-side management response measures or new energy infrastructure.
The merit of the proposal is that all contribution to generation adequacy will be taken into account, new capacity development, demand-response systems, interconnections...
Switching rates tend to be low in Europe in part in consequence of imperfect price signals. Pricing signals from the wholesale market are low and fail to make fi nal energy-consumers price-sensitive. Too many complex, sticky retail prices and non-market based price regulations.
Develop demand-response measures through a fully rolled out high speed open information and communication technology infrastructure
Need for a fully rolled out high speed open information and communication technology infrastructure
Support to Renewables is a Member State competence.
Support to Renewables should be a joint EU and Member State decision. In particular, Support to intermittent energy should not be available where the interconnection, grid infrastructure or existing fl exible capacities are low.
This will challenge the principle of Member States’ sovereignty over energy matters.
Road ahead and main challenges: the path to 2030 and beyond
Table 3. Troubleshooting synthesis (continued)
33 33Energy market reform in Europe
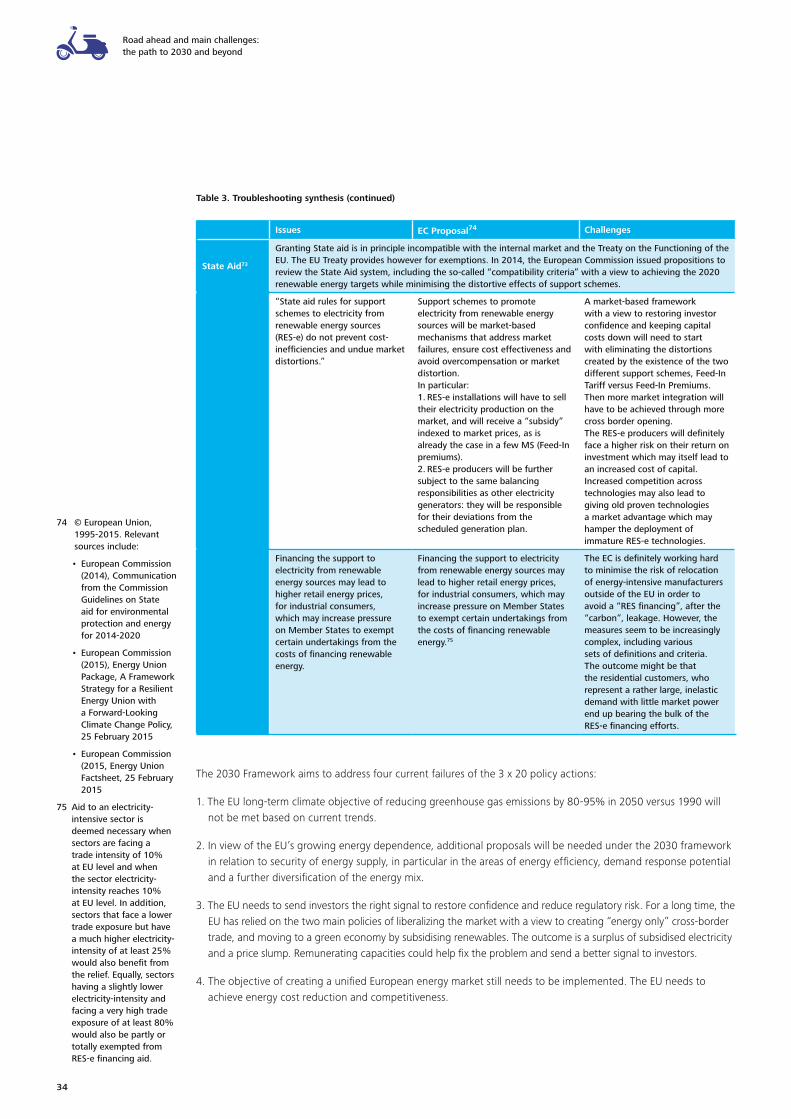
To start a new section, hold down the apple+shift keys and click
to release this object and type the section title in the box below.
To start a new section, hold down the apple+shift keys and click
to release this object and type the section title in the box below.
Issues EC Proposal74 Challenges
State Aid73
Granting State aid is in principle incompatible with the internal market and the Treaty on the Functioning of the EU. The EU Treaty provides however for exemptions. In 2014, the European Commission issued propositions to review the State Aid system, including the so-called “compatibility criteria” with a view to achieving the 2020 renewable energy targets while minimising the distortive effects of support schemes.
“State aid rules for support schemes to electricity from renewable energy sources (RES-e) do not prevent cost-ineffi ciencies and undue market distortions.”
Support schemes to promote electricity from renewable energy sources will be market-based mechanisms that address market failures, ensure cost effectiveness and avoid overcompensation or market distortion.In particular:1. RES-e installations will have to sell their electricity production on the market, and will receive a “subsidy” indexed to market prices, as is already the case in a few MS (Feed-In premiums).2. RES-e producers will be further subject to the same balancing responsibilities as other electricity generators: they will be responsible for their deviations from the scheduled generation plan.
A market-based framework with a view to restoring investor confi dence and keeping capital costs down will need to start with eliminating the distortions created by the existence of the two different support schemes, Feed-In Tariff versus Feed-In Premiums. Then more market integration will have to be achieved through more cross border opening.The RES-e producers will defi nitely face a higher risk on their return on investment which may itself lead to an increased cost of capital.Increased competition across technologies may also lead to giving old proven technologies a market advantage which may hamper the deployment of immature RES-e technologies.
Financing the support to electricity from renewable energy sources may lead to higher retail energy prices, for industrial consumers, which may increase pressure on Member States to exempt certain undertakings from the costs of fi nancing renewable energy.
Financing the support to electricity from renewable energy sources may lead to higher retail energy prices, for industrial consumers, which may increase pressure on Member States to exempt certain undertakings from the costs of fi nancing renewable energy.75
The EC is defi nitely working hard to minimise the risk of relocation of energy-intensive manufacturers outside of the EU in order to avoid a “RES fi nancing”, after the “carbon”, leakage. However, the measures seem to be increasingly complex, including various sets of defi nitions and criteria. The outcome might be that the residential customers, who represent a rather large, inelastic demand with little market power end up bearing the bulk of the RES-e fi nancing efforts.
The 2030 Framework aims to address four current failures of the 3 x 20 policy actions:
1. The EU long-term climate objective of reducing greenhouse gas emissions by 80-95% in 2050 versus 1990 will not be met based on current trends.
2. In view of the EU’s growing energy dependence, additional proposals will be needed under the 2030 framework in relation to security of energy supply, in particular in the areas of energy effi ciency, demand response potential and a further diversifi cation of the energy mix.
3. The EU needs to send investors the right signal to restore confi dence and reduce regulatory risk. For a long time, the EU has relied on the two main policies of liberalizing the market with a view to creating “energy only” cross-border trade, and moving to a green economy by subsidising renewables. The outcome is a surplus of subsidised electricity and a price slump. Remunerating capacities could help fi x the problem and send a better signal to investors.
4. The objective of creating a unifi ed European energy market still needs to be implemented. The EU needs to achieve energy cost reduction and competitiveness.
74 © European Union, 1995-2015. Relevant sources include:
• European Commission (2014), Communication from the Commission Guidelines on State aid for environmental protection and energy for 2014-2020
• European Commission (2015), Energy Union Package, A Framework Strategy for a Resilient Energy Union with a Forward-Looking Climate Change Policy, 25 February 2015
• European Commission (2015, Energy Union Factsheet, 25 February 2015
75 Aid to an electricity-intensive sector is deemed necessary when sectors are facing a trade intensity of 10% at EU level and when the sector electricity-intensity reaches 10% at EU level. In addition, sectors that face a lower trade exposure but have a much higher electricity-intensity of at least 25% would also benefi t from the relief. Equally, sectors having a slightly lower electricity-intensity and facing a very high trade exposure of at least 80% would also be partly or totally exempted from RES-e fi nancing aid.
Road ahead and main challenges: the path to 2030 and beyond
Table 3. Troubleshooting synthesis (continued)
3434

To start a new section, hold down the apple+shift keys and click
to release this object and type the section title in the box below.
3. The challenges ahead
a) The internal energy market is supposed to have been “completed” by now
With the development of capacity markets across Europe, have the EU-28 actually missed another opportunity to progress the internal, integrated energy market?
So far, EU electricity liberalization has resulted in “energy-only” markets. These have proved to be the best way to dispatch electricity effi ciently and ensure assets are optimized. However, energy-only markets have failed to deliver a price signal to incentivize investment. This is especially true in countries with large shares of renewables with zero marginal costs, such as Germany, or where regular price spikes are disruptive for consumers.
The EU is now moving from an energy-only market to a capacity-plus-energy market. A capacity market works by offering all providers of capacity (new and existing power stations, electricity storage, and voluntary demand reductions) a value for capacity reserve contributing to security of supply.
Several capacity payment schemes are being implemented in a few Member States (centralized, decentralized, strategic reserve, etc.). The development of capacity mechanisms across Europe, which is a move away from the energy-only market, is designed to ensure that suffi cient reliable capacity is in place to meet demand, either during peak times or in the face of intermittent energy supply sources. The EU needs to defi ne consistent criteria for capacity mechanisms at European level. This should include single defi nition for generation adequacy, which would cover existing capacity and new capacity development, demand-response systems, storage capacity, interconnections, consumer load-shedding capability, etc. This entails the creation of capacity coordination systems at regional level. All of this calls for a radical review of the existing EU market design but is a pre-requisite for achieving an integrated energy market and ensuring security of supply.
The capacity market is critical for solving the energy “trilemma”, i.e. to deliver delivering green, reliable electricity for the future at the lowest possible cost. The need for reliable electricity generation capacity at all times, especially when moving to a low carbon economy with signifi cant intermittent energy sources, is a unique opportunity to develop a single EU energy market. However, it looks as if national models are going to be developed in various countries. Different mechanisms are going to generate different capacity prices and various capacity price spreads. The EU-28 actually needed only one capacity market, but at Union level. This may not happen.
Building a stronger internal energy market implies also further development of cross-border connections and more coordination amongst national Transmission System Operators (TSOs).
b) REN targets versus affordability: how can we reach REN targets without pushing energy prices up for consumers?
According to the IEA, the EU incentives to renewables was around USD 57 billion in 2012, which represent around 60% of worldwide incentives to renewables (which reached USD 101 billion in 2012, 11% more than in 2011)76. The bulk of this went to solar PV. These total incentives, if it were to be evenly paid by all electricity consumers, as opposed to only a fraction of the market today, would represent a price increase in excess of USD 20 for each MWh consumed in the EU.
In its Impact Assessment Report77 the European Commission pointed out that were the emission reduction efforts to continue beyond 2020, and be largely achieved through the development of renewable energy sources, an increase in real terms in the average electricity price of some 30% above 2011 levels would be needed to support investment in new generation capacity, energy effi ciency measures and grid extension. This does not take into account any increase in international fossil fuel prices. This does not bode well for the affordability of EU electricity.
At industrial retail level, the price is already twice as high as in the US and 20% more expensive than in China today according to the European Commission itself. This is despite the fact that the wholesale price has come down consistently in Europe as a result of depressed demand and overcapacities in electricity generation.
The EU needs to fi nd alternative ways of fi nancing smart grids, energy effi ciency and renewable while integrating those fully into a competitive market, without passing the burden on to household and SME electricity bills.
76 © OECD/IEA 2013 World Energy Outlook, IEA Publishing. Licence: http://www.iea.org/t&c/
77 © European Union, http://eur-lex.europa.eu, 1998-2015, “Impact Assessment – A policy framework for climate and energy in the period from 2020 up to 2030”, Commission staff working document [SWD(2014) 15 fi nal], available at: http://eur-lex.europa.eu/legal-content/EN/TXT/PDF/?uri=CELEX:52014SC0015&from=EN
Road ahead and main challenges: the path to 2030 and beyond
35 35Energy market reform in Europe

To start a new section, hold down the apple+shift keys and click
to release this object and type the section title in the box below.
To start a new section, hold down the apple+shift keys and click
to release this object and type the section title in the box below.
In order to keep EU electricity affordable for consumers, a cap needs to be put on subsidizing renewable capacities, either by limiting capacity development or the level of incentives (as is already the case in Germany, Spain and the UK). “Subsidy auctioning” could be a good way to balance state intervention and market mechanisms. This is where renewable developers bid for the lowest possible incentive level. This mechanism has the advantage of capping the increase in electricity bills for households, as well as incentivizing the investor to promote the most competitive technology.
A question then still remains: should the EU stick to this mechanism whereby smart grids, energy effi ciency investments and renewables development are (almost entirely) paid for by a surcharge on household and SME electricity bills, while the largest energy users are largely relieved of these fi nancial charges in many countries?
Alternatives include:
• A pure tax incentive mechanism, where investors could recover their investment through a tax cut: the advantage of the tax incentive is to limit the damage done by renewables to the competitiveness of electricity prices.
• A system of Energy Investment Allowances (EIA), such as that in place in the Netherlands. It incentivizes renewables development and energy-effi cient technologies (including renewables) by allowing deduction of part of the investment costs from taxable profi ts. The advantage is that investors select their technology based on their perception of the adequacy level or supply and demand equilibrium, rather than opting for the technology that attracts a subsidy. Another advantage is that it avoids increasing the price of retail electricity through the EEG (in Germany) or the public service obligation of the tariff, e.g. the CSPE (in France).
• A UK-style carbon price fl oor, which has the merit of raising consumers’ awareness of the cost of energy and fi nancing the energy transition at the same time.
c) GHG: are we going to fi x the ETS market and have a market mechanism that produces the right price of carbon?
The EU’s long-term GHG emissions reduction goals look like a mere extension of the previous goal by another 20% cut to be achieved over a 10-year period beyond 2020. It might be considered slightly optimistic on the part of EU lawmakers to believe that EU Member States will be able to reduce their emissions collectively by another 20% by ten years from now, given it took them almost 30 years to reduce carbon levels to under 20%, and this was against a backdrop of severe economic contraction.
In 2014, the IEA stated that a EUR 55/ton of CO2 equivalent was necessary for the EU to achieve its renewable energy target of 27% of fi nal consumption. More interestingly, the EC has calculated that EUR 53/ton CO2 would suffi ce to achieve all 2030 objectives. This means that a high price for carbon could be a more effi cient policy tool than costly renewables. It also means that this is the carbon price level needed today to help move away from coal to gas, nuclear and/or carbon-free technologies.
Given the present situation of the ETS and the very low price of CO2 allowances, there is widespread recognition that the ETS market is due for an overhaul, starting with eliminating the credit surplus. The proposed reform includes “backloading” EUAs, the creation of a market stability reserve to be used as a “credit buffer” to regulate the price after 2020, and a CO2 reduction increase from 1.74% annually to 2.2% from 2021 onwards.
But none of the reforms above will be effective before 2021. This will obviously be too late to have a carbon price constituting a driver for low carbon technologies by 2020. In the years ahead, investor confi dence in EU energy projects will remain low. So, presumably, will the carbon price. This also means that European power plants will burn a great deal of coal, since it is available on the market on a vast scale at a competitive price – unless legislation forces coal out of the market.
In the longer-term, the 2030 ambitious GHG emissions targets (-43% between 2005 and 2030 in the ETS sector) are likely to push the carbon price upward at last.
Road ahead and main challenges: the path to 2030 and beyond
3636

To start a new section, hold down the apple+shift keys and click
to release this object and type the section title in the box below.
d) Carbon, renewables, energy effi ciency: do we need so many objectives?
In the 2030 package, the energy effi ciency target seems to have been taken out of the set of three binding criteria and replaced by a few indicative objectives. In terms of 2030 renewables objectives, the 27% target is now to be “binding at the EU level”, and it is explicitly stated that it is “not [to] be translated into nationally binding targets” in contrast to the present system. But how will it be delivered? How will Europe make sure the objective is met, other than through protracted, endless government-to-government negotiations and horse-trading? Or, does it mean that the renewables target has now become non-binding altogether?
The GHG emission reduction potential of non-ETS sectors (which include transport, buildings, agriculture and waste) seems to have been underutilized until now. In 2013, the non-ETS sector contributed around 60% of European GHG emissions78, whereas its GHG emission reduction targets were less ambitious than those for the ETS sector (the targeted reduction between 2005 and 2020 is 10% in the non-ETS sector and 2021% in the ETS sector). It can be wondered how the EU-28 can encourage, in a most cost-effective way, the GHG emission reductions in the sectors with high GHG emission reduction potential, such as transportation, buildings, land and forestry.
However, the task of reducing CO2 across the non-ETS sectors does not look easy as the sector covers a vast number of small, scattered emitters. For the period 2013-2020, these are subject to binding greenhouse gas emission targets for Member States set by the Effort Sharing Decision (ESD)79. After 2020, they will probably remain subject to national targets, which will be de-correlated from the ETS objectives. In other words, it will not be possible for a country to swap ETS allowances for non-ETS emissions. Cracking down on heavy vehicle pollution in cities will not provide anyone with credit for relaxing the carbon regulation on their power system. In other words, it will not be possible to swap non-ETS achievements against ETS objectives. That could have actually helped to reduce physical emissions.
The 3 x 20 targets are complex, especially those relating to energy effi ciency, and may have created more inconsistencies than real synergies between the different targets. The post-2020 targets do not seem clearer and it will probably not be easy to monitor progress in reaching them.
In fact, what is the point in imposing such a large, complex host of differentiated and EU objectives? Why not stick to a single emissions reduction target rather than multiple targets which vary at EU and national levels? Why not stick to a single, highly visible and measurable carbon emissions target covering ETS and non-ETS sectors, and let countries and markets select the technology which they think makes more sense or shows a better cost-benefi t ratio?
e) To what extent can technology be part of the solution?
One of the biggest challenges ahead may be the role that developments in technology and behavior will be able to play to alleviate the burden required to meet the ambitious targets for 2030 and 2050. As indicated above, expectations were high in this regard when the initial targets were set.
It was expected that within a few years, most vehicles would be running on second generation biofuels, hydrogen or electricity; it would be easy to store electricity produced from RES thanks to storage technologies; there would be massive underground storage of CO2 from power plants, thus paving the way to the age of abundant clean coal.
We all know that things did not happen this way.
We have witnessed a few breakthroughs: solar photovoltaic yields are increasing signifi cantly, while the cost is decreasing steadily, thus making it more competitive day-by-day – so competitive in fact that that it has more or less killed all the competition from more ground-breaking alternative solar technologies, such as Concentrated Solar Power (CSP) or organic PV.
78 EEA (2014), Trends and projections in Europe 2014
79 Decision No. 406/2009/EC of 23 April 2009 on the effort of Member States to reduce their greenhouse gas emissions to meet the Community’s greenhouse gas reduction commitment up to 2020.
Road ahead and main challenges: the path to 2030 and beyond
37 37Energy market reform in Europe

To start a new section, hold down the apple+shift keys and click
to release this object and type the section title in the box below.
To start a new section, hold down the apple+shift keys and click
to release this object and type the section title in the box below.
But there were few other successes in sight before this decade despite the political ambitions and the millions of Euro spent on R&D: several large-scale CCS projects were undertaken in the 2000s but the technology stalled shortly after because of its high costs and its relatively low social acceptability. Wind power has developed but without any signifi cant technological improvement. Second and even third generation biofuels were said to be on the brink of being ready for the market in the early 2000s (via either thermochemical or biological pathways) but after a few bankruptcies (Choren et al.), the situation has not changed much, and we are still waiting for industrial development of these new technologies. Electric cars are still scarce, etc.
That said, over the last few years, things may have begun to change. Several factors are at work: the major development of the Silicon Valley giants and the profound impact this has had both on some technological developments and on our day-to-day behaviors; the economic crisis and the consequent search for more resource-effi cient ways of life; R&D efforts undertaken over a few decades bearing fruit at last… Whatever the reason, a careful observer can spot signifi cant developments, even if it will be a few years yet before they reach their full potential:
• Toyota paved the way to new modes of motorization with its successful, but expensive, Prius Hybrid a few years ago. Over the last two to three years, mainstream car manufacturers have begun to sell affordable electric vehicles (e.g. Renault and its Zoe).
• The spread of connected objects and the search for resource effi ciency have made the development of new vehicle-sharing modes easier, either through centralized models (e.g. Autolib) or on a more personal basis (e.g. Bla Bla Car).
• Metering energy consumption with precision has long been very costly, meaning that it was only available to very large consumers. Simpler meters have paved the way to the massive development of smart meters and smart grids; smartphones enable easy long distance energy control and command. A better demand/response match is probably in sight.
• The technologies required for demand-side response (such as smart distribution networks, smart meters and appliances, and electricity storages) and demand-response services (dynamic pricing, interruptible load or dynamic-load capping contracts for industry, commercial businesses and households, participation in balancing markets, service aggregation and demand optimisation for households) are blooming and may mean that the enormous potential of the demand-side response can be exploited on an EU scale at last (currently, peak demand could be reduced by 60 GW, approximately 10 % of EU’s peak demand)80.
The future is not so bright for all the long awaited innovations. Some technologies may be relatively technically mature but not yet competitive in current market conditions (e.g. CCS, power-to-gas and new technologies related to energy effi ciency in buildings). And some very promising technologies are still further from commercial scale, such as next generation biomass-to-energy processes or power storage. But between now and 2030, technological developments may surprise us.
On February 24, 2015, the European Commission set out its strategy to achieve “a resilient Energy Union with a forward-looking climate change policy”81. This shows positive signals to tackle the challenges outlined in this study. Concrete measures still need to be defi ned and implemented in the next few years.
According to offi cial ex ante evaluations by the EC, the benefi ts of saving energy and resources as the single path to achieving a carbon-free society would by far exceed the cost of the investment requirements. Given the very high costs involved, it would be worthwhile to reassess this ex ante evaluation regularly, once the costs and benefi ts can be evaluated a posteriori – and to adapt policies if necessary before they lead us once more into unexpected and unwanted territory.
80 Source: http://ec.europa.eu © European Union, 1995-2015, European Commission (2013) Communication from the Commission Delivering the internal electricity market and making the most of public intervention [C(2013) 7243 fi nal], available at: http://ec.europa.eu/energy/sites/ener/fi les/documents/com_2013_public_intervention_en.pdf
81 http://ec.europa.eu/priorities/energy-union/index_en.htm
Road ahead and main challenges: the path to 2030 and beyond
3838
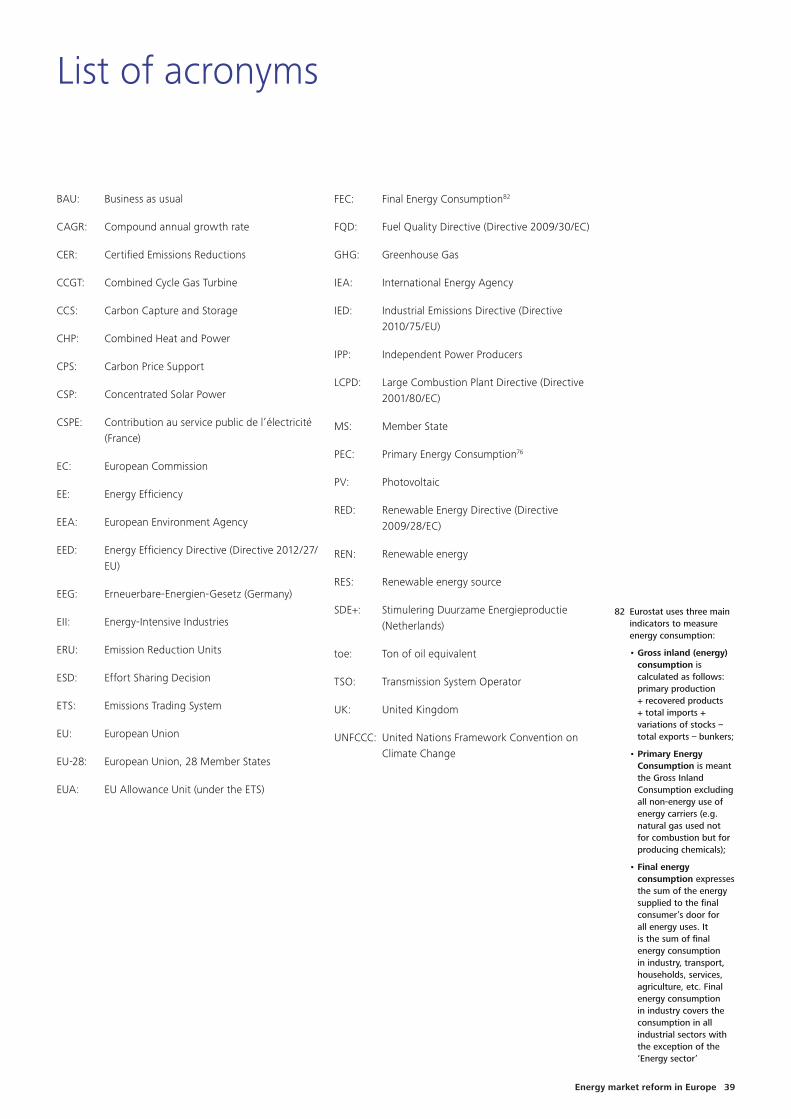
To start a new section, hold down the apple+shift keys and click
to release this object and type the section title in the box below.
List of acronyms
BAU: Business as usual
CAGR: Compound annual growth rate
CER: Certifi ed Emissions Reductions
CCGT: Combined Cycle Gas Turbine
CCS: Carbon Capture and Storage
CHP: Combined Heat and Power
CPS: Carbon Price Support
CSP: Concentrated Solar Power
CSPE: Contribution au service public de l’électricité (France)
EC: European Commission
EE: Energy Effi ciency
EEA: European Environment Agency
EED: Energy Effi ciency Directive (Directive 2012/27/EU)
EEG: Erneuerbare-Energien-Gesetz (Germany)
EII: Energy-Intensive Industries
ERU: Emission Reduction Units
ESD: Effort Sharing Decision
ETS: Emissions Trading System
EU: European Union
EU-28: European Union, 28 Member States
EUA: EU Allowance Unit (under the ETS)
FEC: Final Energy Consumption82
FQD: Fuel Quality Directive (Directive 2009/30/EC)
GHG: Greenhouse Gas
IEA: International Energy Agency
IED: Industrial Emissions Directive (Directive 2010/75/EU)
IPP: Independent Power Producers
LCPD: Large Combustion Plant Directive (Directive 2001/80/EC)
MS: Member State
PEC: Primary Energy Consumption76
PV: Photovoltaic
RED: Renewable Energy Directive (Directive 2009/28/EC)
REN: Renewable energy
RES: Renewable energy source
SDE+: Stimulering Duurzame Energieproductie (Netherlands)
toe: Ton of oil equivalent
TSO: Transmission System Operator
UK: United Kingdom
UNFCCC: United Nations Framework Convention on Climate Change
82 Eurostat uses three main indicators to measure energy consumption:
• Gross inland (energy) consumption is calculated as follows: primary production + recovered products + total imports + variations of stocks – total exports – bunkers;
• Primary Energy Consumption is meant the Gross Inland Consumption excluding all non-energy use of energy carriers (e.g. natural gas used not for combustion but for producing chemicals);
• Final energy consumption expresses the sum of the energy supplied to the fi nal consumer’s door for all energy uses. It is the sum of fi nal energy consumption in industry, transport, households, services, agriculture, etc. Final energy consumption in industry covers the consumption in all industrial sectors with the exception of the ‘Energy sector’
39 39Energy market reform in Europe
To start a new section, hold down the apple+shift keys and click
to release this object and type the section title in the box below.
To start a new section, hold down the apple+shift keys and click
to release this object and type the section title in the box below.
Selected bibliographical references
• Buchan, David (2013) in “Why Europe Energy and Climate policies are coming apart?” (Oxford Institute of Energy Studies), available online at: http://www.oxfordenergy.org/wpcms/wp-content/uploads/2013/07/SP-28.pdf
• CDC Climat, Ministère de l’Écologie, du Développement Durable et de l’Énergie (2014), Key Figures on Climate, 2014 Edition
• Romain Morel and Igor Shishlov (2012), “Ex-post evaluation of the Kyoto Protocol: Four key lessons for the 2015 Paris agreement”, CDC Climat research: http://www.cdcclimat.com/IMG/pdf/14-05_climate_report_no44_-_analysis_of_the_kp-2.pdf
• Eurelectric (2014), Analysis of European Power Price Increase Drivers, A Eurelectric study, May 2014; http://www.eurelectric.org/media/131606/prices_study_fi nal-2014-2500-0001-01-e.pdf
• European Commission (2014) – Climate and energy priorities for Europe – the way forward. Presentation by J.M. Barroso on 20/21.03.2014, Source: © European Union, http://eur-lex.europa.eu/, 1998-2015
• http://ec.europa.eu/clima/policies/2030/docs/climate_energy_priorities_en.pdf
• European Commission (2014), Commission staff working document impact assessment: A policy framework for climate and energy in the period from 2020 up to 2030, 22 01 2014, Source: © European Union, http://eur-lex.europa.eu/, 1998-2015
• European Commission (2014), Communication from the Commission to the European Parliament, the Council, the European Economic and Social Committee and the Committee of the Regions – A policy framework for climate and energy in the period from 2020 to 2030, Source: © European Union, http://eur-lex.europa.eu/, 1998-2015
• European Commission (2013), Green Paper on energy and climate policy, March 2013, Source: © European Union, http://eur-lex.europa.eu/, 1998-2015
• European Commission (2013), Communication from the Commission Delivering the internal electricity market and making the most of public intervention [C(2013) 7243 fi nal], available at: http://ec.europa.eu/energy/sites/ener/fi les/documents/com_2013_public_intervention_en.pdf, Source: © European Union, http://eur-lex.europa.eu/, 1998-2015
• European Commission (2011), Energy Roadmap 2050 [COM/2011/885], Source: © European Union, http://eur-lex.europa.eu/, 1998-2015
• European Commission (2011) Impact assessment - A Roadmap for moving to a competitive low carbon economy in 2050 [SEC(2011) 288 fi nal], available at: http://eur-lex.europa.eu/legal-content/EN/TXT/PDF/?uri=CELEX:52011SC0288&from=EN, Source: © European Union, http://eur-lex.europa.eu/, 1998-2015
• European Commission (2010), Energy 2020: A strategy for competitive, secure, and sustainable energy [COM(2010)639]; Source: © European Union, http://eur-lex.europa.eu/, 1998-2015
• European Commission (2014), “Energy prices and costs report”, Commission staff working document [SWD(2014) 20 fi nal], available at: http://www.cep.eu/Analysen/COM_2014_21_Energiepreise/Staff_Working_Document_SWD_2014__20.pdf, Source: © European Union, http://eur-lex.europa.eu/, 1998-2015
• European Commission (2014), “Impact Assessment – A policy framework for climate and energy in the period from 2020 up to 2030”, Commission staff working document [SWD(2014) 15 fi nal], available at: http://eur-lex.europa.eu/legal-content/EN/TXT/PDF/?uri=CELEX:52014SC0015&from=EN, Source: © European Union, http://eur-lex.europa.eu/, 1998-2015
• European Commission Energy Country Factsheets 2012. Gross Inland Consumption by fuel (Primary Energy Consumption) in Mtoe for year 2010 [online] at: http://ec.europa.eu/energy/observatory/countries/doc/2012-country-factsheets.pdf, Source: http://ec.europa.eu. © European Union, 1995-2015
4040
To start a new section, hold down the apple+shift keys and click
to release this object and type the section title in the box below.
• European Commission Energy Country Factsheets 2012, fi nal energy consumption for year 2009 & 2010 [online] at: http://ec.europa.eu/energy/observatory/countries/doc/2012-country-factsheets.pdf, Source: http://ec.europa.eu. © European Union, 1995-2015
• European Commission (2014), http://ec.europa.eu/energy/sites/ener/fi les/documents/2014_pocketbook.pdf, Source: EU Energy in fi gures. Statistical pocketbook 2014. © European Union, 2014
• European Commission JRC : http://re.jrc.ec.europa.eu/pvgis/solres/solreseurope.htm, Source: PVGIS © European Communities, 2001-2008
• Šúri, M, Huld, T. A., Dunlop E. D., Ossenbrink, H. A., 2007. Potential of solar electricity generation in the European Union Member States and candidate countries. Solar energy, 81, 1295-1305
• European Council (2014), Communication from the European Council (EUCO 169/14), 24 October 2014; available on: http://www.consilium.europa.eu/uedocs/cms_data/docs/pressdata/en/ec/145397.pdf, Source: © European Union, http://eur-lex.europa.eu/, 1998-2015
• Eurostat: http://appsso.eurostat.ec.europa.eu/nui/submitViewTableAction.do, Source: Eurostat. © European Union, 1995-2015
• Europe 2020 Targets [online] available on http://epp.eurostat.ec.europa.eu/portal/page/portal/europe_2020_indicators/headline_indicators, Source: Eurostat. © European Union, 1995-2015
• EEA (2014), Trends and projections in Europe 2014, available online on: http://www.eea.europa.eu/publications/trends-and-projections-in-europe-2014
• EEA GHG Data Viewer: http://www.eea.europa.eu/data-and-maps/data/data-viewers/greenhouse-gases-viewer
• Elia, Rapport Annuel 2013
• IEA (2013), World Energy Outlook 2013, © OECD/IEA 2013 World Energy Outlook, IEA Publishing. Licence: http://www.iea.org/t&c/
• Energy Policies of IEA Countries, IEA (2015) Policies and Measures Database, IEA, Paris
• Le Monde, 2014, article available at: http://www.lemonde.fr/economie/article/2014/02/27/gerard-mestrallet-nous-allons-recruter-15-000-personnes-par-an_4374169_3234.htmlMagritte Group
• NEA/OECD (2012), Nuclear Energy and Renewables – System Effect in Low-carbon Electricity Systems
• Percebois, Jacques & Mandil, Claude (2012), Rapport Energies 2050, [online] at: http://www.strategie.gouv.fr/system/fi les/rapport-energies_0.pdf
• RED, El Sistema Eléctrico Español, 2013
• RTE (2014), Bilan électrique français 2013
• Terna Group, Dati Statistici sull’energia elettrica in Italia, 2013
Selected bibliographical references
41 41Energy market reform in Europe

Appendix
42
European energy market reformCountry profi le: Belgium
43Energy market reform in Europe
Contents
Current situation 45
Energy consumption and trade balance 45
Power generation 46
Power market: market mechanism and main actors 47
Power prices 48
Targets for 2020 50
Energy efficiency targets 50
Renewable energy targets 51
GHG emissions and targets 53
Road ahead and main challenges: the way to 2030 and beyond 54
Belgium energy dependency challenges 54
Proactive policy on renewables energy impacting retail prices 54
The planned nuclear phase-out could increase dependency on gas 54 consumption and increase costs
Crucial cross-border capacity at risk of shortage 55
Conclusion 55
Selected bibliographic references 56
44

To start a new section, hold down the apple+shift keys and click
to release this object and type the section title in the box below.
Current situation
Energy consumption and trade balanceIn 2012, Belgium’s energy consumption amounted to 56 Mtoe; more than 70% came from fossil fuels. Petroleum products (22 Mtoe) represent the fi rst source of energy consumption, followed by natural gas (14 Mtoe). The share of oil products and nuclear in the energy mix remained stable during the last two decades, while natural gas consumption increased signifi cantly, from 8 Mtoe in 1990 to 14 Mtoe in 2012.
Increasing importance of natural gas in Belgium’s energy mix.Natural gas consumption nearly doubled between 1990 and 2010 before falling by 15% in 2011 and 2012. The fourth source of energy in the mix in 1990, natural gas had become the second source of energy consumption by 2012.
1 Source: Eurostat. © European Union, 1995-2015
2 Non-energy consumption refers to fuels that are used as raw materials and are not consumed as fuel or transformed into other fuels
3 Essenscia – Belgian Federation for Chemistry and Life Sciences Industries, 2013
The sharp increase in Belgium’s energy consumption from 1990 to 2000 (+20%) has slowed down since 2000. Between 2000 and 2010, consumption grew by 3% and started decreasing in 2011 (-8% between 2011 and 2013).
The industrial sector accounted for 24% of energy consumption in 2012, the same share as in 2000. The energy sector was the main driver of overall consumption until 2012; while its contribution declined by 12% between 1990 and 2012, it became the second highest energy consumer (23%) in 2012, after industry. During this period, residential consumption experienced a similar decrease (-10%), while non-energy consumption2 grew signifi cantly (+153%), pushing up its share of energy consumption to 12%, which is almost on par with the residential sector’s 13% share. As a critical hub for chemicals and plastics, Belgium is very attractive to the chemical industry. Its share of chemicals and plastics in the economy is almost twice the EU27 average, and its chemical trade balance increased by nearly 50% between 2002 and 2012.3
Key fi gures: Population (2013): 11.2 million
GDP (2013): 382,692 bn €
GDP/capita (2013): 34,500 €
GDP/PEC (2012): 7.72 €/kgoe
PEC/capita (2012): 4.39 toe/cap.
Net Energy import:47 Mtoe
CO2 eq/capita: 9.46 tCO2eq/cap
Figure 1. Gross inland consumption in 2012 (56 Mtoe)1
6%
26%
19%
5%
40%
4%
Solid fuels (incl. hard coal) Petroleum products
Natural gas Nuclear
Renewable energies Waste (non-renewable)
Figure 2. Gross inland consumption by sector (in Mtoe)1
Energy Sector Transports Residential
Industry Services Non-energyconsumptionAgriculture Others
0
50
201220001990
14
8
8
3
12
3
49 Mtoe
13
10
7
7
13
4
56 Mtoe
14
10
9
7
14
3
59 Mtoe
1 45Energy market reform in Europe
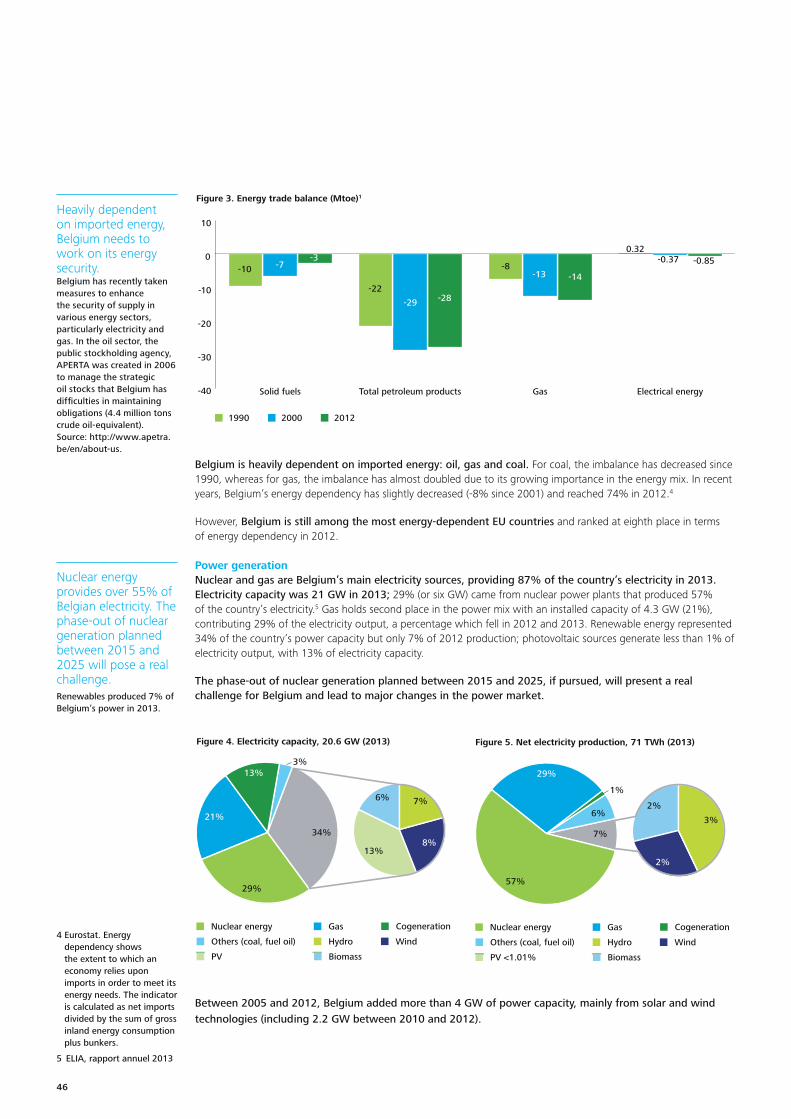
To start a new section, hold down the apple+shift keys and click
to release this object and type the section title in the box below.
To start a new section, hold down the apple+shift keys and click
to release this object and type the section title in the box below.
Belgium is heavily dependent on imported energy: oil, gas and coal. For coal, the imbalance has decreased since 1990, whereas for gas, the imbalance has almost doubled due to its growing importance in the energy mix. In recent years, Belgium’s energy dependency has slightly decreased (-8% since 2001) and reached 74% in 2012.4
However, Belgium is still among the most energy-dependent EU countries and ranked at eighth place in terms of energy dependency in 2012.
Power generation Nuclear and gas are Belgium’s main electricity sources, providing 87% of the country’s electricity in 2013. Electricity capacity was 21 GW in 2013; 29% (or six GW) came from nuclear power plants that produced 57% of the country’s electricity.5 Gas holds second place in the power mix with an installed capacity of 4.3 GW (21%), contributing 29% of the electricity output, a percentage which fell in 2012 and 2013. Renewable energy represented 34% of the country’s power capacity but only 7% of 2012 production; photovoltaic sources generate less than 1% of electricity output, with 13% of electricity capacity.
The phase-out of nuclear generation planned between 2015 and 2025, if pursued, will present a real challenge for Belgium and lead to major changes in the power market.
4 Eurostat. Energy dependency shows the extent to which an economy relies upon imports in order to meet its energy needs. The indicator is calculated as net imports divided by the sum of gross inland energy consumption plus bunkers.
5 ELIA, rapport annuel 2013
Nuclear energy provides over 55% of Belgian electricity. The phase-out of nuclear generation planned between 2015 and 2025 will pose a real challenge.Renewables produced 7% of Belgium’s power in 2013.
Between 2005 and 2012, Belgium added more than 4 GW of power capacity, mainly from solar and wind technologies (including 2.2 GW between 2010 and 2012).
Figure 4. Electricity capacity, 20.6 GW (2013)
8%13%
6% 7%
34%
13%
21%
29%
3%
Nuclear energy Gas Cogeneration
Others (coal, fuel oil) Hydro Wind
PV Biomass
Figure 5. Net electricity production, 71 TWh (2013)
2%
2%
3%6%
29%
57%
7%
1%
Nuclear energy Gas Cogeneration
Others (coal, fuel oil) Hydro Wind
PV <1.01% Biomass
Figure 3. Energy trade balance (Mtoe)1
1990 2000 2012
-40
-30
-20
-10
0
10
Electrical energyGasTotal petroleum productsSolid fuels
-10 -7-3
-22
-29 -28
-8
0.32-0.37 -0.85
-13 -14
Heavily dependent on imported energy, Belgium needs to work on its energy security.Belgium has recently taken measures to enhance the security of supply in various energy sectors, particularly electricity and gas. In the oil sector, the public stockholding agency, APERTA was created in 2006 to manage the strategic oil stocks that Belgium has diffi culties in maintaining obligations (4.4 million tons crude oil-equivalent).Source: http://www.apetra.be/en/about-us.
246

To start a new section, hold down the apple+shift keys and click
to release this object and type the section title in the box below.
Between 2010 and 2012, wind capacity grew from 0.9 to 1.4 GW and solar capacity went from 0.9 GW to 2.6 GW. However, generation from renewables is intermittent, dispersed and weather-dependent, leading to grid stability issues such as congestions and imbalances. More fl exibility is needed to cope with congestion and benefi t from the installed capacity.7
In 2007 and 2011, the Belgium Commission for Regulation of Electricity and Gas (CREG), as well as other authorities, concluded that Belgium faces security issues due to low electricity production capacity in the face of rising demand. The fi nancial crisis has delayed the need for additional capacity investments; however, the country may struggle to meet demand as early as 2015. In 2012-2013, Belgium’s production capacity was compromised due to cold weather, and spare production capacity was limited to 370 MW during peaks. Security of supply is also threatened by the unplanned temporary halt of three nuclear reactors since mid-2014, representing half of installed nuclear capacity. The planned shutdown of the oldest nuclear plants (in Doel and Tihange) in 2015 and additional gas plant closures (Ruien 5 & 6 and Awirs 5) will further reduce electricity capacity and threaten the country’s security of supply. Moreover, imports from France are declining, as France also faces security of supply issues. Additional concerns might arise from differences in spark spreads (the gross margin of power plants from selling a unit of electricity) between gas and coal, the latter being more affordable despite generating more emissions.
Power market: market mechanism and main actorsThe opening of the Belgian market to competition was completed in January 2007 (July 2003 for Flanders, and January 2007 for Wallonia and the Brussels-Capital region).
Electricity production is concentrated, and dominated by two main incumbents: Electrabel, owned by GDF SUEZ, and SPE-Luminus, majority-owned by EDF. Commercial and residential markets are considered competitive and dynamic8 with a number of active electricity suppliers and a high and increasing switching rate across Belgium’s three regions since 2011.
Elia, a public company listed on Euronext, is the only electricity TSO in Belgium. Publi-T, a cooperative company representing Belgian municipalities and inter-municipal companies, owns 45.2% of Elia’s shares.
6 Source: Eurostat. © European Union, 1995-2015
7 Sia Partners, Benelux The Belgian Electricity market: overview, analysis of today’s issues and suggestions to fi x it, 2013
8 © OECD/IEA 2009 Energy Policies of IEA Countries – Belgium 2009 Review, IEA Publishing. Licence: http://www.iea.org/t&c/
Figure 6. Electrical capacity change 2010-2012 (GW)6
0.0
0.2
0.4
0.6
0.8
1.0
1.2
1.4
1.6
1.8
Solar PVWindHydroNuclearCombustible fuels
0.30.5
0.00.0
1.7
3 47Energy market reform in Europe
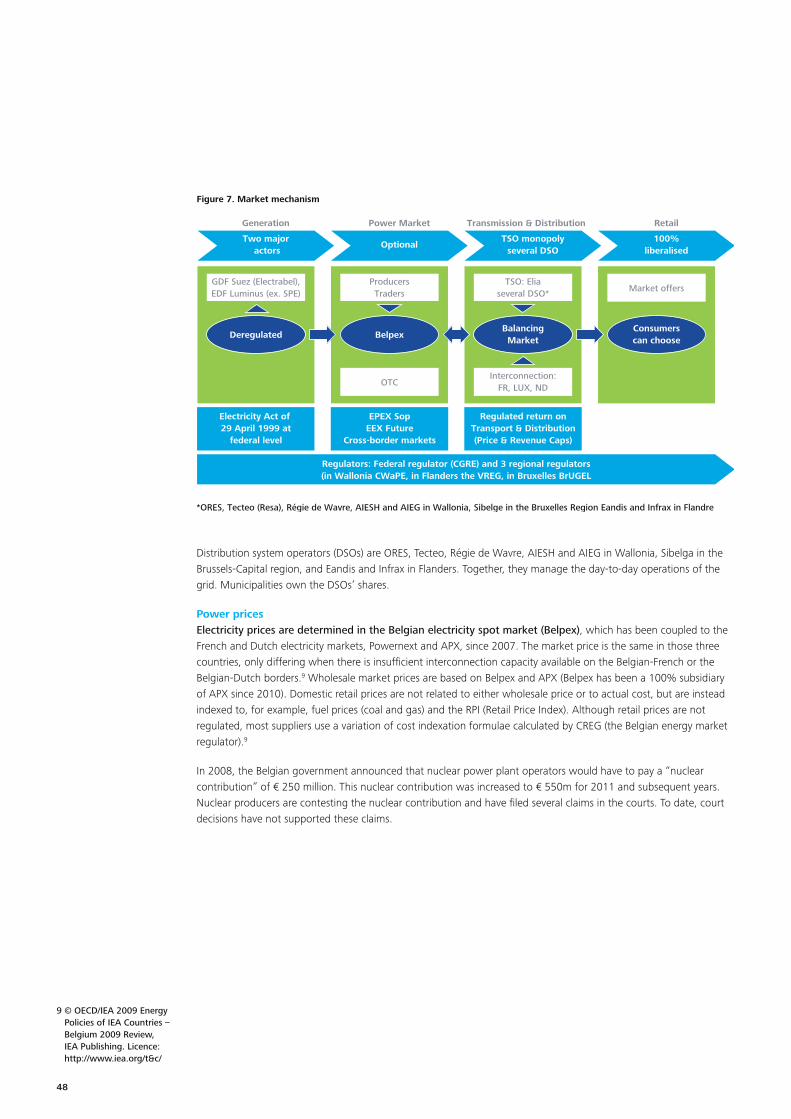
To start a new section, hold down the apple+shift keys and click
to release this object and type the section title in the box below.
To start a new section, hold down the apple+shift keys and click
to release this object and type the section title in the box below.
9 © OECD/IEA 2009 Energy Policies of IEA Countries – Belgium 2009 Review, IEA Publishing. Licence: http://www.iea.org/t&c/
Two major actors
OptionalTSO monopoly
several DSO100%
liberalised
Generation
GDF Suez (Electrabel),EDF Luminus (ex. SPE)
Electricity Act of 29 April 1999 at
federal level
EPEX SopEEX Future
Cross-border markets
Regulators: Federal regulator (CGRE) and 3 regional regulators(in Wallonia CWaPE, in Flanders the VREG, in Bruxelles BrUGEL
Regulated return onTransport & Distribution(Price & Revenue Caps)
ProducersTraders
Power Market Transmission & Distribution Retail
Figure 7. Market mechanism
*ORES, Tecteo (Resa), Régie de Wavre, AIESH and AIEG in Wallonia, Sibelge in the Bruxelles Region Eandis and Infrax in Flandre
Deregulated Belpex
OTC
TSO: Eliaseveral DSO*
BalancingMarket
Interconnection:FR, LUX, ND
Consumerscan choose
Market offers
Distribution system operators (DSOs) are ORES, Tecteo, Régie de Wavre, AIESH and AIEG in Wallonia, Sibelga in the Brussels-Capital region, and Eandis and Infrax in Flanders. Together, they manage the day-to-day operations of the grid. Municipalities own the DSOs’ shares.
Power pricesElectricity prices are determined in the Belgian electricity spot market (Belpex), which has been coupled to the French and Dutch electricity markets, Powernext and APX, since 2007. The market price is the same in those three countries, only differing when there is insuffi cient interconnection capacity available on the Belgian-French or the Belgian-Dutch borders.9 Wholesale market prices are based on Belpex and APX (Belpex has been a 100% subsidiary of APX since 2010). Domestic retail prices are not related to either wholesale price or to actual cost, but are instead indexed to, for example, fuel prices (coal and gas) and the RPI (Retail Price Index). Although retail prices are not regulated, most suppliers use a variation of cost indexation formulae calculated by CREG (the Belgian energy market regulator).9
In 2008, the Belgian government announced that nuclear power plant operators would have to pay a “nuclear contribution” of € 250 million. This nuclear contribution was increased to € 550m for 2011 and subsequent years. Nuclear producers are contesting the nuclear contribution and have fi led several claims in the courts. To date, court decisions have not supported these claims.
448

To start a new section, hold down the apple+shift keys and click
to release this object and type the section title in the box below.
High residential electricity prices and supply issues.Belgium’s energy prices for average industrial consumers are below the EU-28 average, but consumers pay the fi fth highest residential electricity prices in the EU. Insuffi cient interconnection capacity on the Belgian-French or Belgian-Dutch borders can make it diffi cult for the country to balance supply and demand.
10 Source: Eurostat. © European Union, 1995-2015
11 Eurelectric, Analysis of European Power Price Increase Drivers, May 2014
12 Deloitte (2013), Benchmarking study of electricity prices between Belgium and neighboring countries
Figure 8. Retail prices for industrial and residential users (€/MWh)10
0
50
100
150
200
250
2013201120102008
10
70
16
96€ 12
69
26
106€15
67
29
111€18
60
31
110€
11%
73%
17%
11%
65%
24%
13%
60%
27%
16%
55%
29%0
50
100
150
200
250
2013201120102008
53
97
65
215€
51
74
72
197€54
78
90
222€
57
71
93
221€
25%
45%
30%
26%
38%
36%
4%
35%
41%
26%
32%
42%
Grid Energy and supply Taxes Grid Energy and supply Taxes
Industrial Residential
Retail prices for residential consumers in Belgium are among the top 10 highest prices in Europe. Residential consumers pay the fi fth highest retail prices in the EU (221 €/MWh in 2013), 18% above the EU-28 average (169 €/MWh in 2013). Prices for household consumers rose by 13% from 2010 to 2012, after a decrease between 2008 and 2010 (-8%). This increase was due to rising grid costs (+38%), partially offset by declining energy costs (-19%) and taxes (-1%).
In 2012, Belgium’s overall policy support costs (PSC) were 29 €/MWh, both for industrial and residential users, which was higher than the European average (21 €/MWh for industrial users and 25 €/MWh for residential ones). These policy support levies are charged on three tariff components: commodity-related RES and CHP support (50%) for energy; system-related RES support (23%) for the network; and public service obligations/social policy support costs (27%) for taxes11. As a result, the overall support to CHP and RES amounts to 21 €/MWh (i.e. around € 1.5 billion in 2013). This means that power and grey energy (the energy hidden in a product) market prices do not necessarily refl ect the real underlying cost structures and unit costs of renewables as compared to grey energy. Furthermore, not all of the policy support costs paid out to renewable energy producers have led to increased consumer tariffs and taxes, a situation likely to push up power prices in the future, regardless of energy sources. Overall, the effectiveness of the country’s PSC and its (green) return on investment has been called into question, and current policies can afford to be improved.
In 2012, retail prices for average industrial users in Belgium totaled 111 €/MWh, below the EU average (125 €/MWh). The prices grew by 15% between 2008 and 2012, as a result of increasing grid costs (+81%) and taxes (+43%). Energy and supply related costs slightly decreased (-4% from 2008 to 2012) for the same period.
However, between 2011 and 2013, large industrial consumers in Flanders and Wallonia paid on average between 12% (for a 1,000 GWh profi le in Flanders) and 45% (for a 100 GWh profi le in Wallonia), prices that were considerably higher than those charged in neighboring countries such as Germany, France and the Netherlands. These differences are predominantly due to policy measures in neighboring countries (reductions and exemptions) that favor industrial consumers, such as lower regulated market prices (in France), lower network costs (in Germany) and lower electricity taxes (in the Netherlands and France). Electricity taxes in Flanders are relatively high, and are even more so in Wallonia.12
5 49Energy market reform in Europe

To start a new section, hold down the apple+shift keys and click
to release this object and type the section title in the box below.
To start a new section, hold down the apple+shift keys and click
to release this object and type the section title in the box below.
Targets for 2020
In 2009, the National Climate Plan set the main targets and action plans regarding energy and the climate. They were subsequently reviewed and updated in several other plans, and confi rmed in the 2014 National Reform Program:
• An indicative energy effi ciency target of an 18% reduction in primary energy consumption by 2020 (compared to a baseline projected scenario for 2020 calculated by the European energy model PRIMES 2007).
• A 13% share of gross fi nal energy consumption from renewable energy sources by 2020.
• A 21% reduction of GHG emissions by 2020 compared to 2005 in sectors covered by the EU emission trading system (ETS).
• A 15% reduction of GHG emissions by 2020 compared to 2005 in non-ETS sectors.
Even if the 20-20-20 European targets apply to Belgium, climate and energy policies are mostly implemented at the regional level (Flanders, Wallonia and the Brussels-Capital region), a situation which can sometimes raise coordination issues. The national targets, set up in response to the European 20-20-20 targets, are translated into regional targets for each of Belgium’s three regions, under the coordination of several federal agencies (Inter-ministry Conference for the Environment, Coordination Committee of International Environment Policy and National Climate Commission).
Energy effi ciency targetsBelgium’s energy effi ciency has been improving in recent years, but its energy intensity remains higher than its neighbors’. This relatively higher energy intensity can be partly explained by the particular structure of its economy and industry, which features a proportionally high share of energy-intensive activities, such as chemicals and metallurgy. While GDP in Belgium rose by 49% between 2000 and 2012, its primary energy consumption in 2012 decreased by 5% as compared to the 2000 level. However, this decline is quite recent; fi nal energy consumption grew steadily from 1990 to 2010 (+19%).
20-20-20 EU targets for Belgium:• 18% reduction of primary
energy consumption, as compared to a 2020 projection (calculated with the model PRIMES 2007).
• 13% share of renewables.
• 21% and 15% reduction of ETS and non-ETS GHG emissions, respectively, to be implemented at the regional level, requiring close coordination.
Energy effi ciency: with a stable fi nal energy consumption in recent years, Belgium needs to implement measures to reach its energy effi ciency targets.Belgium’s primary energy consumption has remained almost stable since 2005. It is not clear whether Belgium will be able to reach its 2020 energy effi ciency target.
13 Source: Eurostat. © European Union, 1995-2015.
Figure 9. Final energy consumption (Mtoe) and 2020 target13
28
29
30
31
32
33
34
35
36
37
38
20202012201020051990
32
37 3837
33
Source: Eurostat © European Union, 1995-2015
Figure 10. Energy efficiency 2000-2012
Gross inland production (Indexed to 100)
GDP (Indexed to 100)
80
100
120
140
160
2012201020082006200420022000
650

To start a new section, hold down the apple+shift keys and click
to release this object and type the section title in the box below.
14 European Commission, http://ec.europa.eu/energy/effi ciency/eed/neep_en.htm
15 Assessment of Energy effi ciency action plan and policies in EU Member States, Belgium Country profi le Energy Effi ciency Watch, http://www.energy-effi ciency-watch.org/fi leadmin/eew_documents/Documents/EEW2/Belgium.pdf
16 Source: http://ec.europa.eu. © European Union, 1995-2015
In April 2014, the Belgian government adopted the 2014 National Energy Effi ciency Action Plan (NEEAP).14 The overall targeted primary energy savings fostered by existing and planned policies amount to 9.6 Mtoe by 2020 (calculated as the difference between projected gross inland consumption in 2020, without and with energy savings measures). If achieved, these savings would allow Belgium to meet its objectives of an 18% reduction in primary energy consumption in 2020. Some of the measures Belgium has adopted to meet its energy savings targets include:
• Implementation of the ecodesign and ecolabelling Directives (2.73 Mtoe) in the residential and services sectors to promote more energy effi cient products (for building, heating, boiler, isolation, materials, etc.) and related incentives.
• Public support to residential consumers to encourage investments in renewables and/or energy savings (tax credits for the maintenance and replacement of heating boilers, solar water heating, installation of photovoltaic panels or installations to produce geothermal energy, etc.).
• For transport, measures to limit the growth of road traffi c, develop other means of transport and reduce energy use in the transport sector; energy consumption from transport has not declined in the past 12 years.
The Belgian NEEAP lacks clear sectorial targets and an overall target for the mid and long terms.15 In the NEEAP, each region has committed itself to reach a 9% energy saving target by 2020, as part of the Energy Effi ciency Directive (EED) framework. The Flemish region expects the highest savings: it is targeting a 13.9% saving by 2016 (compared to the reference scenario). For its part, Wallonia expects to save 7.9%, which will put it short of meeting the EED target. Brussels is likely to reach its 10% energy savings target in 2016.
With fi nal energy consumption remaining stable between 2005 and 2012, it is not clear whether Belgium will be able to reach its 2020 energy effi ciency target.
Renewable energy targetsBelgium’s renewable energy targets aim at reaching a 13% renewables share of fi nal energy consumption by 2020. In 2012, renewables accounted for 6.8% of fi nal energy consumption, compared to 2.5% in 2005. This means Belgium has achieved nearly half of its target.
28
30
32
34
36
38
2020201220102005
Figure 11. Renewable energy share of final energy use (2012)16
Final Energy Consumption (Mtoe) Share of Renewables (%)
0
5
10
15
7 51Energy market reform in Europe

To start a new section, hold down the apple+shift keys and click
to release this object and type the section title in the box below.
To start a new section, hold down the apple+shift keys and click
to release this object and type the section title in the box below.
17 EEA: Renewable Energy Projections as Published in the National Renewable Energy Action Plans of the European Member States
18 National renewable energy action plan, November 2010: http://www.buildup.eu/sites/default/fi les/content/national_renewable_energy_action_plan_belgium_en.pdf
Renewable energy: 51% of Belgium’s target has yet to be achieved. Belgium could have diffi culties reaching its 2020 targets.Belgium is currently generating 6.8% of its fi nal energy consumption from renewables. New capacities will come mainly from wind and, to a lesser degree, biomass. Diffi culty maintaining this momentum could impede the country’s ability to reach its energy effi ciency targets unless more ambitious measures are implemented in the next few years.
Figure 12. Renewable energy share of final energy use by type, in 2005 and 2010, and target for 2020, in %17
0%
2%
4%
6%
8%
10%
12%
14%
TotalBiofuelsOtherheating sectors
Heatpumps
Solidbiomass
Otherelectricity sectors
WindHydro
2005 2010 2020
Targeted capacity in 2020 is 8,255 MW of renewable capacities for electricity production, 2,588 ktoe for heating and cooling, and 886 ktoe for the transport sector.18
To promote renewable use in the power sector, Belgium implemented a system of green certifi cates (allocated to production from renewable sources). These certifi cates can be traded on a dedicated market. Electricity sellers must present green certifi cates to meet their requirement. They are required to have a share of their sold electricity produced from renewables; a minimum price is guaranteed by the regulator.
In addition to this green certifi cate scheme, Belgium has prepared a roadmap that includes fi nancial incentives, as well as regulatory and non-binding measures related to the following strategic areas:
• Offshore wind generation (reserved zone for offshore winds parks, contribution to cabling costs, etc.).
• Heating and cooling (CHP certifi cates, support mechanism for green heating).
• Promotion of investments in renewable energy (tax reduction for investments on ENR for companies and individuals, etc.).
• Promotion of biofuels (mandatory blending of sustainable biofuels, tax exempt quotas for sustainable biofuels, etc.).18
852
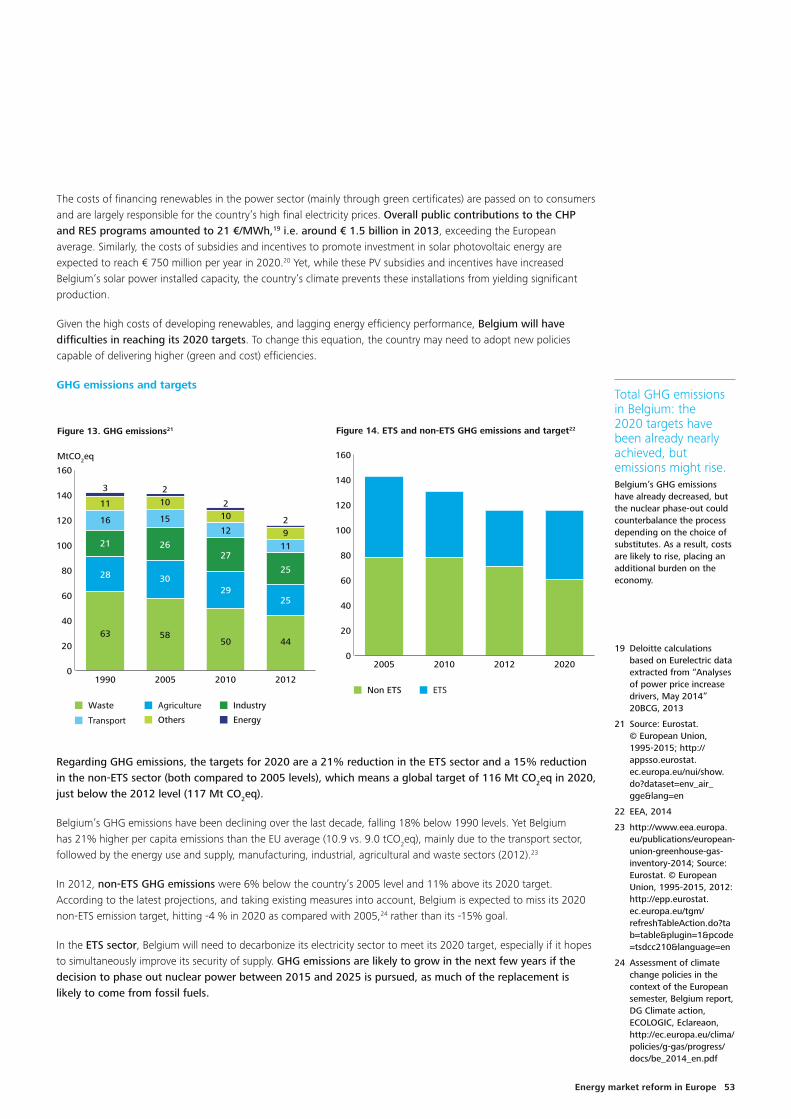
To start a new section, hold down the apple+shift keys and click
to release this object and type the section title in the box below.
19 Deloitte calculations based on Eurelectric data extracted from “Analyses of power price increase drivers, May 2014” 20BCG, 2013
21 Source: Eurostat. © European Union, 1995-2015; http://appsso.eurostat.ec.europa.eu/nui/show.do?dataset=env_air_gge&lang=en
22 EEA, 2014
23 http://www.eea.europa.eu/publications/european-union-greenhouse-gas-inventory-2014; Source: Eurostat. © European Union, 1995-2015, 2012: http://epp.eurostat.ec.europa.eu/tgm/refreshTableAction.do?tab=table&plugin=1&pcode=tsdcc210&language=en
24 Assessment of climate change policies in the context of the European semester, Belgium report, DG Climate action, ECOLOGIC, Eclareaon, http://ec.europa.eu/clima/policies/g-gas/progress/docs/be_2014_en.pdf
The costs of fi nancing renewables in the power sector (mainly through green certifi cates) are passed on to consumers and are largely responsible for the country’s high fi nal electricity prices. Overall public contributions to the CHP and RES programs amounted to 21 €/MWh,19 i.e. around € 1.5 billion in 2013, exceeding the European average. Similarly, the costs of subsidies and incentives to promote investment in solar photovoltaic energy are expected to reach € 750 million per year in 2020.20 Yet, while these PV subsidies and incentives have increased Belgium’s solar power installed capacity, the country’s climate prevents these installations from yielding signifi cant production.
Given the high costs of developing renewables, and lagging energy effi ciency performance, Belgium will have diffi culties in reaching its 2020 targets. To change this equation, the country may need to adopt new policies capable of delivering higher (green and cost) effi ciencies.
GHG emissions and targets
MtCO2eq
Figure 13. GHG emissions21
Waste Agriculture Industry
Transport Others Energy
0
20
40
60
80
100
120
140
160
2012201020051990
63
16
3
11
28
21
58
15
210
30
26
50
12
210
29
27
44
11
29
25
25
Figure 14. ETS and non-ETS GHG emissions and target22
Non ETS ETS
0
20
40
60
80
100
120
140
160
2020201220102005
Regarding GHG emissions, the targets for 2020 are a 21% reduction in the ETS sector and a 15% reduction in the non-ETS sector (both compared to 2005 levels), which means a global target of 116 Mt CO2eq in 2020, just below the 2012 level (117 Mt CO2eq).
Belgium’s GHG emissions have been declining over the last decade, falling 18% below 1990 levels. Yet Belgium has 21% higher per capita emissions than the EU average (10.9 vs. 9.0 tCO2eq), mainly due to the transport sector, followed by the energy use and supply, manufacturing, industrial, agricultural and waste sectors (2012).23
In 2012, non-ETS GHG emissions were 6% below the country’s 2005 level and 11% above its 2020 target. According to the latest projections, and taking existing measures into account, Belgium is expected to miss its 2020 non-ETS emission target, hitting -4 % in 2020 as compared with 2005,24 rather than its -15% goal.
In the ETS sector, Belgium will need to decarbonize its electricity sector to meet its 2020 target, especially if it hopes to simultaneously improve its security of supply. GHG emissions are likely to grow in the next few years if the decision to phase out nuclear power between 2015 and 2025 is pursued, as much of the replacement is likely to come from fossil fuels.
Total GHG emissions in Belgium: the 2020 targets have been already nearly achieved, but emissions might rise.Belgium’s GHG emissions have already decreased, but the nuclear phase-out could counterbalance the process depending on the choice of substitutes. As a result, costs are likely to rise, placing an additional burden on the economy.
9 53Energy market reform in Europe

To start a new section, hold down the apple+shift keys and click
to release this object and type the section title in the box below.
To start a new section, hold down the apple+shift keys and click
to release this object and type the section title in the box below.
Belgium is highly dependent on others.Belgium is dependent on imports of fossil fuels and will probably need to increase dependency on gas; it is a net importer of electricity and has high electricity prices that can affect the country’s competitiveness.
Belgium has an ambitious policy to develop a strong share of renewables towards 2050.The country has put in place a system of green certifi cates, adopted legislation to prioritize access to the grid for electricity from renewables, and introduced subsidies and incentives for investment in renewable power. However, the costs of these measures are being passed on to fi nal consumers.
More signifi cantly, Belgium’s climate is not ideal for the development of photovoltaic energy.
Phasing out of nuclear plants could threaten GHG emission targets and raise costs.The currently planned withdrawal from nuclear, if maintained, involves risks for energy security, industry competitiveness and affordable energy costs to consumers.
Road ahead and main challenges: the way to 2030 and beyond
Belgium energy dependency challenges Since the closure of its last coal mine in 1992, Belgium is 100% dependent on imports for its consumption of fossil fuels, which constitute around 70% of its gross inland energy consumption. With the exception of 2009, Belgium has also been a (growing) net importer of electricity. In the wake of its decision to close all of its nuclear capacity between 2015 and 2025, Belgium needs to clarify its long-term energy policy and decide on its future energy mix, taking into account security of supply, competitiveness and environmental objectives. A substantial increase in natural gas imports will keep Belgium strongly reliant on imported fossil fuel. Also, Belgium’s energy market is characterized by high electricity prices which, coupled with high labor costs, infl uences the competitiveness of the country in general and its industry in particular.
Proactive policy on renewables energy impacting retail pricesRenewables have been developed signifi cantly in Belgium since 2000, reaching a generation capacity of 6.5 GW (corresponding to 34% of total capacity in 2012). Nevertheless, their global production still represents a modest 6% of gross inland consumption. The variable and intermittent nature of renewable energy sources requires electricity systems to be more fl exible. Elia, Belgium’s transmission system operator, has grid projects ongoing to connect renewables to a larger market to ensure their availability.
Progress in developing renewables has been made at substantial cost. Over the short-term, this might result in a substantial increase in gas imports and use. Notably, this would hamper Belgium’s ability to meet the climate change targets established for the country by the EU, in particular for CO2 emissions.
For 2030, Belgium aims to reach 10 GW of installed capacity from renewables. However, the proactive Belgian policy to promote renewables might encounter problems: the initiatives of the country’s three regions, in addition to the federal government, have led to a fragmented market for green certifi cates.
Biomass and onshore and offshore wind seem to have the highest development potential among renewable energies due to Belgium’s geographic and climatic conditions, as well as its high population density. Also, it is not yet clear whether hydro and geothermal technology can be deployed on a large scale. This limited potential increases the overall costs and challenges associated with developing renewable energy.
The planned nuclear phase-out could increase dependency on gas consumption and increase costsBelgium is heavily dependent for its electricity on seven nuclear reactors still in operation, which generate about half of its domestic electricity production (40 TWh in 2012, 51% of the total 79 TWh production).25 However, current policy and regulatory decisions of the Belgian government are expected to gradually curb and bring the nuclear share of electricity production to zero within 11 years. The fi nal timing of the phase-out is as follows: of the seven Belgian reactors, two were expected to close in 2015, one in 2022, one in 2023 and three in 2025; but the Belgian government recently decided to extend by 10 years the two reactors initially scheduled for closure in 2015. In addition to the phasing-out decision, the annual federal tax on nuclear power generation, which in 2013 reached € 550 million, created an unfavorable fi nancial and technical environment for the nuclear industry. In 2014, the plants that had to close for technical reasons represented half of the country’s nuclear capacity. Given Belgium’s current low rates of electricity production capacity, such technical incidents could cause shortages of supply if imports cannot fi ll the gap, especially in the high demand peaks of the winter season. In its efforts to replace nuclear with gas-fuelled plants to ensure baseline electricity production, Belgium may also increase its dependence on gas import by up to 80% of future energy supply.26 That’s especially true when you consider that many of Belgium’s gas-fi red power plants and investment projects are currently under water due to the negative spark spread situation. By forcing the country to increase its gas imports, this situation could have a signifi cant negative impact on Belgium’s trade defi cit and would be diffi cult to sustain over the long term, particularly amid concerns about the rising costs – and supply insecurity – for primary resources. Finally, replacement of nuclear with gas or coal is likely not compatible with the country’s CO2 targets, which aim for a 15% reduction from its 2005 level by 2020. In fact, a projected additional gas-fi red capacity of seven GW by 2030 would increase CO2 emissions by 60% over the 2013 level (+9 Mt CO2eq).27 To compensate, Belgium might have to purchase emission allowances from the ETS, with a further substantial cost-penalty, estimated up to € 2 billion. In essence, the currently-planned phase-out from nuclear in a relatively short period could raise signifi cant risks for the country’s energy security and industrial competitiveness, further push up energy costs to consumers and hinder Belgium’s ability to meet its climate change targets.
25 © OECD/IEA 2012 Energy Statistics, IEA Publishing. Licence: http://www.iea.org/t&c/
26 AMCHAM Belgium, Energy Security, http://www.amcham.be/policy/energy/energy-security
27 Boston Consulting Group, “Shaping a Vision for Belgium’s Power Landscape”, 2013
1054

To start a new section, hold down the apple+shift keys and click
to release this object and type the section title in the box below.
Risk of electricity shortages due to absence of cross-border capacity with Germany.Belgium is dependent on imports of fossil fuels and will probably need to increase dependency on gas; it is a net importer of electricity and has high electricity prices that can affect the country’s competitiveness.
Increasing dependency on gas imports is expected.Natural gas consumption is expected to increase substantially to make up for the lost generation capacity of Belgium’s nuclear plants, which may ultimately be replaced with gas-fi red ones.
Additionally, the Belgian government will have to attract investment to replace existing capacities by introducing strong incentives and articulating a long-term vision on energy policy.
Alternatively, the extension of the operational lifetime of nuclear plants from their current 40 years to 50 or 60 years could help limit price increases and maintain security of supply, but this option would have to be balanced with nuclear technology risks.
Crucial cross-border capacity at risk of shortageAs noted earlier, Belgium is a net importer of electricity, notably from France and the Netherlands. As there is currently little direct cross-border capacity with Germany, a project is in progress (the Alegro project) to connect Belgian and German electricity markets in order to reduce the risk of shortages in case of parallel peak demand in several countries. However, the project will only become operational in 2019. The situation is similar with the UK: interconnectors are missing and investment projects are under way.
Belgium’s gas transmission infrastructure is operated by a single company, Fluxys, and consists of 3,800 km of pipelines with fi ve compressor stations and 18 interconnection points. The Fluxys network ensures both the transport of natural gas for internal consumption and the transmission to gas markets in neighboring countries. An important gas hub is situated at Zeebrugge with a terminal for gas from Norway and an interconnector terminal for gas from and to the United Kingdom, in addition to the LNG terminal and regasifi cation plant. Zeebrugge is also one of the major spot markets for gas in Europe.
There is limited storage capacity for natural gas in Belgium,28 with a need to fi nd means to ensure the necessary fl exibility. Belgium is served by a crude oil pipeline originating in Rotterdam and arriving at Antwerp. Oil products have access to the Central European Pipeline System, which is a NATO pipeline network. Belgium has over 40 oil storage facilities, which are used both for industry’s operating needs and as strategic reserves. Nevertheless, Belgium does not fully comply with the obligation on strategic oil storage capacity established by EU legislation to maintain stocks of crude oil and/or petroleum products; for that reason the European Commission recently launched an infringement procedure against Belgium.
ConclusionThe coming years will be crucial for defi ning the energy future of Belgium. Belgium has been able to put in place an ambitious, proactive (although rather expensive) policy on renewables and has accepted demanding targets for greenhouse gases emissions (-15% by 2020 compared to 2005) and renewables. Subsidies and incentives for renewables have, however, contributed to comparatively high electricity prices for SME and industrial consumers.
Belgium has a complex internal institutional structure and its energy policy commitments are shared by the federal government and the country’s three regions. Although all three regions and the federal government have been active in the promotion of renewables, negative outcomes like the fragmentation of the green certifi cates market show the need to continue pushing for closer co-ordination between regional and federal levels to increase policy and regulatory effi ciency.
Dependency on imports, which has been at 100% for fossil fuels since 1992, has extended to electricity in recent years. It is unclear whether the planned closure of all nuclear plants by 2025 could be absorbed at affordable costs, ensuring security of supply and preserving industry competitiveness and the achievement of climate targets. The costs and carbon emission implications of increasing reliance on gas imports should be carefully assessed. Belgium’s emission path necessitates signifi cant improvement in energy effi ciencies. In the longer term, the 2050 perspective, the economics and the fi nancial practicability for Belgium of an all-renewables energy system deserves further analysis. Priority should be given to defi ning a robust long-term strategy for a low-carbon future, providing a stable and enabling framework for investments on one side, while guaranteeing competitive energy costs to all affected consumers on the other.
28 The main storage capacities are situated in Zeebrugge and Loenhout
11 55Energy market reform in Europe
Selected bibliographic references
© OECD/IEA 2009 Energy Policies of IEA Countries – Belgium 2009 Review, IEA Publishing. Licence: http://www.iea.org/t&c/, available at: http://www.iea.org/publications/freepublications/publication/energy-policies-of-iea-countries---belgium-2009-review.html
© OECD/IEA 2012, Energy Statistics, 2012; http://www.iea.org/publications/freepublications/publication/kwes.pdf
© OECD/IEA 2014 Energy Supply Security 2014, IEA Publishing. Licence: http://www.iea.org/t&c/, available at:http://www.iea.org/publications/freepublications/publication/energy-supply-security-the-emergency-response-of-iea-countries-2014.html © OECD/IEA 2014 Energy Policy Highlights, 2014, IEA Publishing. Licence: http://www.iea.org/t&c/, available at: http://www.iea.org/publications/freepublications/publication/energy_policy_highlights_2013.pdf
EEA, Annual European Union greenhouse gas inventory 1990–2012 and inventory report, 2014; http://www.eea.europa.eu//publications/european-union-greenhouse-gas-inventory-2014
Statistiques sur les changements climatiques et l’énergie; Source: Eurostat. © European Union, 1995-2015
Deloitte, Benchmarking study of electricity prices between Belgium and neighbouring countries, 2013, available at http://www.investinwallonia.be/wp-content/uploads/2013/10/1364380979Deloitte-Report_benchmarking_study_on_power_prices.pdf
Boston Consulting Group (BCG), Shaping a Vision for Belgium’s Power Landscape, 2013
Mc Kinsey & Co, Energy Effi ciency in Belgium, Pathways to World-Class, 2009; http://www.mckinsey.com/App_Media/Reports/Belux/Energy_effi ciency_in_Belgium_full_report.pdf
National Reform Program Belgium, April 2014; Source: http://ec.europa.eu. © European Union, 1995-2015, available at: http://ec.europa.eu/europe2020/pdf/csr2014/nrp2014_belgium_en.pdf
Vito/ICEDD/Federal Planning Bureau, Towards 100%renewable energy in Belgium by 2025, April 2013;http://www.plan.be/admin/uploaded/201212190938210.Backcasting_2050_FinalReport_12_12_12.pdf
Amcham Belgium, Priorities for a Prosperous Belgium,Energy Security, 2014; http://www.amcham.be/policy/energy/energy-security
Elia, Electricity interconnection project between Belgium and Germany, Press release, April 2013; http://www.elia.be/~/media/fi les/Elia/PressReleases/2013/EN/20130423-ALEGrO-EN.pdf
Ecologic Institute/Eclareon, Assessment of climate change policies in the context of the European Semester, Country Report: Belgium,2012; Source: http://ec.europa.eu. © European Union, 1995-2015, available at http://ec.europa.eu/clima/policies/g-gas/progress/docs/be_2013_en.pdf
VBO-Verbond van Belgische, Reaction to “Towards 100%renewable energy in Belgium by 2025”, 2013; avaimable at: http://vbo-feb.be/Global/Actiedomeinen/Energie%20-%20Mobiliteit%20-%20Milieu/Energie/Towards%20100%20renewable%20energy%20in%20Belgium%20by%202050%20-%20reactie%20van%20het%20VBO/1302%20Reaction%20FEB%20sur%20%c3%a9tude%20backcasting%20vfi n.pdf
SIA Partners, The Belgian Electricity market: overview, analysis of today’s issues and suggestions to fi x, available at: http://energy.sia-partners.com
Sondage sur les technologies nucléaires, TES, 2013; http://forumnucleaire.be/sites/default/fi les/sondage_nucleaire_2013_fr_fi nal_2.pdf
Essenscia – Belgian Federation for Chemistry and Life Sciences Industries, 2013; http://www.essenscia.be/Upload/Docs/WORLD%20CHAMPION%20VERSION%202013.pdf
1256

European energy market reformCountry profi le: France
57Energy market reform in Europe
Contents
Current situation 59
Energy consumption and trade balance 59
Power generation 60
Power market: main actors 61
Power prices 62
Targets for 2020 64
Energy efficiency targets 64
Renewable energy targets 65
CO2 emissions and targets 68
Road ahead and main challenges: the way to 2030 and beyond 69
Energy transition: definition of the future energy mix 69
Nuclear power 69
Renewables 70
Fossil fuels and peak power production 71
Impacts on transmission and supply/demand balances 71
Conclusion 71
Selected bibliographic references 72
58

To start a new section, hold down the apple+shift keys and click
to release this object and type the section title in the box below.
Current situation
Energy consumption and trade balanceIn 2012, France’s primary energy consumption (PEC)1 reached 259 Mtoe. More than 40% of gross energy consumed is derived from nuclear power. However, fossil fuels still play an important role: petroleum products make up 31% and natural gas totals 8% of the mix.
While nuclear makes up the highest share (42%) of primary energy consumption, France remains dependent on fossil fuel imports, mainly for transport.The energy sector represented 36% of primary energy consumption in 2012, a volume that has remained stable since 2000. Fossil fuel imports remain high and the French energy bill reached an historic high of € 69 bn in 2012.
1 The primary energy consumption value presented refer to ‘Gross inland energy consumption by fuel type’ in Eurostat (Data Table: tsdcc320)
2 Source: Eurostat. © European Union, 1995-2015
3 MEDDE – Chiffres clés de l’énergie, Edition 2013
Primary energy consumption increased by 15% from 1990 and 2000, and decreased by 2% between 2000 and 2012. This decrease was mainly due to the industrial (energy and non-energy uses) and services sectors.
• The energy sector represented 36% of primary energy consumption in 2012, and has remained stable in volume since 2000.
• The transport sector is the second highest consumer, accounting for 19% of primary energy consumption in 2012, which marked a 19% increase since 1990.
• The residential sector accounted for 16% of primary energy consumption in 2012 (stable between 2000 and 2012).
• The industrial sector accounted for 12% of consumption (19% decrease between 2000 and 2012).
Key fi gures: Population (2013):65.5 m cap.
GDP (2013): 2,059 bn €
GDP/capita (2013): 31,435 €
GDP/PEC (2012): 7.8 €/kgoe
PEC/capita (2012): 3.97 toe/cap.
Figure 1. Gross inland consumption in 2012 (259 Mtoe)2
8.0%
14.6%
41.8%
4.4%
30.7%
0.5%%
Solid fuels (incl. hard coal) Petroleum products
Natural gas Nuclear
Renewable energies Waste (non-renewable)
Figure 2. Primary energy consumption by sector (in Mtoe)3
Energy Sector Transports Residential
Industry Services Non-energyconsumptionAgriculture Others
0
100
200
300
201220001990
74
42
36
36
18
228 Mtoe
94
50
42
30
23
259 Mtoe
91
51
45
7
37
14
263 Mtoe
1 59Energy market reform in Europe

To start a new section, hold down the apple+shift keys and click
to release this object and type the section title in the box below.
To start a new section, hold down the apple+shift keys and click
to release this object and type the section title in the box below.
The country depends on imports of solid mineral fuels, crude oil products and natural gas. In 2012, the French energy bill reached a record high of € 69 bn (€ 55 bn from oil products and € 13.5 bn from natural gas), accounting for 13% of overall French imports and overtaking the country’s trade defi cit (€ 67.2 bn in 2012).4 Oil imports (crude and refi ned) reached 99.8 Mtoe and natural gas imports amounted to 39.9 Mtoe in 2012.
As far as power is concerned, France is generally a net exporter of large volumes of base-load electricity, but frequently imports peak electricity. In 2013, France exported 79 TWh globally and imported 32 TWh.
Power generation France has the second largest electricity generation capacity in the EU, and the second “least-carbonized” electricity generation mix after Sweden.
In 2013, nuclear energy accounted for 49% of the generation capacity mix (63 GW), but delivered 73% of the power (402 TWh). Renewable energy sources generated 19% of electricity production, but 74% came from hydro. Wind and solar represented an installed capacity of 8.1 GW and 4.3 GW, respectively, and generated 3% and 1% of overall electricity.
Nuclear is operated as base-load or mid-merit. Due to its large share in the electricity mix, France has been historically short of peak capacity.
4 MEDDE – Panorama énergies-climat, Edition 2013
5 RTE, Bilan électrique français 2013
A high preponderance of nuclear in power production and a very low share of renewables outside hydropower.
Figure 4. Electricity capacity – 128 GW (2013)5
8.1
1.5
4.3
25.4
8.86.3
63.1
10.5
Nuclear energy Coal Fuel oil
Gas Hydro Wind
PV Other renewables
RES: 39.3
Figure 5. Electricity production – 551 TWh (2013)5
16
6
5
20 5
76
20
404
Nuclear energy Coal Fuel oil
Gas Hydro Wind
PV Other renewables
RES: 103
Figure 3. Energy trade balance (Mtoe)2
1990 2000 2012
-100
-80
-60
-40
-20
0
20
ElectricityNatural gasCrude oil productsSolid mineral fuels
-12 -11 -11
-86 -90-81
-24
4 6 4
-34 -35
260
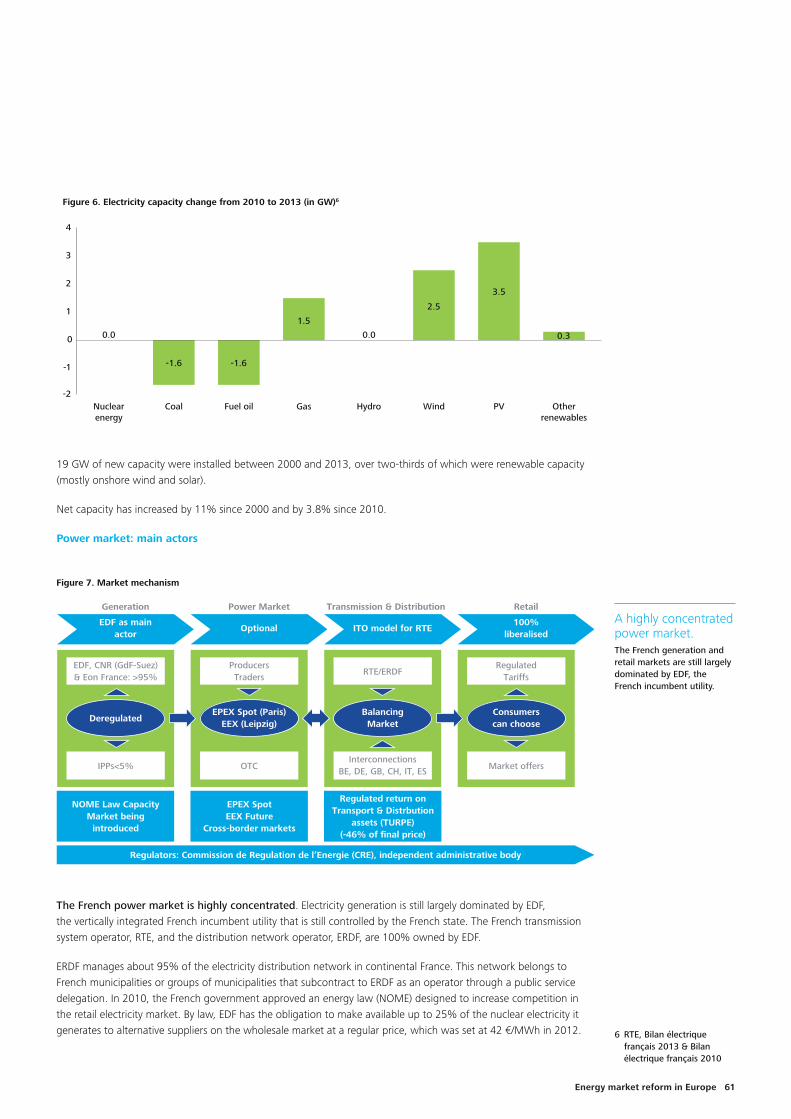
To start a new section, hold down the apple+shift keys and click
to release this object and type the section title in the box below.
19 GW of new capacity were installed between 2000 and 2013, over two-thirds of which were renewable capacity (mostly onshore wind and solar).
Net capacity has increased by 11% since 2000 and by 3.8% since 2010.
Power market: main actors
6 RTE, Bilan électrique français 2013 & Bilan électrique français 2010
A highly concentrated power market.The French generation and retail markets are still largely dominated by EDF, the French incumbent utility.
Figure 6. Electricity capacity change from 2010 to 2013 (in GW)6
-2
-1
0
1
2
3
4
Otherrenewables
PVWindHydroGasFuel oilCoalNuclearenergy
0.0
-1.6 -1.6
1.5
0.0
2.5
3.5
0.3
EDF as mainactor
Optional ITO model for RTE100%
liberalised
Generation
EDF, CNR (GdF-Suez)& Eon France: >95%
NOME Law CapacityMarket being
introduced
EPEX SpotEEX Future
Cross-border markets
Regulators: Commission de Regulation de l’Energie (CRE), independent administrative body
Regulated return onTransport & Distrbution
assets (TURPE)(-46% of final price)
IPPs<5%
ProducersTraders
Power Market Transmission & Distribution Retail
Figure 7. Market mechanism
DeregulatedEPEX Spot (Paris)
EEX (Leipzig)
OTC
RTE/ERDF
BalancingMarket
InterconnectionsBE, DE, GB, CH, IT, ES
Consumerscan choose
Market offers
RegulatedTariffs
The French power market is highly concentrated. Electricity generation is still largely dominated by EDF, the vertically integrated French incumbent utility that is still controlled by the French state. The French transmission system operator, RTE, and the distribution network operator, ERDF, are 100% owned by EDF.
ERDF manages about 95% of the electricity distribution network in continental France. This network belongs to French municipalities or groups of municipalities that subcontract to ERDF as an operator through a public service delegation. In 2010, the French government approved an energy law (NOME) designed to increase competition in the retail electricity market. By law, EDF has the obligation to make available up to 25% of the nuclear electricity it generates to alternative suppliers on the wholesale market at a regular price, which was set at 42 €/MWh in 2012.
3 61Energy market reform in Europe

To start a new section, hold down the apple+shift keys and click
to release this object and type the section title in the box below.
To start a new section, hold down the apple+shift keys and click
to release this object and type the section title in the box below.
Power pricesFrench market liberalization began in 1999 as industrial sites became eligible to choose their suppliers. This shift continued in 2004 for SMEs, and was completed in 2007 for residential customers. Residential customers have the choice between contracts at regulated tariffs or contracts at market prices. For SMEs, regulated tariffs will be abandoned from mid-2014 through the end of 2015. This should increase competition among retailers and expand the range of commercial offers and available value-added services.
As at the end of 2012, the incumbent EDF still dominated the market, with a market share of roughly 80%, leaving the remaining share to alternative market suppliers.
In 2012, 64% of electricity was sold at regulated prices.
Rising power prices.Power prices are not completely deregulated (producers other than EDF pay a regulated access price for nuclear electricity, while residential users and SMEs pay a regulated tariff).
Power prices have increased for both residential and industrial users, primarily as a result of network and tax charge increases. They are likely to rise further in the coming years due to the necessary evolution of the power production mix.
Figure 8. Total retail market split per supplier and contract type in 2012 (TWh;%)
Source: CRE
279 TWh64%
70 TWh16%
79 TWh18%
9 TWh2%
Regulated EDF tariff supply
Regulated LDC tariff supply
Alternative market suppliers
EDF market supply
436 TWh in 2012
Retail prices for industrial users totalled 119 €/MWh in 2012, slightly below the European average (125 €/MWh).A 28% price increase between 2008 and 2012 was driven by tax increases (+67%), rising grid costs (+28%), and higher generation and supply costs (+17%).
Residential customer retail prices reached 139 €/MWh in 2012, which is signifi cantly lower than the European average (€ 200 in 2012). The 15% rise since 2008 was mainly driven by an increase in both taxes (+27%) and energy generation and supply components (+13%).
The development of renewable capacity is fi nanced through the CSPE, which is supported by EDF, and not entirely passed on to fi nal consumers.
462

To start a new section, hold down the apple+shift keys and click
to release this object and type the section title in the box below.
Industrial Residential
Figure 9. Retail prices for industrial and residential users (€/MWh)7
0
20
40
60
80
100
120
140
201220102008
12
41
40
93€13%
44%
43%
12
49
48
109€11%
45%
44%
20
48
51
119€
17%
40%
43%
0
20
40
60
80
100
120
140
201220102008
33
47
41
121€
27%
39%
34%
37
53
44
134€
28%
40%
32%
42
53
44
139€
30%
38%
32%
Grid Energy and supply Taxes Grid Energy and supply Taxes
The energy and supply component of the price is largely driven by the fact that nuclear power plants are amortized. Nonetheless, electricity prices are likely to increase in the coming years as investments are made to improve the grid, extend the useful life of nuclear power plants and upgrade their safety standards to post-Fukushima expectations (total cost is estimated to be € 62.5 bn between 2011 and 2025).8
7 CRE
8 Cours des Comptes, 2014
5 63Energy market reform in Europe

To start a new section, hold down the apple+shift keys and click
to release this object and type the section title in the box below.
To start a new section, hold down the apple+shift keys and click
to release this object and type the section title in the box below.
Targets for 2020
Energy and climate policies have been articulated in several laws and regulations over the last few years. In 2007, the “Grenelle de l’environnement” defi ned a framework for environmental regulation, including a non-binding roadmap to develop renewable energy.
After a consultation phase launched in the aftermath of the “Grenelle de l’environnement,” the National Climate Plan was adopted in 2011. It restated the “factor four” commitment (i.e. reducing French GHG emissions by a factor of four between 1990 and 2050), initially announced in 2003. It also set out several policies and measures to promote energy effi ciency (energy effi ciency in buildings information and eco-labeling), renewable energy (promotion of biofuels and heating from biomass) and reduction of GHG emissions (proposed carbon taxes, which were not ultimately adopted). The main targets regarding power and gas have been reiterated in the country’s regular Pluriannual Investment Plans.
In the fall of 2014, all these targets and measures were updated in a new energy transition law (see “Energy transition: defi nition of the future energy mix” below).
Energy effi ciency targets
20-20-20 EU targets for France: what is France committed to?• 20% energy savings
versus 2020 energy demand projections, i.e. primary energy consumption of 236 Mtoe in 2020 and 131 Mtoe for fi nal energy consumption in 2020
• 23% renewable energies in 2020 fi nal energy consumption
• -17% of total GHG emissions in 2020 versus 1990 levels
This target was restated later as:
– -21% for ETS – (emission trading scheme) related GHG emissions in 2020 vs. 2005
– -14% for non-ETS related GHG emissions in 2020 vs. 2005
France initially committed to a target of 20% energy savings compared to 2020 energy demand projections. According to the country’s latest National Energy Effi ciency Plan (24/04/2014), this would reduce fi nal energy consumption to 131 Mtoe in 2020 vs. 162 Mtoe in 2005 and 154 Mtoe in 2012.10 To meet this target, France would need to reduce its fi nal energy demand by 23 Mtoe by 2020, compared to 2012. Yet, between 2005 and 2012, France only realized 26% of its energy effi ciency target.
The fi rst priority is to reduce fi nal energy consumption in buildings (44% in 2012 fi nal energy consumption). Since the mid-2000s, fi nal energy consumption in buildings has been relatively stable at around 68-69 Mtoe. Different policy measures have been adopted:
• For existing buildings, the objective is to retrofi t 500,000 households each year. To this end, various measures (low interest loans, tax credits, etc.) were implemented. To date, however, France has not come close to hitting its retrofi t targets (145,000 retrofi ts in 2012 and 160,000 in 2013). These measures are expected to reduce fi nal energy consumption by 4.4 Mtoe.
• New buildings have to comply with a limit of 50 kWh/m2/year (from 2011-2013). This measure is expected to reduce fi nal energy consumption by 1.2 Mtoe.
9 MEDDE – Panorama énergies-climat, Edition 2013
10 Source: http://ec.europa.eu. © European Union, 1995-2015
Figure 10. Final energy consumption (Mtoe)9
0
50
100
150
200
20202012201020051990
141162 155 154 131
Figure 11. Final energy consumption in 2012, per sector(Mtoe)
Total: 154 Mtoe
69
32
4
49
Residential Transport Industry
Agriculture
664

To start a new section, hold down the apple+shift keys and click
to release this object and type the section title in the box below.
Energy effi ciency: in 2012, 74% of France’s target was yet to be achieved.It is diffi cult to see how France can meet its energy effi ciency commitment, other than by issuing additional policy objectives for buildings or resurrecting the cogeneration industry.
For transport (32% in 2012 fi nal energy consumption), the energy effi ciency of vehicles is promoted:
• The European regulation on GHG emissions per km for new vehicles and the French system of bonus/malus are powerful drivers to increase the energy effi ciency of private cars. Between 2007 and 2011, GHG emissions from new vehicles decreased from 149.3 to 127 gCO2/km. These measures are expected to reduce fi nal energy consumption by 2.2 Mtoe.
• For heavy duty vehicles, an environmental tax (“écotaxe”) was scheduled, but the government fi nally abandoned it in October 2014 in the wake of heavy protest.
Eco-design measures have also been implemented to increase the energy effi ciency of various products (e.g. phasing out traditional light bulbs, expected to reduce fi nal energy consumption by 0.8 Mtoe).
Moreover, at a cross-sector level, a white certifi cate scheme (“CEE”) was implemented in 2006. It refl ects the obligation of energy suppliers (electricity, gas, domestic fuel oil and heating sellers) to promote energy effi ciency to their customers (households, local authorities and professionals). This scheme is expected to reduce fi nal energy consumption by more than 9 Mtoe in 2020 (including some double counting with the above mentioned measures).
Yet, in 2012, France still needed to reduce its fi nal energy consumption by 23 Mtoe by 2020. This means that only 26% of its initial 2020 target has been realized so far.
Given this reality, it is diffi cult to see how France can meet its commitment, other than by issuing additional policy measures for building or driving new momentum in the CHP (combined heat and power) industry, which will still take time to become fully effi cient.
Renewable energy targetsFrance aims to have a 23% share of renewables of fi nal energy consumption in 2020, vs. 9.5% in 2005 and 13.4% in 2012.11 Between 2005 and 2012, France only realized 29% of its renewable target.
If this energy effi ciency target (131 Mtoe of fi nal energy consumption in 2020) is reached, 30 Mtoe of fi nal energy consumption should come from renewables in 2020, compared to 19.6 in 2011,12 This means an additional 11.4 Mtoe will still be needed by 2020.
11 Source: Eurostat. © European Union, 1995-2015
12 CGDD 2013
13 Source: http://ec.europa.eu. © European Union, 1995-2015
0
50
100
150
200
2020201220062000
Figure 12. Renewable energy share of final energy use (2012)13
Final Energy Consumption (Mtoe) Share of Renewables (%)
0%
5%
10%
15%
20%
25%
7 65Energy market reform in Europe
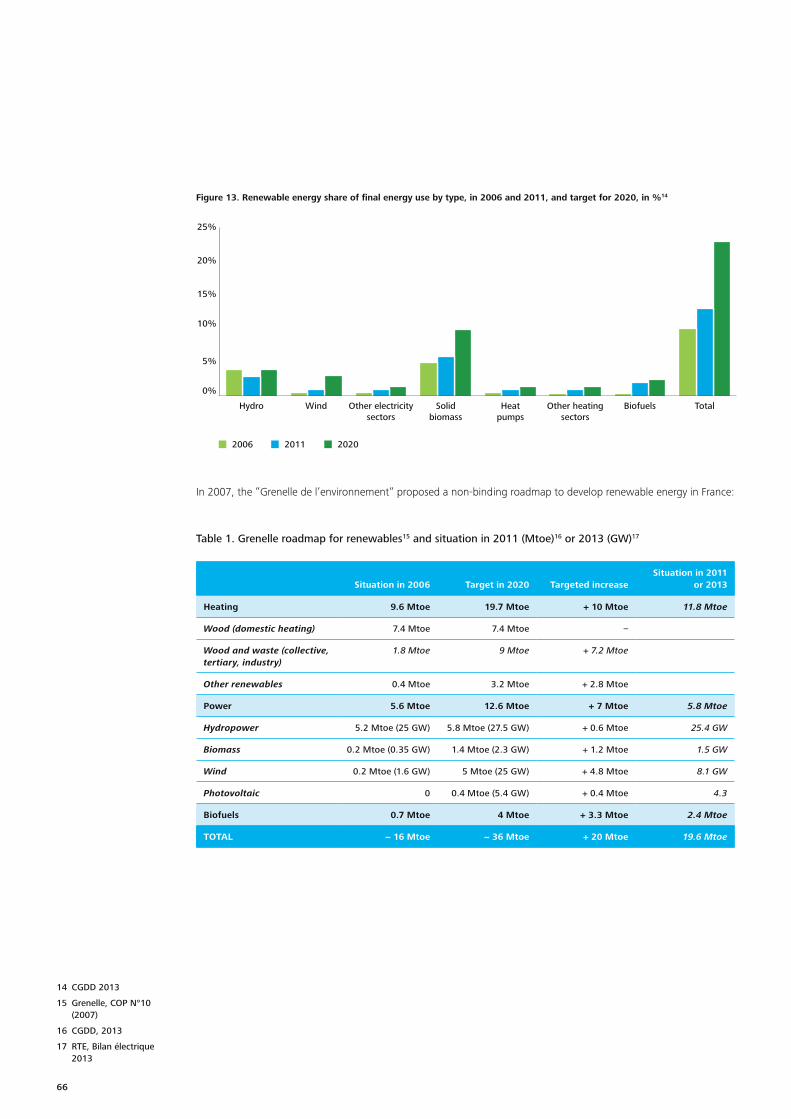
To start a new section, hold down the apple+shift keys and click
to release this object and type the section title in the box below.
To start a new section, hold down the apple+shift keys and click
to release this object and type the section title in the box below.
14 CGDD 2013
15 Grenelle, COP N°10 (2007)
16 CGDD, 2013
17 RTE, Bilan électrique 2013
Figure 13. Renewable energy share of final energy use by type, in 2006 and 2011, and target for 2020, in %14
0%
5%
10%
15%
20%
25%
TotalBiofuelsOther heatingsectors
Heatpumps
Solidbiomass
Other electricitysectors
WindHydro
2006 2011 2020
In 2007, the ”Grenelle de l’environnement” proposed a non-binding roadmap to develop renewable energy in France:
Table 1. Grenelle roadmap for renewables15 and situation in 2011 (Mtoe)16 or 2013 (GW)17
Situation in 2006 Target in 2020 Targeted increaseSituation in 2011
or 2013
Heating 9.6 Mtoe 19.7 Mtoe + 10 Mtoe 11.8 Mtoe
Wood (domestic heating) 7.4 Mtoe 7.4 Mtoe –
Wood and waste (collective, tertiary, industry)
1.8 Mtoe 9 Mtoe + 7.2 Mtoe
Other renewables 0.4 Mtoe 3.2 Mtoe + 2.8 Mtoe
Power 5.6 Mtoe 12.6 Mtoe + 7 Mtoe 5.8 Mtoe
Hydropower 5.2 Mtoe (25 GW) 5.8 Mtoe (27.5 GW) + 0.6 Mtoe 25.4 GW
Biomass 0.2 Mtoe (0.35 GW) 1.4 Mtoe (2.3 GW) + 1.2 Mtoe 1.5 GW
Wind 0.2 Mtoe (1.6 GW) 5 Mtoe (25 GW) + 4.8 Mtoe 8.1 GW
Photovoltaic 0 0.4 Mtoe (5.4 GW) + 0.4 Mtoe 4.3
Biofuels 0.7 Mtoe 4 Mtoe + 3.3 Mtoe 2.4 Mtoe
TOTAL ~ 16 Mtoe ~ 36 Mtoe + 20 Mtoe 19.6 Mtoe
866

To start a new section, hold down the apple+shift keys and click
to release this object and type the section title in the box below.
18 Ademe
19 It can be noted that in November 2014, the French company Neoen announced the construction of Europe’s largest photovoltaic solar park with a total combined output of 300 MW in the Bordeaux area. The park will be operational in October 2015 and is supposed to produce 350 gigawatt-hours yearly to a price of 105 €/MWh for 20 years (Neoen press release (05/11/2014), Reuters)
20 Conventional biofuels made from sugar, starch or vegetable oil
21 Advanced biofuels produced from non-edible biomass, i.e. lignocellulosic biomass or woody crops, agricultural residues or waste
Since then, targets have slightly changed (overall target of 30 Mtoe by 2020 instead of 36), but this roadmap still provides an interesting view of the main trends and potential targets.
• Heating (+10 Mtoe between 2006 and 2020): solid biomass for heating is already the most important renewable energy in terms of energy production, while heating is the sector in which the largest increase is targeted. A specifi c fund (“Fonds Chaleur”) was created to develop the generation of heat from renewable energy sources, and biomass in particular. This fund is the main driver of development of wood-energy in France for public housing, local authorities and all businesses (agriculture, industry and tertiary). Between 2009 and 2013, € 1.2 bn was spent to enable the development of approximately 1.1 Mtoe/year of renewable energy (which included 0.9 Mtoe from biomass).18 Money allocated to this fund is expected to reach € 400 M/year in 2017.
• Renewables in power production (+7 Mtoe between 2006 and 2020): hydropower capacity represented 74% of renewable electricity produced in 2012, with capacity remaining rather stable. Targeted increases to meet the country’s renewable objectives have been assigned mainly to wind (25.4 GW vs. 1.6 GW in 2020) and solar. Between 2006 and 2013, an additional 12.4 GW capacity from renewables was installed, which represents 37% of the targeted additional capacity to be installed between 2006 and 2020 (33.3 GW).19
The support for renewable electricity is mainly based on fi nancial subsidies to generation through a purchase tariff (feed-in tariff) that differs according to sector.
Table 2. 2014 feed-in tariffs (in c€/kWh) and contract duration (years)
Onshore wind Offshore wind Solar Geothermal Biomass (CHP)
Feed-in tariffs (cEUR/kWh) 2.8-8.2 3-13 7.17-27.94 20 + bonus 4.5 + bonus
Contract duration (years) 15 20 20 15 20
The biggest challenge ahead is for wind power, where less than 30% of the additional targeted capacity for 2020 has been installed so far (new capacity of 6.5 GW was installed between 2006 and 2013, vs. an initial target of 23.4 GW).
• Transport sector: biofuels have seen strong development since the mid-1990s. The production of biofuels is encouraged by a tax whose rate depends on the deviation from the biofuel incorporation target.
France set a target of a 7% (energy content) biofuel share in transportation fuel in 2010, which was almost achieved in 2012; biofuels represented 5.5% of the total fuels for transport consumption. But, since it is diffi cult to consume more fi rst generation biofuels,20 both for technical and political reasons, going further will depend mainly on the timeline of the industrial development of second generation biofuels.21
Between 2005 and 2012, France realized only 29% of its renewable energy target. An additional production of 11 Mtoe/year is still needed, which seems diffi cult to implement in eight years. The most likely way to meet the 23% target will come from:
• a large deployment of biomass for heating (target: +8 Mtoe between 2011 and 2020), provided that there is enough available biomass (until now, access to biomass has been a major hurdle to develop biomass for heating projects); and
• an increased development of wind power (both onshore and offshore) to fulfi l the targeted capacity in 2020: around 17 GW of new power capacity is targeted to be installed between 2013 and 2020 (out of the 23.4 GW targeted between 2006 and 2020).
Renewable target: in 2012, 71% of the target had yet to be achieved.The renewable energy target is very ambitious and seems diffi cult to reach, especially for heating and power.
The most likely way of meeting it would come from large-scale deployment of biomass for heating (subject to biomass availability) and from increased development of wind power.
9 67Energy market reform in Europe

To start a new section, hold down the apple+shift keys and click
to release this object and type the section title in the box below.
To start a new section, hold down the apple+shift keys and click
to release this object and type the section title in the box below.
22 EEA, 2014a
23 RMS, 2013
24 EEA, 2014b
25 MEDDE, 2013
CO2 emissions and targetsCO2 targets: France has already met 76% of its 2020 target.Until now, France has been a low GHG-emitting country, thanks to its high share of nuclear and hydro power.
The 2020 GHG emissions target seems reasonably attainable.
Reaching the target for the non-ETS sector depends mostly on the success of the energy effi ciency measures applied to buildings, products and private cars, and on the development of renewables.
In 2012, the 2020 target for the ETS sector had already been met.
0
100
200
300
400
500
600
2020 (t)201220102005
Figure 14. GHG emissions and targets (MtCO2eq)22
ETS Non-ETS ETS target Non-ETS target
• CO2 target: in the ETS sector, the target is to reduce GHG emissions by 21% between 2005 and 2020 (i.e. by 34 Mt CO2eq). In 2005, GHG emissions from the ETS sector amounted to 162 Mt CO2eq. In the non-ETS sector, the target is to reduce GHG emissions by 14% between 2005 and 2020 (i.e. by 55 Mt CO2eq).23 In 2005, GHG emissions from the non-ETS sector amounted to 396 Mt CO2eq.
Total GHG emissions amounted to 558 Mt CO2eq in 2005 and to 490 Mt CO2eq in 2012,22 while targeted total GHG emissions are 469 Mt CO2eq in 2020. This will require France to reduce its emissions by 89 Mt CO2eq between 2005 and 2020. By 2012, however, France had already achieved 76% of its initial target, leaving only 21 Mt CO2eq still to be abated before 2020.
• For the ETS sector, which essentially represents the power and heat generation industry, emissions had already decreased to 118 Mt CO2eq24 in 2012 (i.e. -44 Mt CO2eq versus a target of -34 Mt CO2eq in 2020). The 2020 target has already been surpassed, even if it is due more to the decrease of industrial activity in France (structural and cyclical, linked to the 2008 crisis) than it is to deep efforts by the industrial sector to reduce GHG emissions.
• For the non-ETS sector, emissions had already decreased to 372 Mt CO2eq24 in 2012 (i.e. -24 Mt CO2eq compared to a reduction target of 55 Mt CO2eq in 2020). Reaching the target largely depends on the success of the energy effi ciency measures applied to buildings (a reduction of more than eight Mt CO2eq is expected), products (a reduction of more than 4 Mt CO2eq is expected), private cars (-9 Mt CO2eq expected) and the development of renewables (more than 6 Mt CO2eq expected).25
With “only” 21 Mt CO2eq remaining to be abated as of 2012, or 24% of the initial target, France seems well on its way to meeting the EU target, even if a few additional measures may be necessary for the non-ETS sector.
1068

To start a new section, hold down the apple+shift keys and click
to release this object and type the section title in the box below.
Road ahead and main challenges: the way to 2030 and beyond
26 Based on fi gures from RTE (2014), Bilan électrique 2013
Energy transition: defi nition of the future energy mixFor many years, France has been relying on nuclear power and hydropower to reach low carbon intensity, and on hydropower to constitute a high share of renewables.
This situation, however, may no longer be sustainable, since serious political debate surrounds the future of nuclear energy. This likely means that nuclear capacity will decrease slightly by 2030, while hydropower capacity remains more or less stable.
France has implemented several policy measures to reach its targets regarding energy effi ciency, renewables and GHG emissions. But these measures may not be ambitious enough to reach the country’s targets, and their horizon does not go much further than 2020. Moreover, France set itself an ambitious target for 2050: to reduce its GHG emissions by a factor four, i.e. emit less than 140 Mt CO2eq by 2050. Meeting this target without building more nuclear or hydro capacity will be a serious challenge. As a result, France must fi nd new ways to increase its share of renewables and further decrease its carbon intensity.
In 2013, the French government launched a public debate on energy transition (DNTE), and its lower house of Parliament voted on the new law on October 14, 2014. In February 2015, debate was ongoing in both houses of Parliament. In its present form, this law includes the following provisions:
• Reducing nuclear energy production from 75% to 50% of the electricity mix by 2025.
• Increasing the share of renewables of fi nal energy consumption to 23% in 2020 and to 32% in 2030.
• Reducing primary energy consumption from fossil fuels by 30% by 2030, compared to 2012.
• Reducing GHG emissions by 40% by 2030 and dividing by four GHG emissions by 2050 (both compared to 1990 levels).
• Reducing energy consumption by 50% by 2050 (compared to 2012), with an intermediate goal of 20% in 2030.
Energy effi ciency measures for buildings, support for renewables and plans for a new transport infrastructure are also included in the law.
Nuclear powerMany questions with respect to nuclear power are currently being debated in France:
• The French government announced its willingness to decrease nuclear energy production from 75% to 50% of the electricity mix by 2025.
However it remains unclear how this target will be reached and what pathway the country will follow to replace this capacity in less than 10 years, considering the impact these reductions will have on the country’s energy competitiveness, security of supply and sustainability.
Additionally, it is not clear to what extent the French government is entitled to close nuclear power plants for energy policy reasons (rather than for economic or safety ones).
This decrease from 75% to 50% of electricity production represents around 140 TWh (based on 2013 power production), which is equivalent to fi ve times the power produced from non-hydropower renewables in 2013 or three times the power produced from fossil fuels in 2013.26 To reduce nuclear power production, while complying with renewable and GHG emission targets, the country will likely need to develop a larger share of renewable energy in power production.
11 69Energy market reform in Europe

To start a new section, hold down the apple+shift keys and click
to release this object and type the section title in the box below.
To start a new section, hold down the apple+shift keys and click
to release this object and type the section title in the box below.
27 Cours des Comptes, 2014
Fundamentally, the objective to make up for 140 TWh of lost nuclear power, replaced by a mix of renewable sources, assumes that a renewable capacity of around 70 GW of a mix of solar and wind needs to be fi nanced, developed and commissioned by 2025. A 140 TWh increase is much more signifi cant (at least more than twice higher) than what can be expected from reaching the renewable target for 2020. As such, other measures to support energy effi ciency and renewable energy are necessary to compensate for the decrease in nuclear power production by 2025.
Additionally, replacing nuclear power, typically used for base power production, with renewables, which are intrinsically intermittent, raises several questions about how to match spot power demand and supply.
• The useful life of a nuclear power plant is currently set at 40 years. This age will be reached between 2020 and 2035 by most of the French nuclear power plants. A decision has to be made about lifetime extensions. Lifetimes are likely to be extended by 10 or 20 years, mainly on economic grounds, since it is less expensive than building a new plant. In fact, according to Percebois and Mandil (2012), the average power cost could rise between 2010 and 2030 from 50 €/MWh to:
– 50-65 €/MWh if nuclear still represents 70% of the power capacity mix (with the extension of the useful life of existing nuclear power plants);
– 60-100 €/MWh if EPR (third generation nuclear reactors) nuclear power plants replace existing ones;
– 80-95 €/MWh if renewable energies are extensively developed.
• Even if the useful life of nuclear power plants is extended, the question of the replacement of actual nuclear power plants must be addressed by 2040. Will France build new generation nuclear power plants? Will it rely mostly on energy effi ciency and renewable energy (enhanced by all the technological progress realized by this date) to compensate for the progressive closure of its nuclear power plants?
• Civil and political opposition to nuclear power exists in France and was recently bolstered by the Fukushima disaster. While this opposition is not as vocal as it is in some other countries (e.g. Germany), it may still have an impact on future political decisions regarding nuclear power production in France in the coming years.
• Whichever option is chosen, the cost will be signifi cant. The necessary investments for the extension of nuclear plant useful life and those linked to the consequences of the Fukushima disaster are estimated at roughly € 62.5 bn between 2011 and 2025, and at € 30 bn between 2025 and 2033.27
RenewablesRenewable energy may seem to be a good candidate for the required capacity development in the short and mid-terms, but many questions are still pending:
• Hydropower is produced by some 400 hydropower plants with a total capacity of 25.5 GW under a concession regime, which is mainly operated by EDF.
Hydro concessions representing some 5.3 GW expire before 2015. For the fi rst time, concessions will then be submitted to competitive bids. However, terms and conditions are under discussion with the French government.
• Concerns about the availability and sustainability of biomass are growing. The biggest barriers for large biomass for heating projects are generally linked to the diffi culty of getting access to enough biomass. In fact, although French forests have a rather large potential of wood production, it is often diffi cult to mobilize. More generally, extending cultivation areas to produce more biomass for energy purposes raises the question of land use changes (LUC): more and more studies argue that using biomass for energy purposes is not as benefi cial for the climate as initially thought; it might even increase overall GHG emissions.
1270

To start a new section, hold down the apple+shift keys and click
to release this object and type the section title in the box below.
2030 and beyond: in search of a new paradigm.The whole energy paradigm is changing in France. In recent decades, this paradigm has been based on a power production mix dominated by nuclear energy and, to a lesser extent, by hydropower.
France has not yet defi ned its future energy mix.
It is now necessary to fi nd new ways to meet very ambitious energy effi ciency and GHG emission reduction targets amid stable (or decreasing) nuclear and hydropower capacity.
• The fi nancial support for renewable energy is already signifi cant and should rise in the coming years. In 2013, the Cour des comptes estimated the cost of public support for renewable energy. The part of the CSPE (renewable fi nancing support charge to be billed to consumers) used to support renewable energy amounted to € 1.4 billion in 2011 and should rise to € 2.2 billion in 2012, € 3 billion in 2013 and approximately € 8 billion in 2020.28 This means a global cost for the support of renewables in power production of around € 40.5 billion for the 2012-2020 period (which adds to the € 14.3 billion already allocated between 2006 and 2011). Other expenses also have to be taken into account, such as fi scal measures promoting biofuels, other budgetary subsidies for investment and public support, and public R&D. Moreover the CSPE level is not high enough to pass completely the cost of renewable development (among other components of the CSPE) on to customers. At the end of 2013, the tariff defi cit for the CSPE (the major part of it being due to the cost of renewable) amounted to € 5.1 billion,29 to which one must add € 0.7 billion of defi cit for the year 2014.30
Fossil fuels and peak power productionNuclear is mainly used for base-load power production and mid-merit. But new generation reactors, smaller and more fl exible, are also on their way. Renewable energies produce electricity in an intermittent way. So the question is how France will be able to meet its peak demand in the future. As of today, France is to a certain extent already relying on imports to offset demand. To ensure France has enough power capacity during cold winter days, a decree was signed in January 2015 implementing a national peak power capacity mechanism beginning in the winter of 2016-2017.
Peak power is usually produced from gas or coal. Power production from coal emits much more GHG than that from gas, but is currently less expensive.
Although some countries (mostly the United States for the time being) are developing shale gas to produce more gas and reduce their power production costs, France is very reluctant to exploit its (potential) shale gas resources. Until now, French law has banned geological surveys to estimate these reserves on the grounds that exploiting them could cause serious environmental damage.
Impacts on transmission and supply/demand balancesAll these evolutions will have deep impacts on the power transmission and distribution industry.
The metering, transmission and distribution of electricity is expected to evolve signifi cantly. Many energy effi ciency measures rely on a more effi cient way to consume energy, by measuring energy consumption more precisely or by optimizing energy transmission, among other measures. All this depends on the development of smart meters and smart grids. For instance, smart metering will be deployed between now and 2020. Three million power smart meters are expected to be installed between 2014 and 2016, with a remaining 32 million meters implemented from 2017 to 2020.
With the heightened role of independent power producers (IPP), decentralized production and renewable energy, the power system will move from a highly centralized (capital, production and network) to a more decentralized system. In such a context, smart grids and energy storage will be increasingly useful.
If nuclear capacity remains stable at 50% of power production after 2025, power production capacity from renewables increases and overall electricity demand falls (due to energy effi ciency policies, especially in buildings), there may be a risk of overcapacity of centralized base power production capacity, except in the case of increased demand for power in transport (due to the development of hybrid and electric vehicles).
ConclusionFrance is now at a crossroads. After having relied for several decades on a power production mix dominated by nuclear energy and, to a lesser extent, by hydropower, it is now necessary to fi nd new ways to meet very ambitious energy effi ciency and GHG emission reduction targets, when nuclear and hydropower capacities are either capped or on the decline.
The energy transition law, currently under discussion, sets the path for less nuclear and more renewables in the future electricity mix. Should France pursue this path, it will signifi cantly change the country’s energy landscape and raise questions about how to cost-effectively transition from a centralized to a decentralized system.
28 Cour des comptes, 2013
29 EDF, 2014
30 EDF, 2015
13 71Energy market reform in Europe
To start a new section, hold down the apple+shift keys and click
to release this object and type the section title in the box below.
To start a new section, hold down the apple+shift keys and click
to release this object and type the section title in the box below.
Selected bibliographic references
ADEME, review of the “Fond chaleur”: http://www.ademe.fr/fondschaleur/
CGDD (2013) – Chiffres clés des énergies renouvelables – Édition 2013
CGDD (2014) – Chiffres clés de l’énergie – Édition 2013
Cour des comptes (2014) – Le coût de production de l’électricité nucléaire – Actualisation 2014
Cour des comptes (2013) – La politique de développement des énergies renouvelables – juillet 2013
EDF (2014), Comptes consolidés 2013: http://fi nance.edf.com/fi chiers/fckeditor/Commun/Finance/Publications/Annee/2014/EDF2013_rapport_fi nancier_comptes_consolides_vf.pdf
EDF (2015), Communiqué de presse, 12 février 2015: http://medias.edf.com/fi chiers/fckeditor/Commun/Finance/Publications/Annee/2015/resultats_annuels/vf/CP_resultats_2014_20150212_vf.pdf
EEA (2014a) – Annual European Union greenhouse gas inventory 1990–2012 and inventory report 2014 – Submission to the UNFCCC Secretariat
EEA (2014b), Trends and projections in Europe 2014
Europe 2020 Targets [online], available at: http://epp.eurostat.ec.europa.eu/portal/page/portal/europe_2020_indicators/headline_indicators, Source: Eurostat. © European Union, 1995-2015
European Commission – Climate and energy priorities for Europe – the way forward. Presentation of J.M. Barroso on 20/21.03.2014, Source: http://ec.europa.eu. © European Union, 1995-2015
Source: http://ec.europa.eu. © European Union, 1995-2015, http://ec.europa.eu/clima/policies/2030/docs/climate_energy_priorities_en.pdf
European Commission Energy Country Factsheets 2012, Gross Inland Consumption by fuel (Primary Energy Consumption) in Mtoe for year 2010 [online] available at: http://ec.europa.eu/energy/observatory/countries/doc/2012-country-factsheets.pdf, Source: http://ec.europa.eu. © European Union, 1995-2015
European Commission Energy Country Factsheets 2012, Final Energy Consumption for year 200 & 2010 [online] on: http://ec.europa.eu/energy/observatory/countries/doc/2012-country-factsheets.pdf, Source: http://ec.europa.eu. © European Union, 1995-2015
Eurostat Tables and Graphs Final Energy consumption for year 2012 updated on 17.02.2014, Source: Eurostat. © European Union, 1995-2015
Eurostat Tables and Graphs Final Energy consumption for year 2012 updated on 17.02.2014, Source: Eurostat. © European Union, 1995-2015
Grenelle de l’environnement, comité opérationnel n° 10 (2007) – Plan de développement des énergies renouvelables à haute qualité environnementale (http://www.ladocumentationfrancaise.fr/var/storage/rapports-publics/084000523/0000.pdf)
Jacques Percebois & Claude Mandil (2012) : Rapport Energies 2050 http://www.strategie.gouv.fr/system/fi les/rapport-energies_0.pdf
Magritte Group: http://www.gdfsuez.com/wp-content/uploads/2014/03/press-kit-magritte-group-call-for-immediate-and-drastic-measures-to-safeguard-europe-s-energy-future-march-19th-2014.pdf.
MEDDE (2013) – Climate and energy effi ciency policies – Summary of France's undertakings and results
MEDDE – Chiffres clés de l’énergie, Edition 2013
1472

To start a new section, hold down the apple+shift keys and click
to release this object and type the section title in the box below.
MEDDE – Panorama énergies-climat, Edition 2013
NEA/OECD (2012): Nuclear Energy and Renewables – System Effect in Low-carbon Electricity Systems
RMS 2013 – Rapport de la France au titre du paragraphe 2 de l’article 3 de la décision n°280/2004/CE du Parlement européen et du conseil du 11/02/2014 – Actualisation 2013
RTE – Bilan électrique français 2013
Tarif Bleu Résidentiel, Rapport CRE Marché Détail 2013, 2012, et 2011
UFE : Loi de programmation pour la transition énergétique Pour une stratégie bas carbone, une renaissance industrielle dans une Europe plus solidaire. http://www.ufe-electricite.fr/IMG/pdf/projet_de_loi_vdef-2.pdf
Xerfi 700 – Le marché de l’électricité, Février 2014 / JPI / ADE
15 73Energy market reform in Europe

European energy market reformCountry profi le: Germany
74

European energy market reformCountry profi le: Germany
Contents
Current situation 76
Energy consumption and trade balance 76
Power generation 77
Power market: market mechanism and main actors 78
Power prices 80
Targets for 2020 82
Energy efficiency targets 82
Renewable energy targets 84
CO2 emissions and targets 86
Road ahead and main challenges: the way to 2030 and beyond 88
Energy turnaround (Energiewende) 88
Nuclear power 88
Renewables 88
Fossil fuels and peak power production 89
Infrastructure 89
Conclusion 90
Selected bibliographic references 91
75Energy market reform in Europe

To start a new section, hold down the apple+shift keys and click
to release this object and type the section title in the box below.
Current situation
Energy consumption and trade balanceGermany’s gross inland energy consumption1 stood at 319 Mtoe in 2012 and has experienced a steady downward trend over the last two decades: a decrease of 3.9% from 1990 to 2000, and of -7% from 2000 to 2012. More than 80% of consumption came from fossil fuels. Petroleum products constituted the lion’s share of the mix (108 Mtoe), followed by coal (80 Mtoe) and gas (70 Mtoe). Although the role of renewables is steadily increasing, their share remains relatively modest (10%).
Fossil fuels make up more than 80% of Germany’s gross inland energy consumption.The energy sector represented 27% of gross energy consumption in 2012; its volume decreased by 9.4% as compared to 2010.
1 The gross inland energy consumption is equal to the primary energy consumption plus the consumption of fossil fuels for non-energy purposes
2 Source: Eurostat. © European Union, 1995-2015
The energy sector made up 27% of gross consumption in 2012, equivalent to the year 2000. From 2000 to 2012, the decrease in energy consumption was mainly driven by the energy sector (-9.5%), transport (-8.9%), the residential sector (-11%) and non-energy related fossil fuel consumption (-22%).
Key fi gures: Population (2013): 80.5 million
GDP (2013): 2,737 bn €
GDP/capita (2013): 33,997 €
GDP/PEC (2012): 9.2 €/kgoe
PEC/capita (2012): 3.7 toe/cap.
Figure 1. Gross inland consumption in 2012 (319 Mtoe)2
12%
5%
35%
24%
1%
23%
Solid fuels (incl. hard coal) Petroleum products
Natural gas Nuclear
Renewable energies Waste (non-renewable)
Figure 2. Gross inland consumption by sector (in Mtoe)3
Energy Sector Transports Residential
Industry Services Non-energyconsumptionAgriculture Others
0
100
200
300
400
201220001990
108
60
63
20
72
29
356 Mtoe
86
61
21
58
61
33
319 Mtoe
95
67
27
65
7
58
26
342 Mtoe
1
To start a new section, hold down the apple+shift keys and click
to release this object and type the section title in the box below.
To start a new section, hold down the apple+shift keys and click
to release this object and type the section title in the box below.
Over the same period, energy consumption rose by 5% in the industrial sector and by 27% in the services sector.
In 2012, German net imports of oil, gas and coal reached a record high of € 93.5 billion3 (€ 68 billion for petroleum products, € 23 billion for gas, € 2.5 billion for coal), accounting for 10.2% of total imports4 for the year. Although Germany is the world’s largest miner of lignite, coal imports have been on the rise over the last two decades.
The same holds true for gas, where inland production decreased by 40% between 1990 and 2012 and imports increased by 80%.
Power generation With over 180 GW of installed capacity, Germany’s is the largest electricity market in Europe. Over the last decade, the German energy markets have experienced fundamental changes largely driven by the continuous expansion of renewables and the abrupt decision after the Fukushima accident in 2011 to phase out nuclear power by 2022, which has become one of the cornerstones of Germany’s energy market turnaround (Energiewende5).
3 www.bafa.de
4 www.destatis.de
5 The Energiewende is explained in more detail in the third chapter of this country profi le
6 RWE, BMWi
Germany depends heavily on fossil fuel imports.Germany’s net imports reached a record high of € 93.5 billion in 2012.
Coal and gas net imports continue to rise steadily, whereas net imports of petroleum products decreased between 2000 and 2012 (-16%).
44% of the country’s electricity production relies on coal, while one third stems from renewables.
Figure 3. Energy trade balance (Mtoe)2
1990 2000 2012
-150
-100
-50
0
50
Electrical energyGasTotal petroleum productsSolid fuels
-3 -22 -32
-122 -126-106
-420 0
1.8
-57 -60
Figure 4. Electricity capacity – 183 GW (2013)6
34
5 12 11
35
27
48
12
Nuclear energy Coal Fuel oil
Gas Hydro Wind
PV Other renewables
RES: 92
Figure 5. Net electricity production – 596 TWh (2013)6
53
62
6
65
30
26
263
92
Nuclear energy Coal Fuel oil
Gas Hydro Wind
PV Other renewables
RES: 171
Coal is the main source of fuel for electricity generation, and represented 44% (263 TWh) of generation output in 2013.
276

To start a new section, hold down the apple+shift keys and click
to release this object and type the section title in the box below.
Current situation
Energy consumption and trade balanceGermany’s gross inland energy consumption1 stood at 319 Mtoe in 2012 and has experienced a steady downward trend over the last two decades: a decrease of 3.9% from 1990 to 2000, and of -7% from 2000 to 2012. More than 80% of consumption came from fossil fuels. Petroleum products constituted the lion’s share of the mix (108 Mtoe), followed by coal (80 Mtoe) and gas (70 Mtoe). Although the role of renewables is steadily increasing, their share remains relatively modest (10%).
Fossil fuels make up more than 80% of Germany’s gross inland energy consumption.The energy sector represented 27% of gross energy consumption in 2012; its volume decreased by 9.4% as compared to 2010.
1 The gross inland energy consumption is equal to the primary energy consumption plus the consumption of fossil fuels for non-energy purposes
2 Source: Eurostat. © European Union, 1995-2015
The energy sector made up 27% of gross consumption in 2012, equivalent to the year 2000. From 2000 to 2012, the decrease in energy consumption was mainly driven by the energy sector (-9.5%), transport (-8.9%), the residential sector (-11%) and non-energy related fossil fuel consumption (-22%).
Key fi gures: Population (2013): 80.5 million
GDP (2013): 2,737 bn €
GDP/capita (2013): 33,997 €
GDP/PEC (2012): 9.2 €/kgoe
PEC/capita (2012): 3.7 toe/cap.
Figure 1. Gross inland consumption in 2012 (319 Mtoe)2
12%
5%
35%
24%
1%
23%
Solid fuels (incl. hard coal) Petroleum products
Natural gas Nuclear
Renewable energies Waste (non-renewable)
Figure 2. Gross inland consumption by sector (in Mtoe)3
Energy Sector Transports Residential
Industry Services Non-energyconsumptionAgriculture Others
0
100
200
300
400
201220001990
108
60
63
20
72
29
356 Mtoe
86
61
21
58
61
33
319 Mtoe
95
67
27
65
7
58
26
342 Mtoe
1
To start a new section, hold down the apple+shift keys and click
to release this object and type the section title in the box below.
To start a new section, hold down the apple+shift keys and click
to release this object and type the section title in the box below.
Over the same period, energy consumption rose by 5% in the industrial sector and by 27% in the services sector.
In 2012, German net imports of oil, gas and coal reached a record high of € 93.5 billion3 (€ 68 billion for petroleum products, € 23 billion for gas, € 2.5 billion for coal), accounting for 10.2% of total imports4 for the year. Although Germany is the world’s largest miner of lignite, coal imports have been on the rise over the last two decades.
The same holds true for gas, where inland production decreased by 40% between 1990 and 2012 and imports increased by 80%.
Power generation With over 180 GW of installed capacity, Germany’s is the largest electricity market in Europe. Over the last decade, the German energy markets have experienced fundamental changes largely driven by the continuous expansion of renewables and the abrupt decision after the Fukushima accident in 2011 to phase out nuclear power by 2022, which has become one of the cornerstones of Germany’s energy market turnaround (Energiewende5).
3 www.bafa.de
4 www.destatis.de
5 The Energiewende is explained in more detail in the third chapter of this country profi le
6 RWE, BMWi
Germany depends heavily on fossil fuel imports.Germany’s net imports reached a record high of € 93.5 billion in 2012.
Coal and gas net imports continue to rise steadily, whereas net imports of petroleum products decreased between 2000 and 2012 (-16%).
44% of the country’s electricity production relies on coal, while one third stems from renewables.
Figure 3. Energy trade balance (Mtoe)2
1990 2000 2012
-150
-100
-50
0
50
Electrical energyGasTotal petroleum productsSolid fuels
-3 -22 -32
-122 -126-106
-420 0
1.8
-57 -60
Figure 4. Electricity capacity – 183 GW (2013)6
34
5 12 11
35
27
48
12
Nuclear energy Coal Fuel oil
Gas Hydro Wind
PV Other renewables
RES: 92
Figure 5. Net electricity production – 596 TWh (2013)6
53
62
6
65
30
26
263
92
Nuclear energy Coal Fuel oil
Gas Hydro Wind
PV Other renewables
RES: 171
Coal is the main source of fuel for electricity generation, and represented 44% (263 TWh) of generation output in 2013.
2 77Energy market reform in Europe

To start a new section, hold down the apple+shift keys and click
to release this object and type the section title in the box below.
Renewable energy represented 50% of the total generation capacity, and 29% of electricity production. Nuclear still accounted for 7% of installed capacity, generating 15% of the electricity.6
From 2009 to 2012, Germany added 26.7 GW of generation capacity, most of which was driven by PV and wind. The immediate shutdown of eight nuclear reactors led to a sharp drop in nuclear capacity. Since peak capacities from renewables need to be balanced, coal and gas capacity increased over the last few years.
Power market: market mechanism and main actors
6 RWE, BMWi
7 Monitoring Report 2012 – Developments of the electricity and gas markets in Germany; calculations reproduced with information extracted from annual reports of the companies
Figure 6. Electricity capacity change from 2009 to 2012 (in GW)6
-15
-10
-5
0
5
10
15
20
25
Otherrenewables
PVWindHydroGasFuel oilCoalNuclearenergy
-8.8
2.6
-1.0
3.2 0.05.5
22.7
2.4
Figure 7. Market share of electricity generation (2012)7
29%
9%
27%
24%11%
E.ON
RWE
Vattenfall
EnBW
Other
Germany’s domestic electricity market was fully liberalized in 1998. Although there are currently over 800 individual providers, the majority of the country’s electricity is still generated by four big energy companies: E.ON, RWE, Vattenfall and EnBW.
Although shutting down the eight nuclear power plants reduced their generation capacities, the four companies still produced 73% of electricity in 2012.7
3
To start a new section, hold down the apple+shift keys and click
to release this object and type the section title in the box below.
To start a new section, hold down the apple+shift keys and click
to release this object and type the section title in the box below.
The German transmission system is the most important hub in the European electricity market. There are four TSOs (transmission system operators); one is still owned by a German energy utility, EnBW:
• Amprion GmbH operates the largest system in Germany (11,000 km) and was sold in 2011 by RWE to a consortium of fi nancial investors.
• TenneT operates 10,700 km. This grid was sold by E.ON in 2010 to the Dutch TSO.
• Elia (50Hertz Transmission GmbH) operates 9,750 km; the grid was purchased from Vattenfall by the Belgian TSO in 2011.
• TransnetBW GmbH operates 3,300 km and is still owned by EnBW.
Four players dominate the power market and four TSOs operate the grid.The German power market is liberalized, but dominated by four main players who account for 73% of electricity generation. The grid is operated by four TSOs who historically were owned by the four big energy generators. More than 900 DSOs currently operate in the country.
Four mainactors
Optional Four TSOs100%
liberalised
Generation
E.ON, RWE, Vattenfall,EnBW
German Energy Act(EnWG, 1998)
EPEX SpotEEX Future
Cross-border markets
Regulators: Federal Network Agency(Bundesnetzagentur), Federal Cartel Office (Bundeskartellamt),federal network authorities in the federal states
Regulated return onTransport &
Distribution assets(Price & Revenue Caps)
IPPs<23%
ProducersTraders
Power Market Transmission & Distribution Retail
Figure 8. Market mechanism
DeregulatedEPEX Spot (Paris)
EEX (Leipzig)
OTC
Tennet, Elia, Amprion,Transnet BW
BalancingMarket
Interconnection:AT, CZ, CH, FR, NL,
DK, PL, SE, LU
Consumerscan choose
Market offers
Figure 9. Geographical division of the transmission system by operator
478
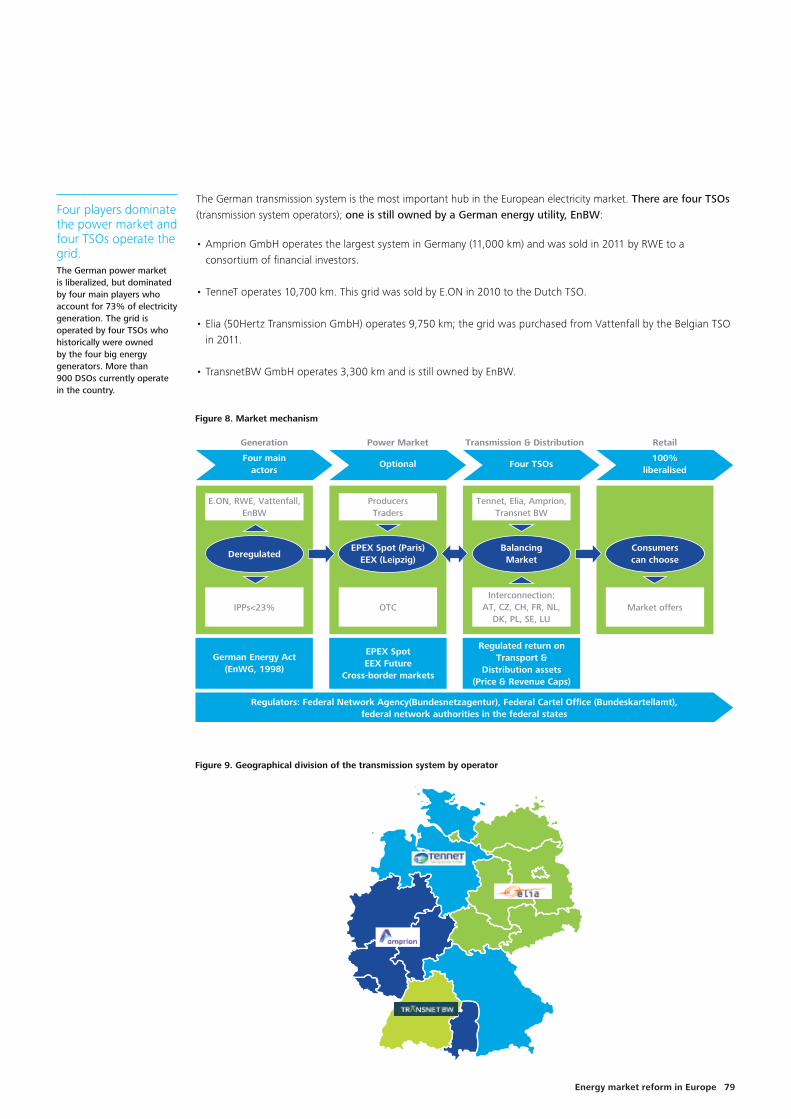
To start a new section, hold down the apple+shift keys and click
to release this object and type the section title in the box below.
Renewable energy represented 50% of the total generation capacity, and 29% of electricity production. Nuclear still accounted for 7% of installed capacity, generating 15% of the electricity.6
From 2009 to 2012, Germany added 26.7 GW of generation capacity, most of which was driven by PV and wind. The immediate shutdown of eight nuclear reactors led to a sharp drop in nuclear capacity. Since peak capacities from renewables need to be balanced, coal and gas capacity increased over the last few years.
Power market: market mechanism and main actors
6 RWE, BMWi
7 Monitoring Report 2012 – Developments of the electricity and gas markets in Germany; calculations reproduced with information extracted from annual reports of the companies
Figure 6. Electricity capacity change from 2009 to 2012 (in GW)6
-15
-10
-5
0
5
10
15
20
25
Otherrenewables
PVWindHydroGasFuel oilCoalNuclearenergy
-8.8
2.6
-1.0
3.2 0.05.5
22.7
2.4
Figure 7. Market share of electricity generation (2012)7
29%
9%
27%
24%11%
E.ON
RWE
Vattenfall
EnBW
Other
Germany’s domestic electricity market was fully liberalized in 1998. Although there are currently over 800 individual providers, the majority of the country’s electricity is still generated by four big energy companies: E.ON, RWE, Vattenfall and EnBW.
Although shutting down the eight nuclear power plants reduced their generation capacities, the four companies still produced 73% of electricity in 2012.7
3
To start a new section, hold down the apple+shift keys and click
to release this object and type the section title in the box below.
To start a new section, hold down the apple+shift keys and click
to release this object and type the section title in the box below.
The German transmission system is the most important hub in the European electricity market. There are four TSOs (transmission system operators); one is still owned by a German energy utility, EnBW:
• Amprion GmbH operates the largest system in Germany (11,000 km) and was sold in 2011 by RWE to a consortium of fi nancial investors.
• TenneT operates 10,700 km. This grid was sold by E.ON in 2010 to the Dutch TSO.
• Elia (50Hertz Transmission GmbH) operates 9,750 km; the grid was purchased from Vattenfall by the Belgian TSO in 2011.
• TransnetBW GmbH operates 3,300 km and is still owned by EnBW.
Four players dominate the power market and four TSOs operate the grid.The German power market is liberalized, but dominated by four main players who account for 73% of electricity generation. The grid is operated by four TSOs who historically were owned by the four big energy generators. More than 900 DSOs currently operate in the country.
Four mainactors
Optional Four TSOs100%
liberalised
Generation
E.ON, RWE, Vattenfall,EnBW
German Energy Act(EnWG, 1998)
EPEX SpotEEX Future
Cross-border markets
Regulators: Federal Network Agency(Bundesnetzagentur), Federal Cartel Office (Bundeskartellamt),federal network authorities in the federal states
Regulated return onTransport &
Distribution assets(Price & Revenue Caps)
IPPs<23%
ProducersTraders
Power Market Transmission & Distribution Retail
Figure 8. Market mechanism
DeregulatedEPEX Spot (Paris)
EEX (Leipzig)
OTC
Tennet, Elia, Amprion,Transnet BW
BalancingMarket
Interconnection:AT, CZ, CH, FR, NL,
DK, PL, SE, LU
Consumerscan choose
Market offers
Figure 9. Geographical division of the transmission system by operator
4 79Energy market reform in Europe

To start a new section, hold down the apple+shift keys and click
to release this object and type the section title in the box below.
High and increasing power prices.In 2014, the renewable energy sector was subsidized to the tune of approximately € 24 billion. Electricity prices have been rising over the last few years, mainly driven by the signifi cant expansion of renewable capacities. The lion’s share of the costs of renewables is borne by household consumers. German electricity prices are the second highest in Europe for residential users and the fourth highest for industrial users.
In 2013, more than 900 DSOs (distribution system operators) were operating in Germany. The distribution networks are often run by vertically integrated utilities, companies that own generation assets as well as supply and distribution businesses. The country’s four dominant companies hold shares in many of these DSOs.
Power pricesGermany has the second highest residential electricity prices in the EU-28 (after Denmark): 45% above the EU-28 average price.
Prices for industrial users are 21% above the EU-28 average, ranking fourth after Cyprus, Malta and Italy, although industrial users pay less than 50% of the residential tariff.
IndustrialResidential
Figure 10. Retail prices for residential and industrial users (€/MWh)8
0
100
200
300
400
2013201220102008
80
54
85
220€
39%
36%
25%
88
57
99
244€
41%
36%
23%
85
59
124
268€
46%
32%
22%
87
59
143
292€
49%
30%
21%0
50
100
150
200
2013201220102008
73
23
13108€
12%
67%
21%
67
24
28
119€
24%
56%
20%
63
25
42
130€
32%
48%
20%
61
30
54
144€
38%
42%
20%
Grid Energy and supply Taxes & surcharges Grid Energy and supply Taxes & surcharges
Electricity prices rose sharply between 2008 and 2013: +32% for residential users and +33% for industrial users.
While generation and distribution costs remained relatively fl at, the main driver of the signifi cant overall cost increases is linked to taxes and surcharges, which include subsidies to suppport renewable development (the so-called EEG surcharge, see next chapter).
In 2013, the EEG surcharge made up 36% of the tax burden and 18% of the overall electricity price, compared to only 5% in 2008. It has risen steadily from 11 €/MWh in 2008 to 62 €/MWh in 2014 (CAGR: 33.4%).
8 Source: Eurostat. © European Union, 1995-2015 (ten00117 – Residential: 2500 kWh < cons. < 5000 kWh; Industrial: 500 MWh < cons. < 2000 MWh)
5
To start a new section, hold down the apple+shift keys and click
to release this object and type the section title in the box below.
To start a new section, hold down the apple+shift keys and click
to release this object and type the section title in the box below.
9 BDEW
Although PV only generated approximately 17% of the renewable electricity in 2013, it accounted for 53% of the EEG costs, almost three times as much as wind (18%) and twice as much as biomass (26%).
0%
5%
10%
15%
20%
2013201220102008
Figure 11. EEG-surcharge9
5%
11
9%
20
14%
35
18%
52
Share of Price in % EEG (€/MWh)
0
20
40
60
80
100
Figure 12. Tax breakdown9
VAT Concession Levy ElectricityTaxEEG-Surcharge Other
0
20
40
60
80
100
120
140
160
180
20142013
46
18
20
52
7143
47
18
20
62
5152
680

To start a new section, hold down the apple+shift keys and click
to release this object and type the section title in the box below.
High and increasing power prices.In 2014, the renewable energy sector was subsidized to the tune of approximately € 24 billion. Electricity prices have been rising over the last few years, mainly driven by the signifi cant expansion of renewable capacities. The lion’s share of the costs of renewables is borne by household consumers. German electricity prices are the second highest in Europe for residential users and the fourth highest for industrial users.
In 2013, more than 900 DSOs (distribution system operators) were operating in Germany. The distribution networks are often run by vertically integrated utilities, companies that own generation assets as well as supply and distribution businesses. The country’s four dominant companies hold shares in many of these DSOs.
Power pricesGermany has the second highest residential electricity prices in the EU-28 (after Denmark): 45% above the EU-28 average price.
Prices for industrial users are 21% above the EU-28 average, ranking fourth after Cyprus, Malta and Italy, although industrial users pay less than 50% of the residential tariff.
IndustrialResidential
Figure 10. Retail prices for residential and industrial users (€/MWh)8
0
100
200
300
400
2013201220102008
80
54
85
220€
39%
36%
25%
88
57
99
244€
41%
36%
23%
85
59
124
268€
46%
32%
22%
87
59
143
292€
49%
30%
21%0
50
100
150
200
2013201220102008
73
23
13108€
12%
67%
21%
67
24
28
119€
24%
56%
20%
63
25
42
130€
32%
48%
20%
61
30
54
144€
38%
42%
20%
Grid Energy and supply Taxes & surcharges Grid Energy and supply Taxes & surcharges
Electricity prices rose sharply between 2008 and 2013: +32% for residential users and +33% for industrial users.
While generation and distribution costs remained relatively fl at, the main driver of the signifi cant overall cost increases is linked to taxes and surcharges, which include subsidies to suppport renewable development (the so-called EEG surcharge, see next chapter).
In 2013, the EEG surcharge made up 36% of the tax burden and 18% of the overall electricity price, compared to only 5% in 2008. It has risen steadily from 11 €/MWh in 2008 to 62 €/MWh in 2014 (CAGR: 33.4%).
8 Source: Eurostat. © European Union, 1995-2015 (ten00117 – Residential: 2500 kWh < cons. < 5000 kWh; Industrial: 500 MWh < cons. < 2000 MWh)
5
To start a new section, hold down the apple+shift keys and click
to release this object and type the section title in the box below.
To start a new section, hold down the apple+shift keys and click
to release this object and type the section title in the box below.
9 BDEW
Although PV only generated approximately 17% of the renewable electricity in 2013, it accounted for 53% of the EEG costs, almost three times as much as wind (18%) and twice as much as biomass (26%).
0%
5%
10%
15%
20%
2013201220102008
Figure 11. EEG-surcharge9
5%
11
9%
20
14%
35
18%
52
Share of Price in % EEG (€/MWh)
0
20
40
60
80
100
Figure 12. Tax breakdown9
VAT Concession Levy ElectricityTaxEEG-Surcharge Other
0
20
40
60
80
100
120
140
160
180
20142013
46
18
20
52
7143
47
18
20
62
5152
6 81Energy market reform in Europe

To start a new section, hold down the apple+shift keys and click
to release this object and type the section title in the box below.
Targets for 2020
In 2010 and 2011, the German government set energy and climate targets for 2020 and 2050 (2010 Energy Concept and 2011 Energy Package): 20-20-20 EU targets
for Germany: what is Germany committed to in 2020?• 20% reduction of primary
energy consumption compared to 2008 levels.
• 18% renewable energies in 2020 fi nal energy consumption and 35% renewable energies in electricity consumption in 2020.
• 40% reduction of GHG emissions in 2020 versus 1990 levels in total.
In 2011, after the Fukushima accident, the German government decided on a radical energy turnaround (Energiewende), phasing out nuclear power by 2022, although the 2010 Energy Concept initially intended to keep nuclear energy in the mix as a so-called “bridge transition technology.”
The Energy Package of 2011 contains six measures that build a framework for the energy turnaround:
• Accelerate the construction of the energy grid (NABEG).
• Redefi ne energy sector-related laws and ordinances (EnWGÄndG).
• Create an energy and climate fund (EKFG-ÄndG).
• Change the Atomic Energy Act (AtomG).
• Enforce climate-friendly development in cities and communities.
• Change the Atomic Energy Act (AtomG).
• Enforce climate-friendly development in cities and communities.
Energy effi ciency targetsGermany’s energy intensity has been decreasing over the last 20 years. While its GDP rose by 82% between 1990 and 2012, its primary energy consumption in 2012 had decreased by 5% compared to the 2008 level.
In June 2014, the federal government adopted the third National Energy Effi ciency Action Plan (NEEAP), with a primary energy consumption target of 277 Mtoe in 2020 (vs. 315 Mtoe in 2008 and 298 Mtoe in 2012), representing a decrease of 12% compared to 2008.
This target assumes a 1.1% annual GDP increase and an average annual increase of 2.1% in macroeconomic energy productivity from 2008 to 2020.
As of 2012, Germany still needed to decrease its primary energy consumption by 21 Mtoe before 2020. Notably, between 2008 and 2012, Germany realized 46% of its energy effi ciency target, and is consequently on track to reaching its 2020 targets.
10 BMWi
Table 1. Targets fi xed in the Energy Concept10
Targets 2020 2030 2040 2050
Energy effi ciency
Reduction of primary energy consumption (base year: 2008) 20% 50%
Reduction of electricity consumption (base year: 2008) 10% 25%
Reduction of fi nal energy consumption in the transport sector(base year: 2005)
10% 40%
Renewable energy
Share of renewable energies in electricity consumption 35% 50% 65% 80%
Share of renewable energies in total fi nal energy consumption 18% 30% 45% 60%
GHG Reduction in GHG emissions (base year: 1990) 40% 55% 70% 80%-95%
Energy effi ciency: so far, 54% of Germany’s target has yet to be accomplished.Germany’s primary energy consumption has been on a declining trend over the last 20 years. To reach its 2020 targets, it must still reduce consumption by 21 Mtoe (7% of its 2012 consumption).
Germany seems to be on track to reaching its 2020 targets. However, future success will strongly hinge on the effectiveness of its energy effi ciency policies, especially in the buildings sector.
7
To start a new section, hold down the apple+shift keys and click
to release this object and type the section title in the box below.
To start a new section, hold down the apple+shift keys and click
to release this object and type the section title in the box below.
11 Source: Eurostat. © European Union, 1995-2015
12 http://ec.europa.eu. © European Union, 1995-2015
Figure 13. Primary energy consumption (Mtoe) and 2020target11
0
50
100
150
200
250
300
350
2020201220112010200820051990
333 317 315 311295 298 277
Figure 14. GDP and PEC development11
Primary Energy Consumption (PEC)
Gross Domestic Product (GDP)
80
100
120
140
160
180
200
1991
1993
1995
1997
1999
2001
2003
2005
2007
2009
2011
182
90
According to the third NEEAP, the target for fi nal energy consumption was fi xed at 194.3 Mtoe in 2020. The buildings sector is a primary target for overall energy effi ciency improvement as it consumes almost 40% of Germany’s fi nal energy. In the 2010 Energy Concept, the target was to reduce heat demand by 20% and to have all new buildings become “climate-neutral” by 2020. By 2050, all existing buildings should be climate-neutral. Furthermore, primary energy demand in the building sector should be reduced by 80% by 2050. This will require a doubling of the renovation rate of buildings, from around 1% at the moment to 2% per year, accompanied by signifi cant investments. The recent update of the Energy Saving Ordinance (EnEV 2014) increased the energy effi ciency requirements for new and refurbished buildings by 25% from 2016. For its part, the Renewable Heating Act (2011) prescribes the integration of renewables or CMP for new and replaced heating systems.
The KfW, a government-owned development bank, provides loans and grants to refurbish old and new buildings to levels that exceed the minimum energy performance requirements set by the Energy Savings Ordinance (€10.4 bn in 2013). Between 2013 and 2020, the government has committed to increasing these yearly grants by an additional € 300 million.
Figure 15. Final energy consumption in 2012 and 2020 targets, by sector12
Final Energy consumption 2012: 213 Mtoe
27%
29%
29%
15%
Households Services Industry
Transport
Households Services Industry
Transport
Final Energy consumption 2020: 194 Mtoe
28%
28%
30%
14%
882

To start a new section, hold down the apple+shift keys and click
to release this object and type the section title in the box below.
Targets for 2020
In 2010 and 2011, the German government set energy and climate targets for 2020 and 2050 (2010 Energy Concept and 2011 Energy Package): 20-20-20 EU targets
for Germany: what is Germany committed to in 2020?• 20% reduction of primary
energy consumption compared to 2008 levels.
• 18% renewable energies in 2020 fi nal energy consumption and 35% renewable energies in electricity consumption in 2020.
• 40% reduction of GHG emissions in 2020 versus 1990 levels in total.
In 2011, after the Fukushima accident, the German government decided on a radical energy turnaround (Energiewende), phasing out nuclear power by 2022, although the 2010 Energy Concept initially intended to keep nuclear energy in the mix as a so-called “bridge transition technology.”
The Energy Package of 2011 contains six measures that build a framework for the energy turnaround:
• Accelerate the construction of the energy grid (NABEG).
• Redefi ne energy sector-related laws and ordinances (EnWGÄndG).
• Create an energy and climate fund (EKFG-ÄndG).
• Change the Atomic Energy Act (AtomG).
• Enforce climate-friendly development in cities and communities.
• Change the Atomic Energy Act (AtomG).
• Enforce climate-friendly development in cities and communities.
Energy effi ciency targetsGermany’s energy intensity has been decreasing over the last 20 years. While its GDP rose by 82% between 1990 and 2012, its primary energy consumption in 2012 had decreased by 5% compared to the 2008 level.
In June 2014, the federal government adopted the third National Energy Effi ciency Action Plan (NEEAP), with a primary energy consumption target of 277 Mtoe in 2020 (vs. 315 Mtoe in 2008 and 298 Mtoe in 2012), representing a decrease of 12% compared to 2008.
This target assumes a 1.1% annual GDP increase and an average annual increase of 2.1% in macroeconomic energy productivity from 2008 to 2020.
As of 2012, Germany still needed to decrease its primary energy consumption by 21 Mtoe before 2020. Notably, between 2008 and 2012, Germany realized 46% of its energy effi ciency target, and is consequently on track to reaching its 2020 targets.
10 BMWi
Table 1. Targets fi xed in the Energy Concept10
Targets 2020 2030 2040 2050
Energy effi ciency
Reduction of primary energy consumption (base year: 2008) 20% 50%
Reduction of electricity consumption (base year: 2008) 10% 25%
Reduction of fi nal energy consumption in the transport sector(base year: 2005)
10% 40%
Renewable energy
Share of renewable energies in electricity consumption 35% 50% 65% 80%
Share of renewable energies in total fi nal energy consumption 18% 30% 45% 60%
GHG Reduction in GHG emissions (base year: 1990) 40% 55% 70% 80%-95%
Energy effi ciency: so far, 54% of Germany’s target has yet to be accomplished.Germany’s primary energy consumption has been on a declining trend over the last 20 years. To reach its 2020 targets, it must still reduce consumption by 21 Mtoe (7% of its 2012 consumption).
Germany seems to be on track to reaching its 2020 targets. However, future success will strongly hinge on the effectiveness of its energy effi ciency policies, especially in the buildings sector.
7
To start a new section, hold down the apple+shift keys and click
to release this object and type the section title in the box below.
To start a new section, hold down the apple+shift keys and click
to release this object and type the section title in the box below.
11 Source: Eurostat. © European Union, 1995-2015
12 http://ec.europa.eu. © European Union, 1995-2015
Figure 13. Primary energy consumption (Mtoe) and 2020target11
0
50
100
150
200
250
300
350
2020201220112010200820051990
333 317 315 311295 298 277
Figure 14. GDP and PEC development11
Primary Energy Consumption (PEC)
Gross Domestic Product (GDP)
80
100
120
140
160
180
200
1991
1993
1995
1997
1999
2001
2003
2005
2007
2009
2011
182
90
According to the third NEEAP, the target for fi nal energy consumption was fi xed at 194.3 Mtoe in 2020. The buildings sector is a primary target for overall energy effi ciency improvement as it consumes almost 40% of Germany’s fi nal energy. In the 2010 Energy Concept, the target was to reduce heat demand by 20% and to have all new buildings become “climate-neutral” by 2020. By 2050, all existing buildings should be climate-neutral. Furthermore, primary energy demand in the building sector should be reduced by 80% by 2050. This will require a doubling of the renovation rate of buildings, from around 1% at the moment to 2% per year, accompanied by signifi cant investments. The recent update of the Energy Saving Ordinance (EnEV 2014) increased the energy effi ciency requirements for new and refurbished buildings by 25% from 2016. For its part, the Renewable Heating Act (2011) prescribes the integration of renewables or CMP for new and replaced heating systems.
The KfW, a government-owned development bank, provides loans and grants to refurbish old and new buildings to levels that exceed the minimum energy performance requirements set by the Energy Savings Ordinance (€10.4 bn in 2013). Between 2013 and 2020, the government has committed to increasing these yearly grants by an additional € 300 million.
Figure 15. Final energy consumption in 2012 and 2020 targets, by sector12
Final Energy consumption 2012: 213 Mtoe
27%
29%
29%
15%
Households Services Industry
Transport
Households Services Industry
Transport
Final Energy consumption 2020: 194 Mtoe
28%
28%
30%
14%
8 83Energy market reform in Europe

To start a new section, hold down the apple+shift keys and click
to release this object and type the section title in the box below.
13 Spitzenausgleich-Effi zien-zsystemverordnung (SpaEfV)
14 EEG 2014, for solar with monthly degression (actual Nov. 2014)
15 http://www.wiwo.de/politik/deutschland/trotz-reform-verbraucher-werden-2015-eine-milliarde-euro-mehr-eeg-umlage-bezahlen/9414526.html
16 BDEW (2014)
The transport sector accounts for around 30% of Germany’s fi nal energy consumption. Policies related to the energy effi ciency target mainly concern the technical improvement of vehicles. In its Energy Concept, the German government set a target to reduce fi nal energy consumption in the transport sector by 10% in 2020, as compared to 2005. However, as of 2012, only 5% of this reduction had been realized, leaving 95% still to be achieved.
Like the transport sector, the industrial sector accounts for almost one-third of the country’s fi nal energy consumption. The EU-ETS aims to incentivize energy-intensive industries and the electricity sector to reduce their emissions and consequently enhance overall energy effi ciency. The German Development Bank, KfW, introduced an Energy Effi ciency Program for SMEs in 2012, providing loans for private companies and self-employed persons to fi nance energy saving investments (up to € 25 million). SMEs with an annual energy bill of over € 5,000 can also apply for an energy audit provided by KfW. Furthermore, companies can receive investment grants to increase the energy effi ciency of their production processes. Another measure geared towards industry is the Surplus Settlement Effi ciency System Act (SpaEfV),13 which defi nes criteria to qualify for a partial refund of energy and electricity taxes, as well as for partial relief on EEG-surcharges in cases where specifi c energy effi ciency requirements are met.
Renewable energy targetsGermany’s renewable energy targets aim at reaching an 18% share in total fi nal energy consumption and a 35% share of electricity consumption by 2020.
An ambitious but costly policy to develop renewables in the power sector:Development of renewable energy has been subsidized with a price guarantee to renewable energy producers. The following table shows the feed-in tariffs and contract durations in 2014.
Table 2. 2014 feed-in tariffs (in c€/kWh) and contract durations (years)14
Onshore wind Offshore wind Solar Geothermal Biomass (CHP)
Feed-in tariffs (c€/kWh) 4.9-8.9 3.9-19.4 8.7-12.8 25.2 5.8-13.6
Contract duration (years) 20 20 20 20 20
The difference between the market price for electricity and the guaranteed price to producers for renewables is passed on to consumers (via the EEG surcharge), whose bills have been rising for years. Currently, the renewable energy sector is subsidized to the tune of approximately € 19.4 billion per year (€ 240 per resident in 201415).
In 2014, approximately 3,000 companies, accounting for around 107 TWh, or 18% of total electricity consumption, were fully or partially exempt from paying the EEG surcharge, meaning that a big share of the extra costs of renewables is being shouldered by households.16
Renewable energy: 66% of the country’s target has been achieved so far, although reaching the fi nal target remains uncertain.Germany currently generates 12% of its fi nal energy consumption and 23% of its electricity from renewables. These shares have been rising continuously in recent years. New capacities will stem mainly from wind and solar.
If current trends prevail, Germany will be well on its way to reaching its 2020 targets. However, recent changes in the EEG may slow down the future development of renewables, hindering the country’s ability to reach its targets.
Figure 16. Financing of the EEG surcharge, by sector16
35%
1%2%
31%
19%
12%
Households
Industry
Services
Transport
Agriculture
Public Sector
9
To start a new section, hold down the apple+shift keys and click
to release this object and type the section title in the box below.
To start a new section, hold down the apple+shift keys and click
to release this object and type the section title in the box below.
17 Source: Eurostat.© European Union, 1995-2015
Although the majority of Germany’s population is generally supportive of the Energiewende, rising pricing inequality has eroded popular support over the last four years.
In June 2014, the federal government revised the EEG to limit electricity price hikes. The new law set specifi c volume targets (so-called expansion corridors) for the annual increase of each renewable energy technology:
• Solar: annual increase of 2.5 GW.
• Onshore wind: annual increase of 2.5 GW.
• Biomass: annual increase of 100 MW.
• Offshore wind: 6.5 GW until 2020 and 15 GW until 2030.
If more new plants are built to support more than the projected capacity, the subsidy rates for additional plants will automatically be reduced (fl exible cap).
Additionally, to reduce the high surcharge, these reforms aim to spread the cost to more customers by reducing the number of exempt industrial customers and applying the surcharge to customers that generate their own power.
In October 2014, the German government announced that – for the fi rst time in its history – the EEG surcharge for residential and for non-relieved commercial and industrial customers would fall slightly in 2015, to 61.7 €/MWh, mainly resulting from a surplus of EEG-surcharges from 2013.
Where is Germany now regarding renewable energy?Between 2005 and 2012, Germany increased its share of renewables in fi nal energy consumption from 7% to 12%, and its share of renewables in gross electricity consumption from 10% to 23%. This means that 1/3 of the target still remains to be realized before 2020.
0
50
100
150
200
250
300
2020201220102005
Figure 17. Renewable energy share of final energy use (2012)17
Final Energy Consumption (Mtoe) Share of Renewables (%)
7%
219
11%
221
12%
213194
18%
0%
5%
10%
15%
20%
1084
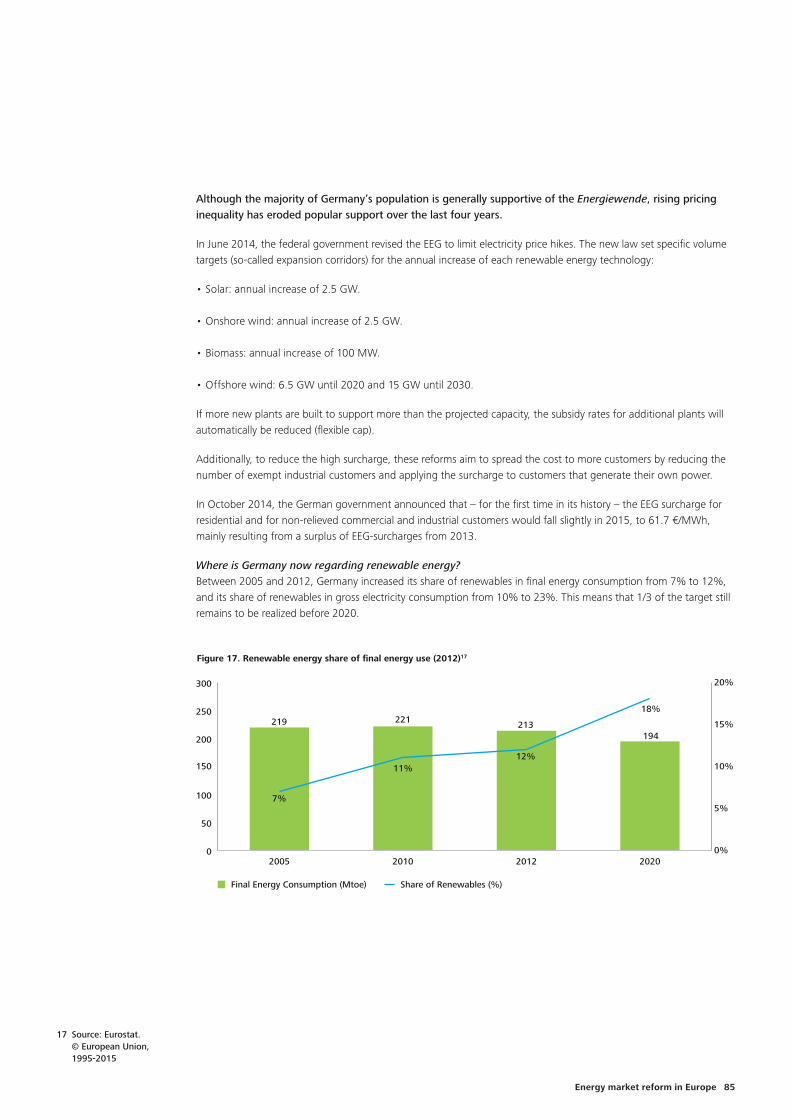
To start a new section, hold down the apple+shift keys and click
to release this object and type the section title in the box below.
13 Spitzenausgleich-Effi zien-zsystemverordnung (SpaEfV)
14 EEG 2014, for solar with monthly degression (actual Nov. 2014)
15 http://www.wiwo.de/politik/deutschland/trotz-reform-verbraucher-werden-2015-eine-milliarde-euro-mehr-eeg-umlage-bezahlen/9414526.html
16 BDEW (2014)
The transport sector accounts for around 30% of Germany’s fi nal energy consumption. Policies related to the energy effi ciency target mainly concern the technical improvement of vehicles. In its Energy Concept, the German government set a target to reduce fi nal energy consumption in the transport sector by 10% in 2020, as compared to 2005. However, as of 2012, only 5% of this reduction had been realized, leaving 95% still to be achieved.
Like the transport sector, the industrial sector accounts for almost one-third of the country’s fi nal energy consumption. The EU-ETS aims to incentivize energy-intensive industries and the electricity sector to reduce their emissions and consequently enhance overall energy effi ciency. The German Development Bank, KfW, introduced an Energy Effi ciency Program for SMEs in 2012, providing loans for private companies and self-employed persons to fi nance energy saving investments (up to € 25 million). SMEs with an annual energy bill of over € 5,000 can also apply for an energy audit provided by KfW. Furthermore, companies can receive investment grants to increase the energy effi ciency of their production processes. Another measure geared towards industry is the Surplus Settlement Effi ciency System Act (SpaEfV),13 which defi nes criteria to qualify for a partial refund of energy and electricity taxes, as well as for partial relief on EEG-surcharges in cases where specifi c energy effi ciency requirements are met.
Renewable energy targetsGermany’s renewable energy targets aim at reaching an 18% share in total fi nal energy consumption and a 35% share of electricity consumption by 2020.
An ambitious but costly policy to develop renewables in the power sector:Development of renewable energy has been subsidized with a price guarantee to renewable energy producers. The following table shows the feed-in tariffs and contract durations in 2014.
Table 2. 2014 feed-in tariffs (in c€/kWh) and contract durations (years)14
Onshore wind Offshore wind Solar Geothermal Biomass (CHP)
Feed-in tariffs (c€/kWh) 4.9-8.9 3.9-19.4 8.7-12.8 25.2 5.8-13.6
Contract duration (years) 20 20 20 20 20
The difference between the market price for electricity and the guaranteed price to producers for renewables is passed on to consumers (via the EEG surcharge), whose bills have been rising for years. Currently, the renewable energy sector is subsidized to the tune of approximately € 19.4 billion per year (€ 240 per resident in 201415).
In 2014, approximately 3,000 companies, accounting for around 107 TWh, or 18% of total electricity consumption, were fully or partially exempt from paying the EEG surcharge, meaning that a big share of the extra costs of renewables is being shouldered by households.16
Renewable energy: 66% of the country’s target has been achieved so far, although reaching the fi nal target remains uncertain.Germany currently generates 12% of its fi nal energy consumption and 23% of its electricity from renewables. These shares have been rising continuously in recent years. New capacities will stem mainly from wind and solar.
If current trends prevail, Germany will be well on its way to reaching its 2020 targets. However, recent changes in the EEG may slow down the future development of renewables, hindering the country’s ability to reach its targets.
Figure 16. Financing of the EEG surcharge, by sector16
35%
1%2%
31%
19%
12%
Households
Industry
Services
Transport
Agriculture
Public Sector
9
To start a new section, hold down the apple+shift keys and click
to release this object and type the section title in the box below.
To start a new section, hold down the apple+shift keys and click
to release this object and type the section title in the box below.
17 Source: Eurostat.© European Union, 1995-2015
Although the majority of Germany’s population is generally supportive of the Energiewende, rising pricing inequality has eroded popular support over the last four years.
In June 2014, the federal government revised the EEG to limit electricity price hikes. The new law set specifi c volume targets (so-called expansion corridors) for the annual increase of each renewable energy technology:
• Solar: annual increase of 2.5 GW.
• Onshore wind: annual increase of 2.5 GW.
• Biomass: annual increase of 100 MW.
• Offshore wind: 6.5 GW until 2020 and 15 GW until 2030.
If more new plants are built to support more than the projected capacity, the subsidy rates for additional plants will automatically be reduced (fl exible cap).
Additionally, to reduce the high surcharge, these reforms aim to spread the cost to more customers by reducing the number of exempt industrial customers and applying the surcharge to customers that generate their own power.
In October 2014, the German government announced that – for the fi rst time in its history – the EEG surcharge for residential and for non-relieved commercial and industrial customers would fall slightly in 2015, to 61.7 €/MWh, mainly resulting from a surplus of EEG-surcharges from 2013.
Where is Germany now regarding renewable energy?Between 2005 and 2012, Germany increased its share of renewables in fi nal energy consumption from 7% to 12%, and its share of renewables in gross electricity consumption from 10% to 23%. This means that 1/3 of the target still remains to be realized before 2020.
0
50
100
150
200
250
300
2020201220102005
Figure 17. Renewable energy share of final energy use (2012)17
Final Energy Consumption (Mtoe) Share of Renewables (%)
7%
219
11%
221
12%
213194
18%
0%
5%
10%
15%
20%
10 85Energy market reform in Europe

To start a new section, hold down the apple+shift keys and click
to release this object and type the section title in the box below.
18 Eurostat. © European Union, 1995-2015
19 http://www.umweltbundesamt.de/
Figure 18. Renewable energy share of final energy use by type, in 2005 and 2010, and target for 2020, in %18
0%
2%
4%
6%
8%
10%
12%
14%
16%
18%
20%
TotalBiofuelsOther heatingsectors
Heatpumps
Solidbiomass
Other electricitysectors
WindHydro
2005 2010 2020
The increasing share of renewables was mainly driven by new PV and wind capacities: PV capacities rose from 62 MW in 2000 to 34.7 GW in 2013 (CAGR: 63%), overtaking wind capacities. And wind capacities increased during the same time, from 5.8 GW to 34.4 GW (CAGR: 15%).
As can be inferred from Figure 18, the main sources of additional renewable energy capacities until 2020 are targeted to come from wind and other electricity sectors, mainly PV. Germany seems to be on track to reach its renewable energy targets.
However, with the EEG reforms of 2014, which reduced feed-in tariffs and introduced capacity caps, development is likely to slow down. Another impediment to the implementation of new capacities will be the speed with which the new electricity grid can bring energy from the windy north to the energy-hungry south in the face of both administrative barriers and local opposition.
To date, Germany has reached 66% of its renewable energy target. However, given changing policies around renewable power, its ability to reach its 2020 target remains uncertain.
CO2 emissions and targetsGermany is the largest CO2 emitter in Europe, accounting for roughly 20% of the overall EU-28 CO2 emissions in 2012. These emissions have been declining over the last two decades, falling 25% below 1990 levels. However, emissions regained momentum after the country’s decision to phase out nuclear power in 2011, and have increased over the last two years due to a higher share of coal (in particular lignite) in the electricity generation mix. Preliminary numbers suggest that in 2013 emissions further increased to 951 Mt CO2eq.19 These increases can mainly be attributed to the energy sector (+3%), the transport sector (+5%) and the residential sector (+3%).
11
To start a new section, hold down the apple+shift keys and click
to release this object and type the section title in the box below.
To start a new section, hold down the apple+shift keys and click
to release this object and type the section title in the box below.
20 EEA (2014)
21 VET-Bericht 2013, Treibhausgasemissionen der emissionshandel-spfl ichtigen stationären Anlagen in Deutschland im Jahr 2013, German Emissions Trading Authority (DEHSt) at the Federal Environment Agency
22 WWF (2014): According to a study published by environmental groups including WWF four of the fi ve most polluting coal power plants in Europe are situated in Germany
23 Aktionsprogramm Klimaschutz 2020
CO2 emissions: 62% of the target achieved, but emissions are on the rise.Germany cut its emissions by 25% relative to 1990, but has experienced increased CO2 emissions since the rapid shut down of eight nuclear plants in 2011. With its high dependence on coal and 11.5 GW of coal plants under construction, it is highly questionable if the remaining 38% of CO2 reductions can be met by 2020.
ETS emissions have been on the rise since 2009, a trend partly attributable to the country’s economic recovery. While future CO2 prices will certainly infl uence Germany’s GHG targets, further signifi cant efforts to reduce both ETS and non-ETS emissions will be required.
0
200
400
600
800
1,000
1,200
1,400
20202012201120051990
Figure 19. GHG emissions and targets20
Mt CO2
Energy Industry
2020 target
Transport
Residential Service Agriculture
Others
458
276
160
99
131
124
396
185
157
78
112
994
366
189
153
77
91
929
377
185
161
76
94
939
749
Figure 20. ETS and non-ETS emissions21
Non ETS ETS 2020 target
0
200
400
600
800
1,000
1,200
2020201220102005
Current Ministry of the Environment projections suggest that measures in place should lead to an overall emission reduction of 33% as compared to the 1990 level. Closing the gap to reach the 40% target would require additional savings of around 85 Mtoe of CO2eq, meaning that further action is necessary. Yet, if coal maintains or even increases its considerable share in the German energy mix,22 the Energiewende might impede the country’s ability to reach its 2020 targets.
To counteract this development, the government presented its fi rst cornerstones for a 2020 Action Program for Climate Protection23 in April 2014.
Building on this Action Program, the government plans to develop a national 2050 Climate Protection Plan by 2016. It is, however, unlikely that these measures will be very effective before 2020, which means Germany is unlikely to reach its 2020 CO2 targets.
Figure 21. Electricity generation from coal, gas and nuclear (in TWh)10
Hard coal
50
70
90
110
130
150
170
2013201220112010
Lignite Gas Nuclear
1286
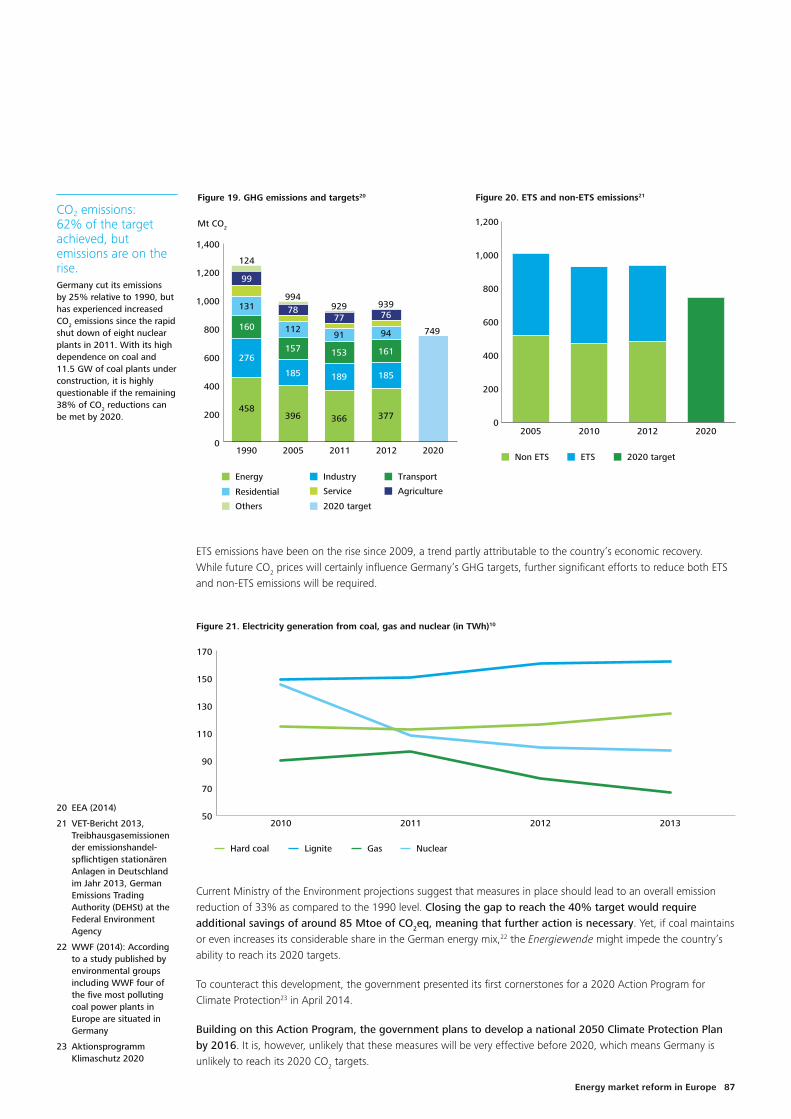
To start a new section, hold down the apple+shift keys and click
to release this object and type the section title in the box below.
18 Eurostat. © European Union, 1995-2015
19 http://www.umweltbundesamt.de/
Figure 18. Renewable energy share of final energy use by type, in 2005 and 2010, and target for 2020, in %18
0%
2%
4%
6%
8%
10%
12%
14%
16%
18%
20%
TotalBiofuelsOther heatingsectors
Heatpumps
Solidbiomass
Other electricitysectors
WindHydro
2005 2010 2020
The increasing share of renewables was mainly driven by new PV and wind capacities: PV capacities rose from 62 MW in 2000 to 34.7 GW in 2013 (CAGR: 63%), overtaking wind capacities. And wind capacities increased during the same time, from 5.8 GW to 34.4 GW (CAGR: 15%).
As can be inferred from Figure 18, the main sources of additional renewable energy capacities until 2020 are targeted to come from wind and other electricity sectors, mainly PV. Germany seems to be on track to reach its renewable energy targets.
However, with the EEG reforms of 2014, which reduced feed-in tariffs and introduced capacity caps, development is likely to slow down. Another impediment to the implementation of new capacities will be the speed with which the new electricity grid can bring energy from the windy north to the energy-hungry south in the face of both administrative barriers and local opposition.
To date, Germany has reached 66% of its renewable energy target. However, given changing policies around renewable power, its ability to reach its 2020 target remains uncertain.
CO2 emissions and targetsGermany is the largest CO2 emitter in Europe, accounting for roughly 20% of the overall EU-28 CO2 emissions in 2012. These emissions have been declining over the last two decades, falling 25% below 1990 levels. However, emissions regained momentum after the country’s decision to phase out nuclear power in 2011, and have increased over the last two years due to a higher share of coal (in particular lignite) in the electricity generation mix. Preliminary numbers suggest that in 2013 emissions further increased to 951 Mt CO2eq.19 These increases can mainly be attributed to the energy sector (+3%), the transport sector (+5%) and the residential sector (+3%).
11
To start a new section, hold down the apple+shift keys and click
to release this object and type the section title in the box below.
To start a new section, hold down the apple+shift keys and click
to release this object and type the section title in the box below.
20 EEA (2014)
21 VET-Bericht 2013, Treibhausgasemissionen der emissionshandel-spfl ichtigen stationären Anlagen in Deutschland im Jahr 2013, German Emissions Trading Authority (DEHSt) at the Federal Environment Agency
22 WWF (2014): According to a study published by environmental groups including WWF four of the fi ve most polluting coal power plants in Europe are situated in Germany
23 Aktionsprogramm Klimaschutz 2020
CO2 emissions: 62% of the target achieved, but emissions are on the rise.Germany cut its emissions by 25% relative to 1990, but has experienced increased CO2 emissions since the rapid shut down of eight nuclear plants in 2011. With its high dependence on coal and 11.5 GW of coal plants under construction, it is highly questionable if the remaining 38% of CO2 reductions can be met by 2020.
ETS emissions have been on the rise since 2009, a trend partly attributable to the country’s economic recovery. While future CO2 prices will certainly infl uence Germany’s GHG targets, further signifi cant efforts to reduce both ETS and non-ETS emissions will be required.
0
200
400
600
800
1,000
1,200
1,400
20202012201120051990
Figure 19. GHG emissions and targets20
Mt CO2
Energy Industry
2020 target
Transport
Residential Service Agriculture
Others
458
276
160
99
131
124
396
185
157
78
112
994
366
189
153
77
91
929
377
185
161
76
94
939
749
Figure 20. ETS and non-ETS emissions21
Non ETS ETS 2020 target
0
200
400
600
800
1,000
1,200
2020201220102005
Current Ministry of the Environment projections suggest that measures in place should lead to an overall emission reduction of 33% as compared to the 1990 level. Closing the gap to reach the 40% target would require additional savings of around 85 Mtoe of CO2eq, meaning that further action is necessary. Yet, if coal maintains or even increases its considerable share in the German energy mix,22 the Energiewende might impede the country’s ability to reach its 2020 targets.
To counteract this development, the government presented its fi rst cornerstones for a 2020 Action Program for Climate Protection23 in April 2014.
Building on this Action Program, the government plans to develop a national 2050 Climate Protection Plan by 2016. It is, however, unlikely that these measures will be very effective before 2020, which means Germany is unlikely to reach its 2020 CO2 targets.
Figure 21. Electricity generation from coal, gas and nuclear (in TWh)10
Hard coal
50
70
90
110
130
150
170
2013201220112010
Lignite Gas Nuclear
12 87Energy market reform in Europe
To start a new section, hold down the apple+shift keys and click
to release this object and type the section title in the box below.
24 Calculation based on the 2013 TWh/GW ratios; cf. the chapter on power generation
Ambitious targets require ambitious actions – and a more adaptive energy environment.Germany presented a legal framework to pave the way for its 2020 and 2050 targets. However, it is not clear if this framework will be suffi cient.
12.7 GW of nuclear plants are slated to be gradually replaced between 2015 and 2022, representing 16% of the country’s 2013 electricity output.While replacing nuclear energy seems a stretch but possible, the real challenge lies in shutting down the sector. To achieve this goal, the state will likely need to play a more active role.
Road ahead and main challenges: the way to 2030 and beyond
Energy turnaround (Energiewende) Germany has set ambitious energy and climate targets for 2050, with interim steps for 2030 and 2040. It was one of the fi rst countries to set up long-term objectives to move toward a low-carbon economy. This endeavor has proven – and will most likely continue to prove – costly to German taxpayers. In February 2013, the then Energy & Environment minister said that the costs of Energiewende – reforming and restructuring Germany’s energy sector by the end of the 2030s – could reach € 1,000 billion.
These targets, combined with the simultaneous phase-out of nuclear energy by 2022 and the increasing costs to support the development of renewable energy, constitute a major challenge to Germany’s ability to guarantee a secure and affordable energy supply. This threatens not only citizens’ living standards, but also the competitiveness of Germany’s economy.
To the German public, these targets are indicators of the country’s ability to complete its energy transition in a timely manner. It remains to be seen whether Germany’s policy-makers see the timely achievement of these targets as an end in itself (as a way to avoid political risk and argue in favor of shorter-term expensive fi xes) or whether they are serious about adopting a strategy capable of driving down costs and encouraging innovation by fostering exposure to prevailing market forces.
Nuclear powerNuclear plants supplied approximately one-quarter of Germany’s power before the 2011 Fukushima accident. This disaster changed the German energy strategy in a radical way. The eight oldest reactors (8.8 GW) were permanently shut down in mid-2011 and the government decided to speed up the shuttering of the nine remaining reactors (12.7 GW) by about a decade, to 2022. In 2013, nuclear generated 97 TWH or 16% of the country’s electricity output.
As an illustration, replacing 97 TWh of nuclear power production would require around 112 GW of new PV, 63 GW of wind or 18 GW of coal power capacities.24
Since the nuclear phase-out has broad acceptance among the population and is supported by all the major political parties, it is rather unlikely that another U-turn will occur in the years to come. In September 2011, industry giant Siemens announced its complete withdrawal from the nuclear industry.
This last point demonstrates a critical side effect of the government’s decision. Since there is no future role for this type of energy in Germany, specifi c know-how and technologies will not be developed beyond the current generation. Yet, this know-how will still be needed to decommission the existing power plants. Another major and still unresolved problem is linked to the management of nuclear waste, which is a highly controversial topic in Germany. An operating repository for high-level waste is not expected before 2050.
In essence, the nuclear sector is heading towards a “bad bank” scenario, where the German government may need to take a more active role in organizing and fi nancing the shutdown of the sector – in a manner similar to what happened in the German hard coal mining sector.
RenewablesAccording to the Energy Concept, renewable energies are the supporting pillar of Germany’s future energy supply. The target is for renewables to reach a 60% share of fi nal energy consumption and 80% of electricity production by 2050. Over the past decade, Germany saw a strong expansion of its intermittent energy sources. Wind power has become the most important renewable source of electricity production, with an installed capacity of 34 GW in 2013, followed by solar power, which grew sharply over the last fi ve years (+22.7 GW between 2009 and 2012).
While this development has led to a signifi cant increase of renewables in the German energy mix, it was accompanied by lower (and sometimes even negative) spot prices on the energy exchanges and a crowding-out effect of operating times of conventional power plants (for gas in particular).
In parallel, electricity bills are rising sharply as a result of the cost of the surcharge used to fund renewables. Even if the German government manages to regulate the annual capacity increase, it still remains to be seen how the population’s energy bill can be kept at an acceptable level and how it will impact Germany’s competitiveness. From 2008 to 2014, the EEG apportionment for residential customers rose from 11 to 62 €/MWh (+460%).
More renewables in the pipeline, but at what cost?Although development is likely to slow down in the coming years, additional capacities are planned. Yet zero-marginal cost economics will, fundamentally reshape the way energy is procured in the long term.
13
To start a new section, hold down the apple+shift keys and click
to release this object and type the section title in the box below.
To start a new section, hold down the apple+shift keys and click
to release this object and type the section title in the box below.
Nevertheless, renewables in the form of onshore and offshore wind, as well as PV, will continue to be the only growing forms of energy in Germany for the foreseeable future. With the system becoming increasingly dominated by renewables, two issues are coming to the fore:
• Storage. The abundance of cheap energy during times of oversupply, combined with the need for grid balancing, will foster innovation in storage solutions such as direct battery storage, indirect power-to-heat and power-to-hydrogen applications.
• Financing. Given the zero-marginal cost of renewables, the relevance of wholesale market prices to refi nance renewables investments will likely be called into questioned. Instead, other forms of asset monetization, such as long-term PPAs, may be used to fi nance capital costs, leaving only residual balancing energy to be traded.
Fossil fuels and peak power productionGermany relies heavily on fossil fuels and is a long-time leader in lignite mining. In 2013, coal power plants generated around 45% of Germany’s electricity production. Twelve new coal power plants were under construction or planned (11.7 GW)25 as of May 2013. This new building activity is the result of the last investment cycle up to 2009 that was triggered by then-high clean/dark spreads in the industry. While the new builds were originally supposed to replace ineffi cient coal plants, they may now step in to fi ll the nuclear gap that will exist after fi nal shut-downs. Not surprisingly, this compromises Germany’s ability to meet the ambitious climate and energy goals it set in 2010.
The speed of the Energiewende has signifi cantly changed the economics for conventional power plants. While, in 2013, electricity production from lignite reached its highest level since 1990 – providing further base-load power due to the nuclear phase-out and low CO2 prices – gas-fi red power production has been declining for the last three years due to closure or mothballing of no longer profi table gas-fi red plants. In the mid-term, the mix of conventional power production depends on two factors. First, if CO2 prices remain at their low level, the use of coal is likely to continue. Second, if gas prices remain at their relatively high levels, CCGTs will not increase their operating hours.
A coal-to-gas shift may result from a combination of these two factors. For example, CO2 prices could arguably rise as a result of EU-ETS reform, while gas prices fall due to global LNG oversupply. However, that scenario remains highly unlikely. Instead, Germany’s ongoing dependence on imports from geopolitically-uncertain areas (in 2012, 38% of German gas imports came from Russia26) and its lack of plans to engage in fracking, will likely see coal playing a fundamental role in the country’s electricity mix for years to come, at least as a transition fuel. As carbon capture and storage (CCS) technology is not yet commercially viable,27 this means coal emissions will remain a major challenge in Germany.
InfrastructureGermany’s power grid is characterized by home-grown production structures that keep power generation relatively close to consumption sites. In the future, electricity production will increase signifi cantly in the northern part of Germany, in particular at the sea and in coastal regions (wind). In addition, much of the country’s decentralized generation, such as PV and biomass, will be fed into the grid. Interconnections with neighboring countries are also expected to increase. To address these future challenges, a 10-year grid development plan was developed in 2013, prioritizing the construction of four “energy highways” and other supporting lines. Particularly important will be the construction of north-south energy highways that can bring energy from wind power plants in the north to the south.
The total investment needed for this development is estimated between € 21-26 billion.
25 BDEW (2013)
26 BMWi (2013)
27 In May 2014 Vattenfall announced that they would totally give up CCS research after 10 years because of “challenging market conditions”
11.7 GW of new coal, threatening GHG emission targets. With low CO2 prices and a relatively high gas price in Europe, coal could remain attractive for several years, threatening Germany’s long-term GHG emission targets.
3,500 km of new grid neededthe north to the rest of the country will require substantial investments, estimated between € 21-26 billion. The success of the Energiewende will highly depend on the speed and cost-effectiveness of the grid expansion.
1488

To start a new section, hold down the apple+shift keys and click
to release this object and type the section title in the box below.
24 Calculation based on the 2013 TWh/GW ratios; cf. the chapter on power generation
Ambitious targets require ambitious actions – and a more adaptive energy environment.Germany presented a legal framework to pave the way for its 2020 and 2050 targets. However, it is not clear if this framework will be suffi cient.
12.7 GW of nuclear plants are slated to be gradually replaced between 2015 and 2022, representing 16% of the country’s 2013 electricity output.While replacing nuclear energy seems a stretch but possible, the real challenge lies in shutting down the sector. To achieve this goal, the state will likely need to play a more active role.
Road ahead and main challenges: the way to 2030 and beyond
Energy turnaround (Energiewende) Germany has set ambitious energy and climate targets for 2050, with interim steps for 2030 and 2040. It was one of the fi rst countries to set up long-term objectives to move toward a low-carbon economy. This endeavor has proven – and will most likely continue to prove – costly to German taxpayers. In February 2013, the then Energy & Environment minister said that the costs of Energiewende – reforming and restructuring Germany’s energy sector by the end of the 2030s – could reach € 1,000 billion.
These targets, combined with the simultaneous phase-out of nuclear energy by 2022 and the increasing costs to support the development of renewable energy, constitute a major challenge to Germany’s ability to guarantee a secure and affordable energy supply. This threatens not only citizens’ living standards, but also the competitiveness of Germany’s economy.
To the German public, these targets are indicators of the country’s ability to complete its energy transition in a timely manner. It remains to be seen whether Germany’s policy-makers see the timely achievement of these targets as an end in itself (as a way to avoid political risk and argue in favor of shorter-term expensive fi xes) or whether they are serious about adopting a strategy capable of driving down costs and encouraging innovation by fostering exposure to prevailing market forces.
Nuclear powerNuclear plants supplied approximately one-quarter of Germany’s power before the 2011 Fukushima accident. This disaster changed the German energy strategy in a radical way. The eight oldest reactors (8.8 GW) were permanently shut down in mid-2011 and the government decided to speed up the shuttering of the nine remaining reactors (12.7 GW) by about a decade, to 2022. In 2013, nuclear generated 97 TWH or 16% of the country’s electricity output.
As an illustration, replacing 97 TWh of nuclear power production would require around 112 GW of new PV, 63 GW of wind or 18 GW of coal power capacities.24
Since the nuclear phase-out has broad acceptance among the population and is supported by all the major political parties, it is rather unlikely that another U-turn will occur in the years to come. In September 2011, industry giant Siemens announced its complete withdrawal from the nuclear industry.
This last point demonstrates a critical side effect of the government’s decision. Since there is no future role for this type of energy in Germany, specifi c know-how and technologies will not be developed beyond the current generation. Yet, this know-how will still be needed to decommission the existing power plants. Another major and still unresolved problem is linked to the management of nuclear waste, which is a highly controversial topic in Germany. An operating repository for high-level waste is not expected before 2050.
In essence, the nuclear sector is heading towards a “bad bank” scenario, where the German government may need to take a more active role in organizing and fi nancing the shutdown of the sector – in a manner similar to what happened in the German hard coal mining sector.
RenewablesAccording to the Energy Concept, renewable energies are the supporting pillar of Germany’s future energy supply. The target is for renewables to reach a 60% share of fi nal energy consumption and 80% of electricity production by 2050. Over the past decade, Germany saw a strong expansion of its intermittent energy sources. Wind power has become the most important renewable source of electricity production, with an installed capacity of 34 GW in 2013, followed by solar power, which grew sharply over the last fi ve years (+22.7 GW between 2009 and 2012).
While this development has led to a signifi cant increase of renewables in the German energy mix, it was accompanied by lower (and sometimes even negative) spot prices on the energy exchanges and a crowding-out effect of operating times of conventional power plants (for gas in particular).
In parallel, electricity bills are rising sharply as a result of the cost of the surcharge used to fund renewables. Even if the German government manages to regulate the annual capacity increase, it still remains to be seen how the population’s energy bill can be kept at an acceptable level and how it will impact Germany’s competitiveness. From 2008 to 2014, the EEG apportionment for residential customers rose from 11 to 62 €/MWh (+460%).
More renewables in the pipeline, but at what cost?Although development is likely to slow down in the coming years, additional capacities are planned. Yet zero-marginal cost economics will, fundamentally reshape the way energy is procured in the long term.
13
To start a new section, hold down the apple+shift keys and click
to release this object and type the section title in the box below.
To start a new section, hold down the apple+shift keys and click
to release this object and type the section title in the box below.
Nevertheless, renewables in the form of onshore and offshore wind, as well as PV, will continue to be the only growing forms of energy in Germany for the foreseeable future. With the system becoming increasingly dominated by renewables, two issues are coming to the fore:
• Storage. The abundance of cheap energy during times of oversupply, combined with the need for grid balancing, will foster innovation in storage solutions such as direct battery storage, indirect power-to-heat and power-to-hydrogen applications.
• Financing. Given the zero-marginal cost of renewables, the relevance of wholesale market prices to refi nance renewables investments will likely be called into questioned. Instead, other forms of asset monetization, such as long-term PPAs, may be used to fi nance capital costs, leaving only residual balancing energy to be traded.
Fossil fuels and peak power productionGermany relies heavily on fossil fuels and is a long-time leader in lignite mining. In 2013, coal power plants generated around 45% of Germany’s electricity production. Twelve new coal power plants were under construction or planned (11.7 GW)25 as of May 2013. This new building activity is the result of the last investment cycle up to 2009 that was triggered by then-high clean/dark spreads in the industry. While the new builds were originally supposed to replace ineffi cient coal plants, they may now step in to fi ll the nuclear gap that will exist after fi nal shut-downs. Not surprisingly, this compromises Germany’s ability to meet the ambitious climate and energy goals it set in 2010.
The speed of the Energiewende has signifi cantly changed the economics for conventional power plants. While, in 2013, electricity production from lignite reached its highest level since 1990 – providing further base-load power due to the nuclear phase-out and low CO2 prices – gas-fi red power production has been declining for the last three years due to closure or mothballing of no longer profi table gas-fi red plants. In the mid-term, the mix of conventional power production depends on two factors. First, if CO2 prices remain at their low level, the use of coal is likely to continue. Second, if gas prices remain at their relatively high levels, CCGTs will not increase their operating hours.
A coal-to-gas shift may result from a combination of these two factors. For example, CO2 prices could arguably rise as a result of EU-ETS reform, while gas prices fall due to global LNG oversupply. However, that scenario remains highly unlikely. Instead, Germany’s ongoing dependence on imports from geopolitically-uncertain areas (in 2012, 38% of German gas imports came from Russia26) and its lack of plans to engage in fracking, will likely see coal playing a fundamental role in the country’s electricity mix for years to come, at least as a transition fuel. As carbon capture and storage (CCS) technology is not yet commercially viable,27 this means coal emissions will remain a major challenge in Germany.
InfrastructureGermany’s power grid is characterized by home-grown production structures that keep power generation relatively close to consumption sites. In the future, electricity production will increase signifi cantly in the northern part of Germany, in particular at the sea and in coastal regions (wind). In addition, much of the country’s decentralized generation, such as PV and biomass, will be fed into the grid. Interconnections with neighboring countries are also expected to increase. To address these future challenges, a 10-year grid development plan was developed in 2013, prioritizing the construction of four “energy highways” and other supporting lines. Particularly important will be the construction of north-south energy highways that can bring energy from wind power plants in the north to the south.
The total investment needed for this development is estimated between € 21-26 billion.
25 BDEW (2013)
26 BMWi (2013)
27 In May 2014 Vattenfall announced that they would totally give up CCS research after 10 years because of “challenging market conditions”
11.7 GW of new coal, threatening GHG emission targets. With low CO2 prices and a relatively high gas price in Europe, coal could remain attractive for several years, threatening Germany’s long-term GHG emission targets.
3,500 km of new grid neededthe north to the rest of the country will require substantial investments, estimated between € 21-26 billion. The success of the Energiewende will highly depend on the speed and cost-effectiveness of the grid expansion.
14 89Energy market reform in Europe

To start a new section, hold down the apple+shift keys and click
to release this object and type the section title in the box below.
28 www.netzentwicklungsplan.de
ConclusionWith its historic Energiewende project, Germany set long-term energy and climate goals and defi ned intermediate targets. These targets were set before the Fukushima accident in 2011 and therefore before Germany’s decision to phase out nuclear by 2022. Nevertheless, the government decided not to adjust its objectives, but to fi nd alternative solutions instead, particularly by further developing renewable energies and promoting energy effi ciency. As a result, wind and especially PV capacities have skyrocketed during the last decade, mainly driven by the high feed-in-tariffs set out in the fi rst versions of the EEG. The new EEG 2014 puts a fl exible cap on new renewable capacities, allowing the government to better control its future development and to slow down the rapid rise of electricity prices.
Today, Germany has some of the lowest wholesale electricity prices in Europe and some of the highest retail prices, due to its energy policies.
The success or failure of the Energiewende will depend on different factors, which each represent a major challenge:
First, to retain public support for the project, the government has to stabilize electricity prices and fi nd a solution to the unequal distribution of the burden related to the EEG apportionment.
Second, a fast and cost-effective solution for grid extension needs to be found and implemented.
Third, Germany has to defi ne the future role of gas (and coal) in its energy mix and work seriously on its CO2 emissions if it wants to reach its long-term reduction targets and keep its green image.
Fourth, the development of cost-effective storage solutions will be critical to balance intermittent renewable supplies and use the frequent abundance of renewables at zero marginal cost. This should be a focus of political attention, without trying to pre-determine the winning technology.
Fifth, with zero marginal cost renewables increasingly dominating the market, the country must revisit its fundamental market design and consider different solutions that enable electricity suppliers to realize a return on their investment over the long term while balancing market supply and demand over the short term.
15
Selected bibliographic references
Bundesverband Erneuerbare Energie (BEE) (www.bee-ev.de)
Monitoring Report 2012 – Developments of the electricity and gas markets in Germany
WWF (2014): Europe’s dirty 30 – How the EU’s coal-fi red power plants are undermining its climate efforts. Accessed on August 6, 2014
http://awsassets.panda.org/downloads/dirty_30_report_fi nale.pdf
© OECD/IEA 2013, Energy Policies of IEA Countries – Germany 2013 Review, IEA Publishing. Licence: http://www.iea.org/t&c/
Federal Ministry for the Environment, Nature Conservation and Safety (2010) – Energy Concept
BMUB (2014) – Aktionsprogramm Klimaschutz 2020 – Eckpunkte des BMUB
Eurostat (2014), Source: Eurostat. © European Union, 1995-2015
BMWi (2014) – Zahlen und Fakten Energiedaten
BMWi (2014) – 3. Nationaler Energieeffi zienz-Aktionsplan (NEEAP) 2014 der Bundesrepublik Deutschland
BMWi (2014) – Erneuerbare Energien im Jahr 2013
BDEW (2014) – Erneuerbare Energien und das EEG: Zahlen, Fakten, Grafi ken (2014)
BDEW (2013) – Kraftwerksplanungen und aktuelle ökonomische Rahmenbedingungen für Kraftwerke in Deutschland
Umweltbundesamt (2014) – VET-Bericht 2013 Treibhausgasemissionen der emissionshandelspfl ichtigen stationären Anlagen in Deutschland im Jahr 2013
ACEEE (2014) – International Energy Effi ciency Scorecard
EEA (2014) – Data from http://www.eea.europa.eu/
1690
To start a new section, hold down the apple+shift keys and click
to release this object and type the section title in the box below.
28 www.netzentwicklungsplan.de
ConclusionWith its historic Energiewende project, Germany set long-term energy and climate goals and defi ned intermediate targets. These targets were set before the Fukushima accident in 2011 and therefore before Germany’s decision to phase out nuclear by 2022. Nevertheless, the government decided not to adjust its objectives, but to fi nd alternative solutions instead, particularly by further developing renewable energies and promoting energy effi ciency. As a result, wind and especially PV capacities have skyrocketed during the last decade, mainly driven by the high feed-in-tariffs set out in the fi rst versions of the EEG. The new EEG 2014 puts a fl exible cap on new renewable capacities, allowing the government to better control its future development and to slow down the rapid rise of electricity prices.
Today, Germany has some of the lowest wholesale electricity prices in Europe and some of the highest retail prices, due to its energy policies.
The success or failure of the Energiewende will depend on different factors, which each represent a major challenge:
First, to retain public support for the project, the government has to stabilize electricity prices and fi nd a solution to the unequal distribution of the burden related to the EEG apportionment.
Second, a fast and cost-effective solution for grid extension needs to be found and implemented.
Third, Germany has to defi ne the future role of gas (and coal) in its energy mix and work seriously on its CO2 emissions if it wants to reach its long-term reduction targets and keep its green image.
Fourth, the development of cost-effective storage solutions will be critical to balance intermittent renewable supplies and use the frequent abundance of renewables at zero marginal cost. This should be a focus of political attention, without trying to pre-determine the winning technology.
Fifth, with zero marginal cost renewables increasingly dominating the market, the country must revisit its fundamental market design and consider different solutions that enable electricity suppliers to realize a return on their investment over the long term while balancing market supply and demand over the short term.
15
Selected bibliographic references
Bundesverband Erneuerbare Energie (BEE) (www.bee-ev.de)
Monitoring Report 2012 – Developments of the electricity and gas markets in Germany
WWF (2014): Europe’s dirty 30 – How the EU’s coal-fi red power plants are undermining its climate efforts. Accessed on August 6, 2014
http://awsassets.panda.org/downloads/dirty_30_report_fi nale.pdf
© OECD/IEA 2013, Energy Policies of IEA Countries – Germany 2013 Review, IEA Publishing. Licence: http://www.iea.org/t&c/
Federal Ministry for the Environment, Nature Conservation and Safety (2010) – Energy Concept
BMUB (2014) – Aktionsprogramm Klimaschutz 2020 – Eckpunkte des BMUB
Eurostat (2014), Source: Eurostat. © European Union, 1995-2015
BMWi (2014) – Zahlen und Fakten Energiedaten
BMWi (2014) – 3. Nationaler Energieeffi zienz-Aktionsplan (NEEAP) 2014 der Bundesrepublik Deutschland
BMWi (2014) – Erneuerbare Energien im Jahr 2013
BDEW (2014) – Erneuerbare Energien und das EEG: Zahlen, Fakten, Grafi ken (2014)
BDEW (2013) – Kraftwerksplanungen und aktuelle ökonomische Rahmenbedingungen für Kraftwerke in Deutschland
Umweltbundesamt (2014) – VET-Bericht 2013 Treibhausgasemissionen der emissionshandelspfl ichtigen stationären Anlagen in Deutschland im Jahr 2013
ACEEE (2014) – International Energy Effi ciency Scorecard
EEA (2014) – Data from http://www.eea.europa.eu/
16 91Energy market reform in Europe
European energy market reformCountry profi le: Italy
92

European energy market reformCountry profi le: Italy
Contents
Current situation 94
Energy consumption and trade balance 94
Power generation 95
Power market: main actors 96
Power prices 97
Targets for 2020 98
Energy efficiency targets 98
Renewable energy targets 100
CO2 emissions and targets 102
Road ahead and main challenges: the way to 2030 and beyond 103
European market reform: where Italy stands 103
Ensuring energy market competitiveness 103
Italy’s energy mix post-2020 and the role of renewables 104
Conclusion 104
Selected bibliographic references 105
93Energy market reform in Europe
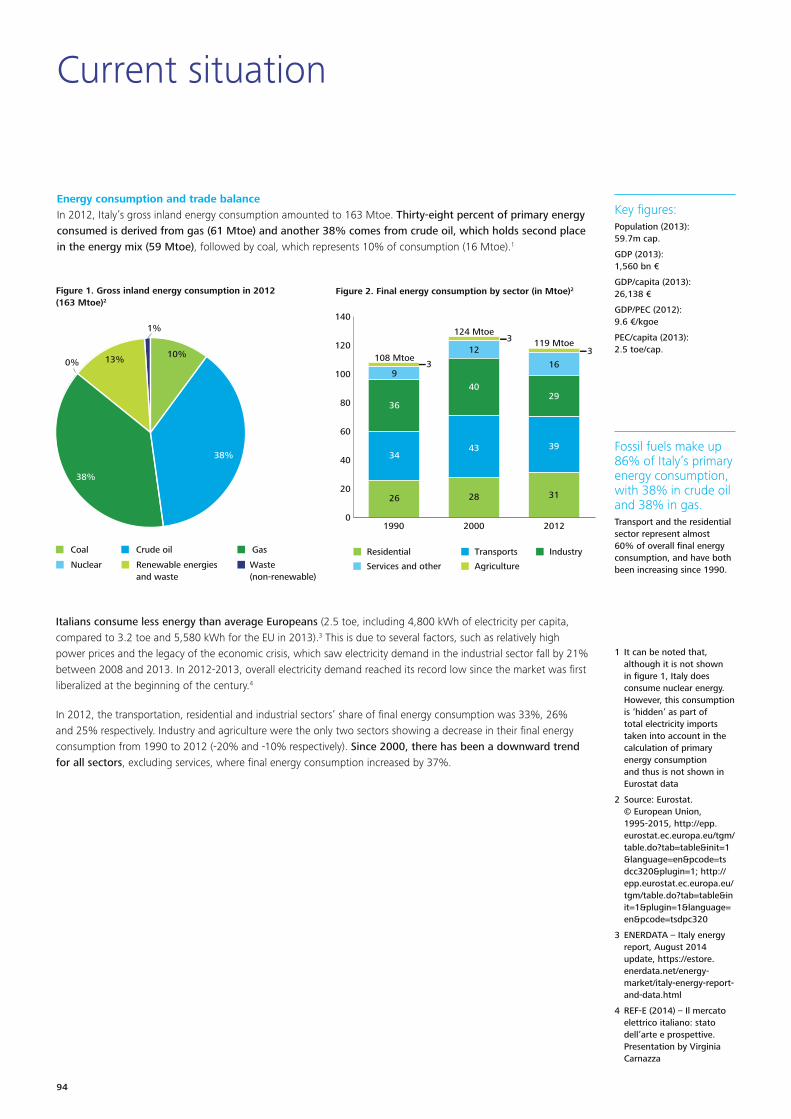
To start a new section, hold down the apple+shift keys and click
to release this object and type the section title in the box below.
Current situation
Energy consumption and trade balanceIn 2012, Italy’s gross inland energy consumption amounted to 163 Mtoe. Thirty-eight percent of primary energy consumed is derived from gas (61 Mtoe) and another 38% comes from crude oil, which holds second place in the energy mix (59 Mtoe), followed by coal, which represents 10% of consumption (16 Mtoe).1
Fossil fuels make up 86% of Italy’s primary energy consumption, with 38% in crude oil and 38% in gas. Transport and the residential sector represent almost 60% of overall fi nal energy consumption, and have both been increasing since 1990.
1 It can be noted that, although it is not shown in fi gure 1, Italy does consume nuclear energy. However, this consumption is ‘hidden’ as part of total electricity imports taken into account in the calculation of primary energy consumption and thus is not shown in Eurostat data
2 Source: Eurostat. © European Union, 1995-2015, http://epp.eurostat.ec.europa.eu/tgm/table.do?tab=table&init=1&language=en&pcode=tsdcc320&plugin=1; http://epp.eurostat.ec.europa.eu/tgm/table.do?tab=table&init=1&plugin=1&language=en&pcode=tsdpc320
3 ENERDATA – Italy energy report, August 2014 update, https://estore.enerdata.net/energy-market/italy-energy-report-and-data.html
4 REF-E (2014) – Il mercato elettrico italiano: stato dell’arte e prospettive. Presentation by Virginia Carnazza
Italians consume less energy than average Europeans (2.5 toe, including 4,800 kWh of electricity per capita, compared to 3.2 toe and 5,580 kWh for the EU in 2013).3 This is due to several factors, such as relatively high power prices and the legacy of the economic crisis, which saw electricity demand in the industrial sector fall by 21% between 2008 and 2013. In 2012-2013, overall electricity demand reached its record low since the market was fi rst liberalized at the beginning of the century.4
In 2012, the transportation, residential and industrial sectors’ share of fi nal energy consumption was 33%, 26% and 25% respectively. Industry and agriculture were the only two sectors showing a decrease in their fi nal energy consumption from 1990 to 2012 (-20% and -10% respectively). Since 2000, there has been a downward trend for all sectors, excluding services, where fi nal energy consumption increased by 37%.
Key fi gures: Population (2013): 59.7m cap.
GDP (2013): 1,560 bn €
GDP/capita (2013): 26,138 €
GDP/PEC (2012): 9.6 €/kgoe
PEC/capita (2013): 2.5 toe/cap.
Figure 1. Gross inland energy consumption in 2012(163 Mtoe)2
10%
38%
13%
1%
38%
0%
Coal Crude oil Gas
Nuclear Renewable energiesand waste
Waste(non-renewable)
Figure 2. Final energy consumption by sector (in Mtoe)2
Residential Transports Industry
Services and other Agriculture
0
20
40
60
80
100
120
140
201220001990
26
34
36
93
108 Mtoe
31
39
29
16
119 Mtoe
28
43
40
12
124 Mtoe3
3
1
To start a new section, hold down the apple+shift keys and click
to release this object and type the section title in the box below.
To start a new section, hold down the apple+shift keys and click
to release this object and type the section title in the box below.
In 2012, Italy’s global energy imports reached 165 Mtoe and exports reached 31 Mtoe.
Italy’s energy reserves are scarce: limited oil resources (202 Mt in 2013) and dwindling gas reserves (from 199 bcm in 2000 to 56 bcm in 2013). The country depends on imports of fossil fuels.
Oil imports (crude and refi ned) amounted to 56 Mtoe in 2012 and have decreased by 38% since 1990, while natural gas imports (55 Mtoe in 2012) have increased by 119%. In the 1990s and early 2000s, rising demand for energy, and growing economic and geopolitical uncertainties related to the use of oil, forced Italian energy producers to intensify their efforts to diversify their energy sources. Oil as fuel in thermal power plants has been partially replaced by natural gas, as the latter is considered less volatile in terms of price, more accessible and typically comes from less politically unstable areas.
Italy is a net importer of electricity. Roughly 87% of demand is satisfi ed by a national production of 285 billion kWh (1.3% less than in 2011). The remaining 13% comes from France and Switzerland electricity imports, which benefi t from low prices driven by excess power during off-peak periods.
Power generation Power generation capacity was 128 GW in 2012.5 More than 70% of Italy’s electricity was generated by thermal plants in 2012, 14% by hydropower and 13% by other renewables sources.5
5 Terna Group, Confronti Internazionali 2013 (2012 data), http://www.terna.it/LinkClick.aspx?fi leticket=3UMfptQkg0k%3d&tabid=418&mid=2501, page 147
6 Terna Group, Direzione Dispacciamento Nazionale. Dati statistici sull’energia elettrica in Italia – 2013, Nota di sintesi (“produzione” pag 100, 112) http://www.terna.it/default/Home/SISTEMA_ELETTRICO/statistiche/dati_statistici.aspx
Italy has a high preponderance of thermal power production (74%), while non-hydro renewables generated 13% in 2012.
After gas, coal is the second most frequently-used fuel in the Italian electricity generation mix,7 although reliance on coal has been diminishing in recent years. Italy still has 13 coal-fi red power plants, which are increasingly the targets of environmental activism, public attention and media pressure.
Figure 3. Energy trade balance (Mtoe)
1990 2000 2012
-100
-90
-80
-70
-60
-50
-40
-30
-20
-10
0
Electrical energyGasTotal petroleumSolid fuels
-14 -13 -16
-90 -88
-56
-25-3 -4 -4
-47-55
13%
6%
18%
Figure 4. Electricity production capacity – 128 GW (2012)5
8%9%
44%
1%
1%
Gas Oil Coal
Other (thermal) Hydro Geothermal
Wind Solar
38%
6%
2%
14%
Figure 5. Gross electricity production – 299 GWh (2012)6
16%
44%
2%
5%
Gas Oil Coal
Other (thermal) Hydro Geothermal
Wind Solar
27%
11%
294
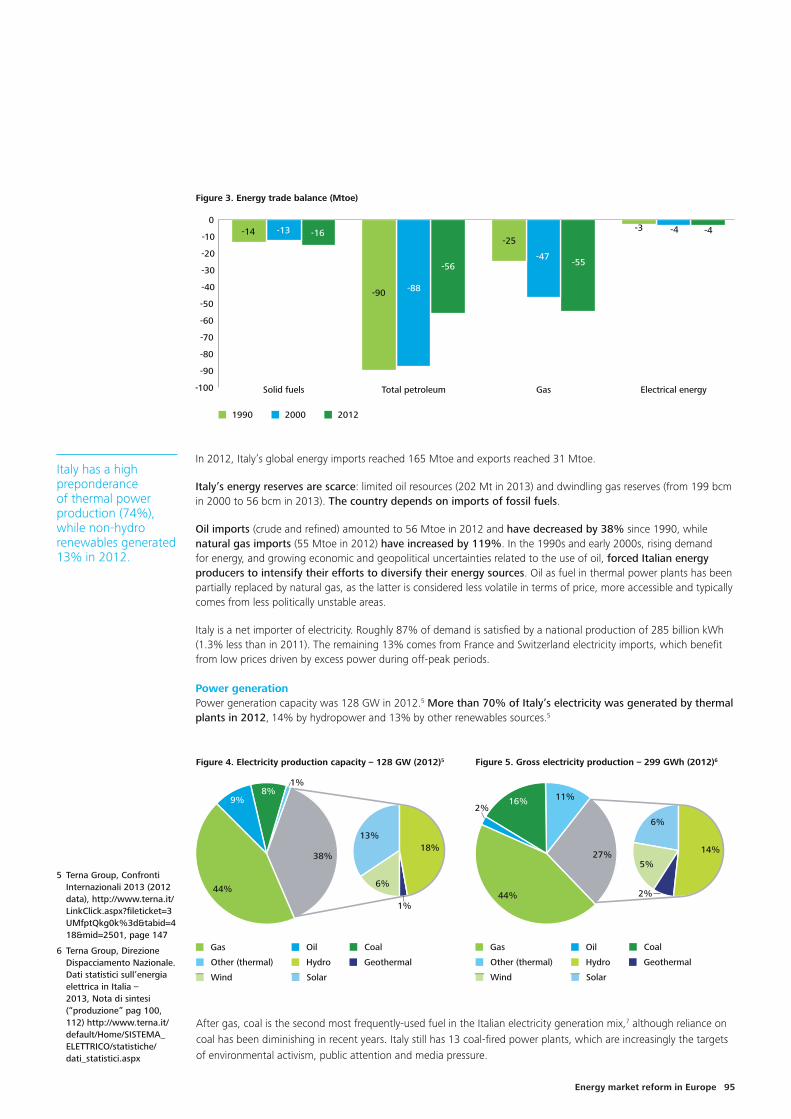
To start a new section, hold down the apple+shift keys and click
to release this object and type the section title in the box below.
Current situation
Energy consumption and trade balanceIn 2012, Italy’s gross inland energy consumption amounted to 163 Mtoe. Thirty-eight percent of primary energy consumed is derived from gas (61 Mtoe) and another 38% comes from crude oil, which holds second place in the energy mix (59 Mtoe), followed by coal, which represents 10% of consumption (16 Mtoe).1
Fossil fuels make up 86% of Italy’s primary energy consumption, with 38% in crude oil and 38% in gas. Transport and the residential sector represent almost 60% of overall fi nal energy consumption, and have both been increasing since 1990.
1 It can be noted that, although it is not shown in fi gure 1, Italy does consume nuclear energy. However, this consumption is ‘hidden’ as part of total electricity imports taken into account in the calculation of primary energy consumption and thus is not shown in Eurostat data
2 Source: Eurostat. © European Union, 1995-2015, http://epp.eurostat.ec.europa.eu/tgm/table.do?tab=table&init=1&language=en&pcode=tsdcc320&plugin=1; http://epp.eurostat.ec.europa.eu/tgm/table.do?tab=table&init=1&plugin=1&language=en&pcode=tsdpc320
3 ENERDATA – Italy energy report, August 2014 update, https://estore.enerdata.net/energy-market/italy-energy-report-and-data.html
4 REF-E (2014) – Il mercato elettrico italiano: stato dell’arte e prospettive. Presentation by Virginia Carnazza
Italians consume less energy than average Europeans (2.5 toe, including 4,800 kWh of electricity per capita, compared to 3.2 toe and 5,580 kWh for the EU in 2013).3 This is due to several factors, such as relatively high power prices and the legacy of the economic crisis, which saw electricity demand in the industrial sector fall by 21% between 2008 and 2013. In 2012-2013, overall electricity demand reached its record low since the market was fi rst liberalized at the beginning of the century.4
In 2012, the transportation, residential and industrial sectors’ share of fi nal energy consumption was 33%, 26% and 25% respectively. Industry and agriculture were the only two sectors showing a decrease in their fi nal energy consumption from 1990 to 2012 (-20% and -10% respectively). Since 2000, there has been a downward trend for all sectors, excluding services, where fi nal energy consumption increased by 37%.
Key fi gures: Population (2013): 59.7m cap.
GDP (2013): 1,560 bn €
GDP/capita (2013): 26,138 €
GDP/PEC (2012): 9.6 €/kgoe
PEC/capita (2013): 2.5 toe/cap.
Figure 1. Gross inland energy consumption in 2012(163 Mtoe)2
10%
38%
13%
1%
38%
0%
Coal Crude oil Gas
Nuclear Renewable energiesand waste
Waste(non-renewable)
Figure 2. Final energy consumption by sector (in Mtoe)2
Residential Transports Industry
Services and other Agriculture
0
20
40
60
80
100
120
140
201220001990
26
34
36
93
108 Mtoe
31
39
29
16
119 Mtoe
28
43
40
12
124 Mtoe3
3
1
To start a new section, hold down the apple+shift keys and click
to release this object and type the section title in the box below.
To start a new section, hold down the apple+shift keys and click
to release this object and type the section title in the box below.
In 2012, Italy’s global energy imports reached 165 Mtoe and exports reached 31 Mtoe.
Italy’s energy reserves are scarce: limited oil resources (202 Mt in 2013) and dwindling gas reserves (from 199 bcm in 2000 to 56 bcm in 2013). The country depends on imports of fossil fuels.
Oil imports (crude and refi ned) amounted to 56 Mtoe in 2012 and have decreased by 38% since 1990, while natural gas imports (55 Mtoe in 2012) have increased by 119%. In the 1990s and early 2000s, rising demand for energy, and growing economic and geopolitical uncertainties related to the use of oil, forced Italian energy producers to intensify their efforts to diversify their energy sources. Oil as fuel in thermal power plants has been partially replaced by natural gas, as the latter is considered less volatile in terms of price, more accessible and typically comes from less politically unstable areas.
Italy is a net importer of electricity. Roughly 87% of demand is satisfi ed by a national production of 285 billion kWh (1.3% less than in 2011). The remaining 13% comes from France and Switzerland electricity imports, which benefi t from low prices driven by excess power during off-peak periods.
Power generation Power generation capacity was 128 GW in 2012.5 More than 70% of Italy’s electricity was generated by thermal plants in 2012, 14% by hydropower and 13% by other renewables sources.5
5 Terna Group, Confronti Internazionali 2013 (2012 data), http://www.terna.it/LinkClick.aspx?fi leticket=3UMfptQkg0k%3d&tabid=418&mid=2501, page 147
6 Terna Group, Direzione Dispacciamento Nazionale. Dati statistici sull’energia elettrica in Italia – 2013, Nota di sintesi (“produzione” pag 100, 112) http://www.terna.it/default/Home/SISTEMA_ELETTRICO/statistiche/dati_statistici.aspx
Italy has a high preponderance of thermal power production (74%), while non-hydro renewables generated 13% in 2012.
After gas, coal is the second most frequently-used fuel in the Italian electricity generation mix,7 although reliance on coal has been diminishing in recent years. Italy still has 13 coal-fi red power plants, which are increasingly the targets of environmental activism, public attention and media pressure.
Figure 3. Energy trade balance (Mtoe)
1990 2000 2012
-100
-90
-80
-70
-60
-50
-40
-30
-20
-10
0
Electrical energyGasTotal petroleumSolid fuels
-14 -13 -16
-90 -88
-56
-25-3 -4 -4
-47-55
13%
6%
18%
Figure 4. Electricity production capacity – 128 GW (2012)5
8%9%
44%
1%
1%
Gas Oil Coal
Other (thermal) Hydro Geothermal
Wind Solar
38%
6%
2%
14%
Figure 5. Gross electricity production – 299 GWh (2012)6
16%
44%
2%
5%
Gas Oil Coal
Other (thermal) Hydro Geothermal
Wind Solar
27%
11%
2 95Energy market reform in Europe
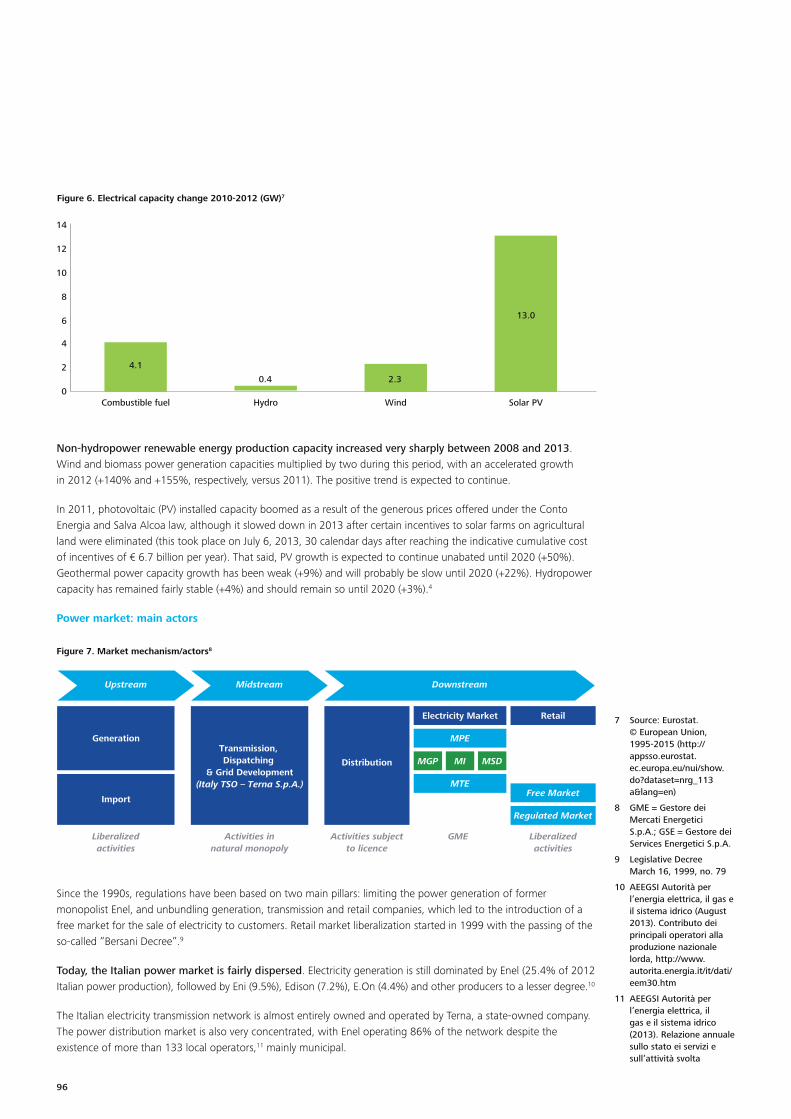
To start a new section, hold down the apple+shift keys and click
to release this object and type the section title in the box below.
Non-hydropower renewable energy production capacity increased very sharply between 2008 and 2013. Wind and biomass power generation capacities multiplied by two during this period, with an accelerated growth in 2012 (+140% and +155%, respectively, versus 2011). The positive trend is expected to continue.
In 2011, photovoltaic (PV) installed capacity boomed as a result of the generous prices offered under the Conto Energia and Salva Alcoa law, although it slowed down in 2013 after certain incentives to solar farms on agricultural land were eliminated (this took place on July 6, 2013, 30 calendar days after reaching the indicative cumulative cost of incentives of € 6.7 billion per year). That said, PV growth is expected to continue unabated until 2020 (+50%). Geothermal power capacity growth has been weak (+9%) and will probably be slow until 2020 (+22%). Hydropower capacity has remained fairly stable (+4%) and should remain so until 2020 (+3%).4
Power market: main actors
Since the 1990s, regulations have been based on two main pillars: limiting the power generation of former monopolist Enel, and unbundling generation, transmission and retail companies, which led to the introduction of a free market for the sale of electricity to customers. Retail market liberalization started in 1999 with the passing of the so-called “Bersani Decree”.9
Today, the Italian power market is fairly dispersed. Electricity generation is still dominated by Enel (25.4% of 2012 Italian power production), followed by Eni (9.5%), Edison (7.2%), E.On (4.4%) and other producers to a lesser degree.10
The Italian electricity transmission network is almost entirely owned and operated by Terna, a state-owned company. The power distribution market is also very concentrated, with Enel operating 86% of the network despite the existence of more than 133 local operators,11 mainly municipal.
Figure 6. Electrical capacity change 2010-2012 (GW)7
0
2
4
6
8
10
12
14
Solar PVWindHydroCombustible fuel
4.1
0.4 2.3
13.0
Midstream DownstreamUpstream
Liberalizedactivities
Generation
Import
Transmission, Dispatching
& Grid Development(Italy TSO – Terna S.p.A.)
Electricity Market
Distribution
MPE
MTEFree Market
Retail
Regulated Market
MGP MI MSD
Activities innatural monopoly
Activities subjectto licence
GME Liberalizedactivities
Figure 7. Market mechanism/actors8
7 Source: Eurostat. © European Union, 1995-2015 (http://appsso.eurostat.ec.europa.eu/nui/show.do?dataset=nrg_113a&lang=en)
8 GME = Gestore dei Mercati Energetici S.p.A.; GSE = Gestore dei Services Energetici S.p.A.
9 Legislative Decree March 16, 1999, no. 79
10 AEEGSI Autorità per l’energia elettrica, il gas e il sistema idrico (August 2013). Contributo dei principali operatori alla produzione nazionale lorda, http://www.autorita.energia.it/it/dati/eem30.htm
11 AEEGSI Autorità per l’energia elettrica, il gas e il sistema idrico (2013). Relazione annuale sullo stato ei servizi e sull’attività svolta
3
To start a new section, hold down the apple+shift keys and click
to release this object and type the section title in the box below.
To start a new section, hold down the apple+shift keys and click
to release this object and type the section title in the box below.
Power pricesOn the spot power market, Italy is one of only two European countries (with the UK) where prices on the power exchange have not shown some higher degree of convergence over the 2011-2014 period. Electricity usually trades at a premium compared to most continental peers due to high dependence on natural gas.
High and rising power prices.Already high, power prices have further increased for both residential and industrial users, primarily as a result of taxes to cover renewable and network charges. They are likely to increase further in the coming years due to the necessary evolution of the power production mix.
The electricity bill rose sharply between 2010 and 2012, before leveling off in 2013.
In 2012, retail prices for industrial users (500 MWh−2,000 MWh band) reached 178 €/MWh and were 64% above the European average (109 €/MWh). For industrial users, the 23% price increase between 2008 and 2012 was driven by tax increases (+58%) and grid costs to a lesser extent (+8%).
In 2014, there still exists a regulated tariff for households and SMEs. In February 2015, the Italian government proposed to suppress this regulated tariff by 2018.14 In 2012, residential customer retail prices reached 230 €/MWh for the 2.5 MWh−5 MWh consumption band, which is 34% higher than the European average (171 €/MWh in 2012). The 8% rise since 2008 is the result of an increase in taxes (+42%) and a decrease in grid costs (-10%). Electricity prices for domestic customers are progressive, i.e. increase with consumption.
The general tendency of electricity prices to rise for fi nal consumers is mainly driven by grid costs and increasing taxes to support renewables development, as well as additional measures to promote energy effi ciency. Furthermore, the energy component of consumer electricity bills is infl uenced by the peculiar Italian electricity mix, which is based mostly on gas. The electricity bill for all fi nal consumers increased in the last few years, but not uniformly, with wide differences between consumers depending on the amount of their consumption. No provisions are in place to reduce charges to electricity-intensive consumers, unlike in most other countries. The price dynamic for industrial users also raises competitive issues for the economy: as an example, a mid-size industrial company with two similar producing facilities in Finland and in Italy will receive an electricity bill of 75 €/MWh from Finland and of more than 200 €/MWh from Italy.
Industrial Residential
Figure 8. Retail prices for industrial12 and residential13 users (€/MWh)
0
50
100
150
200
201220102008
23
104
18
145€
16%
72%
12%
86
32
21
139€
23%
62%
15%
55
104
20
178€
31%
58%
11%0
50
100
150
200
250
201220102008
54
111
47
212€
26%
52%
22%
53
94
45
192€
28%
49%
23%
77
111
42
230€
34%
48%
18%
Grid Energy and supply Taxes Grid Energy and supply Taxes
12 Source: Eurostat. © European Union, 1995-2015 500–2,000 MWh band
13 Source: Eurostat. © European Union, 1995-2015 2.5–5.0 MWh band
14 Reuters, February 20, 2015
496
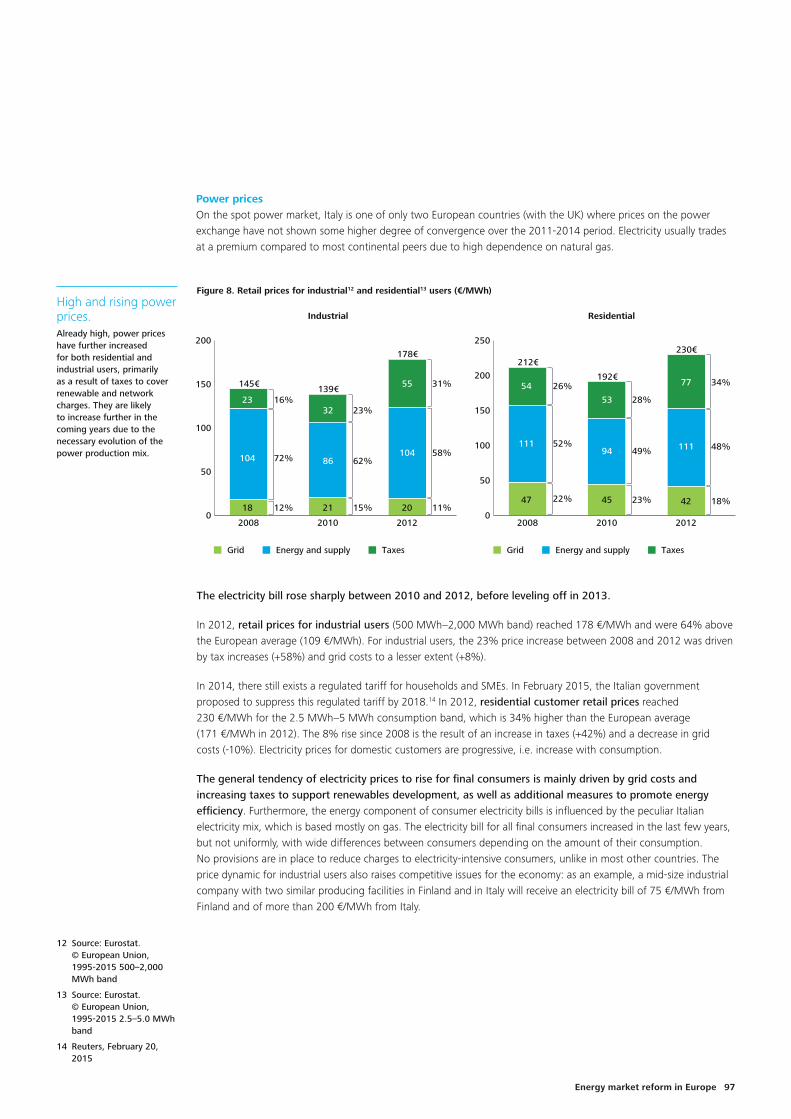
To start a new section, hold down the apple+shift keys and click
to release this object and type the section title in the box below.
Non-hydropower renewable energy production capacity increased very sharply between 2008 and 2013. Wind and biomass power generation capacities multiplied by two during this period, with an accelerated growth in 2012 (+140% and +155%, respectively, versus 2011). The positive trend is expected to continue.
In 2011, photovoltaic (PV) installed capacity boomed as a result of the generous prices offered under the Conto Energia and Salva Alcoa law, although it slowed down in 2013 after certain incentives to solar farms on agricultural land were eliminated (this took place on July 6, 2013, 30 calendar days after reaching the indicative cumulative cost of incentives of € 6.7 billion per year). That said, PV growth is expected to continue unabated until 2020 (+50%). Geothermal power capacity growth has been weak (+9%) and will probably be slow until 2020 (+22%). Hydropower capacity has remained fairly stable (+4%) and should remain so until 2020 (+3%).4
Power market: main actors
Since the 1990s, regulations have been based on two main pillars: limiting the power generation of former monopolist Enel, and unbundling generation, transmission and retail companies, which led to the introduction of a free market for the sale of electricity to customers. Retail market liberalization started in 1999 with the passing of the so-called “Bersani Decree”.9
Today, the Italian power market is fairly dispersed. Electricity generation is still dominated by Enel (25.4% of 2012 Italian power production), followed by Eni (9.5%), Edison (7.2%), E.On (4.4%) and other producers to a lesser degree.10
The Italian electricity transmission network is almost entirely owned and operated by Terna, a state-owned company. The power distribution market is also very concentrated, with Enel operating 86% of the network despite the existence of more than 133 local operators,11 mainly municipal.
Figure 6. Electrical capacity change 2010-2012 (GW)7
0
2
4
6
8
10
12
14
Solar PVWindHydroCombustible fuel
4.1
0.4 2.3
13.0
Midstream DownstreamUpstream
Liberalizedactivities
Generation
Import
Transmission, Dispatching
& Grid Development(Italy TSO – Terna S.p.A.)
Electricity Market
Distribution
MPE
MTEFree Market
Retail
Regulated Market
MGP MI MSD
Activities innatural monopoly
Activities subjectto licence
GME Liberalizedactivities
Figure 7. Market mechanism/actors8
7 Source: Eurostat. © European Union, 1995-2015 (http://appsso.eurostat.ec.europa.eu/nui/show.do?dataset=nrg_113a&lang=en)
8 GME = Gestore dei Mercati Energetici S.p.A.; GSE = Gestore dei Services Energetici S.p.A.
9 Legislative Decree March 16, 1999, no. 79
10 AEEGSI Autorità per l’energia elettrica, il gas e il sistema idrico (August 2013). Contributo dei principali operatori alla produzione nazionale lorda, http://www.autorita.energia.it/it/dati/eem30.htm
11 AEEGSI Autorità per l’energia elettrica, il gas e il sistema idrico (2013). Relazione annuale sullo stato ei servizi e sull’attività svolta
3
To start a new section, hold down the apple+shift keys and click
to release this object and type the section title in the box below.
To start a new section, hold down the apple+shift keys and click
to release this object and type the section title in the box below.
Power pricesOn the spot power market, Italy is one of only two European countries (with the UK) where prices on the power exchange have not shown some higher degree of convergence over the 2011-2014 period. Electricity usually trades at a premium compared to most continental peers due to high dependence on natural gas.
High and rising power prices.Already high, power prices have further increased for both residential and industrial users, primarily as a result of taxes to cover renewable and network charges. They are likely to increase further in the coming years due to the necessary evolution of the power production mix.
The electricity bill rose sharply between 2010 and 2012, before leveling off in 2013.
In 2012, retail prices for industrial users (500 MWh−2,000 MWh band) reached 178 €/MWh and were 64% above the European average (109 €/MWh). For industrial users, the 23% price increase between 2008 and 2012 was driven by tax increases (+58%) and grid costs to a lesser extent (+8%).
In 2014, there still exists a regulated tariff for households and SMEs. In February 2015, the Italian government proposed to suppress this regulated tariff by 2018.14 In 2012, residential customer retail prices reached 230 €/MWh for the 2.5 MWh−5 MWh consumption band, which is 34% higher than the European average (171 €/MWh in 2012). The 8% rise since 2008 is the result of an increase in taxes (+42%) and a decrease in grid costs (-10%). Electricity prices for domestic customers are progressive, i.e. increase with consumption.
The general tendency of electricity prices to rise for fi nal consumers is mainly driven by grid costs and increasing taxes to support renewables development, as well as additional measures to promote energy effi ciency. Furthermore, the energy component of consumer electricity bills is infl uenced by the peculiar Italian electricity mix, which is based mostly on gas. The electricity bill for all fi nal consumers increased in the last few years, but not uniformly, with wide differences between consumers depending on the amount of their consumption. No provisions are in place to reduce charges to electricity-intensive consumers, unlike in most other countries. The price dynamic for industrial users also raises competitive issues for the economy: as an example, a mid-size industrial company with two similar producing facilities in Finland and in Italy will receive an electricity bill of 75 €/MWh from Finland and of more than 200 €/MWh from Italy.
Industrial Residential
Figure 8. Retail prices for industrial12 and residential13 users (€/MWh)
0
50
100
150
200
201220102008
23
104
18
145€
16%
72%
12%
86
32
21
139€
23%
62%
15%
55
104
20
178€
31%
58%
11%0
50
100
150
200
250
201220102008
54
111
47
212€
26%
52%
22%
53
94
45
192€
28%
49%
23%
77
111
42
230€
34%
48%
18%
Grid Energy and supply Taxes Grid Energy and supply Taxes
12 Source: Eurostat. © European Union, 1995-2015 500–2,000 MWh band
13 Source: Eurostat. © European Union, 1995-2015 2.5–5.0 MWh band
14 Reuters, February 20, 2015
4 97Energy market reform in Europe
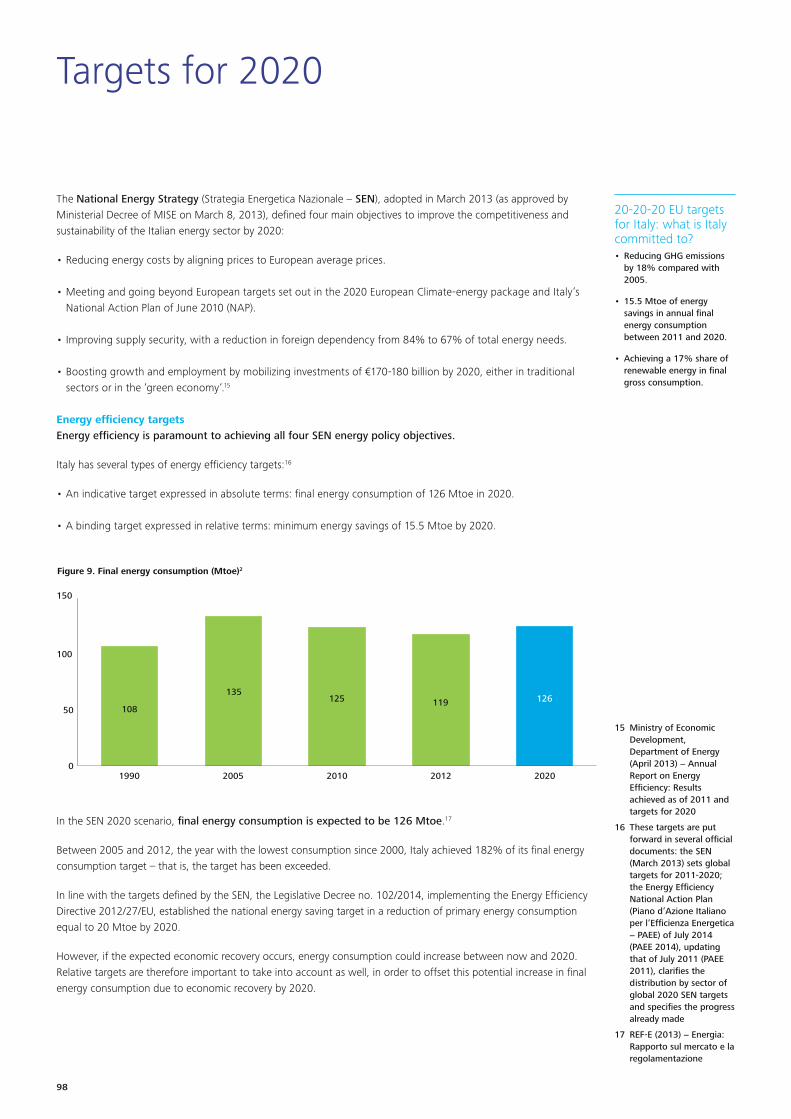
To start a new section, hold down the apple+shift keys and click
to release this object and type the section title in the box below.
Targets for 2020
20-20-20 EU targets for Italy: what is Italy committed to?• Reducing GHG emissions
by 18% compared with 2005.
• 15.5 Mtoe of energy savings in annual fi nal energy consumption between 2011 and 2020.
• Achieving a 17% share of renewable energy in fi nal gross consumption.
15 Ministry of Economic Development, Department of Energy (April 2013) − Annual Report on Energy Effi ciency: Results achieved as of 2011 and targets for 2020
16 These targets are put forward in several offi cial documents: the SEN (March 2013) sets global targets for 2011-2020; the Energy Effi ciency National Action Plan (Piano d’Azione Italiano per l’Effi cienza Energetica − PAEE) of July 2014 (PAEE 2014), updating that of July 2011 (PAEE 2011), clarifi es the distribution by sector of global 2020 SEN targets and specifi es the progress already made
17 REF-E (2013) − Energia: Rapporto sul mercato e la regolamentazione
The National Energy Strategy (Strategia Energetica Nazionale − SEN), adopted in March 2013 (as approved by Ministerial Decree of MISE on March 8, 2013), defi ned four main objectives to improve the competitiveness and sustainability of the Italian energy sector by 2020:
• Reducing energy costs by aligning prices to European average prices.
• Meeting and going beyond European targets set out in the 2020 European Climate-energy package and Italy’s National Action Plan of June 2010 (NAP).
• Improving supply security, with a reduction in foreign dependency from 84% to 67% of total energy needs.
• Boosting growth and employment by mobilizing investments of €170-180 billion by 2020, either in traditional sectors or in the ‘green economy‘.15
Energy effi ciency targetsEnergy effi ciency is paramount to achieving all four SEN energy policy objectives.
Italy has several types of energy effi ciency targets:16
• An indicative target expressed in absolute terms: fi nal energy consumption of 126 Mtoe in 2020.
• A binding target expressed in relative terms: minimum energy savings of 15.5 Mtoe by 2020.
Figure 9. Final energy consumption (Mtoe)2
0
50
100
150
20202012201020051990
108
135125 119 126
In the SEN 2020 scenario, fi nal energy consumption is expected to be 126 Mtoe.17
Between 2005 and 2012, the year with the lowest consumption since 2000, Italy achieved 182% of its fi nal energy consumption target – that is, the target has been exceeded.
In line with the targets defi ned by the SEN, the Legislative Decree no. 102/2014, implementing the Energy Effi ciency Directive 2012/27/EU, established the national energy saving target in a reduction of primary energy consumption equal to 20 Mtoe by 2020.
However, if the expected economic recovery occurs, energy consumption could increase between now and 2020. Relative targets are therefore important to take into account as well, in order to offset this potential increase in fi nal energy consumption due to economic recovery by 2020.
5
To start a new section, hold down the apple+shift keys and click
to release this object and type the section title in the box below.
To start a new section, hold down the apple+shift keys and click
to release this object and type the section title in the box below.
Between 2011 and 2012, Italy realized 15% of its 2020 targeted fi nal energy savings. If this trend can be sustained until 2020, the targets are likely to be reached.Nevertheless, most of the targeted energy savings are still to be reached.
In fact, while fi nal energy consumption in 2012 was already below the 2020 target, Italy may have diffi culty reaching its energy saving targets. As far as energy saving targets are concerned, Italy is only at the beginning of its efforts. The expected savings in 2020 and the savings already achieved in 2012 (vs. 2011) are shown in the table below:
18 Regulation 443/2009/EC
19 Ministero dello Sviluppo Italiano − Strategia Energetica Nazionale: per un’energia più competitiva e sostenibile (March 2013)
20 Directive 2002/91/EC (EPBD), transcribed into the 192/05 decree
21 ENEA (Agenzia nazionale per le nuove tecnologie, l’energia e lo sviluppo economico sostenibile) (July 2014) – Piano d’Azione italiano per l’Effi cienza Energetica 2014
22 White certifi cates (“Energy Effi ciency Certifi cates”) are tradable instruments giving proof of the achievement of end-use energy savings through energy effi ciency improvement initiatives and projects for companies. The mechanism of white certifi cates was introduced in Italy by Ministerial Decree July 20, 2004. It was amended by Ministerial Decree December 28, 2012
Table 1. Expected savings for fi nal energy consumption (FEC) for 2011-2020 by sector and by measure (in Mtoe/year)
2013 Annual Report PAEE 2014
Expected FEC savings in 2020 Expected FEC
savings in 2020
(revised)
Achieved savings in 2012
(vs. 2011)
2020 objective
met (%)SectorRegulatory standards
Thermal account
55% tax relief
White certifi cates TOTAL
Residential 1.60 0.90 1.00 0.30 3.80 3.67 0.96 26%
Tertiary 0.20 1.60 – 0.20 2.00 1.23 0.05 4%
Industry – – – 4.20 4.20 5.10 1.09 21%
Transport 5.40 – – 0.10 5.50 5.50 0.22 4%
Total per measure(Mtoe/year)
7.20 2.50 1.00 4.80 15.50 15.50 2.33 15.0%
In 2012, savings were in line with the targets in both the industrial and residential sectors, while the tertiary and transport sectors were lagging. Nevertheless, this trend could decline by 2020 if the country’s economy recovers.
The PAEE 2014 sets out rather concrete measures for action and hints at how savings were achieved in 2011-2012. The main measures include:
• Strengthening the rules on minimum energy performance, especially for transport, construction and all products coming under the Ecodesign directive.
– The highest savings (5.5 Mtoe) are expected for transport, where a signifi cant reduction in energy consumption is expected due to regulations18 prescribing the sale of vehicles with reduced GHG emissions (95 gCO2eq/km in 2020).19 In 2012, only 0.2 Mtoe was achieved (vs. 2011).
– In the residential and tertiary sectors, the Directive on the energy performance of buildings20 helped save 2.3 Mtoe/y between 2005 and 2012 through replacement of thermal installations, particularly in residential buildings.21 1.8 Mtoe of energy savings are expected through the implementation of regulatory standards in these sectors.
• Developing a compulsory energy effi ciency scheme based on “white certifi cates.”22 Between 2005 and 2012, 3.0 Mtoe were saved through this mechanism. 4.8 Mtoe of additional energy savings are expected between 2012 and 2020 in all sectors.
698

To start a new section, hold down the apple+shift keys and click
to release this object and type the section title in the box below.
Targets for 2020
20-20-20 EU targets for Italy: what is Italy committed to?• Reducing GHG emissions
by 18% compared with 2005.
• 15.5 Mtoe of energy savings in annual fi nal energy consumption between 2011 and 2020.
• Achieving a 17% share of renewable energy in fi nal gross consumption.
15 Ministry of Economic Development, Department of Energy (April 2013) − Annual Report on Energy Effi ciency: Results achieved as of 2011 and targets for 2020
16 These targets are put forward in several offi cial documents: the SEN (March 2013) sets global targets for 2011-2020; the Energy Effi ciency National Action Plan (Piano d’Azione Italiano per l’Effi cienza Energetica − PAEE) of July 2014 (PAEE 2014), updating that of July 2011 (PAEE 2011), clarifi es the distribution by sector of global 2020 SEN targets and specifi es the progress already made
17 REF-E (2013) − Energia: Rapporto sul mercato e la regolamentazione
The National Energy Strategy (Strategia Energetica Nazionale − SEN), adopted in March 2013 (as approved by Ministerial Decree of MISE on March 8, 2013), defi ned four main objectives to improve the competitiveness and sustainability of the Italian energy sector by 2020:
• Reducing energy costs by aligning prices to European average prices.
• Meeting and going beyond European targets set out in the 2020 European Climate-energy package and Italy’s National Action Plan of June 2010 (NAP).
• Improving supply security, with a reduction in foreign dependency from 84% to 67% of total energy needs.
• Boosting growth and employment by mobilizing investments of €170-180 billion by 2020, either in traditional sectors or in the ‘green economy‘.15
Energy effi ciency targetsEnergy effi ciency is paramount to achieving all four SEN energy policy objectives.
Italy has several types of energy effi ciency targets:16
• An indicative target expressed in absolute terms: fi nal energy consumption of 126 Mtoe in 2020.
• A binding target expressed in relative terms: minimum energy savings of 15.5 Mtoe by 2020.
Figure 9. Final energy consumption (Mtoe)2
0
50
100
150
20202012201020051990
108
135125 119 126
In the SEN 2020 scenario, fi nal energy consumption is expected to be 126 Mtoe.17
Between 2005 and 2012, the year with the lowest consumption since 2000, Italy achieved 182% of its fi nal energy consumption target – that is, the target has been exceeded.
In line with the targets defi ned by the SEN, the Legislative Decree no. 102/2014, implementing the Energy Effi ciency Directive 2012/27/EU, established the national energy saving target in a reduction of primary energy consumption equal to 20 Mtoe by 2020.
However, if the expected economic recovery occurs, energy consumption could increase between now and 2020. Relative targets are therefore important to take into account as well, in order to offset this potential increase in fi nal energy consumption due to economic recovery by 2020.
5
To start a new section, hold down the apple+shift keys and click
to release this object and type the section title in the box below.
To start a new section, hold down the apple+shift keys and click
to release this object and type the section title in the box below.
Between 2011 and 2012, Italy realized 15% of its 2020 targeted fi nal energy savings. If this trend can be sustained until 2020, the targets are likely to be reached.Nevertheless, most of the targeted energy savings are still to be reached.
In fact, while fi nal energy consumption in 2012 was already below the 2020 target, Italy may have diffi culty reaching its energy saving targets. As far as energy saving targets are concerned, Italy is only at the beginning of its efforts. The expected savings in 2020 and the savings already achieved in 2012 (vs. 2011) are shown in the table below:
18 Regulation 443/2009/EC
19 Ministero dello Sviluppo Italiano − Strategia Energetica Nazionale: per un’energia più competitiva e sostenibile (March 2013)
20 Directive 2002/91/EC (EPBD), transcribed into the 192/05 decree
21 ENEA (Agenzia nazionale per le nuove tecnologie, l’energia e lo sviluppo economico sostenibile) (July 2014) – Piano d’Azione italiano per l’Effi cienza Energetica 2014
22 White certifi cates (“Energy Effi ciency Certifi cates”) are tradable instruments giving proof of the achievement of end-use energy savings through energy effi ciency improvement initiatives and projects for companies. The mechanism of white certifi cates was introduced in Italy by Ministerial Decree July 20, 2004. It was amended by Ministerial Decree December 28, 2012
Table 1. Expected savings for fi nal energy consumption (FEC) for 2011-2020 by sector and by measure (in Mtoe/year)
2013 Annual Report PAEE 2014
Expected FEC savings in 2020 Expected FEC
savings in 2020
(revised)
Achieved savings in 2012
(vs. 2011)
2020 objective
met (%)SectorRegulatory standards
Thermal account
55% tax relief
White certifi cates TOTAL
Residential 1.60 0.90 1.00 0.30 3.80 3.67 0.96 26%
Tertiary 0.20 1.60 – 0.20 2.00 1.23 0.05 4%
Industry – – – 4.20 4.20 5.10 1.09 21%
Transport 5.40 – – 0.10 5.50 5.50 0.22 4%
Total per measure(Mtoe/year)
7.20 2.50 1.00 4.80 15.50 15.50 2.33 15.0%
In 2012, savings were in line with the targets in both the industrial and residential sectors, while the tertiary and transport sectors were lagging. Nevertheless, this trend could decline by 2020 if the country’s economy recovers.
The PAEE 2014 sets out rather concrete measures for action and hints at how savings were achieved in 2011-2012. The main measures include:
• Strengthening the rules on minimum energy performance, especially for transport, construction and all products coming under the Ecodesign directive.
– The highest savings (5.5 Mtoe) are expected for transport, where a signifi cant reduction in energy consumption is expected due to regulations18 prescribing the sale of vehicles with reduced GHG emissions (95 gCO2eq/km in 2020).19 In 2012, only 0.2 Mtoe was achieved (vs. 2011).
– In the residential and tertiary sectors, the Directive on the energy performance of buildings20 helped save 2.3 Mtoe/y between 2005 and 2012 through replacement of thermal installations, particularly in residential buildings.21 1.8 Mtoe of energy savings are expected through the implementation of regulatory standards in these sectors.
• Developing a compulsory energy effi ciency scheme based on “white certifi cates.”22 Between 2005 and 2012, 3.0 Mtoe were saved through this mechanism. 4.8 Mtoe of additional energy savings are expected between 2012 and 2020 in all sectors.
6 99Energy market reform in Europe

To start a new section, hold down the apple+shift keys and click
to release this object and type the section title in the box below.
• Stabilizing the instrument in operation since 2007 for a 55% tax relief on expenditures to upgrade the energy effi ciency of buildings. Between 2005 and 2012, 0.77 Mtoe were saved through this mechanism. One million of tons of oil equivalent of additional energy savings are expected between 2012 and 2020.
• Introducing support tools such as the thermal energy account,23 and the Energy Performance Contract (EPC). The thermal energy account is an incentive for small projects designed to increase buildings’ energy effi ciency and generate thermal energy from renewable sources. The incentive is indexed to the project’s expected capacity to produce thermal energy.24 The Energy Performance Contract is a form of ‘creative fi nancing’ for capital improvement which allows funding energy upgrades from cost reductions.25 2.5 Mtoe of additional energy savings are expected by 2020.
Renewable energy targetsAccording to the 2009/28/EC Directive,26 17% of Italy’s fi nal energy consumption in 2020 should come from renewable sources, vs. 5.9% in 2005 and 13.5% in 2012. Between 2005 and 2012, Italy realized 68% of its renewable target (expressed in Mtoe).27
If the SEN energy effi ciency target (126 Mtoe of fi nal energy consumption in 2020) is reached, 21.4 Mtoe of fi nal energy consumption should come from renewables in 2020, compared to 17 Mtoe in 2012, 11 Mtoe in 2008 and 8 Mtoe in 2004. This means an additional 5.3 Mtoe will still be needed by 2020.2 Given current trends, this target seems reachable.
110
115
120
125
130
135
2020201220082004
Figure 10. Renewable energy share of final energy use (2012)28
Final Energy Consumption (Mtoe) Share of Renewables (%)
0%
5%
10%
15%
20%
23 ‘Conto Termico’, following the Ministerial Decree of December 28, 2012 as published on January 2, 2013. Recently, on last November 11, 2014, Law no. 164 has lastly regulated the incentives for “thermal energy account” (Heating and cooling)
24 GSE website http://www.gse.it/
25 http://ec.europa.eu. © European Union, 1995-2015 http://iet.jrc.ec.europa.eu/energyeffi ciency/european-energy-service-companies/energy-performance-contracting
26 This Directive was implemented in Italy with the Legislative Decree March 3, 2011 no. 28, regarding the promotion of energy by renewable sources. Such Decree provides for the specifi c authorization procedure to realize renewable energy plants
27 The initial gap between 2005 and 2020 was an increase by 13.4 Mtoe (from 8 to 21.4 Mtoe). And between 2005 and 2012, an increase by 9 Mtoe (from 8 to 17 Mtoe), has already been achieved, representing 68% of the target
28 Source: Eurostat. © European Union, 1995-2015
7
To start a new section, hold down the apple+shift keys and click
to release this object and type the section title in the box below.
To start a new section, hold down the apple+shift keys and click
to release this object and type the section title in the box below.
29 EEA: Renewable Energy Projections as Published in the National Renewable Energy Action Plans of the European Member States
30 REF-E (2013) − Energia: Rapporto sul mercato e la regolamentazione & Italian National Renewable Energy Action Plan (June 30th 2010) data
31 NREAP, Table 10ab on page 164
Italy’s NAP estimates the contribution of each renewable energy technology to the trajectory for 2020 targets in the electricity, heating and cooling, and transport sectors, without necessarily establishing any binding technology target.
The SEN, published in 2013, included projections for the share of renewable electricity in fi nal consumption (as foreseen by REF-E30) higher than the initial NAP target (2010). This is due to a higher volume of renewable energy in absolute terms and decreasing electricity consumption, mainly as a result of the economic crisis, affecting more fossil-based generation. In the SEN projection, renewable electricity production should reach 99 GWh,31 close to gas-fi red generation, the fi rst component of Italy’s electricity generation mix.
Other sectors should also contribute to the renewable energy target. In the residential and tertiary sectors, biomass use and other renewables are promoted for heating (thanks to the thermal energy account, mentioned above). The main national mechanisms to promote the use of renewable resources for heating and cooling are energy effi ciency credits and tax deductions. The technologies that can benefi t from these mechanisms include solar thermal installations, biomass boilers, heat pumps (aerothermal, hydrothermal, geothermal), low-temperature geothermal systems, geothermal cogeneration systems, and those fed by biomass and waste.
For transport, biofuel incorporation should also play a role in reaching this target. Actions will be taken mainly through obligatory minimum quotas, encouraging the use of biofuels obtained from waste and other raw materials of non-food origin. Measures will aim to support the use of a 25% biodiesel mix (for example, in public transport fl eets) and new national regulations will encourage a gradual increase in its percentage of adoption. The obligation mechanism might be extended to biomethane, and greater weight might be given to the use of biogas for transportation. Finally, the energy effi ciency credits scheme might be extended to include the growing use of electric vehicles.
Figure 11. Renewable energy share of final energy use by type and target for 2020, in %29
0%
2%
4%
6%
8%
10%
12%
14%
16%
18%
TotalBiofuelsOther heatingsectors
Heatpumps
Solidbiomass
Other electricitysectors
WindHydro
2005 2010 2020
Italy has already realized 68% of its 2020 renewable target, thanks mainly to a sharp increase in non-hydropower power production capacity between 2008 and 2012.Italy is on the right path to reach the EU targets, and its latest energy projection for 2020 forecasts a share of renewable energy higher than the initial target.
8100

To start a new section, hold down the apple+shift keys and click
to release this object and type the section title in the box below.
• Stabilizing the instrument in operation since 2007 for a 55% tax relief on expenditures to upgrade the energy effi ciency of buildings. Between 2005 and 2012, 0.77 Mtoe were saved through this mechanism. One million of tons of oil equivalent of additional energy savings are expected between 2012 and 2020.
• Introducing support tools such as the thermal energy account,23 and the Energy Performance Contract (EPC). The thermal energy account is an incentive for small projects designed to increase buildings’ energy effi ciency and generate thermal energy from renewable sources. The incentive is indexed to the project’s expected capacity to produce thermal energy.24 The Energy Performance Contract is a form of ‘creative fi nancing’ for capital improvement which allows funding energy upgrades from cost reductions.25 2.5 Mtoe of additional energy savings are expected by 2020.
Renewable energy targetsAccording to the 2009/28/EC Directive,26 17% of Italy’s fi nal energy consumption in 2020 should come from renewable sources, vs. 5.9% in 2005 and 13.5% in 2012. Between 2005 and 2012, Italy realized 68% of its renewable target (expressed in Mtoe).27
If the SEN energy effi ciency target (126 Mtoe of fi nal energy consumption in 2020) is reached, 21.4 Mtoe of fi nal energy consumption should come from renewables in 2020, compared to 17 Mtoe in 2012, 11 Mtoe in 2008 and 8 Mtoe in 2004. This means an additional 5.3 Mtoe will still be needed by 2020.2 Given current trends, this target seems reachable.
110
115
120
125
130
135
2020201220082004
Figure 10. Renewable energy share of final energy use (2012)28
Final Energy Consumption (Mtoe) Share of Renewables (%)
0%
5%
10%
15%
20%
23 ‘Conto Termico’, following the Ministerial Decree of December 28, 2012 as published on January 2, 2013. Recently, on last November 11, 2014, Law no. 164 has lastly regulated the incentives for “thermal energy account” (Heating and cooling)
24 GSE website http://www.gse.it/
25 http://ec.europa.eu. © European Union, 1995-2015 http://iet.jrc.ec.europa.eu/energyeffi ciency/european-energy-service-companies/energy-performance-contracting
26 This Directive was implemented in Italy with the Legislative Decree March 3, 2011 no. 28, regarding the promotion of energy by renewable sources. Such Decree provides for the specifi c authorization procedure to realize renewable energy plants
27 The initial gap between 2005 and 2020 was an increase by 13.4 Mtoe (from 8 to 21.4 Mtoe). And between 2005 and 2012, an increase by 9 Mtoe (from 8 to 17 Mtoe), has already been achieved, representing 68% of the target
28 Source: Eurostat. © European Union, 1995-2015
7
To start a new section, hold down the apple+shift keys and click
to release this object and type the section title in the box below.
To start a new section, hold down the apple+shift keys and click
to release this object and type the section title in the box below.
29 EEA: Renewable Energy Projections as Published in the National Renewable Energy Action Plans of the European Member States
30 REF-E (2013) − Energia: Rapporto sul mercato e la regolamentazione & Italian National Renewable Energy Action Plan (June 30th 2010) data
31 NREAP, Table 10ab on page 164
Italy’s NAP estimates the contribution of each renewable energy technology to the trajectory for 2020 targets in the electricity, heating and cooling, and transport sectors, without necessarily establishing any binding technology target.
The SEN, published in 2013, included projections for the share of renewable electricity in fi nal consumption (as foreseen by REF-E30) higher than the initial NAP target (2010). This is due to a higher volume of renewable energy in absolute terms and decreasing electricity consumption, mainly as a result of the economic crisis, affecting more fossil-based generation. In the SEN projection, renewable electricity production should reach 99 GWh,31 close to gas-fi red generation, the fi rst component of Italy’s electricity generation mix.
Other sectors should also contribute to the renewable energy target. In the residential and tertiary sectors, biomass use and other renewables are promoted for heating (thanks to the thermal energy account, mentioned above). The main national mechanisms to promote the use of renewable resources for heating and cooling are energy effi ciency credits and tax deductions. The technologies that can benefi t from these mechanisms include solar thermal installations, biomass boilers, heat pumps (aerothermal, hydrothermal, geothermal), low-temperature geothermal systems, geothermal cogeneration systems, and those fed by biomass and waste.
For transport, biofuel incorporation should also play a role in reaching this target. Actions will be taken mainly through obligatory minimum quotas, encouraging the use of biofuels obtained from waste and other raw materials of non-food origin. Measures will aim to support the use of a 25% biodiesel mix (for example, in public transport fl eets) and new national regulations will encourage a gradual increase in its percentage of adoption. The obligation mechanism might be extended to biomethane, and greater weight might be given to the use of biogas for transportation. Finally, the energy effi ciency credits scheme might be extended to include the growing use of electric vehicles.
Figure 11. Renewable energy share of final energy use by type and target for 2020, in %29
0%
2%
4%
6%
8%
10%
12%
14%
16%
18%
TotalBiofuelsOther heatingsectors
Heatpumps
Solidbiomass
Other electricitysectors
WindHydro
2005 2010 2020
Italy has already realized 68% of its 2020 renewable target, thanks mainly to a sharp increase in non-hydropower power production capacity between 2008 and 2012.Italy is on the right path to reach the EU targets, and its latest energy projection for 2020 forecasts a share of renewable energy higher than the initial target.
8 101Energy market reform in Europe

To start a new section, hold down the apple+shift keys and click
to release this object and type the section title in the box below.
Italy over-achieved its GHG emission target, partly because of the economic crisis.But the country has committed to more ambitious emission reduction targets. And some additional reductions in GHG emissions are expected through energy effi ciency and renewable energy measures.
Economic recovery might be an issue in terms of growing emissions, but measures for energy effi ciency should support a reduction path.
CO2 emissions and targetsBy 2020, Italy is committed to an 18% reduction in global GHG emissions, with a 21% reduction in Emissions Trading System (ETS) sectors and a 13% reduction in non-ETS sectors, compared to 2005.19,32
• In 2005, GHG emissions from the non-ETS sector amounted to 340 Mt CO2eq. The target set by the European Commission is to reduce GHG emissions in this sector by 13% between 2005 and 2020 (i.e. by 44 Mt CO2eq to reach 296 Mt CO2eq).2 By 2012, Italy had achieved 130% of its target.
• In 2005, global GHG emissions for Italy amounted to 583 Mt CO22eq.33 Since the target to 2020 is an 18% reduction in GHG emissions, in 2012 Italy achieved 109% of its target.
32 Decision 406/2009/EC on the Effort of Member States to reduce their Greenhouse gas emissions to meet the Community’s GHG emissions reduction commitments up to 2020, April 2009
33 Source: Eurostat. © European Union, 1995-2015, http://epp.eurostat.ec.europa.eu/statistics_explained/index.php?title=Greenhouse_gas_emission_statistics&oldid=189476#Database
0
100
200
300
400
500
600
700
2020201220102005
Figure 12. ETS & non-ETS sector GHG emissions between 2005 and 2012 and targets for 2020 (2020 European targetand SEN global target) (Mt CO2)
2,33
ETS sector emissions Non-ETS sector emissions Global GHG emissionsSEN 2020 Target
340
243
583
307
202
509
283
186
469461
296
182
478
The achievement of 2020 European targets for Italy as of 2012 is both due to the effects of the economic crisis and to abatement measures (efforts towards energy effi ciency and renewable energy) that have been put in place. However, the National Energy Strategy is more ambitious than European goals for Italy and targets a 21% decrease in global GHG emissions (ETS and non-ETS) between 2005 and 2020.
The National Plan for the Reduction of Greenhouse Gases, updated with a 2013 decision of the CIPE (Interministerial Committee for Economic Planning), reinforced the country’s commitment to emission reduction targets and energy saving measures. According to the SEN, energy effi ciency measures should facilitate a reduction of 55 Mt CO2eq/year, equal to 50% of the target set in the national CO2 reduction plan.
9
To start a new section, hold down the apple+shift keys and click
to release this object and type the section title in the box below.
To start a new section, hold down the apple+shift keys and click
to release this object and type the section title in the box below.
Road ahead and main challenges: the way to 2030 and beyond
European market reform: where Italy standsTo date, Italy has implemented several policy measures to reach its 2020 targets regarding energy effi ciency, renewables and GHG emissions. Many objectives have already been met due to the impact of the economic crisis on the country. The main question that remains is to determine whether an economic turnaround will compromise Italy’s ability to reach it effi ciency objectives. After 2020, the National Energy Strategy becomes vague regarding how 2030 and 2050 targets will be met.
Despite the crisis, the National Energy Strategy contemplates Italy taking a leadership role in the adoption of the European 2050 Energy Roadmap. It has an ambitious plan aiming at carbon reduction in the order of 80-95% relative to the 1990 level by 2050. The goals are expected to be met through a reinforcement of the mechanisms put in place for the 20-20-20 energy package.
While the SEN does not detail how these targets may be achieved, it does indicate that the attainment of post-2020 targets is conditional on the capacity of the European Union to design a roadmap that is robust yet fl exible.
Ensuring energy market competitivenessThe energy sector affects Italy’s global competitiveness because of some structural weaknesses.
Energy prices are among the highest in Europe, and are particularly high relative to the US. That is because the energy mix, especially for electricity, is based on gas (with prices that are only recently aligning to European market ones), which differs from the average European mix infl uenced predominantly by nuclear and coal. Incentives for renewables also have a signifi cant impact on electricity prices, as do a host of regulatory costs, including tariffs (to dismantle nuclear plants, conduct system research and support special regimes) and other subsidies.
Additionally, Italy’s security of supply and energy independence is at particular risk. In 2012, 82% of national demand (163 Mtoe2) was met by net imports, with national production from renewables, gas and oil accounting for only 11.1%, 4.3% and 3.5%, respectively. This compares with an average import level of roughly 55% among the 28 countries of the EU.
The energy system, however, does have some strong points.
Italy is one of the countries with the lowest energy intensity levels (-19% of primary energy intensity vs. -14% in the Eurozone in 2011). Final energy use has been declining in recent years (equivalent to 119 Mtoe in 2012, 2% less than in 2011). This is largely due to the economic crisis, although a 5% decrease since 2005 can be attributed to improvements in electric generation performance, as well as the active adoption of numerous energy effi ciency measures (i.e., fi scal, white certifi cates, etc.).The American Council for an Energy-Effi cient Economy (ACEEE) placed Italy in third place in 2011, just behind England and Germany, in recognition of these efforts.
Italy also enjoys a good level of technological advancement, with leading programs such as smart metering – an essential element of demand side management, and the installation of one of the world’s most effi cient CCGTs (combined cycle gas turbines) parks.21
Severely hit by the economic crisis, Italy has nonetheless set very ambitious targets until 2050.But it remains vague on how 2030 and 2050 targets will be met.
Energy (especially electricity) prices have been signifi cantly higher than the European average for years. This may have helped Italy develop renewable energies and reduce its average energy intensity, but it may also hinder its competitiveness.
21 Source: REF-E
10102

To start a new section, hold down the apple+shift keys and click
to release this object and type the section title in the box below.
Italy over-achieved its GHG emission target, partly because of the economic crisis.But the country has committed to more ambitious emission reduction targets. And some additional reductions in GHG emissions are expected through energy effi ciency and renewable energy measures.
Economic recovery might be an issue in terms of growing emissions, but measures for energy effi ciency should support a reduction path.
CO2 emissions and targetsBy 2020, Italy is committed to an 18% reduction in global GHG emissions, with a 21% reduction in Emissions Trading System (ETS) sectors and a 13% reduction in non-ETS sectors, compared to 2005.19,32
• In 2005, GHG emissions from the non-ETS sector amounted to 340 Mt CO2eq. The target set by the European Commission is to reduce GHG emissions in this sector by 13% between 2005 and 2020 (i.e. by 44 Mt CO2eq to reach 296 Mt CO2eq).2 By 2012, Italy had achieved 130% of its target.
• In 2005, global GHG emissions for Italy amounted to 583 Mt CO22eq.33 Since the target to 2020 is an 18% reduction in GHG emissions, in 2012 Italy achieved 109% of its target.
32 Decision 406/2009/EC on the Effort of Member States to reduce their Greenhouse gas emissions to meet the Community’s GHG emissions reduction commitments up to 2020, April 2009
33 Source: Eurostat. © European Union, 1995-2015, http://epp.eurostat.ec.europa.eu/statistics_explained/index.php?title=Greenhouse_gas_emission_statistics&oldid=189476#Database
0
100
200
300
400
500
600
700
2020201220102005
Figure 12. ETS & non-ETS sector GHG emissions between 2005 and 2012 and targets for 2020 (2020 European targetand SEN global target) (Mt CO2)
2,33
ETS sector emissions Non-ETS sector emissions Global GHG emissionsSEN 2020 Target
340
243
583
307
202
509
283
186
469461
296
182
478
The achievement of 2020 European targets for Italy as of 2012 is both due to the effects of the economic crisis and to abatement measures (efforts towards energy effi ciency and renewable energy) that have been put in place. However, the National Energy Strategy is more ambitious than European goals for Italy and targets a 21% decrease in global GHG emissions (ETS and non-ETS) between 2005 and 2020.
The National Plan for the Reduction of Greenhouse Gases, updated with a 2013 decision of the CIPE (Interministerial Committee for Economic Planning), reinforced the country’s commitment to emission reduction targets and energy saving measures. According to the SEN, energy effi ciency measures should facilitate a reduction of 55 Mt CO2eq/year, equal to 50% of the target set in the national CO2 reduction plan.
9
To start a new section, hold down the apple+shift keys and click
to release this object and type the section title in the box below.
To start a new section, hold down the apple+shift keys and click
to release this object and type the section title in the box below.
Road ahead and main challenges: the way to 2030 and beyond
European market reform: where Italy standsTo date, Italy has implemented several policy measures to reach its 2020 targets regarding energy effi ciency, renewables and GHG emissions. Many objectives have already been met due to the impact of the economic crisis on the country. The main question that remains is to determine whether an economic turnaround will compromise Italy’s ability to reach it effi ciency objectives. After 2020, the National Energy Strategy becomes vague regarding how 2030 and 2050 targets will be met.
Despite the crisis, the National Energy Strategy contemplates Italy taking a leadership role in the adoption of the European 2050 Energy Roadmap. It has an ambitious plan aiming at carbon reduction in the order of 80-95% relative to the 1990 level by 2050. The goals are expected to be met through a reinforcement of the mechanisms put in place for the 20-20-20 energy package.
While the SEN does not detail how these targets may be achieved, it does indicate that the attainment of post-2020 targets is conditional on the capacity of the European Union to design a roadmap that is robust yet fl exible.
Ensuring energy market competitivenessThe energy sector affects Italy’s global competitiveness because of some structural weaknesses.
Energy prices are among the highest in Europe, and are particularly high relative to the US. That is because the energy mix, especially for electricity, is based on gas (with prices that are only recently aligning to European market ones), which differs from the average European mix infl uenced predominantly by nuclear and coal. Incentives for renewables also have a signifi cant impact on electricity prices, as do a host of regulatory costs, including tariffs (to dismantle nuclear plants, conduct system research and support special regimes) and other subsidies.
Additionally, Italy’s security of supply and energy independence is at particular risk. In 2012, 82% of national demand (163 Mtoe2) was met by net imports, with national production from renewables, gas and oil accounting for only 11.1%, 4.3% and 3.5%, respectively. This compares with an average import level of roughly 55% among the 28 countries of the EU.
The energy system, however, does have some strong points.
Italy is one of the countries with the lowest energy intensity levels (-19% of primary energy intensity vs. -14% in the Eurozone in 2011). Final energy use has been declining in recent years (equivalent to 119 Mtoe in 2012, 2% less than in 2011). This is largely due to the economic crisis, although a 5% decrease since 2005 can be attributed to improvements in electric generation performance, as well as the active adoption of numerous energy effi ciency measures (i.e., fi scal, white certifi cates, etc.).The American Council for an Energy-Effi cient Economy (ACEEE) placed Italy in third place in 2011, just behind England and Germany, in recognition of these efforts.
Italy also enjoys a good level of technological advancement, with leading programs such as smart metering – an essential element of demand side management, and the installation of one of the world’s most effi cient CCGTs (combined cycle gas turbines) parks.21
Severely hit by the economic crisis, Italy has nonetheless set very ambitious targets until 2050.But it remains vague on how 2030 and 2050 targets will be met.
Energy (especially electricity) prices have been signifi cantly higher than the European average for years. This may have helped Italy develop renewable energies and reduce its average energy intensity, but it may also hinder its competitiveness.
21 Source: REF-E
10 103Energy market reform in Europe

To start a new section, hold down the apple+shift keys and click
to release this object and type the section title in the box below.
34 SEN provides that Italian Government shall identify, in compliance with EU Regulation 347/2013, Project of Common Interest (PIC) in gas and electricity sector that will benefi t from procedural and fi nancial advantages. Italy is waiting for the regulation that will provide the criteria and identifi cation of the competent authority for PIC
Beyond 2020, Italy has committed to an even greater market penetration for renewables and more stringent energy effi ciency measures, although it is unclear on the technologies that should be implemented to support these goals.The renewable technologies that will ultimately be favored will depend on market conditions and technological breakthroughs.
Italy’s energy mix post-2020 and the role of renewablesGiven the extent of change likely to occur in the coming years, the SEN did not set specifi c sectorial or technological objectives. It prefers to be technology neutral and fl exible to changes in market conditions as part of its long-term strategy.
Italy plans to implement a capacity market in the power sector very shortly and is currently developing an auction model with reliability contracts. The fi rst auction took place in 2014.
While Italy has not yet articulated a clear objective for its energy mix in 2030, the SEN anticipates that more than 29% of fi nal energy produced will come from renewable sources by 2030. Italy has even developed a tentative scenario where 50% of fi nal energy produced would come from renewable sources. Considering the generation potential of each energy source, a signifi cant solar capacity would need to be installed to reach such a goal. According to ENEA, solar has the greatest development potential among renewables both in technological and economic terms, given that it has reached grid parity and has low installation costs.
In this context, coal is not in favor, both due to the need to reduce GHG emissions and to mounting public and local community opposition to coal (a situation amply highlighted by an Italian court’s decision to shut down a coal-fi red power plant for environmental health reasons in 2014). A signifi cant investment in coal-fi red plants in Italy therefore seems unlikely, even if some plans exist to convert oil-fi red to carbon-fi red plants. Some major electricity producers believe coal could still be viable, given both its falling prices and the emerging availability of improved carbon mitigation technologies, arguing that these investments would be less costly than (more effi cient and environmental-friendly) gas technologies and could potentially reduce Italy’s reliance on imports from largely-unstable countries.
With regard to nuclear power, a referendum in June 2011 repealed provisions relating to the so-called nuclear Omnibus Decree. Roughly 54% of the population turned out for the vote and more than 94% of those voters opposed the government’s plan to resume nuclear power generation. This put a defi nite halt to Italy’s nuclear program. Nevertheless, Italy imports electricity from countries such as France, Switzerland and Slovenia, whose energy mixes are nuclear rich. The country is also involved in international research and cooperation focused on improving nuclear safety and waste management. Should solutions be found, nuclear could arguably satisfy Italy’s energy demand for a very long time.
In the short term, however, Italy will continue to rely on imports, and will need to adapt its distribution grid and expand its connections with renewable energy-exporting countries, probably in the Balkans and North Africa, to better diversify the sources of its electricity supply. Projects to connect Italy’s grid with neighboring countries are also in progress (e.g. the ELMED project with Tunisia), and could potentially position Italy to act as an energy hub for the EU.34
ConclusionItaly has already achieved most of its energy and GHG emission objectives for 2020, predominantly due to decreased energy consumption linked to the economic crisis. The challenge will be to keep meeting these targets as the economy recovers.
It is clear that the 2050 Energy Roadmap will drive structural changes in Italy’s energy markets. From a competitive standpoint, and to support economic growth, it is important that the transition not penalize the Italian and European economies, particularly in those sectors exposed to international competition.
Public support in Italy may shift from a focus on renewables to one on energy effi ciency. In fact, Italy’s incentives system introduces distortions with respect to the cost of public resources allocated for each unit of CO2 avoided. As part of the country’s energy saving incentives, the public cost of energy per MWh is now 25 times lower than the public cost to support renewables. Although this has contributed to the adoption of not-yet-mature renewable technologies, in the long term it may not result in the system most capable of reducing emissions. As such, it is becoming more important for Italy to dedicate public resources to R&D that may result in future technological breakthroughs.
11
Selected bibliographic references
Europe 2020 Targets [online] available on: http://epp.eurostat.ec.europa.eu/portal/page/portal/europe_2020_indicators/headline_indicators, Source: Eurostat. © European Union, 1995-2015
European Commission – Climate and energy priorities for Europe – the way forward. Presentation of J.M. Baroso on 20/21.03.2014, Source: http://ec.europa.eu. © European Union, 1995-2015
http://ec.europa.eu/clima/policies/2030/docs/climate_energy_priorities_en.pdf, Source: Eurostat. © European Union, 1995-2015
European Commission Energy Country Factsheets 2012. Gross Inland Consumption by fuel (Primary Energy Consumption) in Mtoe for year 2010 [online] on: http://ec.europa.eu/energy/observatory/countries/doc/2012-country-factsheets.pdf, Source: http://ec.europa.eu. © European Union, 1995-2015
European Commission Energy Country Factsheets 2012, Final Energy Consumption for year 200 & 2010 [online] on: http://ec.europa.eu/energy/observatory/countries/doc/2012-country-factsheets.pdf, Source: http://ec.europa.eu. © European Union, 1995-2015
Eurostat Tables and Graphs Primary Energy consumption for 2012 (updated on 17/02/2014), Source: Eurostat. © European Union, 1995-2015
Eurostat Tables and Graphs Final Energy consumption for 2012 (updated on 17/02/2014), Source: Eurostat. © European Union, 1995-2015
REF-E (2014), Il mercato elettrico italiano: stato dell’arte e prospettive. Presentation by Virginia Carnazza
ENERDATA, Italy energy report, August 2014 update, https://estore.enerdata.net/energy-market/italy-energy-report-and-data.html
Terna Group, Direzione Dispacciamento Nazionale. Dati statistici sull’energia elettrica in Italia, 2012, Nota di sintesi, http://www.terna.it/LinkClick.aspx?fi leticket=8fzKlKgsmzY%3d&tabid=418&mid=2501
Terna Group, Confronti Nazionali, http://www.terna.it/LinkClick.aspx?fi leticket=6gMaUp466Bc%3d&tabid=847
AEEGSI Autorità per l’energia elettrica, il gas e il sistema idrico (August 2013). Contributo dei principali operatori alla produzione nazionale lorda, http://www.autorita.energia.it/it/dati/eem30.htm
AEEGSI Autorità per l’energia elettrica, il gas e il sistema idrico (2013). Relazione annuale sullo stato ei servizi e sull’attività svolta, http://www.autorita.energia.it/allegati/relaz_ann/13/RAVolumeI_2013.pdf
REF-E (2013), Energia: Rapporto sul mercato e la regolamentazione. Available under payment at: http://www.ref-e.com/it/what-we-offer/rapporto-energia
ENEA; July 2014, Piano d’Azione italiano per l’Effi cienza Energetica 2014, http://www.effi cienzaenergetica.enea.it/doc/paee/PAEE-2014-defi nitivo.pdf
Ministero dello Sviluppo Italiano, Strategia Energetica Nazionale: per un’energia più competitiva e sostenibile (March 2013): http://www.sviluppoeconomico.gov.it/images/stories/normativa/20130314_Strategia_Energetica_Nazionale.pdf
National Plan for the Reduction of Greenhouse gases 2013-2020 (Piano di Azione Nazionale per la riduzione dei gas a effetto serra, periodo 2013-2020, delibera CIPE), http://documenti.camera.it/leg17/dossier/Testi/Am0009a.htm; http://www.cipecomitato.it/it/ricerca_delibere.html#
ENEA, Una mappa delle emissioni specifi che e del costo medio di generazione di diversi mix elettrici, http://www.enea.it/it/Ricerca_sviluppo/documenti/ricerca-di-sistema-elettrico/sicurezza-nucleare/2012/rds-2013-062.pdf
ENEL website, news: https://www.enel.it/it-IT/eventi_news/news/cresce-il-sistema-elettrico-italiano-nel-mediterraneo/p/090027d9819304f2
Indagine conoscitiva sui prezzi dell’energia elettrica e del gas come fattore strategico per la crescita del sistema produttivo del paese, Memoria per l’audizione presso la X Commissione Industria, Commercio e Turismo del Senato della Repubblica, July 2013; http://www.autorita.energia.it/allegati/docs/13/298-13.pdf
12104

To start a new section, hold down the apple+shift keys and click
to release this object and type the section title in the box below.
34 SEN provides that Italian Government shall identify, in compliance with EU Regulation 347/2013, Project of Common Interest (PIC) in gas and electricity sector that will benefi t from procedural and fi nancial advantages. Italy is waiting for the regulation that will provide the criteria and identifi cation of the competent authority for PIC
Beyond 2020, Italy has committed to an even greater market penetration for renewables and more stringent energy effi ciency measures, although it is unclear on the technologies that should be implemented to support these goals.The renewable technologies that will ultimately be favored will depend on market conditions and technological breakthroughs.
Italy’s energy mix post-2020 and the role of renewablesGiven the extent of change likely to occur in the coming years, the SEN did not set specifi c sectorial or technological objectives. It prefers to be technology neutral and fl exible to changes in market conditions as part of its long-term strategy.
Italy plans to implement a capacity market in the power sector very shortly and is currently developing an auction model with reliability contracts. The fi rst auction took place in 2014.
While Italy has not yet articulated a clear objective for its energy mix in 2030, the SEN anticipates that more than 29% of fi nal energy produced will come from renewable sources by 2030. Italy has even developed a tentative scenario where 50% of fi nal energy produced would come from renewable sources. Considering the generation potential of each energy source, a signifi cant solar capacity would need to be installed to reach such a goal. According to ENEA, solar has the greatest development potential among renewables both in technological and economic terms, given that it has reached grid parity and has low installation costs.
In this context, coal is not in favor, both due to the need to reduce GHG emissions and to mounting public and local community opposition to coal (a situation amply highlighted by an Italian court’s decision to shut down a coal-fi red power plant for environmental health reasons in 2014). A signifi cant investment in coal-fi red plants in Italy therefore seems unlikely, even if some plans exist to convert oil-fi red to carbon-fi red plants. Some major electricity producers believe coal could still be viable, given both its falling prices and the emerging availability of improved carbon mitigation technologies, arguing that these investments would be less costly than (more effi cient and environmental-friendly) gas technologies and could potentially reduce Italy’s reliance on imports from largely-unstable countries.
With regard to nuclear power, a referendum in June 2011 repealed provisions relating to the so-called nuclear Omnibus Decree. Roughly 54% of the population turned out for the vote and more than 94% of those voters opposed the government’s plan to resume nuclear power generation. This put a defi nite halt to Italy’s nuclear program. Nevertheless, Italy imports electricity from countries such as France, Switzerland and Slovenia, whose energy mixes are nuclear rich. The country is also involved in international research and cooperation focused on improving nuclear safety and waste management. Should solutions be found, nuclear could arguably satisfy Italy’s energy demand for a very long time.
In the short term, however, Italy will continue to rely on imports, and will need to adapt its distribution grid and expand its connections with renewable energy-exporting countries, probably in the Balkans and North Africa, to better diversify the sources of its electricity supply. Projects to connect Italy’s grid with neighboring countries are also in progress (e.g. the ELMED project with Tunisia), and could potentially position Italy to act as an energy hub for the EU.34
ConclusionItaly has already achieved most of its energy and GHG emission objectives for 2020, predominantly due to decreased energy consumption linked to the economic crisis. The challenge will be to keep meeting these targets as the economy recovers.
It is clear that the 2050 Energy Roadmap will drive structural changes in Italy’s energy markets. From a competitive standpoint, and to support economic growth, it is important that the transition not penalize the Italian and European economies, particularly in those sectors exposed to international competition.
Public support in Italy may shift from a focus on renewables to one on energy effi ciency. In fact, Italy’s incentives system introduces distortions with respect to the cost of public resources allocated for each unit of CO2 avoided. As part of the country’s energy saving incentives, the public cost of energy per MWh is now 25 times lower than the public cost to support renewables. Although this has contributed to the adoption of not-yet-mature renewable technologies, in the long term it may not result in the system most capable of reducing emissions. As such, it is becoming more important for Italy to dedicate public resources to R&D that may result in future technological breakthroughs.
11
Selected bibliographic references
Europe 2020 Targets [online] available on: http://epp.eurostat.ec.europa.eu/portal/page/portal/europe_2020_indicators/headline_indicators, Source: Eurostat. © European Union, 1995-2015
European Commission – Climate and energy priorities for Europe – the way forward. Presentation of J.M. Baroso on 20/21.03.2014, Source: http://ec.europa.eu. © European Union, 1995-2015
http://ec.europa.eu/clima/policies/2030/docs/climate_energy_priorities_en.pdf, Source: Eurostat. © European Union, 1995-2015
European Commission Energy Country Factsheets 2012. Gross Inland Consumption by fuel (Primary Energy Consumption) in Mtoe for year 2010 [online] on: http://ec.europa.eu/energy/observatory/countries/doc/2012-country-factsheets.pdf, Source: http://ec.europa.eu. © European Union, 1995-2015
European Commission Energy Country Factsheets 2012, Final Energy Consumption for year 200 & 2010 [online] on: http://ec.europa.eu/energy/observatory/countries/doc/2012-country-factsheets.pdf, Source: http://ec.europa.eu. © European Union, 1995-2015
Eurostat Tables and Graphs Primary Energy consumption for 2012 (updated on 17/02/2014), Source: Eurostat. © European Union, 1995-2015
Eurostat Tables and Graphs Final Energy consumption for 2012 (updated on 17/02/2014), Source: Eurostat. © European Union, 1995-2015
REF-E (2014), Il mercato elettrico italiano: stato dell’arte e prospettive. Presentation by Virginia Carnazza
ENERDATA, Italy energy report, August 2014 update, https://estore.enerdata.net/energy-market/italy-energy-report-and-data.html
Terna Group, Direzione Dispacciamento Nazionale. Dati statistici sull’energia elettrica in Italia, 2012, Nota di sintesi, http://www.terna.it/LinkClick.aspx?fi leticket=8fzKlKgsmzY%3d&tabid=418&mid=2501
Terna Group, Confronti Nazionali, http://www.terna.it/LinkClick.aspx?fi leticket=6gMaUp466Bc%3d&tabid=847
AEEGSI Autorità per l’energia elettrica, il gas e il sistema idrico (August 2013). Contributo dei principali operatori alla produzione nazionale lorda, http://www.autorita.energia.it/it/dati/eem30.htm
AEEGSI Autorità per l’energia elettrica, il gas e il sistema idrico (2013). Relazione annuale sullo stato ei servizi e sull’attività svolta, http://www.autorita.energia.it/allegati/relaz_ann/13/RAVolumeI_2013.pdf
REF-E (2013), Energia: Rapporto sul mercato e la regolamentazione. Available under payment at: http://www.ref-e.com/it/what-we-offer/rapporto-energia
ENEA; July 2014, Piano d’Azione italiano per l’Effi cienza Energetica 2014, http://www.effi cienzaenergetica.enea.it/doc/paee/PAEE-2014-defi nitivo.pdf
Ministero dello Sviluppo Italiano, Strategia Energetica Nazionale: per un’energia più competitiva e sostenibile (March 2013): http://www.sviluppoeconomico.gov.it/images/stories/normativa/20130314_Strategia_Energetica_Nazionale.pdf
National Plan for the Reduction of Greenhouse gases 2013-2020 (Piano di Azione Nazionale per la riduzione dei gas a effetto serra, periodo 2013-2020, delibera CIPE), http://documenti.camera.it/leg17/dossier/Testi/Am0009a.htm; http://www.cipecomitato.it/it/ricerca_delibere.html#
ENEA, Una mappa delle emissioni specifi che e del costo medio di generazione di diversi mix elettrici, http://www.enea.it/it/Ricerca_sviluppo/documenti/ricerca-di-sistema-elettrico/sicurezza-nucleare/2012/rds-2013-062.pdf
ENEL website, news: https://www.enel.it/it-IT/eventi_news/news/cresce-il-sistema-elettrico-italiano-nel-mediterraneo/p/090027d9819304f2
Indagine conoscitiva sui prezzi dell’energia elettrica e del gas come fattore strategico per la crescita del sistema produttivo del paese, Memoria per l’audizione presso la X Commissione Industria, Commercio e Turismo del Senato della Repubblica, July 2013; http://www.autorita.energia.it/allegati/docs/13/298-13.pdf
12 105Energy market reform in Europe
European energy market reformCountry profi le: Netherlands
106
European energy market reformCountry profi le: Netherlands
Contents
Current situation 108
Energy consumption and trade balance 108
Power generation 109
Power market: main actors 110
Power prices 111
Targets for 2020 112
Energy efficiency targets 112
Renewable energy targets 114
CO2 emissions and targets 115
Road ahead and main challenges: the way to 2030 and beyond 116
Long-term energy priorities but few tangible targets 116
Gas production under pressure 116
Renewables and nuclear power 117
Climate change 117
Conclusion 117
Selected bibliographic references 118
107Energy market reform in Europe
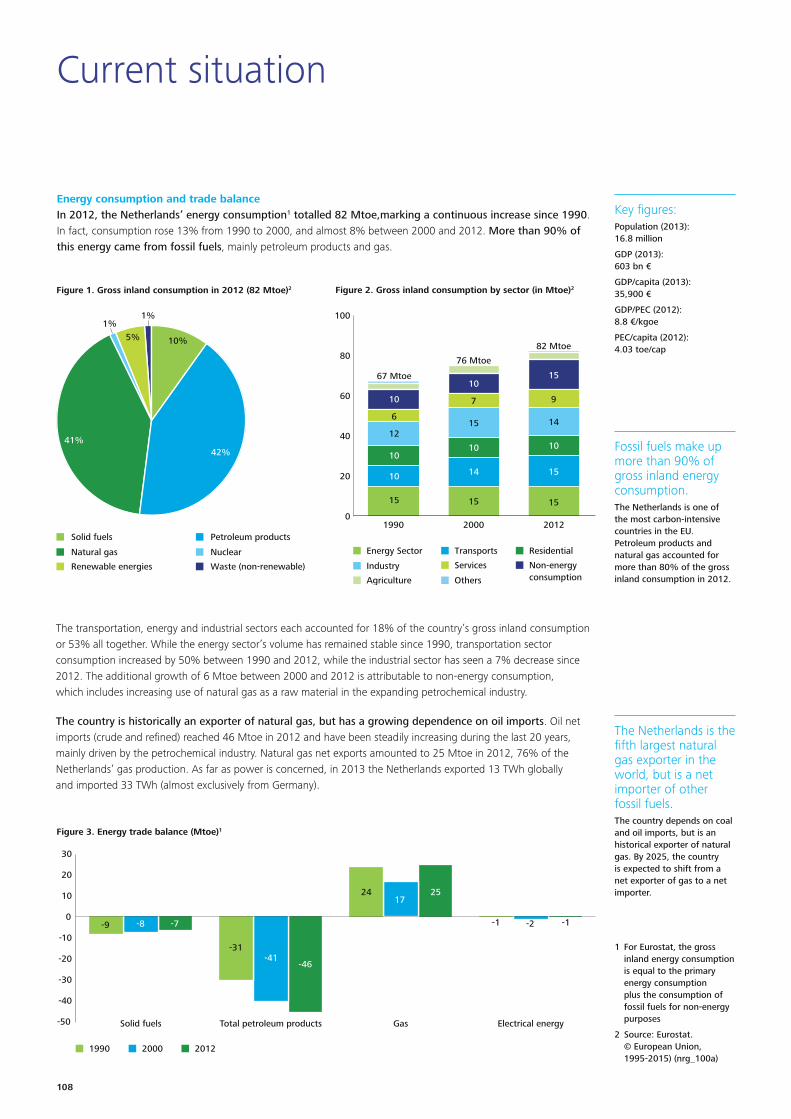
To start a new section, hold down the apple+shift keys and click
to release this object and type the section title in the box below.
Current situation
Energy consumption and trade balanceIn 2012, the Netherlands’ energy consumption1 totalled 82 Mtoe,marking a continuous increase since 1990. In fact, consumption rose 13% from 1990 to 2000, and almost 8% between 2000 and 2012. More than 90% of this energy came from fossil fuels, mainly petroleum products and gas.
Fossil fuels make up more than 90% of gross inland energy consumption.The Netherlands is one of the most carbon-intensive countries in the EU. Petroleum products and natural gas accounted for more than 80% of the gross inland consumption in 2012.
The Netherlands is the fi fth largest natural gas exporter in the world, but is a net importer of other fossil fuels.The country depends on coal and oil imports, but is an historical exporter of natural gas. By 2025, the country is expected to shift from a net exporter of gas to a net importer.
1 For Eurostat, the gross inland energy consumption is equal to the primary energy consumption plus the consumption of fossil fuels for non-energy purposes
2 Source: Eurostat. © European Union, 1995-2015) (nrg_100a)
The transportation, energy and industrial sectors each accounted for 18% of the country’s gross inland consumption or 53% all together. While the energy sector’s volume has remained stable since 1990, transportation sector consumption increased by 50% between 1990 and 2012, while the industrial sector has seen a 7% decrease since 2012. The additional growth of 6 Mtoe between 2000 and 2012 is attributable to non-energy consumption, which includes increasing use of natural gas as a raw material in the expanding petrochemical industry.
The country is historically an exporter of natural gas, but has a growing dependence on oil imports. Oil net imports (crude and refi ned) reached 46 Mtoe in 2012 and have been steadily increasing during the last 20 years, mainly driven by the petrochemical industry. Natural gas net exports amounted to 25 Mtoe in 2012, 76% of the Netherlands’ gas production. As far as power is concerned, in 2013 the Netherlands exported 13 TWh globally and imported 33 TWh (almost exclusively from Germany).
Key fi gures: Population (2013): 16.8 million
GDP (2013): 603 bn €
GDP/capita (2013): 35,900 €
GDP/PEC (2012): 8.8 €/kgoe
PEC/capita (2012):4.03 toe/cap
Figure 1. Gross inland consumption in 2012 (82 Mtoe)2
10%
42%
5%
1%
41%
1%
Solid fuels Petroleum products
Natural gas Nuclear
Renewable energies Waste (non-renewable)
Figure 2. Gross inland consumption by sector (in Mtoe)2
Energy Sector Transports Residential
Industry Services Non-energyconsumptionAgriculture Others
0
20
40
60
80
100
201220001990
15
10
10
10
12
6
67 Mtoe
15
15
10
15
14
9
82 Mtoe
15
14
10
10
7
15
7
76 Mtoe
Figure 3. Energy trade balance (Mtoe)1
1990 2000 2012
-50
-40
-30
-20
-10
0
10
20
30
Electrical energyGasTotal petroleum productsSolid fuels
-9 -8 -7
-31-41
-46
24
-1 -2 -1
1725
1
To start a new section, hold down the apple+shift keys and click
to release this object and type the section title in the box below.
To start a new section, hold down the apple+shift keys and click
to release this object and type the section title in the box below.
Power generation The Netherlands has one of the most carbon-intensive electricity generation mixes in Europe, with more than 80% stemming from gas and coal.
3 Based on IEA data from Energy Policies of IEA Countries – Netherlands © OECD/IEA 2014, IEA Publishing; modifi ed by Deloitte. Licence: http://www.iea.org/t&c/
4 CBS (Central Bureau voor de Statistik)
83% of electricity production comes from fossil fuels, 64% being delivered from natural gas.The Netherlands relies on domestic gas resources for electricity generation. Renewable energies account- up for only 10% of electricity capacity, more than 80% coming from wind.
Figure 4. Electricity capacity – 28 GW (2012)3
0.0
0.30.1
2.3
4.2
19.8
0.6
0.3
0.5
Nuclear energy Coal Fuel oil
Gas Other non-RES Hydro
Wind PV Other RES
RES: 2.8
Figure 5. Electricity production – 112 TWh (2012)3
7
5
21
72
3
4
Nuclear energy Coal Fuel oil
Gas Other non-RES Hydro
Wind PV Other RES
RES: 12
In 2012, gas accounted for 70% of the country’s generation capacity mix (19.8 GW) and delivered 64% of its power (72 TWh). Coal was the second source of generation; it represented 15% of installed capacity and produced 21 TWh (19%) of electricity. Renewable energy sources made up only 10% of electricity generation, or 12 TWh, mainly derived from wind (82%).
Solar and other renewable energy sources represented a minor part of installed capacity, with 0.1 GW and 0.3 GW respectively.
The Netherlands experienced strong growth in generation capacity during the last few years (44% since 2000 and 12% since 2010). The 9 GW of additional capacity realized since 2000 came mainly from gas combined cycle units. 2 GW of new wind capacity have been added since 2000, representing almost 85% of total added renewable energy source (RES) capacity.
Figure 6. Electricity capacity change from 2000 to 2012 (in GW)4
-3
-2
-1
0
1
2
3
4
5
6
7
8
OtherPVWindHydroNuclearGasturbines
Combinedcycle units
Steamturbines
Internalcombustion
2.0
-2.2
6.6
0.3 0.1 0.0 0.02.0 0.4
2108
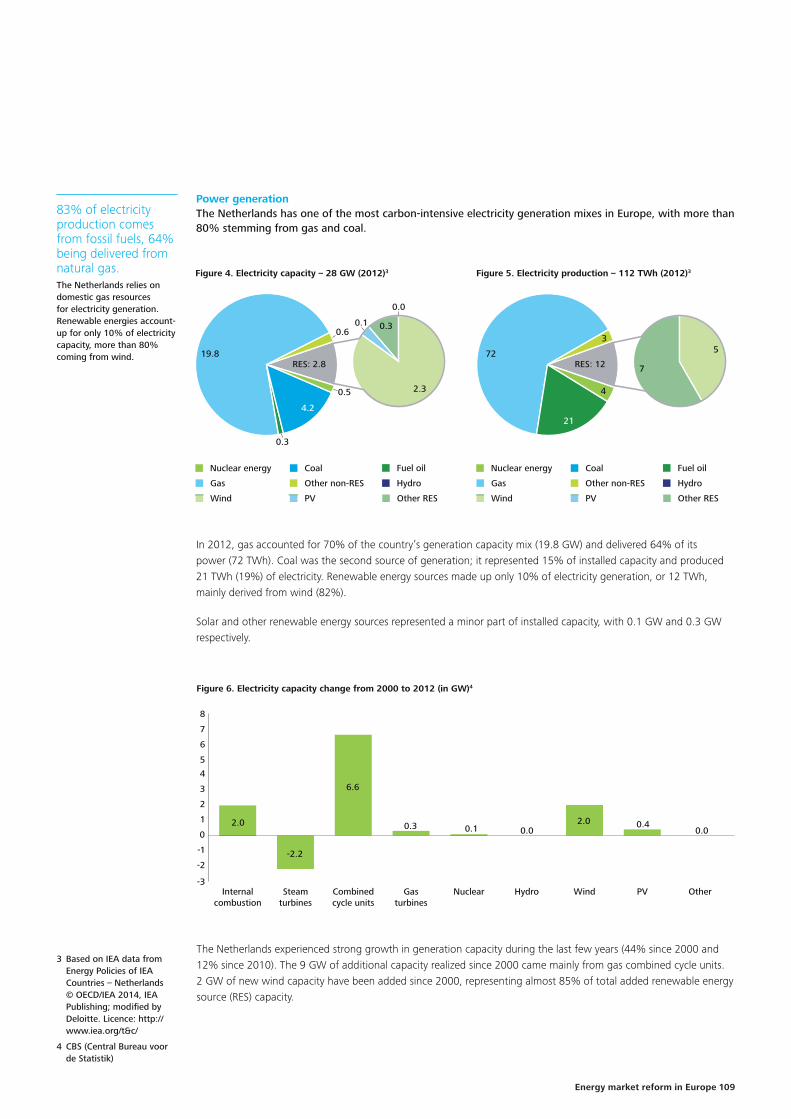
To start a new section, hold down the apple+shift keys and click
to release this object and type the section title in the box below.
Current situation
Energy consumption and trade balanceIn 2012, the Netherlands’ energy consumption1 totalled 82 Mtoe,marking a continuous increase since 1990. In fact, consumption rose 13% from 1990 to 2000, and almost 8% between 2000 and 2012. More than 90% of this energy came from fossil fuels, mainly petroleum products and gas.
Fossil fuels make up more than 90% of gross inland energy consumption.The Netherlands is one of the most carbon-intensive countries in the EU. Petroleum products and natural gas accounted for more than 80% of the gross inland consumption in 2012.
The Netherlands is the fi fth largest natural gas exporter in the world, but is a net importer of other fossil fuels.The country depends on coal and oil imports, but is an historical exporter of natural gas. By 2025, the country is expected to shift from a net exporter of gas to a net importer.
1 For Eurostat, the gross inland energy consumption is equal to the primary energy consumption plus the consumption of fossil fuels for non-energy purposes
2 Source: Eurostat. © European Union, 1995-2015) (nrg_100a)
The transportation, energy and industrial sectors each accounted for 18% of the country’s gross inland consumption or 53% all together. While the energy sector’s volume has remained stable since 1990, transportation sector consumption increased by 50% between 1990 and 2012, while the industrial sector has seen a 7% decrease since 2012. The additional growth of 6 Mtoe between 2000 and 2012 is attributable to non-energy consumption, which includes increasing use of natural gas as a raw material in the expanding petrochemical industry.
The country is historically an exporter of natural gas, but has a growing dependence on oil imports. Oil net imports (crude and refi ned) reached 46 Mtoe in 2012 and have been steadily increasing during the last 20 years, mainly driven by the petrochemical industry. Natural gas net exports amounted to 25 Mtoe in 2012, 76% of the Netherlands’ gas production. As far as power is concerned, in 2013 the Netherlands exported 13 TWh globally and imported 33 TWh (almost exclusively from Germany).
Key fi gures: Population (2013): 16.8 million
GDP (2013): 603 bn €
GDP/capita (2013): 35,900 €
GDP/PEC (2012): 8.8 €/kgoe
PEC/capita (2012):4.03 toe/cap
Figure 1. Gross inland consumption in 2012 (82 Mtoe)2
10%
42%
5%
1%
41%
1%
Solid fuels Petroleum products
Natural gas Nuclear
Renewable energies Waste (non-renewable)
Figure 2. Gross inland consumption by sector (in Mtoe)2
Energy Sector Transports Residential
Industry Services Non-energyconsumptionAgriculture Others
0
20
40
60
80
100
201220001990
15
10
10
10
12
6
67 Mtoe
15
15
10
15
14
9
82 Mtoe
15
14
10
10
7
15
7
76 Mtoe
Figure 3. Energy trade balance (Mtoe)1
1990 2000 2012
-50
-40
-30
-20
-10
0
10
20
30
Electrical energyGasTotal petroleum productsSolid fuels
-9 -8 -7
-31-41
-46
24
-1 -2 -1
1725
1
To start a new section, hold down the apple+shift keys and click
to release this object and type the section title in the box below.
To start a new section, hold down the apple+shift keys and click
to release this object and type the section title in the box below.
Power generation The Netherlands has one of the most carbon-intensive electricity generation mixes in Europe, with more than 80% stemming from gas and coal.
3 Based on IEA data from Energy Policies of IEA Countries – Netherlands © OECD/IEA 2014, IEA Publishing; modifi ed by Deloitte. Licence: http://www.iea.org/t&c/
4 CBS (Central Bureau voor de Statistik)
83% of electricity production comes from fossil fuels, 64% being delivered from natural gas.The Netherlands relies on domestic gas resources for electricity generation. Renewable energies account- up for only 10% of electricity capacity, more than 80% coming from wind.
Figure 4. Electricity capacity – 28 GW (2012)3
0.0
0.30.1
2.3
4.2
19.8
0.6
0.3
0.5
Nuclear energy Coal Fuel oil
Gas Other non-RES Hydro
Wind PV Other RES
RES: 2.8
Figure 5. Electricity production – 112 TWh (2012)3
7
5
21
72
3
4
Nuclear energy Coal Fuel oil
Gas Other non-RES Hydro
Wind PV Other RES
RES: 12
In 2012, gas accounted for 70% of the country’s generation capacity mix (19.8 GW) and delivered 64% of its power (72 TWh). Coal was the second source of generation; it represented 15% of installed capacity and produced 21 TWh (19%) of electricity. Renewable energy sources made up only 10% of electricity generation, or 12 TWh, mainly derived from wind (82%).
Solar and other renewable energy sources represented a minor part of installed capacity, with 0.1 GW and 0.3 GW respectively.
The Netherlands experienced strong growth in generation capacity during the last few years (44% since 2000 and 12% since 2010). The 9 GW of additional capacity realized since 2000 came mainly from gas combined cycle units. 2 GW of new wind capacity have been added since 2000, representing almost 85% of total added renewable energy source (RES) capacity.
Figure 6. Electricity capacity change from 2000 to 2012 (in GW)4
-3
-2
-1
0
1
2
3
4
5
6
7
8
OtherPVWindHydroNuclearGasturbines
Combinedcycle units
Steamturbines
Internalcombustion
2.0
-2.2
6.6
0.3 0.1 0.0 0.02.0 0.4
2 109Energy market reform in Europe
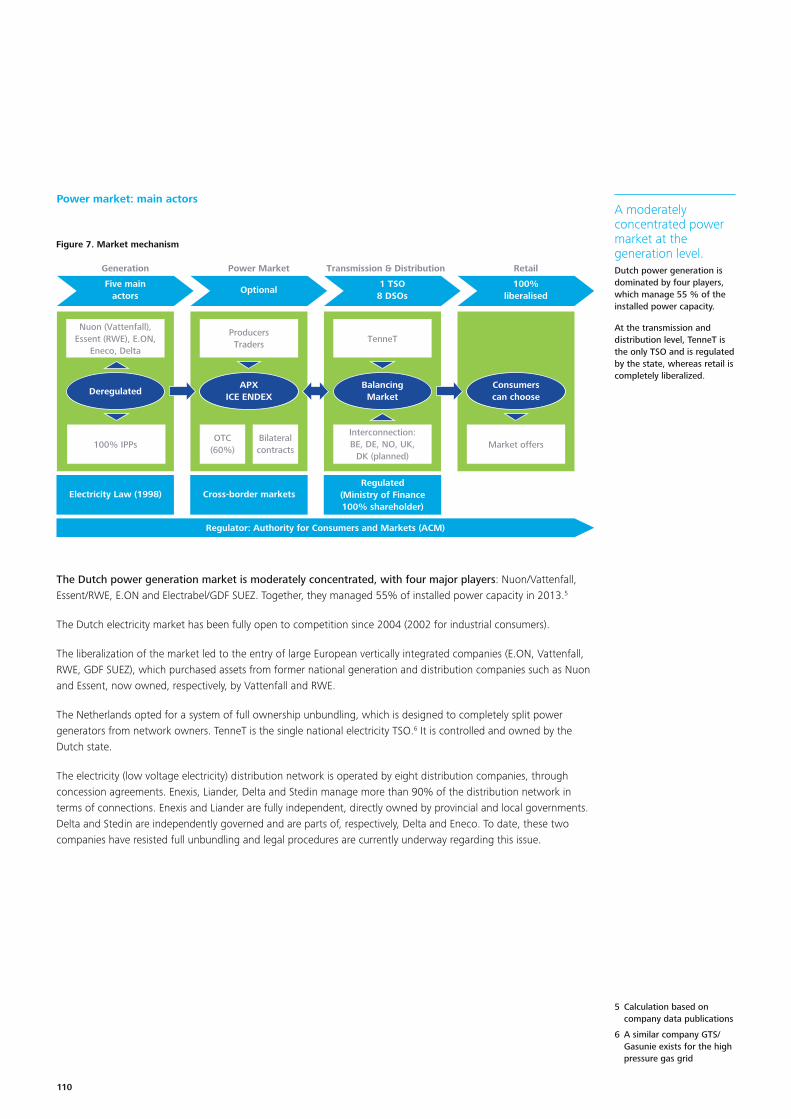
To start a new section, hold down the apple+shift keys and click
to release this object and type the section title in the box below.
Power market: main actors
5 Calculation based on company data publications
6 A similar company GTS/Gasunie exists for the high pressure gas grid
A moderately concentrated power market at the generation level.Dutch power generation is dominated by four players, which manage 55 % of the installed power capacity.
At the transmission and distribution level, TenneT is the only TSO and is regulated by the state, whereas retail is completely liberalized.
The Dutch power generation market is moderately concentrated, with four major players: Nuon/Vattenfall, Essent/RWE, E.ON and Electrabel/GDF SUEZ. Together, they managed 55% of installed power capacity in 2013.5
The Dutch electricity market has been fully open to competition since 2004 (2002 for industrial consumers).
The liberalization of the market led to the entry of large European vertically integrated companies (E.ON, Vattenfall, RWE, GDF SUEZ), which purchased assets from former national generation and distribution companies such as Nuon and Essent, now owned, respectively, by Vattenfall and RWE.
The Netherlands opted for a system of full ownership unbundling, which is designed to completely split power generators from network owners. TenneT is the single national electricity TSO.6 It is controlled and owned by the Dutch state.
The electricity (low voltage electricity) distribution network is operated by eight distribution companies, through concession agreements. Enexis, Liander, Delta and Stedin manage more than 90% of the distribution network in terms of connections. Enexis and Liander are fully independent, directly owned by provincial and local governments. Delta and Stedin are independently governed and are parts of, respectively, Delta and Eneco. To date, these two companies have resisted full unbundling and legal procedures are currently underway regarding this issue.
Five mainactors
Optional1 TSO8 DSOs
100%liberalised
Generation
Nuon (Vattenfall),Essent (RWE), E.ON,
Eneco, Delta
Electricity Law (1998) Cross-border markets
Regulator: Authority for Consumers and Markets (ACM)
Regulated(Ministry of Finance100% shareholder)
100% IPPs
ProducersTraders
Power Market Transmission & Distribution Retail
Figure 7. Market mechanism
DeregulatedAPX
ICE ENDEX
OTC(60%)
Bilateralcontracts
TenneT
BalancingMarket
Interconnection:BE, DE, NO, UK,
DK (planned)
Consumerscan choose
Market offers
3
To start a new section, hold down the apple+shift keys and click
to release this object and type the section title in the box below.
To start a new section, hold down the apple+shift keys and click
to release this object and type the section title in the box below.
Power pricesWhile retail prices are not regulated in the Netherlands per se, suppliers are obligated to report all prices charged to the Authority for Consumers & Markets (ACM), which has the power to reduce prices in cases where suppliers cannot provide suffi cient justifi cation for the amounts charged.
In 2012, retail prices for industrial users were 97 €/MWh, below the European average (125 €/MWh). Electricity prices have decreased by almost 10% since 2008 (-10 €/MWh), whereas EU industrial electricity prices went up by about 3.5% per year on average during the same time period. This shift was mainly driven by declining energy and supply costs (-13 €/MWh), although it was partially offset by a 21% rise in grid costs. Taxes stayed constant between 2008 and 2013.
In 2012, residential customer retail prices reached 189 €/MWh, which is also lower than the European average (200 €/MWh), and rose to 191 €/MWh in 2013. The 6% rise between 2008 and 2013 was mainly driven by higher taxes (+17%) and grid costs (+25%). During the same period, energy and supply costs went down by 10%.
Decreasing industrial and stable residential retail prices.Retail prices are not regulated in the Netherlands. While industrial users have experienced falling retail prices for the last fi ve years, residential users have seen a small price increase of 6% since 2008.
Contrary to many other European countries, in the Netherlands, policy support costs (PSC) are not levied on the electricity bill but are fi nanced directly from the state budget. In 2013, the Netherlands introduced a sustainable energy levy, which is a part of the SDE+ mechanism8 (for more detail, see ‘Renewable energy targets’ below).
7 Source: Eurostat. © European Union, 1995-2015
8 Eurelectric (2014)
Figure 8. Retail prices for industrial and residential users (€/MWh)7
0
20
40
60
80
100
120
2013201120102008
11
73
19
104€
11
68
19
98€
11
64
22
97€
11
60
23
94€11%
71%
19%
11%
69%
19%
11%
66%
23%
12%
64%
25%
0
50
100
150
200
250
2013201120102008
46
85
49
180€
50
79
48
176€
52
79
59
189€
54
76
61
191€
26%
47%
27%
28%
45%
27%
27%
42%
31%
28%
40%
32%
Grid Energy and supply Taxes Grid Energy and supply Taxes
Industrial Residential
4110

To start a new section, hold down the apple+shift keys and click
to release this object and type the section title in the box below.
Power market: main actors
5 Calculation based on company data publications
6 A similar company GTS/Gasunie exists for the high pressure gas grid
A moderately concentrated power market at the generation level.Dutch power generation is dominated by four players, which manage 55 % of the installed power capacity.
At the transmission and distribution level, TenneT is the only TSO and is regulated by the state, whereas retail is completely liberalized.
The Dutch power generation market is moderately concentrated, with four major players: Nuon/Vattenfall, Essent/RWE, E.ON and Electrabel/GDF SUEZ. Together, they managed 55% of installed power capacity in 2013.5
The Dutch electricity market has been fully open to competition since 2004 (2002 for industrial consumers).
The liberalization of the market led to the entry of large European vertically integrated companies (E.ON, Vattenfall, RWE, GDF SUEZ), which purchased assets from former national generation and distribution companies such as Nuon and Essent, now owned, respectively, by Vattenfall and RWE.
The Netherlands opted for a system of full ownership unbundling, which is designed to completely split power generators from network owners. TenneT is the single national electricity TSO.6 It is controlled and owned by the Dutch state.
The electricity (low voltage electricity) distribution network is operated by eight distribution companies, through concession agreements. Enexis, Liander, Delta and Stedin manage more than 90% of the distribution network in terms of connections. Enexis and Liander are fully independent, directly owned by provincial and local governments. Delta and Stedin are independently governed and are parts of, respectively, Delta and Eneco. To date, these two companies have resisted full unbundling and legal procedures are currently underway regarding this issue.
Five mainactors
Optional1 TSO8 DSOs
100%liberalised
Generation
Nuon (Vattenfall),Essent (RWE), E.ON,
Eneco, Delta
Electricity Law (1998) Cross-border markets
Regulator: Authority for Consumers and Markets (ACM)
Regulated(Ministry of Finance100% shareholder)
100% IPPs
ProducersTraders
Power Market Transmission & Distribution Retail
Figure 7. Market mechanism
DeregulatedAPX
ICE ENDEX
OTC(60%)
Bilateralcontracts
TenneT
BalancingMarket
Interconnection:BE, DE, NO, UK,
DK (planned)
Consumerscan choose
Market offers
3
To start a new section, hold down the apple+shift keys and click
to release this object and type the section title in the box below.
To start a new section, hold down the apple+shift keys and click
to release this object and type the section title in the box below.
Power pricesWhile retail prices are not regulated in the Netherlands per se, suppliers are obligated to report all prices charged to the Authority for Consumers & Markets (ACM), which has the power to reduce prices in cases where suppliers cannot provide suffi cient justifi cation for the amounts charged.
In 2012, retail prices for industrial users were 97 €/MWh, below the European average (125 €/MWh). Electricity prices have decreased by almost 10% since 2008 (-10 €/MWh), whereas EU industrial electricity prices went up by about 3.5% per year on average during the same time period. This shift was mainly driven by declining energy and supply costs (-13 €/MWh), although it was partially offset by a 21% rise in grid costs. Taxes stayed constant between 2008 and 2013.
In 2012, residential customer retail prices reached 189 €/MWh, which is also lower than the European average (200 €/MWh), and rose to 191 €/MWh in 2013. The 6% rise between 2008 and 2013 was mainly driven by higher taxes (+17%) and grid costs (+25%). During the same period, energy and supply costs went down by 10%.
Decreasing industrial and stable residential retail prices.Retail prices are not regulated in the Netherlands. While industrial users have experienced falling retail prices for the last fi ve years, residential users have seen a small price increase of 6% since 2008.
Contrary to many other European countries, in the Netherlands, policy support costs (PSC) are not levied on the electricity bill but are fi nanced directly from the state budget. In 2013, the Netherlands introduced a sustainable energy levy, which is a part of the SDE+ mechanism8 (for more detail, see ‘Renewable energy targets’ below).
7 Source: Eurostat. © European Union, 1995-2015
8 Eurelectric (2014)
Figure 8. Retail prices for industrial and residential users (€/MWh)7
0
20
40
60
80
100
120
2013201120102008
11
73
19
104€
11
68
19
98€
11
64
22
97€
11
60
23
94€11%
71%
19%
11%
69%
19%
11%
66%
23%
12%
64%
25%
0
50
100
150
200
250
2013201120102008
46
85
49
180€
50
79
48
176€
52
79
59
189€
54
76
61
191€
26%
47%
27%
28%
45%
27%
27%
42%
31%
28%
40%
32%
Grid Energy and supply Taxes Grid Energy and supply Taxes
Industrial Residential
4 111Energy market reform in Europe

To start a new section, hold down the apple+shift keys and click
to release this object and type the section title in the box below.
9 Source: Eurostat. © European Union, 1995-2015 (nrg_ind_334a)
Targets for 2020
In 2013, the Dutch government passed the Energy Agreement for Sustainable Growth, setting key actions to reach its 2020 energy and climate targets. The Agreement aims to reduce fi nal energy consumption by an average of 1.5% per year and sets a 14% renewable energy target by 2020 for fi nal energy consumption. Furthermore, the Agreement calls for an improved and properly functioning EU ETS to reduce overall emissions.
Energy effi ciency targetsThe Netherlands has made energy effi ciency one of its main priorities, as set out in several national plans, including the Energy Agreement for Sustainable Growth (September 2013), the Environmental Management Act (Wet milieubeheer) and the third Dutch National Energy Effi ciency Action Plan (third NEEAP, 2014).
The Netherlands’ set targets are expressed both:
• in absolute terms (fi nal energy consumption of 52 Mtoe in 2020); and
• in relative terms – energy savings of 482 PJ (11.5 Mtoe) by 2020 compared to 2007, introduced by the third NEEAP in 2014.
According to the Energy Agreement (2013), the 2020 goal defi nes an indicative target for fi nal energy consumption of 52 Mtoe, which is 2% higher than it was in 2012 and is equivalent to 2005 energy consumption. Projections are based on national statistics and evaluation models, and any increase in energy consumption derived from GDP growth has to be compensated by equivalent savings across different sectors.
20-20-20 EU targets: what is the Netherlands committed to?• Energy savings: average
reduction in fi nal energy consumption of 1.5% per year.
• 14% renewable energy in 2020 fi nal energy consumption.
• 21% reduction in ETS emissions as compared to the 2005 level.
• 16% reduction in non-ETS emissions as compared to the 2005 level.
Energy effi ciency: while an important share of energy savings remains to be realized, the indicative fi nal energy target for 2020 was already attained in 2012.The Netherlands chose to focus its national target on gross fi nal energy consumption, for which the target in absolute terms was met in 2012.
However, the main goal is to reach 482 PJ (11.5 Mtoe) of cumulative fi nal energy savings by 2020. In 2010, 85% of the target remained to be achieved. Nevertheless, the Netherlands is making good progress to reach the interim 2016 target of 4.9 Mtoe of cumulative energy savings.
Figure 9. Final energy consumption (Mtoe)9
0
10
20
30
40
50
60
20202012201020051990
41
5254
51 52
Figure 10. Final energy consumption in 2012, per sector9
51 Mtoe
27%
20%
7%
17%
29%
Industry Transport Households
Services Agriculture
5
To start a new section, hold down the apple+shift keys and click
to release this object and type the section title in the box below.
To start a new section, hold down the apple+shift keys and click
to release this object and type the section title in the box below.
10 http://www.government.nl/issues/energy-policy/saving-energy
Table 1. Cumulative savings in fi nal energy consumption 2010, 2016 and 2020, as compared to 2007
Savings 2010 Expected savings 2016 Expected savings 2020
Sector GWh Mtoe GWh Mtoe Mtoe
Built environment 9,912 0.85 31,317 2.69 NA
Industry and SMEs 1,548 0.13 5,576 0.48 NA
Transportation 2,172 0.19 10,639 0.91 NA
Agriculture and horticulture 5,706 0.49 9,750 0.84 NA
Total 19,338 1.66 57,282 4.93 11.5
The third NEEAP (2014) was more ambitious than the EU target (average reduction of fi nal energy consumption of 1.5% per year until 2020). The following table shows savings realized in 2010 compared to 2007, and savings expected in 2016 and 2020 as communicated in the 2014 NEEAP:
More than 50% of the total savings are expected to come from buildings. The Environmental Management of Non-Residential Buildings Act requires the implementation of energy-saving measures with a payback period of fi ve years or less. Further measures related to energy effi ciency in buildings include:10
• Low interest loans for energy-saving measures.
• € 400 million for energy-saving measures in the subsidized rental sector.
• An energy saving fund for landlords.
• A guaranteed fund for energy-saving measures by homeowners’ associations.
• Stricter energy effi ciency requirements for new homes.
• An agreement to make rental homes more energy effi cient.
• More energy-effi cient heating and ventilation systems.
• A Dutch government plan to make new buildings energy-neutral by 2020.
Around 28% of the savings are expected to come from industry and SMEs. Industry has agreed to improve its energy effi ciency by 2% per year. The Dutch government has put in place a so-called Green Deal program, which provides non-fi nancial government support for environmentally-friendly measures and initiatives that will have positive effects on the Dutch economy but may encounter barriers threatening the initiatives’ feasibility. Several tax incentive programs (MIA and VAMIL) also aim to encourage businesses to use environmentally-friendly equipment.
The Netherlands set several targets regarding energy effi ciency, some of which are more ambitious than the initial European-level targets. The Netherlands is partly on track to meet its 2020 energy effi ciency targets: while it already reached its absolute fi nal energy consumption target for 2020, important energy savings have yet to be realized.
6112

To start a new section, hold down the apple+shift keys and click
to release this object and type the section title in the box below.
9 Source: Eurostat. © European Union, 1995-2015 (nrg_ind_334a)
Targets for 2020
In 2013, the Dutch government passed the Energy Agreement for Sustainable Growth, setting key actions to reach its 2020 energy and climate targets. The Agreement aims to reduce fi nal energy consumption by an average of 1.5% per year and sets a 14% renewable energy target by 2020 for fi nal energy consumption. Furthermore, the Agreement calls for an improved and properly functioning EU ETS to reduce overall emissions.
Energy effi ciency targetsThe Netherlands has made energy effi ciency one of its main priorities, as set out in several national plans, including the Energy Agreement for Sustainable Growth (September 2013), the Environmental Management Act (Wet milieubeheer) and the third Dutch National Energy Effi ciency Action Plan (third NEEAP, 2014).
The Netherlands’ set targets are expressed both:
• in absolute terms (fi nal energy consumption of 52 Mtoe in 2020); and
• in relative terms – energy savings of 482 PJ (11.5 Mtoe) by 2020 compared to 2007, introduced by the third NEEAP in 2014.
According to the Energy Agreement (2013), the 2020 goal defi nes an indicative target for fi nal energy consumption of 52 Mtoe, which is 2% higher than it was in 2012 and is equivalent to 2005 energy consumption. Projections are based on national statistics and evaluation models, and any increase in energy consumption derived from GDP growth has to be compensated by equivalent savings across different sectors.
20-20-20 EU targets: what is the Netherlands committed to?• Energy savings: average
reduction in fi nal energy consumption of 1.5% per year.
• 14% renewable energy in 2020 fi nal energy consumption.
• 21% reduction in ETS emissions as compared to the 2005 level.
• 16% reduction in non-ETS emissions as compared to the 2005 level.
Energy effi ciency: while an important share of energy savings remains to be realized, the indicative fi nal energy target for 2020 was already attained in 2012.The Netherlands chose to focus its national target on gross fi nal energy consumption, for which the target in absolute terms was met in 2012.
However, the main goal is to reach 482 PJ (11.5 Mtoe) of cumulative fi nal energy savings by 2020. In 2010, 85% of the target remained to be achieved. Nevertheless, the Netherlands is making good progress to reach the interim 2016 target of 4.9 Mtoe of cumulative energy savings.
Figure 9. Final energy consumption (Mtoe)9
0
10
20
30
40
50
60
20202012201020051990
41
5254
51 52
Figure 10. Final energy consumption in 2012, per sector9
51 Mtoe
27%
20%
7%
17%
29%
Industry Transport Households
Services Agriculture
5
To start a new section, hold down the apple+shift keys and click
to release this object and type the section title in the box below.
To start a new section, hold down the apple+shift keys and click
to release this object and type the section title in the box below.
10 http://www.government.nl/issues/energy-policy/saving-energy
Table 1. Cumulative savings in fi nal energy consumption 2010, 2016 and 2020, as compared to 2007
Savings 2010 Expected savings 2016 Expected savings 2020
Sector GWh Mtoe GWh Mtoe Mtoe
Built environment 9,912 0.85 31,317 2.69 NA
Industry and SMEs 1,548 0.13 5,576 0.48 NA
Transportation 2,172 0.19 10,639 0.91 NA
Agriculture and horticulture 5,706 0.49 9,750 0.84 NA
Total 19,338 1.66 57,282 4.93 11.5
The third NEEAP (2014) was more ambitious than the EU target (average reduction of fi nal energy consumption of 1.5% per year until 2020). The following table shows savings realized in 2010 compared to 2007, and savings expected in 2016 and 2020 as communicated in the 2014 NEEAP:
More than 50% of the total savings are expected to come from buildings. The Environmental Management of Non-Residential Buildings Act requires the implementation of energy-saving measures with a payback period of fi ve years or less. Further measures related to energy effi ciency in buildings include:10
• Low interest loans for energy-saving measures.
• € 400 million for energy-saving measures in the subsidized rental sector.
• An energy saving fund for landlords.
• A guaranteed fund for energy-saving measures by homeowners’ associations.
• Stricter energy effi ciency requirements for new homes.
• An agreement to make rental homes more energy effi cient.
• More energy-effi cient heating and ventilation systems.
• A Dutch government plan to make new buildings energy-neutral by 2020.
Around 28% of the savings are expected to come from industry and SMEs. Industry has agreed to improve its energy effi ciency by 2% per year. The Dutch government has put in place a so-called Green Deal program, which provides non-fi nancial government support for environmentally-friendly measures and initiatives that will have positive effects on the Dutch economy but may encounter barriers threatening the initiatives’ feasibility. Several tax incentive programs (MIA and VAMIL) also aim to encourage businesses to use environmentally-friendly equipment.
The Netherlands set several targets regarding energy effi ciency, some of which are more ambitious than the initial European-level targets. The Netherlands is partly on track to meet its 2020 energy effi ciency targets: while it already reached its absolute fi nal energy consumption target for 2020, important energy savings have yet to be realized.
6 113Energy market reform in Europe

To start a new section, hold down the apple+shift keys and click
to release this object and type the section title in the box below.
Renewable energy targetsThe Energy Agreement for Sustainable Growth set a target of 14% of fi nal energy consumption to come from renewable energies by 2020, going up to 16% by 2023, compared to 4.4% in 2012. These targets seem ambitious, since the Netherlands already missed the 5.1% expected trajectory for 2011– 2012, set up in its National Renewable Energy Action Plan (NREAP).11
However, if these energy effi ciency targets (52 Mtoe of fi nal energy consumption in 2020) are reached, 7.3 Mtoe of fi nal energy consumption should come from renewables by 2020, compared to 2.3 Mtoe in 2012. This means an additional 5 Mtoe will still be required by 2020.
The major policy measure incentivizing the development of renewable energy is the SDE+ scheme (Sustainable Energy Incentive12), which is funded by the state budget. This market-based scheme covers the price difference between fossil energy and sustainable energy for different periods (fi ve, 12 or 15 years), depending on the technology. The SDE+ fi xes one yearly budget for all renewables categories (€ 3.5 billion in 2014) and is opened sequentially in six phases during the year.
Additionally, the Netherlands has support schemes (tax deductions) to further incentivize renewable development. For example, companies can use Energy Investment Allowances (EIA) to invest in energy-effi cient technologies (including renewables) and deduct 41.5% of investment costs from the taxable profi ts.
11 EEA Report No 10/2013 – Trends and projections in Europe 2013
12 http://english.rvo.nl/sites/default/fi les/2014/04/Brochure%20SDE%2B%202014.pdf
13 Source: Eurostat. © European Union, 1995-2015 (t2020_31)
14 EEA – Renewable Energy Projections as Published in the National Renewable Energy Action Plans of the European Member States, 2011
0
20
40
60
2020201220082004
Figure 11. Renewable energy share of final energy use (2012)13
Final Energy Consumption (Mtoe) Share of Renewables (%)
2%
53
3%
54
5%
51 52
14%
0%
5%
10%
15%
Figure 12. Renewable energy share of final energy use by type, in 2005 and 2010, and target for 2020, in %14
0%
2%
4%
6%
8%
10%
12%
14%
16%
TotalBiofuelsOther heatingsectors
Heatpumps
Solidbiomass
Other electricitysectors
WindHydro
2005 2010 2020
7
To start a new section, hold down the apple+shift keys and click
to release this object and type the section title in the box below.
To start a new section, hold down the apple+shift keys and click
to release this object and type the section title in the box below.
15 EWEA Wind in power – 2013 European statistics
16 CBS – Statistics Netherlands
17 EEA 2014a
18 EEA 2014b
In 2013, biomass accounted for the largest share of all renewable energy production, followed by wind power. In the same year, the Netherlands had 2.7 GW of installed wind power capacity,15 0.3 MW of which were installed in 2013. The Energy Agreement aims at scaling up offshore wind power to 4.45 GW in 2020, operational in 2023. In the case of onshore wind power, targeted new capacities are 6 GW by 2020 and 7 GW by 2023.
Renewable target: in 2012, 69% of the country’s target will remain to be achieved. Wind is expected, but unlikely, to close the gap.With 4.4% renewables in the mix, the Netherlands is still far from its 2020 target (14%). The government has set up ambitious plans to close the gap (especially for onshore and offshore wind), but the effectiveness and timeliness of these policies remain to be proven.
Figure 13. Planned offshore wind capacities (in GW)
0
1
2
3
4
5
201920182017201620152014
11.45
2.052.75
3.55
4.45
According to the Energy Agreement, the annual budget to promote renewable energy will increase progressively to € 3.8 billion in 2020.
Reaching the target of 14% renewables in 2020 depends heavily on the development of onshore and offshore wind power over the next six years. Since the planned capacities will require substantial investment, it is questionable if the Netherlands will be able to ramp up its capacities in the remaining time.
CO2 emissions and targetsGreenhouse gas emissions (GHG) have been decreasing since 2010, but the Netherlands remains one of the most fossil fuel- and CO2-intensive economies among EU Member States. In 2013, the energy sector was responsible for the largest share of CO2 emissions (35%), followed by transportation (20%) and the non-energy industry (19%).16
0
50
100
150
200
250
2020201220102005
Figure 14. GHG emissions and target for 2020 (Mt CO2eq)17
ETS Non-ETS ETS target Non-ETS target
The ETS sector is making good progress toward its target (66 Mt CO2eq in 2020, -17 Mt CO2eq compared to 2005 or -21%). In 2012, its GHG emissions already declined by 8 Mt CO2eq (75 Mt CO2eq vs. 83 Mt CO2eq in 2005) or half of its objectives.
For non-ETS sectors, the Netherlands has committed to reduce its emissions by 16% between 2005 and 2020 (i.e. -21 Mt CO2eq), which means that 11 Mt CO2eq remain to be reduced from 2012 to 2020 (52%). It should be noted that emissions dropped from 117 to 108 Mt CO2eq between 2012 and 2013.18
8114

To start a new section, hold down the apple+shift keys and click
to release this object and type the section title in the box below.
Renewable energy targetsThe Energy Agreement for Sustainable Growth set a target of 14% of fi nal energy consumption to come from renewable energies by 2020, going up to 16% by 2023, compared to 4.4% in 2012. These targets seem ambitious, since the Netherlands already missed the 5.1% expected trajectory for 2011– 2012, set up in its National Renewable Energy Action Plan (NREAP).11
However, if these energy effi ciency targets (52 Mtoe of fi nal energy consumption in 2020) are reached, 7.3 Mtoe of fi nal energy consumption should come from renewables by 2020, compared to 2.3 Mtoe in 2012. This means an additional 5 Mtoe will still be required by 2020.
The major policy measure incentivizing the development of renewable energy is the SDE+ scheme (Sustainable Energy Incentive12), which is funded by the state budget. This market-based scheme covers the price difference between fossil energy and sustainable energy for different periods (fi ve, 12 or 15 years), depending on the technology. The SDE+ fi xes one yearly budget for all renewables categories (€ 3.5 billion in 2014) and is opened sequentially in six phases during the year.
Additionally, the Netherlands has support schemes (tax deductions) to further incentivize renewable development. For example, companies can use Energy Investment Allowances (EIA) to invest in energy-effi cient technologies (including renewables) and deduct 41.5% of investment costs from the taxable profi ts.
11 EEA Report No 10/2013 – Trends and projections in Europe 2013
12 http://english.rvo.nl/sites/default/fi les/2014/04/Brochure%20SDE%2B%202014.pdf
13 Source: Eurostat. © European Union, 1995-2015 (t2020_31)
14 EEA – Renewable Energy Projections as Published in the National Renewable Energy Action Plans of the European Member States, 2011
0
20
40
60
2020201220082004
Figure 11. Renewable energy share of final energy use (2012)13
Final Energy Consumption (Mtoe) Share of Renewables (%)
2%
53
3%
54
5%
51 52
14%
0%
5%
10%
15%
Figure 12. Renewable energy share of final energy use by type, in 2005 and 2010, and target for 2020, in %14
0%
2%
4%
6%
8%
10%
12%
14%
16%
TotalBiofuelsOther heatingsectors
Heatpumps
Solidbiomass
Other electricitysectors
WindHydro
2005 2010 2020
7
To start a new section, hold down the apple+shift keys and click
to release this object and type the section title in the box below.
To start a new section, hold down the apple+shift keys and click
to release this object and type the section title in the box below.
15 EWEA Wind in power – 2013 European statistics
16 CBS – Statistics Netherlands
17 EEA 2014a
18 EEA 2014b
In 2013, biomass accounted for the largest share of all renewable energy production, followed by wind power. In the same year, the Netherlands had 2.7 GW of installed wind power capacity,15 0.3 MW of which were installed in 2013. The Energy Agreement aims at scaling up offshore wind power to 4.45 GW in 2020, operational in 2023. In the case of onshore wind power, targeted new capacities are 6 GW by 2020 and 7 GW by 2023.
Renewable target: in 2012, 69% of the country’s target will remain to be achieved. Wind is expected, but unlikely, to close the gap.With 4.4% renewables in the mix, the Netherlands is still far from its 2020 target (14%). The government has set up ambitious plans to close the gap (especially for onshore and offshore wind), but the effectiveness and timeliness of these policies remain to be proven.
Figure 13. Planned offshore wind capacities (in GW)
0
1
2
3
4
5
201920182017201620152014
11.45
2.052.75
3.55
4.45
According to the Energy Agreement, the annual budget to promote renewable energy will increase progressively to € 3.8 billion in 2020.
Reaching the target of 14% renewables in 2020 depends heavily on the development of onshore and offshore wind power over the next six years. Since the planned capacities will require substantial investment, it is questionable if the Netherlands will be able to ramp up its capacities in the remaining time.
CO2 emissions and targetsGreenhouse gas emissions (GHG) have been decreasing since 2010, but the Netherlands remains one of the most fossil fuel- and CO2-intensive economies among EU Member States. In 2013, the energy sector was responsible for the largest share of CO2 emissions (35%), followed by transportation (20%) and the non-energy industry (19%).16
0
50
100
150
200
250
2020201220102005
Figure 14. GHG emissions and target for 2020 (Mt CO2eq)17
ETS Non-ETS ETS target Non-ETS target
The ETS sector is making good progress toward its target (66 Mt CO2eq in 2020, -17 Mt CO2eq compared to 2005 or -21%). In 2012, its GHG emissions already declined by 8 Mt CO2eq (75 Mt CO2eq vs. 83 Mt CO2eq in 2005) or half of its objectives.
For non-ETS sectors, the Netherlands has committed to reduce its emissions by 16% between 2005 and 2020 (i.e. -21 Mt CO2eq), which means that 11 Mt CO2eq remain to be reduced from 2012 to 2020 (52%). It should be noted that emissions dropped from 117 to 108 Mt CO2eq between 2012 and 2013.18
8 115Energy market reform in Europe

To start a new section, hold down the apple+shift keys and click
to release this object and type the section title in the box below.
To start a new section, hold down the apple+shift keys and click
to release this object and type the section title in the box below.
23 http://www.government.nl/news/2014/01/17/natural-gas-production-reduced-and-funds-earmarked-for-groningen.html
24 GATE is a joint venture between Vopak (a tank terminal operator) and Gasunie
25 The Economist, The Netherlands' LNG terminal, Bring on the sanctions, Apr 16th 2014, http://www.economist.com/blogs/charlemagne/2014/04/netherlands-lng-terminal.
26 http://www.government.nl/issues/energy-policy/natural-gas
Long-term priorities are set until 2050, but concrete targets and pathways are missing after 2020.
Changing from a gas net exporter to a net importer may raise several issues, due to an increasing dependency on fossil fuel imports and declining state revenues.
Road ahead and main challenges: the way to 2030 and beyond
Long-term energy priorities but few tangible targetsEvery four years, the Dutch Ministry of Economic Affairs, Agriculture and Innovation publishes an Energy Report that sets out the core energy policies for the country. The 2011 Energy Report focuses on three core long-term priorities:
1. Transition to a cleaner supply of energy, achieving a low carbon-emission economy by 2050;
2. Support the economic goals of the energy sector through green growth; and
3. Ensure a reliable supply of energy through a balanced mix of grey and green energies coming from national and international sources.
The Dutch government approaches these policies through fi ve key objectives:
1. Pursuing a modern industrial policy focused on grey and green energy, which consists of a mix of fossil fuels and renewables;
2. Expanding the share of renewable energies in the short (2020) and long terms (2050);
3. Providing scope for all energy options towards 2050;
4. Supporting Green Deals as a way to encourage private-public partnerships and remove non-economic barriers in the energy sector; and
5. Investing in a sound European energy market with a good infrastructure.
While these objectives provide a framework for energy policies, concrete pathways and targets have not been well articulated. In 2013, the Energy Agreement provided greater detail for a pathway to 2020, but did not set out similar details past that date.
Gas production under pressureThe Netherlands, with its vast Groningen gas fi elds, is the second largest gas producer in Europe, after Norway. Gas production from the large Groningen fi eld is declining and the outlook for domestic unconventional gas remains uncertain. Currently a gas exporter, the Netherlands is likely to become a gas importer by around 2025. The government emphasizes that gas will keep playing a key role in the Dutch energy mix, but this will mark a signifi cant transition as, in 2012, 64% of fi nal energy consumption relied on natural gas.
The Netherlands faces several challenges when it comes to the future role of gas. Due to multiple earthquakes in the Netherlands' most northern province of Groningen, the Dutch Minister of Economic Affairs decided in early 2014 to cut the annual output to 40 bcm by 2016 (the previous outlook was around 49 bcm per year until 2020) and reserves are declining. The expected reduction in government revenue will be € 600 million in 2014, € 700 million in 2015 and € 1 billion in 2016.23
As far as shale gas is concerned, the government is examining if and where it could be extracted in the Netherlands. A decision is expected in 2015.
Other current market developments that might infl uence the long-term vision of natural gas in the Netherlands are cheap coal imports (mainly from the US) and German wind electricity that may force gas-fi red power plants to close down. The shift from being a gas net exporter to a net importer will likely have signifi cant implications on the whole energy system, requiring investments and long-term decisions.
With the GATE24 Liquefi ed Natural Gas (LNG) terminal, which came online in 2011, the government wants to counterbalance this trend. In 2014, the terminal only operated at around 10% of its capacity, due to high LNG prices.25 However, depending on future geopolitical developments – particularly with regard to the relationship between Europe and Russia – LNG may assume a more important role. To secure revenues in the future, the government is currently promoting the establishment of a ‘gas roundabout’ for north-western Europe, encompassing26 gas pipelines, with Gasunie Transport Services (GTS), gas trading through the virtual marketplace’s Title Transfer Facility (TTF), ICE Endex and others, and gas storage (e.g. in the Bergermeer gas fi eld).
10
To start a new section, hold down the apple+shift keys and click
to release this object and type the section title in the box below.
19 http://www.emissieregistratie.nl/erpubliek/erpub/nec.aspx
20 For a detailed list, please refer to the latest Biennial Report under the UNFCCC
21 http://iepd.iipnetwork.org/policy/fi scal-schemes-environmentally-friendly-investment-mia-and-vamil
22 IEA (2015) Policies and Measures Database, IEA, Paris. Accessed at http://www.iea.org/policiesandmeasures/pams/netherlands/name-21089-en.php
Table 2. Examples of climate policies20
Sector Energy Industry Transport Waste Housing Agriculture
Examples of measures
SDE+ and other fi nancial incentives of RES
Energy effi ciency agreements for non-ETS companies(MJA3-covenant)
Incentives for the use of biofuels
Landfi ll policy
Implementation of the Ecodesign Directive
Methane emission regulation (BEMS)
Measures for green investment such as MIA, VAMIL or EIA21
Emission standards Energy Performance Standard (EPN)22
Size of cattle stock and manure management
Estimated cumulative mitigation impact in Mt CO2eq. (2005-2020)
74 17.1 3.6 2.8 2.8 5.5
GHG emission targets: in 2012, the Netherlands had met 47% of its 2020 target (with similar progress in the ETS and non-ETS sectors) and seems to be on track to reach its 2020 targets.
National measures outside the ETS address all sectors (transportation, housing, waste disposal, agriculture and forestry, aquaculture and some parts of industry) through CO2 emission ceilings19 or other measures. A few examples are shown in the table below:
Major savings are expected to come from the energy and the industrial sectors.
As of 2012, the Netherlands was halfway towards its 2020 emission targets, as compared to 2005. If additional measures are implemented as planned and prove to be effective, the country is likely to reach its 2020 CO2 targets.
9
To start a new section, hold down the apple+shift keys and click
to release this object and type the section title in the box below.
27 http://www.world-nuclear-news.org/NN-Mixed_news_on_Netherlands_new_build-2301124.html
Renewables and nuclear powerAccording to the Energy Agreement for Sustainable Growth, renewable energies will play an important role in the future energy mix of the Netherlands, driven mainly by onshore and offshore wind power. The high-scale development of offshore wind farms is still rather recent and there are still uncertainties around the real costs (maintenance and depreciation) and benefi ts (power generation) of these farms. Precise post-evaluation of these costs and benefi ts in the next few years will enable a more effective assessment on the share of the energy mix that can be covered by this technology.
However, the long-term outlook is unclear, since no concrete targets have been set for after 2023. Given that it will already be challenging to reach the 2020 target of a 14% share of renewables in the energy mix, the 16% target for 2023 remains questionable.
For the time being, the Netherlands has only one commercial nuclear reactor (Borssele) in operation, producing 4% of total electricity. However, the Dutch government is in favor of constructing new power plants in the future, subject to strict safety and environmental conditions that are being verifi ed and reinforced in the aftermath of the Fukushima Daiichi accident in March 2011. In 2012, Delta announced that it would postpone any decision to start building a second nuclear power plant by two or three years. The reason behind the decision was “a combination of the fi nancial crisis, the high investment required for a nuclear power plant, the current investment climate and overcapacity in the electricity market combined with low energy prices.”27 So far, no concrete plans have been presented and the Energy Agreement of 2013 was silent on the future of nuclear.
Climate changeThe Dutch government supports an EU-wide reduction in GHG emissions of at least 40% by 2030. It considers this 40% goal as a minimum and generally asks for tighter European agreements to reduce GHG emissions through an improved ETS. However, here again, no concrete targets have yet been announced by the government and decisions will be needed to defi ne the pathway to decarbonize the energy mix beyond 2020.
As far as transport is concerned, the Dutch government wants to cap the transportation sector’s GHG emissions at 25 Mt CO2eq by 2030, 17% lower than it was in 1990; and from 2035, all new passenger cars will have to run CO2 free.
ConclusionThe Netherlands fi nds itself on an historical transition path to a new energy mix. After having relied heavily on its natural gas production for many years, it has to signifi cantly evolve its energy mix to adapt to declining gas outputs and the need to become a gas importer in the next decade. Its path forward may be twofold: a shift back to its centuries-old traditional energy – wind, combined with a move forward to more nuclear power. As of today, key challenges remain to be addressed by 2020, if the Dutch government wants this transition to succeed. Developing wind may be costly and time consuming, while the development of nuclear remains in limbo. The ability to make this transition in an energy-effi cient manner while hitting GHG emission targets may require more signifi cant policy adjustments.
The Energy Agreement of 2013 gives the direction, but will ultimately need enforcement. The energy mix will certainly remain dominated by fossil fuels in the coming decades. However, the Dutch government has also set ambitious targets to increase the share of renewables to 16% by 2023 and to fully support the European climate policy. It will be the success or failure of the implementations of the 2020 policies that will determine the longer-term policies that remain to be defi ned.
Ambitious on wind and a blank page for the future of nuclear. The two main types of energy the Netherlands has decided to develop are wind and nuclear. While the target and trajectory are rather clear for wind, nuclear development still remains in limbo.
High ambition regarding climate change, but a lack of specifi c targets.
11 116
To start a new section, hold down the apple+shift keys and click
to release this object and type the section title in the box below.
To start a new section, hold down the apple+shift keys and click
to release this object and type the section title in the box below.
23 http://www.government.nl/news/2014/01/17/natural-gas-production-reduced-and-funds-earmarked-for-groningen.html
24 GATE is a joint venture between Vopak (a tank terminal operator) and Gasunie
25 The Economist, The Netherlands' LNG terminal, Bring on the sanctions, Apr 16th 2014, http://www.economist.com/blogs/charlemagne/2014/04/netherlands-lng-terminal.
26 http://www.government.nl/issues/energy-policy/natural-gas
Long-term priorities are set until 2050, but concrete targets and pathways are missing after 2020.
Changing from a gas net exporter to a net importer may raise several issues, due to an increasing dependency on fossil fuel imports and declining state revenues.
Road ahead and main challenges: the way to 2030 and beyond
Long-term energy priorities but few tangible targetsEvery four years, the Dutch Ministry of Economic Affairs, Agriculture and Innovation publishes an Energy Report that sets out the core energy policies for the country. The 2011 Energy Report focuses on three core long-term priorities:
1. Transition to a cleaner supply of energy, achieving a low carbon-emission economy by 2050;
2. Support the economic goals of the energy sector through green growth; and
3. Ensure a reliable supply of energy through a balanced mix of grey and green energies coming from national and international sources.
The Dutch government approaches these policies through fi ve key objectives:
1. Pursuing a modern industrial policy focused on grey and green energy, which consists of a mix of fossil fuels and renewables;
2. Expanding the share of renewable energies in the short (2020) and long terms (2050);
3. Providing scope for all energy options towards 2050;
4. Supporting Green Deals as a way to encourage private-public partnerships and remove non-economic barriers in the energy sector; and
5. Investing in a sound European energy market with a good infrastructure.
While these objectives provide a framework for energy policies, concrete pathways and targets have not been well articulated. In 2013, the Energy Agreement provided greater detail for a pathway to 2020, but did not set out similar details past that date.
Gas production under pressureThe Netherlands, with its vast Groningen gas fi elds, is the second largest gas producer in Europe, after Norway. Gas production from the large Groningen fi eld is declining and the outlook for domestic unconventional gas remains uncertain. Currently a gas exporter, the Netherlands is likely to become a gas importer by around 2025. The government emphasizes that gas will keep playing a key role in the Dutch energy mix, but this will mark a signifi cant transition as, in 2012, 64% of fi nal energy consumption relied on natural gas.
The Netherlands faces several challenges when it comes to the future role of gas. Due to multiple earthquakes in the Netherlands' most northern province of Groningen, the Dutch Minister of Economic Affairs decided in early 2014 to cut the annual output to 40 bcm by 2016 (the previous outlook was around 49 bcm per year until 2020) and reserves are declining. The expected reduction in government revenue will be € 600 million in 2014, € 700 million in 2015 and € 1 billion in 2016.23
As far as shale gas is concerned, the government is examining if and where it could be extracted in the Netherlands. A decision is expected in 2015.
Other current market developments that might infl uence the long-term vision of natural gas in the Netherlands are cheap coal imports (mainly from the US) and German wind electricity that may force gas-fi red power plants to close down. The shift from being a gas net exporter to a net importer will likely have signifi cant implications on the whole energy system, requiring investments and long-term decisions.
With the GATE24 Liquefi ed Natural Gas (LNG) terminal, which came online in 2011, the government wants to counterbalance this trend. In 2014, the terminal only operated at around 10% of its capacity, due to high LNG prices.25 However, depending on future geopolitical developments – particularly with regard to the relationship between Europe and Russia – LNG may assume a more important role. To secure revenues in the future, the government is currently promoting the establishment of a ‘gas roundabout’ for north-western Europe, encompassing26 gas pipelines, with Gasunie Transport Services (GTS), gas trading through the virtual marketplace’s Title Transfer Facility (TTF), ICE Endex and others, and gas storage (e.g. in the Bergermeer gas fi eld).
10
To start a new section, hold down the apple+shift keys and click
to release this object and type the section title in the box below.
27 http://www.world-nuclear-news.org/NN-Mixed_news_on_Netherlands_new_build-2301124.html
Renewables and nuclear powerAccording to the Energy Agreement for Sustainable Growth, renewable energies will play an important role in the future energy mix of the Netherlands, driven mainly by onshore and offshore wind power. The high-scale development of offshore wind farms is still rather recent and there are still uncertainties around the real costs (maintenance and depreciation) and benefi ts (power generation) of these farms. Precise post-evaluation of these costs and benefi ts in the next few years will enable a more effective assessment on the share of the energy mix that can be covered by this technology.
However, the long-term outlook is unclear, since no concrete targets have been set for after 2023. Given that it will already be challenging to reach the 2020 target of a 14% share of renewables in the energy mix, the 16% target for 2023 remains questionable.
For the time being, the Netherlands has only one commercial nuclear reactor (Borssele) in operation, producing 4% of total electricity. However, the Dutch government is in favor of constructing new power plants in the future, subject to strict safety and environmental conditions that are being verifi ed and reinforced in the aftermath of the Fukushima Daiichi accident in March 2011. In 2012, Delta announced that it would postpone any decision to start building a second nuclear power plant by two or three years. The reason behind the decision was “a combination of the fi nancial crisis, the high investment required for a nuclear power plant, the current investment climate and overcapacity in the electricity market combined with low energy prices.”27 So far, no concrete plans have been presented and the Energy Agreement of 2013 was silent on the future of nuclear.
Climate changeThe Dutch government supports an EU-wide reduction in GHG emissions of at least 40% by 2030. It considers this 40% goal as a minimum and generally asks for tighter European agreements to reduce GHG emissions through an improved ETS. However, here again, no concrete targets have yet been announced by the government and decisions will be needed to defi ne the pathway to decarbonize the energy mix beyond 2020.
As far as transport is concerned, the Dutch government wants to cap the transportation sector’s GHG emissions at 25 Mt CO2eq by 2030, 17% lower than it was in 1990; and from 2035, all new passenger cars will have to run CO2 free.
ConclusionThe Netherlands fi nds itself on an historical transition path to a new energy mix. After having relied heavily on its natural gas production for many years, it has to signifi cantly evolve its energy mix to adapt to declining gas outputs and the need to become a gas importer in the next decade. Its path forward may be twofold: a shift back to its centuries-old traditional energy – wind, combined with a move forward to more nuclear power. As of today, key challenges remain to be addressed by 2020, if the Dutch government wants this transition to succeed. Developing wind may be costly and time consuming, while the development of nuclear remains in limbo. The ability to make this transition in an energy-effi cient manner while hitting GHG emission targets may require more signifi cant policy adjustments.
The Energy Agreement of 2013 gives the direction, but will ultimately need enforcement. The energy mix will certainly remain dominated by fossil fuels in the coming decades. However, the Dutch government has also set ambitious targets to increase the share of renewables to 16% by 2023 and to fully support the European climate policy. It will be the success or failure of the implementations of the 2020 policies that will determine the longer-term policies that remain to be defi ned.
Ambitious on wind and a blank page for the future of nuclear. The two main types of energy the Netherlands has decided to develop are wind and nuclear. While the target and trajectory are rather clear for wind, nuclear development still remains in limbo.
High ambition regarding climate change, but a lack of specifi c targets.
11 117Energy market reform in Europe

Selected bibliographic references
© OECD/IEA 2009 Energy Policies of IEA Countries – Belgium 2009 Review, IEA Publishing. Licence: http://www.iea.org/t&c/
European Commission (2014) – Progress Report on energy effi ciency in the European Union SWD(2013) 541 fi nal, Source: http://ec.europa.eu. © European Union, 1995-2015
SER (2013) – Energy Agreement for Sustainable Growth (Energieakkoord voor duurzame groei)
Second National Energy Effi ciency Action Plan for the Netherlands (2011)
Third National Energy Effi ciency Action Plan for the Netherlands (2014)
European Commission, Energy Markets in the European Union in 2011, Country fi che Netherlands, Source: http://ec.europa.eu. © European Union, 1995-2015
EEA Report (2013) – Trends and projections in Europe 2013 – Tracking progress towards Europe's climate and energy targets until 2020
EEA Report (2014a) – Annual European Union greenhouse gas inventory 1990 – 2012 and inventory report 2014
EEA (2014b), Trends and projections in Europe 2014
ECN (2013) – Toegevoegde waarde van de elektriciteitssector voor de Nederlandse economie
SEO (2012) – Energy policy after 2020
Ecologic Institute (2014) – Assessment of climate change policies in the context of the European Semester Country Report: The Netherlands
Concerted Action Energy Effi ciency Directive (2014) D9: EED implementation in The Netherlands
PBL Netherlands Environmental Assessment Agency (2013) – Non-ETS emission targets for 2030
Eurostat. © European Union, 1995-2015
http://statline.cbs.nl
Eurelectric (2014), Analysis of European Power Price Increase Drivers
12118
Selected bibliographic references
© OECD/IEA 2009 Energy Policies of IEA Countries – Belgium 2009 Review, IEA Publishing. Licence: http://www.iea.org/t&c/
European Commission (2014) – Progress Report on energy effi ciency in the European Union SWD(2013) 541 fi nal, Source: http://ec.europa.eu. © European Union, 1995-2015
SER (2013) – Energy Agreement for Sustainable Growth (Energieakkoord voor duurzame groei)
Second National Energy Effi ciency Action Plan for the Netherlands (2011)
Third National Energy Effi ciency Action Plan for the Netherlands (2014)
European Commission, Energy Markets in the European Union in 2011, Country fi che Netherlands, Source: http://ec.europa.eu. © European Union, 1995-2015
EEA Report (2013) – Trends and projections in Europe 2013 – Tracking progress towards Europe's climate and energy targets until 2020
EEA Report (2014a) – Annual European Union greenhouse gas inventory 1990 – 2012 and inventory report 2014
EEA (2014b), Trends and projections in Europe 2014
ECN (2013) – Toegevoegde waarde van de elektriciteitssector voor de Nederlandse economie
SEO (2012) – Energy policy after 2020
Ecologic Institute (2014) – Assessment of climate change policies in the context of the European Semester Country Report: The Netherlands
Concerted Action Energy Effi ciency Directive (2014) D9: EED implementation in The Netherlands
PBL Netherlands Environmental Assessment Agency (2013) – Non-ETS emission targets for 2030
Eurostat. © European Union, 1995-2015
http://statline.cbs.nl
Eurelectric (2014), Analysis of European Power Price Increase Drivers
12
European energy market reformCountry profi le: Spain
119Energy market reform in Europe

Contents
Current situation 121
Energy consumption and trade balance 121
Power generation 122
Power market: main actors 124
Power prices 125
Targets for 2020 127
Energy efficiency targets 127
Renewable energy targets 128
CO2 emissions and targets 130
Road ahead and main challenges: the way to 2030 and beyond 131
Energy dependence 131
International energy trade 132
Energy efficiency 132
Renewable power generation 132
Conclusion 133
Selected bibliographic references 134
120

To start a new section, hold down the apple+shift keys and click
to release this object and type the section title in the box below.
Current situation
Energy consumption and trade balanceIn 2012, Spain’s primary energy consumption (PEC) amounted to 127 Mtoe.1 More than 75% came from fossil fuels. Petroleum products (54 Mtoe in 2012) represent the main source of energy consumption, followed by natural gas (28 Mtoe in 2012).
Spain’s energy dependence was estimated at 73% in 2012, which is higher than the EU’s energy dependence (around 50%). The energy and transportation sectors are the largest primary energy consumers, and are highly dependent on fossil fuels.
1 The primary energy consumption value presented refer to ‘Gross inland energy consumption by fuel type’ in Eurostat (Data Table: tsdcc320)Source: Eurostat. © European Union, 1995-2015
2 Source: Eurostat. © European Union, 1995-2015
Primary energy consumption sharply increased between 1990 and 2000 (+37%), although it grew by only 3% between 2000 and 2012. This slowing trend is mainly due to an 18% decrease of primary energy consumption in the industrial sector, which has been more than offset by a growth in the energy sector (+11%), in services (+50%) and in the residential sector (+29%). As a result, Spain’s energy intensity (primary energy consumption/GDP) dropped by 15% between 2000 and 2012 (with a peak in 2004).
The energy sector represented 31% of primary energy consumption in 2012 and has grown by 11% since 2000, mainly as a result of a rapid increase in power generation. Transport is the second largest consumer, contributing 26% of primary energy consumption in 2012, although remaining stable in volume between 2000 and 2012.
Key fi gures: Population (2013):46.5 m cap.
GDP (2013): € 1,049 bn €
GDP/capita (2013): € 22,559
GDP/PEC (2012): 8.1 €/kgoe
PEC/capita (2012): 2.72 toe/cap.
Figure 1. Primary energy consumption in 2012 (127 Mtoe)2
12%
22%
6%
5%
12%
1%
42%
Coal Petroleum products Gas
Nuclear
Biomass and waste
Wind, solar, geothermal Hydraulic
Figure 2. Primary energy consumption by sector (in Mtoe)2
Energy sector Transports
Agriculture Others
Residential
Industry Services Non-energyconsumption
0
20
40
60
80
100
120
140
201220001990
27
23
9
20
36
90 Mtoe
39
33
15
21
10
6127 Mtoe
35
33
12
25
79
124 Mtoe
1 121Energy market reform in Europe

To start a new section, hold down the apple+shift keys and click
to release this object and type the section title in the box below.
To start a new section, hold down the apple+shift keys and click
to release this object and type the section title in the box below.
Spain depends heavily on fossil fuel imports (petroleum products, coal and natural gas). In total, the volume of imported energy remained steady between 2000 and 2012 (99 Mtoe in 2000 and in 2012).
Between 2000 and 2012, petroleum product imports decreased from 71 Mtoe to 59 Mtoe, while natural gas imports rose from 15 Mtoe to 28 Mtoe. Coal (solid fuel) imports were relatively stable in euros over the same period: 13 Mtoe in 2000 and 12 Mtoe in 2012. However, the development of shale gas in the US has resulted in cheap coal entering the market, which seems to have impacted European coal imports. A 28% increase in Spain’s coal imports was observed in 2012 compared to 2011,3 although imports dropped again in 2013.
Power generation Renewable energies grew rapidly over the last 10 years. Spain has 51 GW of renewable power generation capacity (47% of total installed capacity), accounting for 41% of electricity production. Wind and solar PV installed capacity were respectively 23.0 and 4.7 GW (26% of electricity capacity in 2013), generating 20% and 3% of overall electricity. Hydropower (19% of installed power capacity and 15% of production) and other renewables (3% of installed power capacity and 3% of production) – mostly solar thermal power – complete the renewable electricity generation mix.
Fossil fuels still represent 40% of electricity production. Nuclear power plants generate 21% of electricity output with 7% of the capacity mix. Currently, there are six nuclear power plants in operation in Spain, and a total of eight reactors. They were built in the 1970s and ‘80s and their licenses expire between 2021 and 2034. Furthermore, one reactor (Zorita) has been deactivated due to its age and another (Vandellos) is in its fi nal phase of being dismantled after an accident occurred in 1989.4
3 El Sistema Electrico Espanol 2013, Red Electrica de Espana
4 Ministerio de Industria, Energia y Turismo (2014): http://www.minetur.gob.es/energia/nuclear/Centrales/Paginas/ListadoCentrales.aspx
Figure 3. Energy trade balance (Mtoe)2
1990 2000 2012
-80
-60
-40
-20
0
20
Electrical energyGasTotal petroleum productsSolid fuels
-7 -13 -12
-48
-71-59
-4
0 0 1
-15-28
Spain has 51 GW of renewable power generation capacity (47% of total installed capacity), accounting for 41% of electricity production. There is signifi cant excess capacity in power production.Spain, continental system, currently uses only half of its installed capacity during peak demand (101,828 MW vs. 43,010 MW).
21%
19%
Figure 4. Electricity capacity – 108 MW (2013)3
11%
7%
35%
4%
3%
Fuel & Gas Nuclear Coal
Hydro Wind PV
Other renewables
47%
20%
15%
Figure 5. Net generation – 274 GWh (2013)3
15%
20%
24%
3%3%
Fuel & Gas Nuclear Coal
Hydro Wind PV
Other renewables
41%
2122
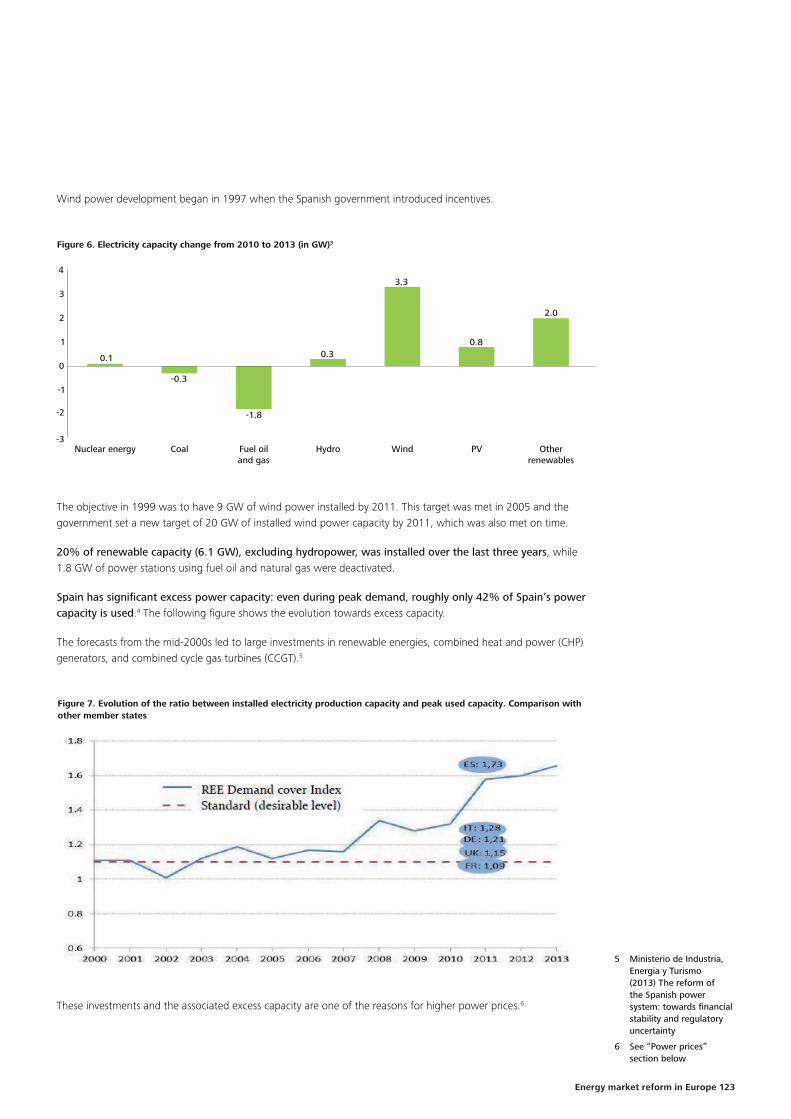
To start a new section, hold down the apple+shift keys and click
to release this object and type the section title in the box below.
Wind power development began in 1997 when the Spanish government introduced incentives.
5 Ministerio de Industria, Energia y Turismo (2013) The reform of the Spanish power system: towards fi nancial stability and regulatory uncertainty
6 See “Power prices” section below
Figure 6. Electricity capacity change from 2010 to 2013 (in GW)3
-3
-2
-1
0
1
2
3
4
Otherrenewables
PVWindHydroFuel oiland gas
CoalNuclear energy
0.1
-0.3
-1.8
0.3
3.3
0.8
2.0
The objective in 1999 was to have 9 GW of wind power installed by 2011. This target was met in 2005 and the government set a new target of 20 GW of installed wind power capacity by 2011, which was also met on time.
20% of renewable capacity (6.1 GW), excluding hydropower, was installed over the last three years, while 1.8 GW of power stations using fuel oil and natural gas were deactivated.
Spain has signifi cant excess power capacity: even during peak demand, roughly only 42% of Spain’s power capacity is used.4 The following fi gure shows the evolution towards excess capacity.
The forecasts from the mid-2000s led to large investments in renewable energies, combined heat and power (CHP) generators, and combined cycle gas turbines (CCGT).5
These investments and the associated excess capacity are one of the reasons for higher power prices.6
Figure 7. Evolution of the ratio between installed electricity production capacity and peak used capacity. Comparison withother member states
3 123Energy market reform in Europe

To start a new section, hold down the apple+shift keys and click
to release this object and type the section title in the box below.
To start a new section, hold down the apple+shift keys and click
to release this object and type the section title in the box below.
The main companies and their respective market share of electricity generation are: Endesa (23.8%), Iberdrola (20.1%), Gas Natural Fenosa (11.4%), EGL (8.1%), EDP Hidrocantábrico Energía (6.0%), Acciona (4.7%), E.ON (3.0%), EVM (2.7%) and Nexus (2.2%).7 Smaller players, however, sell around 18% of electricity. Electricity is traded in the Mercado Ibérico de la Electricidad (MIBEL), which also includes Portuguese players.
Red Eléctrica de España (REE) is the single transmission system operator for Spain, owned by REE Group, and is neither involved in power generation nor supply.
There are more than 50 DSOs, the main ones being owned and operated by Endesa, Iberdrola, Unión Fenosa, Hidrocantábrico and E.ON.
Power market: main actorsSpain’s electricity market was deregulated in 1998 and integrated with the Portuguese electricity market in 2007. There is a relatively high degree of concentration in the Spanish electricity market, as a few players have dominant roles.
Figure 8. Market share of electricity generation (2012)7
23.8%18.0%
8.1%
6.0%
3.0%
2.7%
2.1%
11.4%
4.7%
20.1%
Endesa
Iberdrola
Gas Natural Fenosa
EGL
E.ON
EVM
Nexus
Others
EDP Hidrocantábrico Energia
Acciona
7 Comisión Nacional de Energía (CNE)
There are numerous players in Spain’s power generation market, but the three largest companies have more than 55% of the market share.
4124

To start a new section, hold down the apple+shift keys and click
to release this object and type the section title in the box below.
Electricity prices are sharply on the rise (+46% for residential prices between 2008 and 2012), while the country struggles with a heavy tariff defi cit (€ 30 billion over the last 15 years).
Figure 9. Retail prices for industrial (left) and residential (right) users (€/MWh)8
0
20
40
60
80
100
120
140
201220102008
5.2
76.2
25.4
106.8€
5%
71%
24%
72.8
5.3
31.2
109.3€
5%
67%
29%
5.8
73.9
39.8
119.5€
5%
62%
33%
0
50
100
150
200
250
201220102008
89.4
28
38.3
155.7€
18%
57%
25%
33.3
83.5
68.3
185.1€
18%
45%
37%
48.6
82.3
96.6
227.5€
21%
36%
42%
Grid Energy and supply Taxes Grid Energy and supply Taxes
8 Source: Eurostat. © European Union, 1995-2015
9 Eurelectric (2014) Analysis of European Power Drivers
10 David Robinson (2013) Pulling the plug on renewable power in Spain. The Oxford Institute for Energy Studies
Strong fi nancial incentives were implemented to support the development of renewables and are refl ected in the grid component of the tariffs. According to a recent study published by Eurelectric,9 taxes and levies represented 50% of Spain’s household prices. They include policy support costs which were at 66 €/MWh, the highest level in Europe (the European average was 25 €/MWh in 2012).
For industrial users, taxes and levies were 32 €/MWh in 2012 (or 27% of the price), with 27 €/MWh to cover policy and support costs (slightly above the EU average of 21 €/MWh).
The costs of public support for renewables were supposed to be covered by a third-party access tariff, paid by consumers. However, the rapid expansion of renewable energy increased the costs higher than expected and the third-party access tariff paid by consumers did not cover all costs. This was one the main elements that led to an accumulated tariff defi cit of € 30 billion over the last 15 years,10 which is, at the moment, fi nanced through a debt held by Spain’s fi ve largest energy companies and, accordingly, not refl ected in the actual electricity tariffs.
Power pricesIn 2012, retail prices for industrial users were around 120 €/MWh, slightly below the European average (125 €/MWh). Prices increased by 12% between 2008 and 2012 (+13.3 €/MWh), mostly due to rising grid costs (+14.4 €/MWh), as shown in the graph below. In the fi gures published by Eurostat for Spain, incentives to promote renewables and other costs of the electricity system are included in grid tariffs.
In 2012, retail prices for residential customers reached 228 €/MWh, which is higher than the European average (200 €/MWh). Prices rose by 46% between 2008 and 2012 – grid costs were 152% higher in 2012 compared to 2008 and taxes were 73% higher.
5 125Energy market reform in Europe

To start a new section, hold down the apple+shift keys and click
to release this object and type the section title in the box below.
To start a new section, hold down the apple+shift keys and click
to release this object and type the section title in the box below.
The Spanish government has been struggling to redesign electricity markets, to reduce the defi cit: in recent years, support and incentives for renewable energy were not fully passed through to customers through regulated tariffs, leading to a defi cit. The government has been operating the power system at a loss. Recently, it changed the feed-in-tariff system for renewables – the fi gure below illustrates the difference between the revenues and costs of the power system, and the country’s debt accumulation.
A series of measures has been implemented to prevent the tariff defi cit from growing. This should be achieved by charging increased access tariffs to the fi nal customers, reducing remuneration paid to network operators and cutting incentives, including those for renewable power (reduction of feed-in tariffs).
Figure 10. Evolution of revenues and costs of the Spanish power system (€/MWh)
6126
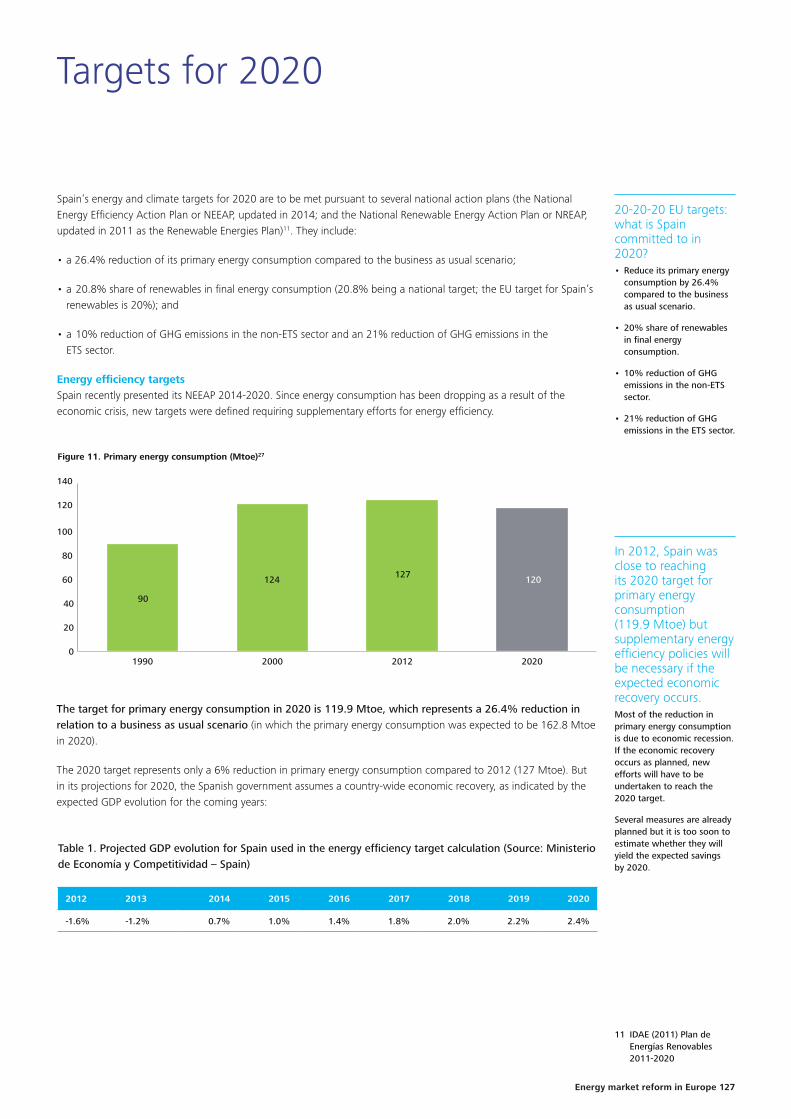
To start a new section, hold down the apple+shift keys and click
to release this object and type the section title in the box below.
Targets for 2020
20-20-20 EU targets: what is Spain committed to in 2020?• Reduce its primary energy
consumption by 26.4% compared to the business as usual scenario.
• 20% share of renewables in fi nal energy consumption.
• 10% reduction of GHG emissions in the non-ETS sector.
• 21% reduction of GHG emissions in the ETS sector.
11 IDAE (2011) Plan de Energías Renovables 2011-2020
Spain’s energy and climate targets for 2020 are to be met pursuant to several national action plans (the National Energy Effi ciency Action Plan or NEEAP, updated in 2014; and the National Renewable Energy Action Plan or NREAP, updated in 2011 as the Renewable Energies Plan)11. They include:
• a 26.4% reduction of its primary energy consumption compared to the business as usual scenario;
• a 20.8% share of renewables in fi nal energy consumption (20.8% being a national target; the EU target for Spain’s renewables is 20%); and
• a 10% reduction of GHG emissions in the non-ETS sector and an 21% reduction of GHG emissions in the ETS sector.
Energy effi ciency targetsSpain recently presented its NEEAP 2014-2020. Since energy consumption has been dropping as a result of the economic crisis, new targets were defi ned requiring supplementary efforts for energy effi ciency.
Figure 11. Primary energy consumption (Mtoe)27
0
20
40
60
80
100
120
140
2020201220001990
90
124 127 120
The target for primary energy consumption in 2020 is 119.9 Mtoe, which represents a 26.4% reduction in relation to a business as usual scenario (in which the primary energy consumption was expected to be 162.8 Mtoe in 2020).
The 2020 target represents only a 6% reduction in primary energy consumption compared to 2012 (127 Mtoe). But in its projections for 2020, the Spanish government assumes a country-wide economic recovery, as indicated by the expected GDP evolution for the coming years:
Table 1. Projected GDP evolution for Spain used in the energy effi ciency target calculation (Source: Ministerio de Economía y Competitividad – Spain)
2012 2013 2014 2015 2016 2017 2018 2019 2020
-1.6% -1.2% 0.7% 1.0% 1.4% 1.8% 2.0% 2.2% 2.4%
In 2012, Spain was close to reaching its 2020 target for primary energy consumption (119.9 Mtoe) but supplementary energy effi ciency policies will be necessary if the expected economic recovery occurs.Most of the reduction in primary energy consumption is due to economic recession. If the economic recovery occurs as planned, new efforts will have to be undertaken to reach the 2020 target.
Several measures are already planned but it is too soon to estimate whether they will yield the expected savings by 2020.
7 127Energy market reform in Europe

To start a new section, hold down the apple+shift keys and click
to release this object and type the section title in the box below.
To start a new section, hold down the apple+shift keys and click
to release this object and type the section title in the box below.
If the GDP evolution follows this expected trend, the country’s energy effi ciency targets appear ambitious. The Spanish government believes this may represent a threat to the country’s economic recovery. Moreover, the NEEAP notes that a 26.4% reduction is much higher than the 20% overall reduction required for the EU as a whole.
The energy effi ciency measures implemented so far resulted in fi nal energy savings in 2012, with 2007 as a reference year, of only 2.5 Mtoe (source: NEEAP 2014). Most of this reduction in energy consumption is attributed to the economic crisis. If Spain realizes the economic growth projected in Table 1, it seems rather unlikely that the country will achieve its energy savings target unless energy effi ciency policies make much additional progress. This raises speculation regarding the extent to which existing policies are compatible with the country’s economic growth projections and energy effi ciency targets.
Transport represents 26% of primary energy consumption and is the largest energy-consuming sector. Different policy measures have been taken:
• Economic incentives for the purchase of effi cient vehicles (emitting less than 160 g of CO2/km) to replace older ones (10 to 12 years old, depending on vehicle category).12
• Incentives for the use of electric vehicles: lower electricity prices during the night for vehicle battery recharge; subsidies for the purchase of electric vehicles that may reach € 6,000 for private users and € 15,000 to € 30,000 for buses and trucks, depending on the vehicle used.13
• Training programs to improve driving effi ciency.14
In the building sector, various measures have also been implemented to retrofi t existing buildings. The residential sector has mandatory energy performance certifi cation for buildings of more than 1,000 m2 but there are no sanctions in case of non-compliance. Special loan terms are proposed for household owners willing to optimize thermal insulation, substitute energy sources for heating installations (conventional energy source by biomass or geothermal energy) and enhance lighting effi ciency. 15There are also specifi c programs focused on the hospitality industry (e.g. hotels).16. 17
For the industrial sector, economic incentives (€ 120 million per year) for investments in more energy-effi cient technologies have been implemented with the NEEAP and mandatory energy management systems are expected to be introduced in the near future. That said, energy savings targets for individual companies are still lacking.
Additionally, Spain decided to strengthen its policy to encourage energy savings:
• Energy Effi ciency Obligations (trading certifi cates scheme) targeting retailers of electricity and of fossil fuel-derived products (including those used in transportation) should be operational in 2015-2016, but have yet to be developed)
• A National Energy Effi ciency Fund, funded through contributions of obligated parties, is also under discussion
Renewable energy targetsIn 2012, the share of renewables in Spain’s fi nal energy consumption amounted to 14.3% and the target set by the European Commission for 2020 is 20% (with a more ambitious target of 20.8% set at the national level). The share of renewables has been steadily increasing (8.3% in 2004, 10.8% in 2008, 13.8% in 2010 and 14.3% in 2012) and Spain met its indicative trajectory (presented in the NREAP) for the year 2012. This was one of the fastest progressions in the share of renewable energies in Europe (behind Estonia and Austria).18 Even though the renewables target set by the EU is 20%, the NREAP set a 22.7% goal from 2010. This target was revised in 2011 and set at 20.8%.
12 PIVE (Programas de Incentivos al Vehículo Efi ciente)
13 Proyecto MOVELE
14 onvenios IDAE-DGT conducción efi ciente del vehículo turismo, camiones y autobuses
15 PAREER (Programa de Ayudas para la Rehabilitación Energética de Edifícios Existentes)
16 PIMA SOL (ayudas para proyectos de rehabilitación energética de las instalaciones del sector hotelero)
17 If we consider fi nal energy consumption instead of primary energy consumption, the corresponding target is 80.1 Mtoe of fi nal energy consumption in 2020 (in the business as usual scenario, the fi nal energy consumption is 103.4 Mtoe). This target represents a 23.3 Mtoe reduction compared to the business as usual scenario. The above mentioned programs (amongst others already implemented in 2014) are expected to save 1.7 Mtoe by 2020 – only 7.3% of this target
18 European Environment Agency (2013) Trends and projections in Europe 2013: Tracking progress towards Europe’s climate and energy targets until 2020
8128
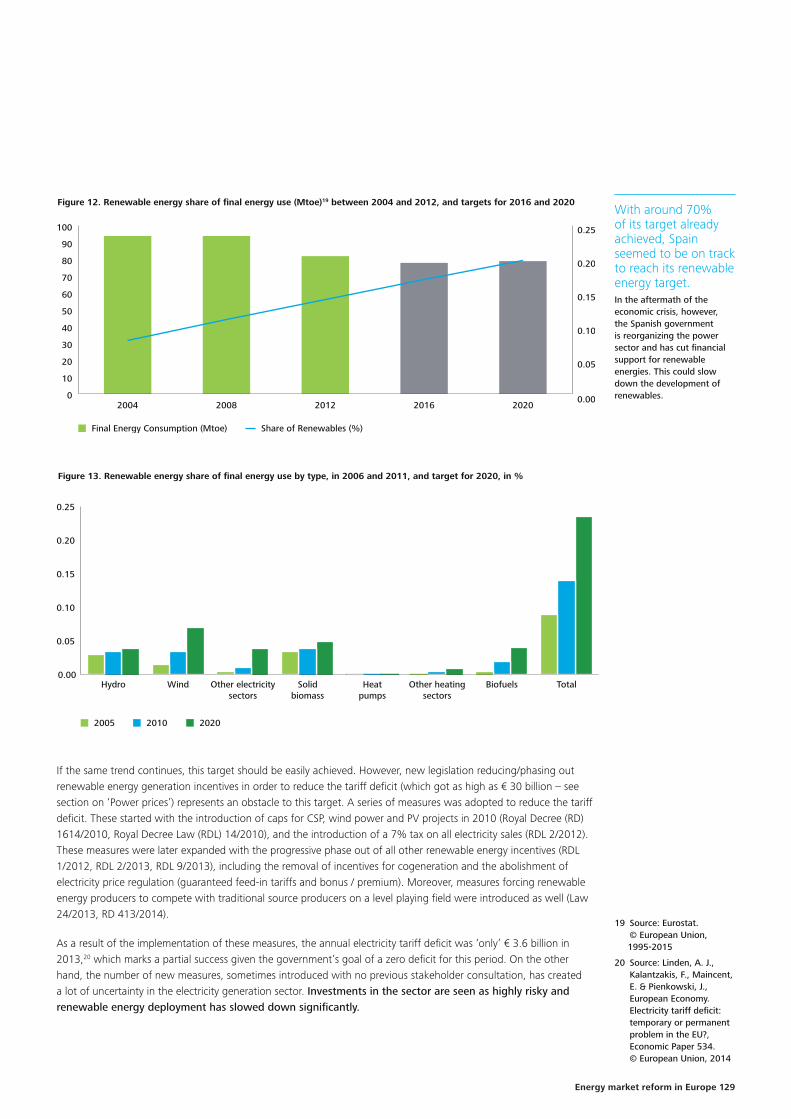
To start a new section, hold down the apple+shift keys and click
to release this object and type the section title in the box below.
19 Source: Eurostat. © European Union, 1995-2015
20 Source: Linden, A. J., Kalantzakis, F., Maincent, E. & Pienkowski, J., European Economy. Electricity tariff defi cit: temporary or permanent problem in the EU?, Economic Paper 534. © European Union, 2014
With around 70% of its target already achieved, Spain seemed to be on track to reach its renewable energy target. In the aftermath of the economic crisis, however, the Spanish government is reorganizing the power sector and has cut fi nancial support for renewable energies. This could slow down the development of renewables.
If the same trend continues, this target should be easily achieved. However, new legislation reducing/phasing out renewable energy generation incentives in order to reduce the tariff defi cit (which got as high as € 30 billion – see section on ‘Power prices’) represents an obstacle to this target. A series of measures was adopted to reduce the tariff defi cit. These started with the introduction of caps for CSP, wind power and PV projects in 2010 (Royal Decree (RD) 1614/2010, Royal Decree Law (RDL) 14/2010), and the introduction of a 7% tax on all electricity sales (RDL 2/2012). These measures were later expanded with the progressive phase out of all other renewable energy incentives (RDL 1/2012, RDL 2/2013, RDL 9/2013), including the removal of incentives for cogeneration and the abolishment of electricity price regulation (guaranteed feed-in tariffs and bonus / premium). Moreover, measures forcing renewable energy producers to compete with traditional source producers on a level playing fi eld were introduced as well (Law 24/2013, RD 413/2014).
As a result of the implementation of these measures, the annual electricity tariff defi cit was ‘only’ € 3.6 billion in 2013,20 which marks a partial success given the government’s goal of a zero defi cit for this period. On the other hand, the number of new measures, sometimes introduced with no previous stakeholder consultation, has created a lot of uncertainty in the electricity generation sector. Investments in the sector are seen as highly risky and renewable energy deployment has slowed down signifi cantly.
0
10
20
30
40
50
60
70
80
90
100
20202016201220082004
Figure 12. Renewable energy share of final energy use (Mtoe)19 between 2004 and 2012, and targets for 2016 and 2020
Final Energy Consumption (Mtoe) Share of Renewables (%)
0.00
0.05
0.10
0.15
0.20
0.25
Figure 13. Renewable energy share of final energy use by type, in 2006 and 2011, and target for 2020, in %
0.00
0.05
0.10
0.15
0.20
0.25
TotalBiofuelsOther heatingsectors
Heatpumps
Solidbiomass
Other electricitysectors
WindHydro
2005 2010 2020
9 129Energy market reform in Europe
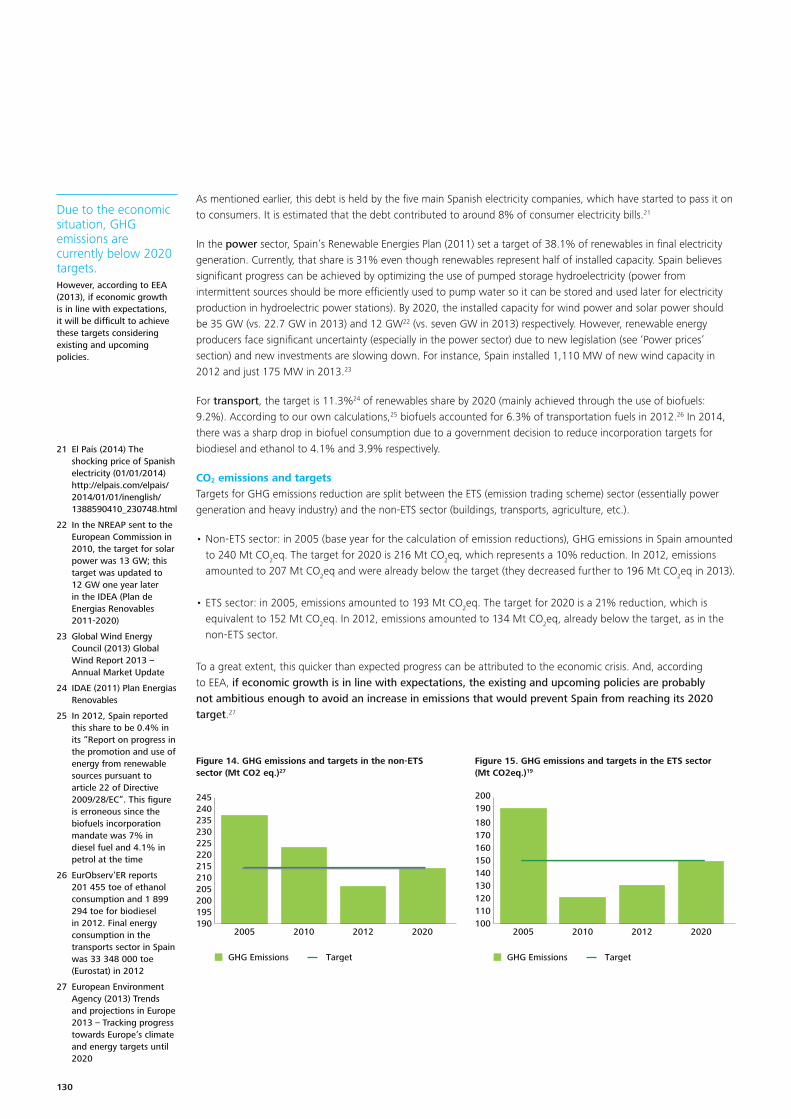
To start a new section, hold down the apple+shift keys and click
to release this object and type the section title in the box below.
To start a new section, hold down the apple+shift keys and click
to release this object and type the section title in the box below.
Due to the economic situation, GHG emissions are currently below 2020 targets.However, according to EEA (2013), if economic growth is in line with expectations, it will be diffi cult to achieve these targets considering existing and upcoming policies.
As mentioned earlier, this debt is held by the fi ve main Spanish electricity companies, which have started to pass it on to consumers. It is estimated that the debt contributed to around 8% of consumer electricity bills.21
In the power sector, Spain’s Renewable Energies Plan (2011) set a target of 38.1% of renewables in fi nal electricity generation. Currently, that share is 31% even though renewables represent half of installed capacity. Spain believes signifi cant progress can be achieved by optimizing the use of pumped storage hydroelectricity (power from intermittent sources should be more effi ciently used to pump water so it can be stored and used later for electricity production in hydroelectric power stations). By 2020, the installed capacity for wind power and solar power should be 35 GW (vs. 22.7 GW in 2013) and 12 GW22 (vs. seven GW in 2013) respectively. However, renewable energy producers face signifi cant uncertainty (especially in the power sector) due to new legislation (see ‘Power prices’ section) and new investments are slowing down. For instance, Spain installed 1,110 MW of new wind capacity in 2012 and just 175 MW in 2013.23
For transport, the target is 11.3%24 of renewables share by 2020 (mainly achieved through the use of biofuels: 9.2%). According to our own calculations,25 biofuels accounted for 6.3% of transportation fuels in 2012.26 In 2014, there was a sharp drop in biofuel consumption due to a government decision to reduce incorporation targets for biodiesel and ethanol to 4.1% and 3.9% respectively.
CO2 emissions and targetsTargets for GHG emissions reduction are split between the ETS (emission trading scheme) sector (essentially power generation and heavy industry) and the non-ETS sector (buildings, transports, agriculture, etc.).
• Non-ETS sector: in 2005 (base year for the calculation of emission reductions), GHG emissions in Spain amounted to 240 Mt CO2eq. The target for 2020 is 216 Mt CO2eq, which represents a 10% reduction. In 2012, emissions amounted to 207 Mt CO2eq and were already below the target (they decreased further to 196 Mt CO2eq in 2013).
• ETS sector: in 2005, emissions amounted to 193 Mt CO2eq. The target for 2020 is a 21% reduction, which is equivalent to 152 Mt CO2eq. In 2012, emissions amounted to 134 Mt CO2eq, already below the target, as in the non-ETS sector.
To a great extent, this quicker than expected progress can be attributed to the economic crisis. And, according to EEA, if economic growth is in line with expectations, the existing and upcoming policies are probably not ambitious enough to avoid an increase in emissions that would prevent Spain from reaching its 2020 target.27
21 El País (2014) The shocking price of Spanish electricity (01/01/2014) http://elpais.com/elpais/2014/01/01/inenglish/1388590410_230748.html
22 In the NREAP sent to the European Commission in 2010, the target for solar power was 13 GW; this target was updated to 12 GW one year later in the IDEA (Plan de Energias Renovables 2011-2020)
23 Global Wind Energy Council (2013) Global Wind Report 2013 – Annual Market Update
24 IDAE (2011) Plan Energias Renovables
25 In 2012, Spain reported this share to be 0.4% in its “Report on progress in the promotion and use of energy from renewable sources pursuant to article 22 of Directive 2009/28/EC”. This fi gure is erroneous since the biofuels incorporation mandate was 7% in diesel fuel and 4.1% in petrol at the time
26 EurObserv’ER reports 201 455 toe of ethanol consumption and 1 899 294 toe for biodiesel in 2012. Final energy consumption in the transports sector in Spain was 33 348 000 toe (Eurostat) in 2012
27 European Environment Agency (2013) Trends and projections in Europe 2013 – Tracking progress towards Europe’s climate and energy targets until 2020
190195200205210215220225230235240245
2020201220102005
Figure 14. GHG emissions and targets in the non-ETS sector (Mt CO2 eq.)27
GHG Emissions Target
100110120130140150160170180
190200
2020201220102005
Figure 15. GHG emissions and targets in the ETS sector (Mt CO2eq.)19
GHG Emissions Target
10130

To start a new section, hold down the apple+shift keys and click
to release this object and type the section title in the box below.
Road ahead and main challenges: the way to 2030 and beyond
Strongly hit by the economic crisis, Spain has not defi ned policies in the energy sector beyond 2020.Current policies focus on mitigating the economic crisis and the lack of long-term planning in the energy sector is evident.
Spain’s energy dependence is very high and current measures do not aim to reduce it.
Today in Spain, decisions in general (including policies in the energy sector) are driven by the country’s economic crisis. GDP dropped by 16% between 2008 and 201328 and the unemployment rate is around 25%.29 All of the indicators in the energy sector have been strongly affected by the macroeconomic situation and this blurs visibility for the coming years. Energy dependence has been steadily dropping (but is still above the European average), fi nal energy consumption in 2012 was only 3.7% higher than the 2020 target, and both the ETS and non-ETS sectors’ GHG emissions are already below 2020 targets. It is hard to quantify how much of Spain’s progress towards its 2020 objectives is attributable to policies designed specifi cally for these targets, given that the economic recession probably had a stronger impact than the policies.
Moreover, Spain has not formally adopted any energy policies for the period after 2020. This refl ects a need for better long-term planning. Modelling activities, with the aim of investigating the economic, social and environmental impacts of energy policies, are essential for the country’s long-term planning. Establishing roadmaps is also an important step to reduce investment uncertainty.
One of the main concerns in the power sector is overcapacity and, accordingly, the very low load factors for gas-fi red power plants, which produce an average of 800 hours per year (which means that they lose money).
Energy dependence One of the main characteristics of the Spanish energy sector is its dependence on fossil fuel imports (oil, coal and gas). Spain’s energy dependence30 (the extent to which it relies on imports to meet its energy needs) peaked in 2006 (82%) and has been steadily decreasing since 2008. By 2012, it was estimated to be around 73%. By means of comparison, the average European energy dependence is 50%.
Even if this indicator’s decline has been mainly due to a slowdown in industrial activity as a result of the economic situation, supplementary efforts are necessary to achieve energy independence, especially in the transportation sector. However, biofuel incorporation targets were signifi cantly reduced in 2014. The main objective of these new targets is to reduce the price of fuel in order to reactivate the Spanish economy. This clearly illustrates the trend of decision-making driven by the economic crisis instead of the European objectives for the energy sector. Besides the development of new biofuel technologies, the market uptake for electric cars is another potential way to diversify the energy carriers used in Spain’s fl eet and to channel its current excess power capacity. Electric cars would be able to take advantage of the already-installed renewables capacity for power generation – especially by charging batteries during off-peak periods.
Furthermore, coal imports have increased as a result of the US shale gas boom. Coal consumption (hard coal and lignite) rose by 28% in Spain in 2012.31 US coal has been exported mainly to Europe at cheap prices, leading to coal power plants being more competitive than gas-fi red ones. As a result, carbon market prices do not send the correct price signals. Beyond drawing attention to the Spanish dependence on foreign energy sources, this fact negatively affects the country’s efforts to reduce GHG emissions.
28 World Bank
29 Trading economics – http://www.tradingeconomics.com/spain/unemployment-rate
30 Following Eurostat’s methodology
31 Source: http://ec.europa.eu. © European Union, 1995-2015
11 131Energy market reform in Europe
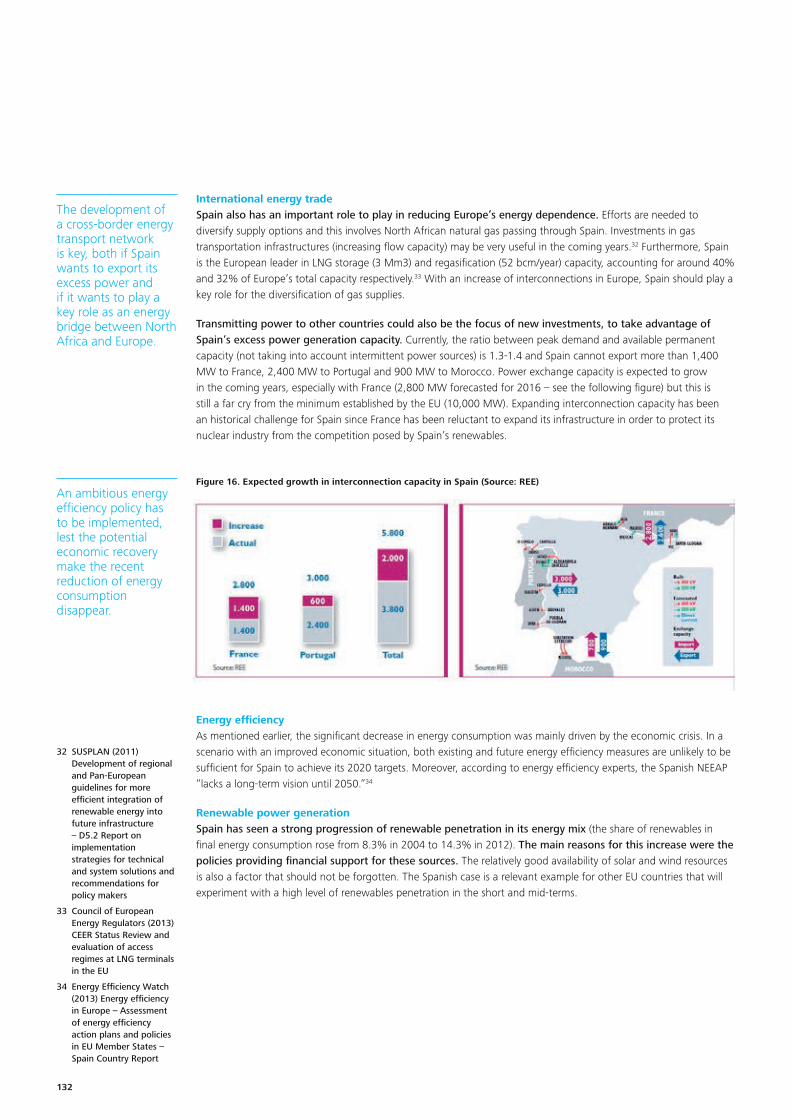
To start a new section, hold down the apple+shift keys and click
to release this object and type the section title in the box below.
To start a new section, hold down the apple+shift keys and click
to release this object and type the section title in the box below.
An ambitious energy effi ciency policy has to be implemented, lest the potential economic recovery make the recent reduction of energy consumption disappear.
Figure 16. Expected growth in interconnection capacity in Spain (Source: REE)
International energy tradeSpain also has an important role to play in reducing Europe’s energy dependence. Efforts are needed to diversify supply options and this involves North African natural gas passing through Spain. Investments in gas transportation infrastructures (increasing fl ow capacity) may be very useful in the coming years.32 Furthermore, Spain is the European leader in LNG storage (3 Mm3) and regasifi cation (52 bcm/year) capacity, accounting for around 40% and 32% of Europe’s total capacity respectively.33 With an increase of interconnections in Europe, Spain should play a key role for the diversifi cation of gas supplies.
Transmitting power to other countries could also be the focus of new investments, to take advantage of Spain’s excess power generation capacity. Currently, the ratio between peak demand and available permanent capacity (not taking into account intermittent power sources) is 1.3-1.4 and Spain cannot export more than 1,400 MW to France, 2,400 MW to Portugal and 900 MW to Morocco. Power exchange capacity is expected to grow in the coming years, especially with France (2,800 MW forecasted for 2016 – see the following fi gure) but this is still a far cry from the minimum established by the EU (10,000 MW). Expanding interconnection capacity has been an historical challenge for Spain since France has been reluctant to expand its infrastructure in order to protect its nuclear industry from the competition posed by Spain’s renewables.
Energy effi ciencyAs mentioned earlier, the signifi cant decrease in energy consumption was mainly driven by the economic crisis. In a scenario with an improved economic situation, both existing and future energy effi ciency measures are unlikely to be suffi cient for Spain to achieve its 2020 targets. Moreover, according to energy effi ciency experts, the Spanish NEEAP “lacks a long-term vision until 2050.”34
Renewable power generationSpain has seen a strong progression of renewable penetration in its energy mix (the share of renewables in fi nal energy consumption rose from 8.3% in 2004 to 14.3% in 2012). The main reasons for this increase were the policies providing fi nancial support for these sources. The relatively good availability of solar and wind resources is also a factor that should not be forgotten. The Spanish case is a relevant example for other EU countries that will experiment with a high level of renewables penetration in the short and mid-terms.
32 SUSPLAN (2011) Development of regional and Pan-European guidelines for more effi cient integration of renewable energy into future infrastructure – D5.2 Report on implementation strategies for technical and system solutions and recommendations for policy makers
33 Council of European Energy Regulators (2013) CEER Status Review and evaluation of access regimes at LNG terminals in the EU
34 Energy Effi ciency Watch (2013) Energy effi ciency in Europe – Assessment of energy effi ciency action plans and policies in EU Member States – Spain Country Report
The development of a cross-border energy transport network is key, both if Spain wants to export its excess power and if it wants to play a key role as an energy bridge between North Africa and Europe.
12132
To start a new section, hold down the apple+shift keys and click
to release this object and type the section title in the box below.
With an excess of power production capacity and budgetary capacity hindered by the economic crisis, Spain has to fi nd new ways to promote renewable energy.
As already noted, the combination of declining energy demand and the fast increase of renewables in the energy mix, along with a badly designed feed-in tariff, has resulted in a € 30 billion tariff defi cit for Spain. In 2008, this tariff defi cit had already reached € 15 billion. In the last few years, in an attempt to deal with this defi cit, the government introduced a series of regulatory changes, including retroactive actions (i.e. introduction of a 7% tax on all electricity sales – conventional and renewable; abolishment of the so-called “premium option,” which allowed renewable power producers to sell their electricity directly into the market at premium prices; abolishment of feed-in tariffs that grant above-market rates for power from clean sources; cap for incentives). These changes have created uncertainty for existing and future projects, and investments have come to a complete standstill (-96% in the fi rst quarter of 2013 compared to the fi rst quarter of 2012).25 These developments have even caused reputational damage for the renewable energy industry worldwide35 and have been the subject of legal actions against the Spanish government from investment funds.36 Moreover, the debt has been refl ected in the electricity bills of consumers (around 8%, as mentioned in the ‘Renewable energy target’ section).
Today, uncertainty remains high but there are still options for the development of renewable energies. Producers should stop relying on unpredictable government decrees in the development of their business models. For instance, they can develop projects with off-take agreements signed with consumers willing to consume renewable power for sustainability reasons.
Similarly, if the power generation sector shows excess capacity, there is a potential for development of renewables in the transport sector since the share of biofuels is not very high and the dependency on fossil fuel imports is signifi cant.
Future policy support for renewable energies should be carefully designed to prevent over-compensation and uncontrolled deployment.
ConclusionSpain’s pathway towards its 2020 targets has been masked by the country’s economic situation and there is considerable uncertainty about the country’s ability to reach these goals. There is little to no planning for the period beyond 2020. Spain would benefi t from policies in the energy sector focusing on long-term sustainability rather than on short-term actions to mitigate the effects of the economic crisis.
Many questions remain unsolved. Major concerns still need to be addressed regarding the future of Spanish nuclear power plants, dependency on coal and electricity generation overcapacity, especially with regard to the low load factors of gas-fi red power plants. This makes energy planning for the coming years key.
35 Bechberger M (2013) Pain in Spain: New retroactive changes hinder renewable energy. Renewable Energy World. http://www.renewableenergyworld.com/rea/news/article/2013/04/pain-in-spain-new-retroactive-changes-hinders-renewable-energy
36 Coats C (2014) Spain deals another blow to renewable power. Forbes. http://www.forbes.com/sites/christophercoats/2014/06/12/spain-deals-another-blow-to-renewable-power/
13 133Energy market reform in Europe
Selected bibliographic references
David Robinson (2013) Living with Intermittent Renewable Power: Challenges for Spain and the EU. The Oxford Institute for Energy Studies
David Robinson (2013) Pulling the plug on renewable power in Spain. The Oxford Institute for Energy Studies
Energy Effi ciency Watch (2013) Energy effi ciency in Europe – Assessment of energy effi ciency action plans and policies in EU Member States – Spain Country Report
European Commission – Energy challenges and policy: Commission contribution to the European Council of 22 May 2013, Source: http://ec.europa.eu. © European Union, 1995-2015
European Commission DG Energy – Quarterly Report on European Electricity Markets. Volume 6, Issue 2, Second Quarter 2013, Source: http://ec.europa.eu. © European Union, 1995-2015
European Environment Agency (2014) Trends and projections in Europe 2013 – Tracking progress towards Europe’s climate and energy targets until 2020
Eurostat. © European Union, 1995-2015
Global Wind Energy Council (2013) Global Wind Report 2013 – Annual Market Update
Instituto para la Diversifi cation y Ahorro de la Energía - IDAE (2011) Plan Energias Renovables
Linden, A. J., Kalantzakis, F., Maincent, E. & Pienkowski, J., European Economy. Electricity tariff defi cit: temporary or permanent problem in the EU? Economic Paper 534. © European Union, 2014
Ministério de Industria, Energía y Turismo (2013) Informe sobre el objetivo nacional de efi ciencia energética 2020 – España (Directiva 2012/27/UE, relative a la Efi ciencia Energética)
Red Eléctrica de España – El sistema eléctrico español – Avance del informe 2013
14134

European energy market reformCountry profi le: UK
135Energy market reform in Europe

Contents
Current situation 137
Energy consumption and trade balance 137
Power generation 138
Power market: main actors 139
Power prices 141
Targets for 2020 142
Energy efficiency targets 142
Renewable energy targets 144
CO2 emissions and targets 145
Road ahead and main challenges: the way to 2030 and beyond 147
Energy transition: pressure on electricity capacity 147
Fossil fuels 148
Renewable energy 149
GHG emissions 149
Conclusion 149
Selected bibliographic references 150
136

To start a new section, hold down the apple+shift keys and click
to release this object and type the section title in the box below.
Current situation
Energy consumption and trade balanceIn 2012, the UK’s gross inland energy consumption1 amounted to 202 Mtoe. The UK relies heavily on fossil fuels. Crude oil and gas represent 67% of its primary energy mix (35% and 32% respectively), with 86% coming from fossil fuel sources. Primary energy consumption has decreased by 4% since 1990, and more rapidly since then (-7% in 2011).
Crude oil and gas represent almost 70% of the country’s primary energy mix. The national production of these energies is dropping, making the country increasingly dependent on imports.
1 The gross inland energy consumption is equal to the primary energy consumption plus the consumption of fossil fuels for non-energy purposes
2 Source: Eurostat.© European Union, 1995-2015: http://epp eurostat.ec.europa.eu/tgm/table.do?tab=table&init=1&plugin=1&language=en&pcode=tsdcc320
3 Source: Eurostat.© European Union, 1995-2015 http://epp.eurostat.ec.europa.eu/portal/page/portalproduct_details/dataset?p_product_code=TSDCC320
4 DUKES (2014), annex G, page 1
5 EC (2012), EU Country factsheet page 282 Source: http://ec.europa.eu. © European Union, 1995-2015
Between 1990 and 2012, fi nal energy consumption decreased by 2% (i.e. 2.9 Mtoe) to reach 134 Mtoe. This fall mainly comes from the industrial sector (-8.6 Mtoe between 1990 and 2012, which represented a decrease of 25%).
The UK depends increasingly on fossil fuel imports and, in 2012, the energy trade defi cit stood at 85 Mtoe, representing approximately £21 million.4 A net exporter in the 2000s, the UK is now a net importer as its gas and oil production have signifi cantly declined.5
Key fi gures: Population (2013): 63.9 m cap.
GDP (2013): 1,613 bn €
GDP/capita (2013): 25,241 €
GDP/PEC (2012): 7.7 €/kgoe
PEC/capita (2012): 2.75 toe/cap.
Figure 1. Gross inland consumption in 2012 (202 Mtoe)2
9%
32%
0% 1%
19%
4%
35%
Solid fuel Petroleum products
Gas Nuclear heat
Renewable energies Waste
Electricity
Figure 2. Final energy consumption by sector (in Mtoe)3
Residential Transport
Industry Service and other
Agriculture
0
20
40
60
80
100
120
140
160
180
201220001990
37
46
35
17
137 Mtoe
40
50
26
17
134 Mtoe
43
53
37
19
153 Mtoe
1
1
1
Figure 3. Energy trade balance (Mtoe)1
1990 2000 2012
-40
-30
-20
-10
0
10
20
30
40
50
Electrical energyGasTotal petroleum productsSolid fuels
-9 -14-27
11
46
-26
-6 -1 -1 -1
9
-31
1 137Energy market reform in Europe

To start a new section, hold down the apple+shift keys and click
to release this object and type the section title in the box below.
To start a new section, hold down the apple+shift keys and click
to release this object and type the section title in the box below.
Having reached a record level of crude oil production in 1999 (127 Mt), production has been declining ever since, reaching 38 Mt in 2012. Similarly, the production of natural gas reached its highest level in 2000 (115 bcm, or billion cubic metres) and decreased to 41 bcm in 2012. Coal imports peaked in 2006 then fell and grew again recently due to rising gas prices. These trends highlight the country’s growing reliance on non-domestic fossil fuels.
Power generation In 2013, the UK’s total power capacity was 85 GW, 4.9% less than in 2012, mainly due to the closure of coal-fi red plants. This decline was partially offset by the opening of new renewable power plants.
In 2012, gas-fi red generation was responsible for 27% of total electricity production and coal’s share was 39%.6 In total, fossil fuels accounted for 68% of electricity production in 2012 and represented 74% of total generation capacity. Nuclear generation capacity was 9,946 MW, or 10% of the electricity mix in 2012, and produced 19% of the country’s electricity. Its share is down from 23% in 2000 and is expected to decrease further by 2020 as the operating lifetime of current power plants comes to an end.
Renewables represented 16% of installed capacity and provided 12% of power generation, while 45% came from wind, 34% from biomass and 18% from hydro.
6 Source: http://ec.europa.eu. © European Union, 1995-2015, EU Country factsheet page 286
7 Source: EU Energy in fi gures. Statistical pocketbook 2014. © European Union, 2014
Figure 4. Electricity capacity – 90 GW (2012)7
3
4
11
110
35
27
1
RES: 16
Coal Oil Gas
Nuclear Other (thermal) Hydro
Wind and Solar Other renewables
Figure 5. Gross electricity generation – 364 GWh (2012)
2
8
21
15
71
100
143
3
RES: 44
Coal Oil Gas
Nuclear Other (thermal) Hydro
Wind and Solar Other renewables
Source: http://ec.europa.eu © European Union, 2014
The country’s electricity capacity decreased signifi cantly over the last three years: -13 GW between 2011 and 2014.
2138

To start a new section, hold down the apple+shift keys and click
to release this object and type the section title in the box below.
This fall is due to power plant closures (mainly oil, coal and combination), reduced capacity and the conversion of several large plants to biomass. The EU Large Combustion Plant Directive (LCP Directive) will lead to additional closures of coal and oil-fi red plants before 2016, as they are considered too polluting.
That said, the lost capacity was partially offset by an increase in renewables production.
In 2013, the capacity of renewable sources increased by 4.8 GW.
This capacity, however, is expected to decrease over the next few years through 2020/21 due to plant closures driven by the LCP Directive, limiting the availability of new installed capacity. Specifi cally, roughly 5 GW of conventional power will be permanently lost in the next two years, with an additional one GW decline in the same period as gas plants are mothballed. At the same time, a 7.6 GW decline in nuclear power generation is expected as plants are decommissioned through 2019. In fact, by 2023, all of the country’s nuclear power reactors (except 1200 MW) are expected to reach the end their lifetime. This lost capacity will be partially offset by a new 3.2 GW nuclear plant in Hinkley Point which, when built, will meet approximately 7% of the country’s electricity needs.
Power market: main actorsThe power market in the UK is highly competitive and dispersed.
At the end of 2013, there were 37 major power producers (MPPs). Yet, in 2010, more than 60% of the country’s power was generated by six companies (Scottish Power, SSE, E.ON UK, Centrica, RWE and EDF Energy).
Geographically, the power marketed in the UK is split into two areas: one covering Great Britain and the other Northern Ireland. In Great Britain, the establishment of the British Electricity Trading and Transmission Arrangements (BETTA) in 2005 began to drive the integration of the electricity systems in England, Wales and Scotland. BETTA provides common rules to allow free trade across Great Britain, oversees the transmission network and provides a GB-wide system operator (SO). Northern Ireland forms an all-island electricity market with the Republic of Ireland.
As of May 1999, the domestic power market in the UK was open to competition, and price controls were removed in 2002.
The distribution network is owned and maintained by regional companies, while the high voltage transmission system as a whole is operated by a single operator company, National Grid Electricity Transmission plc (NGET). NGET owns and operates the transmission system in England and Wales, and operates but does not own the Scottish network.
8 DUKES 2014.
A competitive and dispersed market. Thirty-seven major power producers operate in the UK. Despite this number, six big companies dominate the generation and the retail markets. Their competitive position is under scrutiny by the Competition and Markets Authority.
Figure 6. Electricity capacity change from 2010 to 2013 (in GW)8
-12
-10
-8
-6
-4
-2
0
2
4
6
Wind and otherrenewables
HydroGasFuel oilCoalNuclear energy
-1.00
-10.00
-0.101.00
4.80
0.03
Although UK power generation relies on a high share of fossil fuels, there has been a growing shift towards renewables in recent years.
3 139Energy market reform in Europe
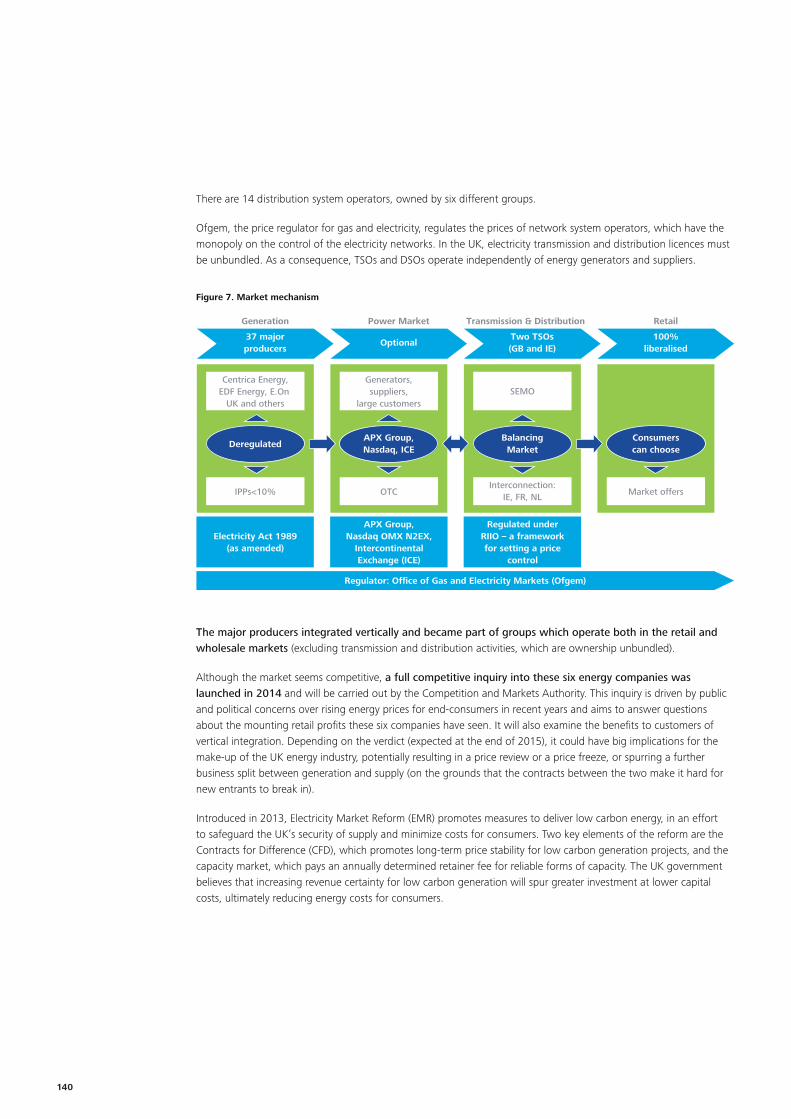
To start a new section, hold down the apple+shift keys and click
to release this object and type the section title in the box below.
To start a new section, hold down the apple+shift keys and click
to release this object and type the section title in the box below.
The major producers integrated vertically and became part of groups which operate both in the retail and wholesale markets (excluding transmission and distribution activities, which are ownership unbundled).
Although the market seems competitive, a full competitive inquiry into these six energy companies was launched in 2014 and will be carried out by the Competition and Markets Authority. This inquiry is driven by public and political concerns over rising energy prices for end-consumers in recent years and aims to answer questions about the mounting retail profi ts these six companies have seen. It will also examine the benefi ts to customers of vertical integration. Depending on the verdict (expected at the end of 2015), it could have big implications for the make-up of the UK energy industry, potentially resulting in a price review or a price freeze, or spurring a further business split between generation and supply (on the grounds that the contracts between the two make it hard for new entrants to break in).
Introduced in 2013, Electricity Market Reform (EMR) promotes measures to deliver low carbon energy, in an effort to safeguard the UK’s security of supply and minimize costs for consumers. Two key elements of the reform are the Contracts for Difference (CFD), which promotes long-term price stability for low carbon generation projects, and the capacity market, which pays an annually determined retainer fee for reliable forms of capacity. The UK government believes that increasing revenue certainty for low carbon generation will spur greater investment at lower capital costs, ultimately reducing energy costs for consumers.
37 majorproducers
OptionalTwo TSOs(GB and IE)
100%liberalised
Generation
Centrica Energy,EDF Energy, E.On
UK and others
Electricity Act 1989(as amended)
APX Group,Nasdaq OMX N2EX,
IntercontinentalExchange (ICE)
Regulator: Office of Gas and Electricity Markets (Ofgem)
Regulated underRIIO – a frameworkfor setting a price
control
IPPs<10%
Generators,suppliers,
large customers
Power Market Transmission & Distribution Retail
Figure 7. Market mechanism
DeregulatedAPX Group,Nasdaq, ICE
OTC
SEMO
BalancingMarket
Interconnection:IE, FR, NL
Consumerscan choose
Market offers
There are 14 distribution system operators, owned by six different groups.
Ofgem, the price regulator for gas and electricity, regulates the prices of network system operators, which have the monopoly on the control of the electricity networks. In the UK, electricity transmission and distribution licences must be unbundled. As a consequence, TSOs and DSOs operate independently of energy generators and suppliers.
4140
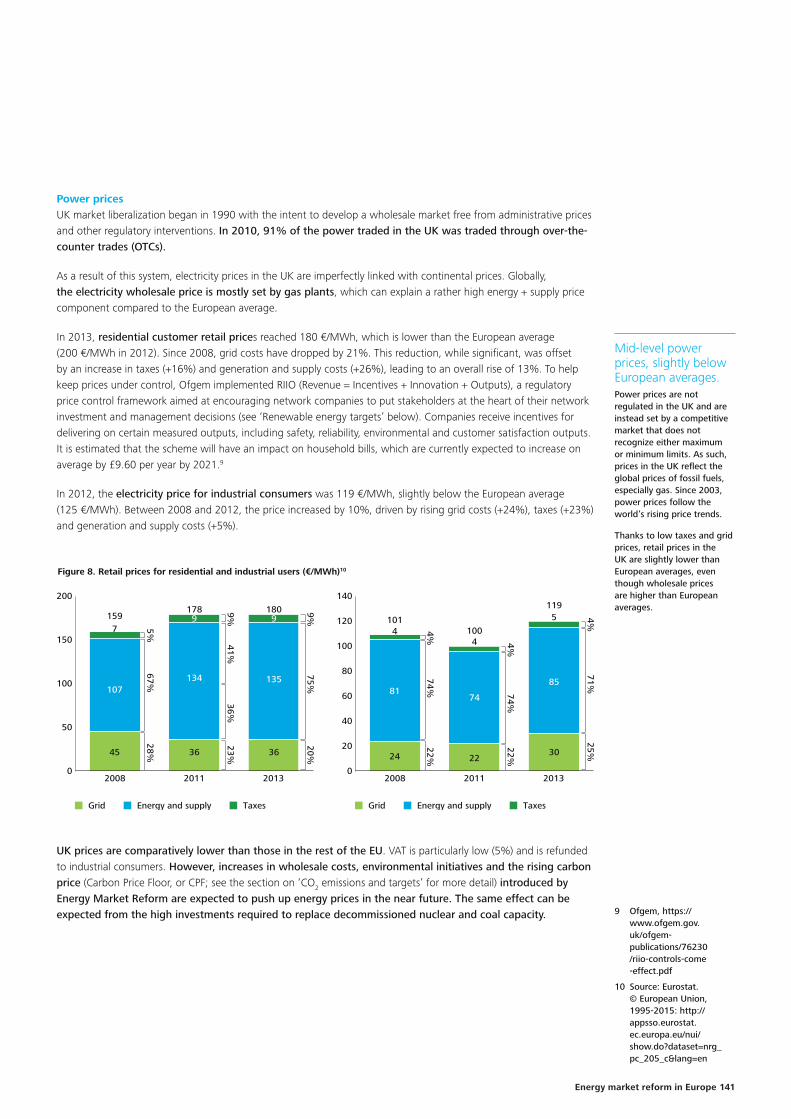
To start a new section, hold down the apple+shift keys and click
to release this object and type the section title in the box below.
Power pricesUK market liberalization began in 1990 with the intent to develop a wholesale market free from administrative prices and other regulatory interventions. In 2010, 91% of the power traded in the UK was traded through over-the-counter trades (OTCs).
As a result of this system, electricity prices in the UK are imperfectly linked with continental prices. Globally, the electricity wholesale price is mostly set by gas plants, which can explain a rather high energy + supply price component compared to the European average.
In 2013, residential customer retail prices reached 180 €/MWh, which is lower than the European average (200 €/MWh in 2012). Since 2008, grid costs have dropped by 21%. This reduction, while signifi cant, was offset by an increase in taxes (+16%) and generation and supply costs (+26%), leading to an overall rise of 13%. To help keep prices under control, Ofgem implemented RIIO (Revenue = Incentives + Innovation + Outputs), a regulatory price control framework aimed at encouraging network companies to put stakeholders at the heart of their network investment and management decisions (see ‘Renewable energy targets’ below). Companies receive incentives for delivering on certain measured outputs, including safety, reliability, environmental and customer satisfaction outputs. It is estimated that the scheme will have an impact on household bills, which are currently expected to increase on average by £9.60 per year by 2021.9
In 2012, the electricity price for industrial consumers was 119 €/MWh, slightly below the European average (125 €/MWh). Between 2008 and 2012, the price increased by 10%, driven by rising grid costs (+24%), taxes (+23%) and generation and supply costs (+5%).
Mid-level power prices, slightly below European averages.Power prices are not regulated in the UK and are instead set by a competitive market that does not recognize either maximum or minimum limits. As such, prices in the UK refl ect the global prices of fossil fuels, especially gas. Since 2003, power prices follow the world’s rising price trends.
Thanks to low taxes and grid prices, retail prices in the UK are slightly lower than European averages, even though wholesale prices are higher than European averages.
9 Ofgem, https://www.ofgem.gov.uk/ofgem-publications/76230/riio-controls-come-effect.pdf
10 Source: Eurostat.© European Union, 1995-2015: http://appsso.eurostat.ec.europa.eu/nui/show.do?dataset=nrg_pc_205_c&lang=en
UK prices are comparatively lower than those in the rest of the EU. VAT is particularly low (5%) and is refunded to industrial consumers. However, increases in wholesale costs, environmental initiatives and the rising carbon price (Carbon Price Floor, or CPF; see the section on ‘CO2 emissions and targets’ for more detail) introduced by Energy Market Reform are expected to push up energy prices in the near future. The same effect can be expected from the high investments required to replace decommissioned nuclear and coal capacity.
Figure 8. Retail prices for residential and industrial users (€/MWh)10
Grid Energy and supply Taxes
0
50
100
150
200
201320112008
45
107
7159
36
134
9178
36
135
9180
5%28%
67%
9%23%
41%36%
9%20%
75%
Grid Energy and supply Taxes
0
20
40
60
80
100
120
140
201320112008
24
81
4101
22
74
4100
30
85
5119
4%22%
74%
4%22%
74%
4%25%
71%
5 141Energy market reform in Europe
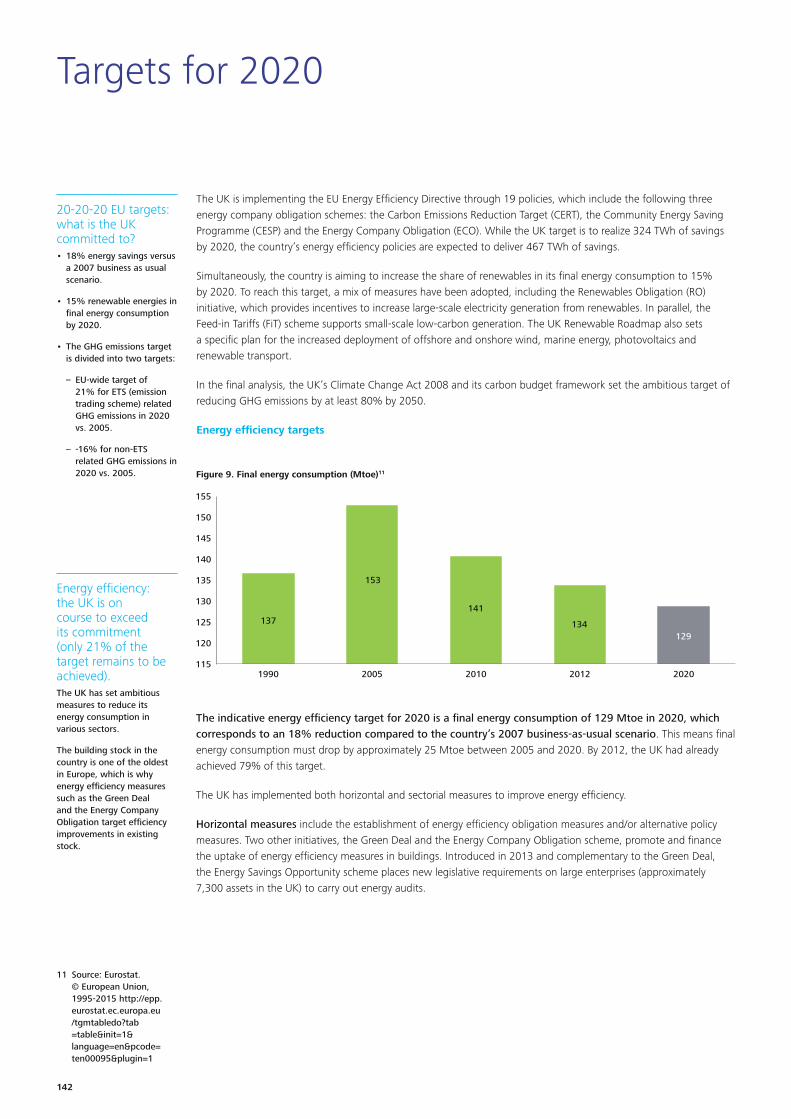
To start a new section, hold down the apple+shift keys and click
to release this object and type the section title in the box below.
To start a new section, hold down the apple+shift keys and click
to release this object and type the section title in the box below.
Targets for 2020
The UK is implementing the EU Energy Effi ciency Directive through 19 policies, which include the following three energy company obligation schemes: the Carbon Emissions Reduction Target (CERT), the Community Energy Saving Programme (CESP) and the Energy Company Obligation (ECO). While the UK target is to realize 324 TWh of savings by 2020, the country’s energy effi ciency policies are expected to deliver 467 TWh of savings.
Simultaneously, the country is aiming to increase the share of renewables in its fi nal energy consumption to 15% by 2020. To reach this target, a mix of measures have been adopted, including the Renewables Obligation (RO) initiative, which provides incentives to increase large-scale electricity generation from renewables. In parallel, the Feed-in Tariffs (FiT) scheme supports small-scale low-carbon generation. The UK Renewable Roadmap also sets a specifi c plan for the increased deployment of offshore and onshore wind, marine energy, photovoltaics and renewable transport.
In the fi nal analysis, the UK’s Climate Change Act 2008 and its carbon budget framework set the ambitious target of reducing GHG emissions by at least 80% by 2050.
Energy effi ciency targets
20-20-20 EU targets: what is the UK committed to?• 18% energy savings versus
a 2007 business as usual scenario.
• 15% renewable energies in fi nal energy consumption by 2020.
• The GHG emissions target is divided into two targets:
– EU-wide target of 21% for ETS (emission trading scheme) related GHG emissions in 2020 vs. 2005.
– -16% for non-ETS related GHG emissions in 2020 vs. 2005.
Energy effi ciency: the UK is on course to exceed its commitment (only 21% of the target remains to be achieved).The UK has set ambitious measures to reduce its energy consumption in various sectors.
The building stock in the country is one of the oldest in Europe, which is why energy effi ciency measures such as the Green Deal and the Energy Company Obligation target effi ciency improvements in existing stock.
11 Source: Eurostat.© European Union,1995-2015 http://epp.eurostat.ec.europa.eu/tgmtabledo?tab=table&init=1&language=en&pcode=ten00095&plugin=1
The indicative energy effi ciency target for 2020 is a fi nal energy consumption of 129 Mtoe in 2020, which corresponds to an 18% reduction compared to the country’s 2007 business-as-usual scenario. This means fi nal energy consumption must drop by approximately 25 Mtoe between 2005 and 2020. By 2012, the UK had already achieved 79% of this target.
The UK has implemented both horizontal and sectorial measures to improve energy effi ciency.
Horizontal measures include the establishment of energy effi ciency obligation measures and/or alternative policy measures. Two other initiatives, the Green Deal and the Energy Company Obligation scheme, promote and fi nance the uptake of energy effi ciency measures in buildings. Introduced in 2013 and complementary to the Green Deal, the Energy Savings Opportunity scheme places new legislative requirements on large enterprises (approximately 7,300 assets in the UK) to carry out energy audits.
Figure 9. Final energy consumption (Mtoe)11
115
120
125
130
135
140
145
150
155
20202012201020051990
137
153
141
134129
6142

To start a new section, hold down the apple+shift keys and click
to release this object and type the section title in the box below.
Sectorial measures target energy effi ciency in the transportation, building, heating and cooling, and industrial sectors.
The transportation sector is the country’s primary energy consumer (36% of fi nal energy consumption in 2013), and consequently has a particularly important role in the country’s efforts to improve energy effi ciency. Between 2002 and 2012, the energy effi ciency of cars improved by 27%. Since 2009, regulations have required reduced fuel consumption in cars. The cars sold in 2013 should have achieved savings equivalent to 15 pence per litre. By 2020, this will rise to 42 pence per litre. The UK government also fi nancially supports the uptake of Ultra-Low Emissions Vehicles (ULEVs) and promotes eco-driving by including fuel-effi cient techniques in driving tests and by supporting training in businesses. A Green Bus Fund has been established and is expected to achieve energy savings of approximately 404 TJ in public transport.
In 2012, energy consumption in buildings represented approximately 32% of the total fi nal energy consumption. Despite a number of previous measures taken to improve energy effi ciency, household energy consumption increased by 22% between 1970 and 2007. This could be partly due to the increase of dwellings stock (approximately 1% per year). Nevertheless, it has been estimated that, without the existing energy effi ciency measures, this increase would be more than double. The Building Renovation Strategy estimates that there is potential for further improvements, which could result in additional savings of 54 TWh between 2013 and 2020. Beginning 2016, the UK will be implementing a “zero carbon homes” policy. In addition, building regulations, which promote energy effi ciency in buildings, have been set. Specifi cally, the building regulations in England, Northern Ireland, Scotland and Wales respectively require average CO2 emission reductions by 6%, 25% and 20%, compared to 2010 levels. Another initiative, the Code for Sustainable Houses, sets common standards at the national level to promote the construction of energy-effi cient houses.
Heating accounts for approximately one-third of GHG emissions in the country. The potential of combined heating and power (CHP) in terms of energy and GHG savings has been estimated at 30%. The UK fi nancially supports the development of heat networks in local authorities. The growth of natural gas CHP capacity faces fi nancial barriers as the potential revenues and energy savings are not suffi cient to ensure fi nancial viability. The UK plans to implement policies to support these types of installations.
The industrial sector was responsible for 16% of fi nal energy consumption in 2013. This consumption is expected to drop by 12% in the next two decades, mainly thanks to developments in CHP, and improvements in process and material effi ciency.
In the UK, measures to improve energy effi ciency also target electricity and gas networks. Transmission and distribution companies are encouraged to improve the management of system losses through Ofgem’s RIIO regulatory price control framework, which, among other things, will promote the connection of small-scale renewables, as well as microgeneration. Specifi cally, the scheme promotes effi cient outputs by setting conditions within an eight-year timeframe. These conditions include measures to reduce network losses and limit the use of the network during peak demand times (i.e. through the tariff structure and localization of tariffs at different areas of the network). Specifi cally, on gas distribution, Ofgem requires a reduction of 15% to 20% in transport losses.
7 143Energy market reform in Europe
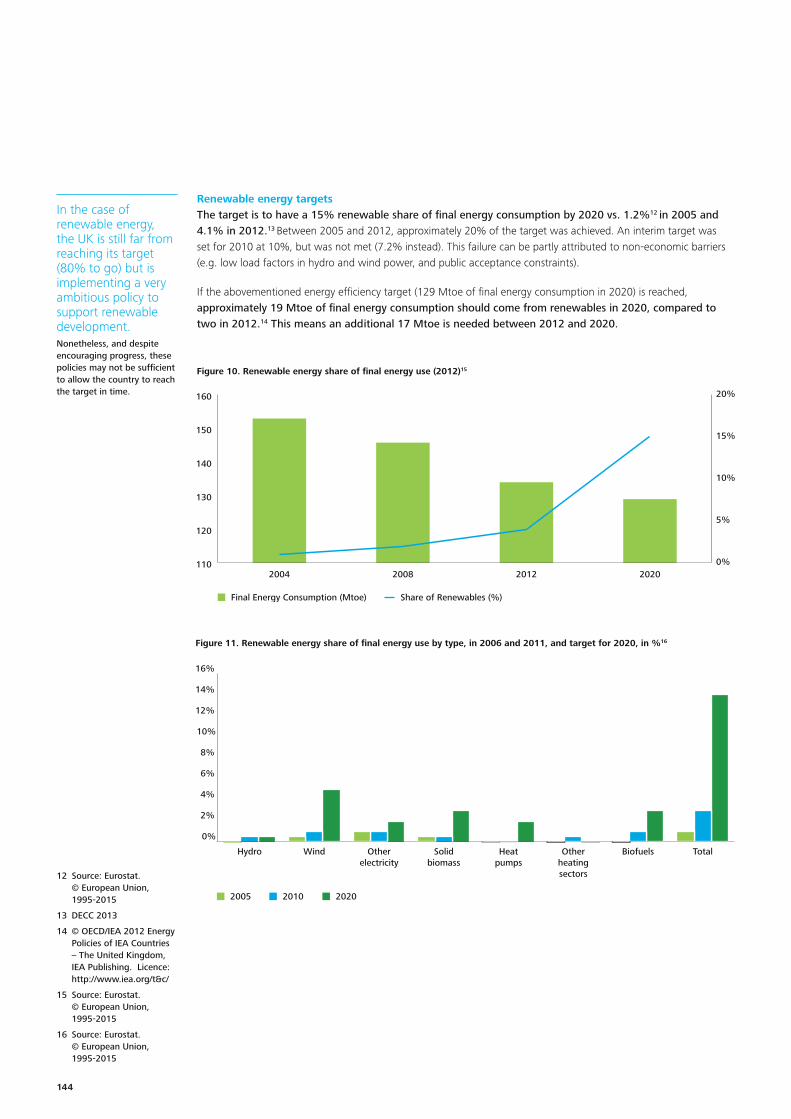
To start a new section, hold down the apple+shift keys and click
to release this object and type the section title in the box below.
To start a new section, hold down the apple+shift keys and click
to release this object and type the section title in the box below.
Renewable energy targetsThe target is to have a 15% renewable share of fi nal energy consumption by 2020 vs. 1.2%12 in 2005 and 4.1% in 2012.13 Between 2005 and 2012, approximately 20% of the target was achieved. An interim target was set for 2010 at 10%, but was not met (7.2% instead). This failure can be partly attributed to non-economic barriers (e.g. low load factors in hydro and wind power, and public acceptance constraints).
If the abovementioned energy effi ciency target (129 Mtoe of fi nal energy consumption in 2020) is reached, approximately 19 Mtoe of fi nal energy consumption should come from renewables in 2020, compared to two in 2012.14 This means an additional 17 Mtoe is needed between 2012 and 2020.
12 Source: Eurostat.© European Union, 1995-2015
13 DECC 2013
14 © OECD/IEA 2012 Energy Policies of IEA Countries – The United Kingdom, IEA Publishing. Licence: http://www.iea.org/t&c/
15 Source: Eurostat.© European Union, 1995-2015
16 Source: Eurostat.© European Union, 1995-2015
In the case of renewable energy, the UK is still far from reaching its target (80% to go) but is implementing a very ambitious policy to support renewable development.Nonetheless, and despite encouraging progress, these policies may not be suffi cient to allow the country to reach the target in time.
110
120
130
140
150
160
2020201220082004
Figure 10. Renewable energy share of final energy use (2012)15
Final Energy Consumption (Mtoe) Share of Renewables (%)
0%
5%
10%
15%
20%
Figure 11. Renewable energy share of final energy use by type, in 2006 and 2011, and target for 2020, in %16
0%
2%
4%
6%
8%
10%
12%
14%
16%
TotalBiofuelsOtherheatingsectors
Heatpumps
Solidbiomass
Otherelectricity
WindHydro
2005 2010 2020
8144

To start a new section, hold down the apple+shift keys and click
to release this object and type the section title in the box below.
17 Eligible sources include wind energy, wave and tidal energy, landfi ll gas, deep geothermal, hydro, photovoltaics, energy from waste, biomass, energy crops and anaerobic digestion
18 Ofgem 2014
19 European Environment Agency (2013) Trends and projections in Europe 2013 – Tracking progress towards Europe’s climate and energy targets until 2020
The renewable target requires an increase of power generation from renewables of around 220 TWh from 2013 to 2020. In 2013, power generation from renewables reached 54 TWh, which represented a 30% increase from the previous year. Between 2012 and 2013, the overall share of electricity produced from renewable sources increased from 11% to 15%, and renewable power capacity increased by 27%, reaching 19.5 GW. The capacity of onshore wind reached 7 GW, followed by biomass electricity (4.9 GW) and offshore wind (3.5 GW).
The Renewables Obligation (RO), which came into effect in 2002, requires suppliers to source an increasing proportion of their energy from eligible renewable resources.17 The system is administrated by Ofgem; it issues Renewables Obligation Certifi cates which are traded between suppliers and generators to enable suppliers to demonstrate that they have complied with their obligation. In 2017, the RO will close to new low carbon generation projects, and future support will be provided by the contracts for differences introduced through the Electricity Market Reform process. These contracts for differences (CfDs) will provide some revenue stability for low carbon generation and will target a strike price per MWh for generation at a level that will enable projects to be viable. This is intended to reduce the investment risks associated with new low-carbon infrastructure (including new nuclear) and will consequently reduce the cost of capital.
In 2013, 452 MW of renewable electricity capacity was added thanks to the support of feed-in tariffs. The total capacity promoted by feed-in tariffs reached 2.3 GW. The feed-in tariffs differ according to sector and type of installation.
Table 1. 2014 feed-in tariffs (in p€/kWh) and contract duration (years)18
Anaerobic digestion Wind Solar Hydro CHP
Feed-in tariffs (c€/kWh) 9.02-12.46 3.7-17.78 6.38-14.38 2.99 – 21.12 13.4
Contract duration (years) 20 20 20 20 10
0
100
200
300
400
500
600
700
800
2020201220102005
Figure 12. GHG emissions and targets in the ETS and non-ETS sectors and overall target in 2020 (Mt CO2eq)19
ETS Non-ETS Target
CO2 emissions and targets
In 2005, GHG emissions from the non-ETS sector amounted to 384 Mt CO2eq. The target is to reduce GHG emissions in this sector by 16% between 2005 and 2020 (i.e. by 64 Mt CO2eq). In 2012, non-ETS emissions were reduced by 335 Mt CO2eq compared to a target of 320 Mt CO2eq in 2020. As such, the UK is on track to achieve its non-ETS target.
9 145Energy market reform in Europe

To start a new section, hold down the apple+shift keys and click
to release this object and type the section title in the box below.
To start a new section, hold down the apple+shift keys and click
to release this object and type the section title in the box below.
In addition, the ETS sector in the UK is subject to an EU-wide reduction target of 21% from 2005 to 2020. In 2012, the emissions attributed to the ETS sector were reduced by 16% compared to 2005 levels.
Here too, the UK is well on its way towards achieving its 2020 GHG target.
The UK has considered that both low carbon prices and the fl uctuation of EU ETS allowances may not encourage enough investment in low-carbon technologies. To reach its carbon reduction and renewable targets, the UK government decided to set a carbon price fl oor (CPF) to provide an incentive to invest in low-carbon power generation.20 The CPF came into effect on April 1, 2013 and is calculated based on the price of CO2 from the ETS and the carbon price support (CPS) rate per ton of CO2 emitted, which is specifi c to the UK. This CPS rate applies to fossil fuels used in power generation (gas, solid fuels, LPG, fuel oils). To avoid hindering the competiveness of UK fi rms, it was decided in 2014 to cap the CPS at a maximum rate of £18/tCO2 from 2016 to 2020.21
CO2 targets: the UK has already met 81% of its 2020 target.The UK is considered to be one of the world leaders in climate change response, particularly due to the 2008 Climate Change Act which set ambitious targets. There are numerous policies which address climate change particularly as regards pricing policies. This may increase the regulatory burden of compliance.
Table 2. Rates of the carbon price support (in £/tCO2)20, 21
Confi rmed rates Indicative rates
2013-2014 2014-2015 2015-2016 2016-2017 2017-2018 2018-2019
CPS: carbon price equivalent (£/tCO2)
4.94 9.55 18.08 18.00 18.00 maximum
18.00 maximum
20 House of Commons’ Library (2014)
21 HM Revenue & Customs (2014)
As part of the 2008 Climate Change Act, the UK has set more ambitious targets. These targets are being implemented through carbon budgets which each cover a fi ve-year period. The fi rst carbon budget mandates a reduction of 22% (2008-2012), the second 34% (2013-2017) and the third 34% (2018-2022). Notably, the fi rst carbon budget was met in 2012 when emissions fell 1% below the legislated target. This achievement can be partially attributed to a signifi cant 22% reduction in the economy’s carbon intensity between 2000 and 2010 (which is higher than the IEA average, i.e. 17%), as well as to improvements in the implementation of energy effi ciency policies in the residential sector, increased power generation from wind, better fuel effi ciency in new cars and the economic downturn (5% reduction of GDP in 2009).
10146

To start a new section, hold down the apple+shift keys and click
to release this object and type the section title in the box below.
The power generation system is at a turning point.Old plants (a capacity of around 19 GW) will shut down in the next 10 years. They will be replaced by intermittent (wind) or less fl exible (nuclear) plants.
The UK is implementing measures, such as the development of a capacity mechanism, to reduce the risk these changes may raise.
22 This means that if wholesale prices rise above this agreed strike price, payments will be returned to consumers. If they fall below this price, the generator will receive a top-up payment
23 Alex Barker, “UK agrees deal with EU on new Hinkley Point nuclear power plant”, Financial Times, September 22, 2014
24 IEA (2012) © OECD/IEA 2012 Energy Policies of IEA Countries – The United Kingdom, IEA Publishing. Licence: http://www.iea.org/t&c/
Road ahead and main challenges: the way to 2030 and beyond
The UK has set ambitious targets to 2050, especially for GHG emissions. It has also implemented ambitious measures, mostly based on market mechanisms to develop renewable energy, decrease energy consumption and reduce GHG emissions, while renewing its power plants to counteract the sharp decline in its fossil fuel reserves.
Energy transition: pressure on electricity capacityWith roughly 20% of existing plants (corresponding to approximately 19 GW) slated to shut down over the next 10 years, the UK’s electricity supply and security is at risk. These closures are expected to lower the country’s capacity margins and lead to a risk of blackouts during peak demand periods. While these risks are not immediate, they are heightened by the fact that more sporadic (e.g. wind) and less fl exible (e.g. nuclear) options are being developed to replace the older polluting plants.
Despite the energy effi ciency measures adopted in the country, electricity demand is expected to increase and may double by 2050, partially due to the electrifi cation of heat and transport. This rising demand, combined with the UK’s ambitious targets on decarbonization, requires a mix of new cleaner technologies and an increase in the effi ciency of existing infrastructure assets.
The expansion of power generation capacity is a key component of Electricity Market Reform (EMR). The creation of a capacity market will provide an additional revenue stream for power generators to support the maintenance of a target level of capacity and mitigate the risk of loss if the load is kept at an acceptable level. In fact, the fi rst auction for reserve power capacity took place in December 2014, as part of EMR. The capacity market aims to secure the availability of approximately 50.8 GW of electricity generation capacity, which must remain available for generation during times of system stress throughout 2018/19. The implementation of the capacity market is expected to signifi cantly reduce the risk of costly blackouts.
The development of nuclear energy is a particularly important component of the UK’s strategy to meet its GHG targets and to safeguard the security of its energy supply, especially due to the advanced age of the country’s power plant stock. The UK plans to invest € 19 billion to build a nuclear plant that will generate around 7% of the country’s electricity needs. This plant (built by EDF) will be the UK’s fi rst new nuclear plant since 1995. EDF and the UK government agreed on a strike price22 for the electricity output of £92.50 per MWh and, in October 2014, the UK government agreed to terms with the European Commission for state aid approval of this project.23 The post-Fukushima concerns on nuclear safety did not affect the UK’s plans to construct new reactors. Instead, the UK has put forward improvements on nuclear safety and is simultaneously working to enhance waste management and decommission old plants. Nevertheless, the development of nuclear is subject to signifi cant social barriers (e.g. the selection of sites for the disposal of high-level waste), as well as economic challenges (e.g. the cost effectiveness of nuclear energy compared to low-carbon alternatives).
Overall, it is estimated that new investments in power generation and transmission will reach approximately £110 billion by 2020.24 This amount is two-times higher than the amount spent during the previous decade. EMR’s mechanisms are expected to provide the required fi nancial support, both directly (i.e. direct fi nancing through feed-in tariffs) and indirectly (e.g. by supporting investment certainty). Nevertheless, it is expected that EMR will continue to face opposition on both cost and competitive grounds.
11 147Energy market reform in Europe
To start a new section, hold down the apple+shift keys and click
to release this object and type the section title in the box below.
To start a new section, hold down the apple+shift keys and click
to release this object and type the section title in the box below.
Fossil fuels Oil and gas dominate the UK’s energy mix and will remain crucial, at least in the mid-term.
In 2010, the UK produced 117 Mtoe of oil and gas, and ranked 17th worldwide. Although the production of oil peaked during recent years due to rising oil prices, the production of oil and gas in the North Sea is expected to drop in the coming years as reserves fall. Despite this decline, oil and gas reserves are still expected to support the country’s energy security for several years.
The UK’s energy mix has one of the highest shares of natural gas in the EU (in 2010, it comprised 42% of primary energy supply). The importance of gas is expected to increase as gas-fi red electricity plants replace decommissioned coal-fi red capacity. That said, until 2003, the UK was a net exporter of gas; after a peak in 2000, however, production has been declining and the country became a net importer in 2004.
The production of unconventional gas can be expected to reduce pressure on the trade balance. Recently, under the “14th onshore licencing round”, the UK government commenced a new round of exploitation and development of shale gas, tight gas, coalbed methane (CBM) and mine vent gas. This came after a three-year suspension of hydraulic fracturing in the country due to seismic tremors. According to the British Geological Survey, a single shale formation in north England contains 37 trillion cubic meters. Nevertheless, securing licences is only the fi rst step of several regulatory measures required before production can begin. As such, the future share of unconventional gas remains uncertain.
The continued exploitation of remaining oil and gas reserves will require signifi cant investment. On one hand, the increased recovery from existing reserves offers the potential for higher revenues. On the other hand, the decommissioning of non-producing assets will impose signifi cant costs. At the same time, the growing importance of gas in the energy mix will require signifi cant investment to develop the required infrastructure (gas-fi red plants and storage). These challenges call for more effective initiatives to support the industry and attract the necessary investments.
Coal also has a signifi cant share of the UK’s primary supply (16% in 2012), with a particularly high share of electricity generation (approximately 40% in 2013). According to current projections, domestic hard coal extraction is expected to decrease signifi cantly after 2020 as there are no current plans to develop new coal mines. In addition, ambitious GHG reduction targets, stricter air quality requirements and the decommissioning of old coal-fi red mines call for a reduction of coal in electricity generation. That said, coal consumption could get a boost if carbon capture and storage (CCS) becomes a more viable option and as cleaner technologies, as promoted by EMR, are developed. Although coal may be attractive from an energy security perspective, CO2 emission costs hinder the viability of existing and new plants, limiting the coal-fi red capacity that will be available in future.
Fossil fuels have historically been a key component of the UK’s energy mix and will likely remain so, even if additional investment is required.
12148

To start a new section, hold down the apple+shift keys and click
to release this object and type the section title in the box below.
Recently, the UK has made signifi cant progress in meeting its ambitious renewable energy targets. Yet there are still signifi cant uncertainties hindering the development of renewable energy.
Renewable energy To date, the UK has been struggling to meet its renewable energy targets in a timely manner. Nonetheless, signifi cant efforts are being made to accelerate the uptake of renewables. For instance, the UK is already a world leader in offshore wind, with two GW installed in 2012, and projections of up to 16 GW by 2020 and 39 GW by 2030. These efforts still need to increase signifi cantly for the UK to meet its renewable energy target. To this end, the country is reviewing its payment schemes. At the same time, the ERM support mechanisms to increase the share of renewables in power generation, and particularly the CfD feed-in-tariff model, are expected to heighten investment certainty and contribute signifi cantly to this effort. The Carbon Floor Price will also make low-carbon electricity (including electricity generated from renewables) more attractive and competitive.
Nevertheless, major diffi culties remain, particularly in the heating sector. The ambitious target of 12% stipulated by the Renewable Heat Incentive will require signifi cant changes in consumer behavior. In addition, the 10% target in the transport sector largely relies on biofuels, for which incorporation rates remain unsure. This creates uncertainties in terms of sustainable performance, particularly with regards to the land use changes caused by the deployment of biofuels.
GHG emissions The UK has set the ambitious target to reduce GHG emissions by 80% between 1990 and 2050. This requires a signifi cant transformation of the energy sector, together with a massive decarbonization of electricity generation. The energy effi ciency measures also play a particularly important role in meeting this long-term target.
The carbon budget mechanism which sets reduction targets well in advance supports investment certainty. The country has also set fi nancing mechanisms to improve energy effi ciency in various sectors, such as the Green Deal, which supports retrofi t works in buildings, and initiatives to promote Ultra-Low Emissions Vehicles (ULEVs).
Nonetheless, climate change is addressed by a large number of measures and this increases the regulatory complexity and burden. In addition, the UK has committed to commercializing CCS in power generation and energy-intensive industries in the next decade, to meet its ambitious targets in a cost-effi cient manner. In addition to setting up a £1 billion capital fund, the UK government is providing operational funding through EMR. CCS pilots are already underway, but the commercial viability of CCS remains uncertain.
The UK government identifi es policy areas where further improvements and, in some cases, extended funding are required. These areas include energy effi ciency, electrifi cation of heat and transport, and the decarbonization of power generation.
ConclusionThe UK will face signifi cant challenges in the coming decades, most notably in the following areas:
• Reducing the indigenous production of oil and gas
• Securing new generation capacity to replace the one-fi fth of its power capacity that will be decommissioned by 2020
• Meeting ambitious GHG reduction targets by transitioning to low-carbon power generation, commercializing CCS and improving energy effi ciency
These challenges require signifi cant investments, the establishment of investor certainty and signifi cant fl exibility to respond to changes in energy projections.
13 149Energy market reform in Europe

To start a new section, hold down the apple+shift keys and click
to release this object and type the section title in the box below.
To start a new section, hold down the apple+shift keys and click
to release this object and type the section title in the box below.
Selected bibliographic references
Committee on Climate Change (2014), Meeting Carbon Budgets – 2014 Progress Report to Parliament, http://www.theccc.org.uk/publication/meeting-carbon-budgets-2014-progress-report-to-parliament/
DECC (2009) – The UK Low Carbon Transition Plan
DECC (2009) – The UK Renewable Energy Strategy
DECC (2013) – UK Renewable Energy Roadmap, Update 2013, https://www.gov.uk/government/uploads/system/uploads/attachment_data/fi le/255182/UK_Renewable_Energy_Roadmap_-_5_November_-_FINAL_DOCUMENT_FOR_PUBLICATIO___.pdf
DECC (2014) – Digest of United Kingdom Energy Statistics
DECC (2014) – Next steps in CCS: Policy Scoping Document, https://www.gov.uk/government/uploads/system/uploads/attachment_data/fi le/341995/Final_Version_Policy_Scoping_Document_PSD.pdf
DECC (2014) – UK National Energy Effi ciency Action Plan
DUKES (2014): Digest of United Kingdom energy statistics 2014 (https://www.gov.uk/government/uploads/system/uploads/attachment_data/fi le/338750/DUKES_2014_printed.pdf)
EEA (2014 ) – Annual European Union greenhouse gas inventory 1990–2012 and inventory report 2014 – Submission to the UNFCCC Secretariat
Europe 2020 Targets [online] available on: http://epp.eurostat.ec.europa.eu/portal/page/portal/europe_2020_indicators/headline_indicators, Source: Eurostat. © European Union, 1995-2015
European Commission – Climate and energy priorities for Europe – the way forward. Presentation of J.M. Baroso on 20/21.03.2014, Source: http://ec.europa.eu. © European Union, 1995-2015
http://ec.europa.eu/clima/policies/2030/docs/climate_energy_priorities_en.pdf, Source: http://ec.europa.eu. © European Union, 1995-2015
European Commission Energy Country Factsheets 2012, Final Energy Consumption for year 200 & 2010 [online] on: http://ec.europa.eu/energy/observatory/countries/doc/2012-country-factsheets.pdf, Source: http://ec.europa.eu. © European Union, 1995-2015
European Commission Energy Country Factsheets 2012. Gross Inland Consumption by fuel (Primary Energy Consumption) in Mtoe for year 2010 [online] on: http://ec.europa.eu/energy/observatory/countries/doc/2012-country-factsheets.pdf, Source: http://ec.europa.eu. © European Union, 1995-2015
European Commission (2014), EU energy in fi gures - Statistical pocketbook 2014, © European Union, 2014
Eurostat Tables and Graphs Final Energy consumption for year 2012 updated on 17.02.2014, Source: Eurostat. © European Union, 1995-2015
Eurostat Tables and Graphs Final Energy consumption for year 2012 updated on 17.02.2014, Source: Eurostat. © European Union, 1995-2015
© OECD/IEA 2009 Energy Policies of IEA Countries – The United Kingdom, IEA Publishing. Licence: http://www.iea.org/t&c/Ofgem (2014) - Feed-in-Tariff (FIT) scheme, https://www.ofgem.gov.uk/environmental-programmes/feed-tariff-fi t-scheme
HM Revenue & Customs (2014), Carbon price fl oor: reform and other technical amendment: https://www.gov.uk/government/uploads/system/uploads/attachment_data/fi le/293849/TIIN_6002_7047_carbon_price_fl oor_and_other_technical_amendments.pdf
14150

To start a new section, hold down the apple+shift keys and click
to release this object and type the section title in the box below.
House of Commons’ Library (2014), Carbon Price Floor (SN/SC/5927)
Ofgem (2013), 2013 Great Britain and Northern Ireland National Reports to the European Commission, https://www.ofgem.gov.uk/ofgem-publications/82755/2013greatbritainandnorthernirelandnationalreportstotheeuropeancommission.pdf
15 151Energy market reform in Europe

To start a new section, hold down the apple+shift keys and click
to release this object and type the section title in the box below.
To start a new section, hold down the apple+shift keys and click
to release this object and type the section title in the box below.
Contact us
To discuss any of the topics raised in this report, please contact:
BelgiumGert VanheesPartnerDeloitte BelgiumTel: +32 2 800 22 [email protected]
FranceVéronique LaurentPartnerDeloitte FranceTel: +33 1 55 61 61 [email protected]
Sébastien SoleilleDirectorDeloitte FranceTel: +33 1 55 61 54 [email protected]
Jean-Michel GauthierSenior AdvisorDeloitte FranceTel: +33 1 55 61 69 [email protected]
GermanyThomas SchlaakPartnerDeloitte GermanyTel: +49 4032 0804 [email protected]
ItalyPiergiulio BizioliPartnerDeloitte ItalyTel: +39 [email protected]
NetherlandsMarcus van den HoekPartnerDeloitte NetherlandsTel: +31 8828 [email protected]
SpainFelipe RequejoPartnerDeloitte SpainTel: +34 [email protected]
UKJames LeighPartnerDeloitte UKTel: +44 20 7007 [email protected]
42
Notes
44152

To start a new section, hold down the apple+shift keys and click
to release this object and type the section title in the box below.
To start a new section, hold down the apple+shift keys and click
to release this object and type the section title in the box below.
Contact us
To discuss any of the topics raised in this report, please contact:
BelgiumGert VanheesPartnerDeloitte BelgiumTel: +32 2 800 22 [email protected]
FranceVéronique LaurentPartnerDeloitte FranceTel: +33 1 55 61 61 [email protected]
Sébastien SoleilleDirectorDeloitte FranceTel: +33 1 55 61 54 [email protected]
Jean-Michel GauthierSenior AdvisorDeloitte FranceTel: +33 1 55 61 69 [email protected]
GermanyThomas SchlaakPartnerDeloitte GermanyTel: +49 4032 0804 [email protected]
ItalyPiergiulio BizioliPartnerDeloitte ItalyTel: +39 [email protected]
NetherlandsMarcus van den HoekPartnerDeloitte NetherlandsTel: +31 8828 [email protected]
SpainFelipe RequejoPartnerDeloitte SpainTel: +34 [email protected]
UKJames LeighPartnerDeloitte UKTel: +44 20 7007 [email protected]
42
Notes
44 153Energy market reform in Europe

This publication has been written in general terms and therefore cannot be relied on to cover specifi c situations; application of the principles set out will depend upon the particular circumstances involved and we recommend that you obtain professional advice before acting or refraining from acting on any of the contents of this publication. Deloitte Conseil accepts no duty of care or liability for any loss occasioned to any person acting or refraining from action as a result of any material in this publication.
The present study was undertaken by Deloitte Conseil on the basis of data, studies, whether public or not public, and interviews, a list of which is contained in the bibliographic index. Such data was neither audited or verifi ed. By essence, any information relating to future hypotheses may turn out to be inapplicable in the future. The present study is provided for the sole benefi t of its intended recipients. The recipients are sole responsible for the decision they make based on their assessment of said study. The reader is responsible for evaluating whether or not the content of the study meet his own objectives, drawing his own conclusions and bearing all the consequences of the resulting decisions. Deloitte Conseil shall not be held liable for the consequences thereof. The recipient of the study is prohibited from providing a copy of all or part of the Deliverables to a third party, or allowing any third party whatsoever to benefi t from all or part of the Services, even gratuitously.
Deloitte refers to one or more of Deloitte Touche Tohmatsu Limited, a UK private company limited by guarantee, and its network of member fi rms, each of which is a legally separate and independent entity. Please see www.deloitte.com/about for a detailed description of the legal structure of Deloitte Touche Tohmatsu Limited and its member fi rms. In France, Deloitte SAS is the member fi rm of Deloitte Touche Tohmatsu Limited, and professional services are provided by its subsidiaries and affi liates.
Deloitte provides audit, tax, consulting, and fi nancial advisory services to public and private clients spanning multiple industries. With a globally connected network of member fi rms in more than 150 countries, Deloitte brings world-class capabilities and high-quality service to clients, delivering the insights they need to address their most complex business challenges. Deloitte’s approximately 210,000 professionals are committed to becoming the standard of excellence.
In France, Deloitte calls on diversifi ed expertise to meet the challenges of its clients of all sizes from all industries – major multinationals, local micro-companies and medium-sized enterprises. With the expertise of its 9,000 professionals and partners, Deloitte is a leading player in audit and risk services, consulting, fi nancial advisory, tax & legal and accounting, based on a multidisciplinary offering and a set of action principles attuned to the requirements of our environment.
© 2015 Deloitte Conseil – All rights reserved – Member of Deloitte Touche Tohmatsu Limited
Produit et réalisé par le Creative Studio, Zurich. 42168A44496A