EFFECT OF ABSORBER POSITION ON GAMMA RAY...
11
EFFECT OF ABSORBER POSITION ON GAMMA RAY SPECTRA Karunakaran Nair K. “Investigations on gamma ray interactions using 137 CS gamma rays” Thesis.Department of Physics, University of Calicut, 2003
Transcript of EFFECT OF ABSORBER POSITION ON GAMMA RAY...

EFFECT OF ABSORBER POSITION ON
GAMMA RAY SPECTRA
Karunakaran Nair K. “Investigations on gamma ray interactions using 137CS gamma rays” Thesis.Department of Physics, University of Calicut, 2003

EFFECT OF ABSORBER POSITION ON GAMMA RAY SPECTRA
5.1 Introduction
In experiments involving measurement of gamma ray spectra under different '
conditions it may be required to use suitable absorbers in between source and detector.
Unless a very narrow beam good geometry setup is used in the measurements forward
inelastic scattering of the gamma rays from the absorber will lead to a distortion in the lower
energy part of the pulse height spectrum of the gamma rays [I]. Since the maximum angle of
scattering depends on the position of the absorber in between the source and the detector, the
overall shape of the spectrum in turn depends on the absorber position. As a result, in cases
where many gamma energies are involved, it becomes difficult to evaluate the spectral
components due to the individual gamma energies.
We have studied the pulse height distribution of 13'cs gamma rays passing through
lead absorbers as a hnction of absorber position. Some preliminary results were presented at
the National Radiation Physics Symposium at Mangalore in 1999 [2]. The details of the
experiment and the results are presented below.

Pre-Amplifier PMT NaI(T1)
Amplifier MCA
- - - - - - - - - - - - ,_...... .._....-
__.... I * Source
Figure 5.1 Experimental set up
5.2 Experimental Method
A 1 pCi 1 3 7 ~ s source procured from BARC, Mumbai has been used in the
present investigations to provide gamma rays of 662 keV energy. A 1 34'' X 2'' Sodium
iodide detector was used for detecting the gamma rays. Standard NIM setup was used to store
the pulse height spectrum of the detected gamma rays on a Nucleonix 4K Multichannel
Analyzer. A poor geometry broad beam set up was assembled. Lead absorbers in the form of
square sheets of dimensions 8 cm X 8 cm X 0.3 mm were used. The absorbers were placed
vertically in between the source and the detector at distances of 0 cm, 5cm, 10 cm and 15 cm
from the detector face. At each position data were taken without any absorber and for three
values of the absorber thickness (3 sheets, 6 sheets and 9 sheets). A schematic diagram of the
setup is given in fig. 5.1. Fig. 5.1 also shows the maximum angle at which the gamma rays
scattered from the absorber can still reach the detector and be detected.
Spectra were collected in the MCA to achieve good statistical accuracy. The counts in
the channels were plotted for each absorber position and for each absorber thickness, after
normalization to the photo peak counts.
5.3 Results and Discussions
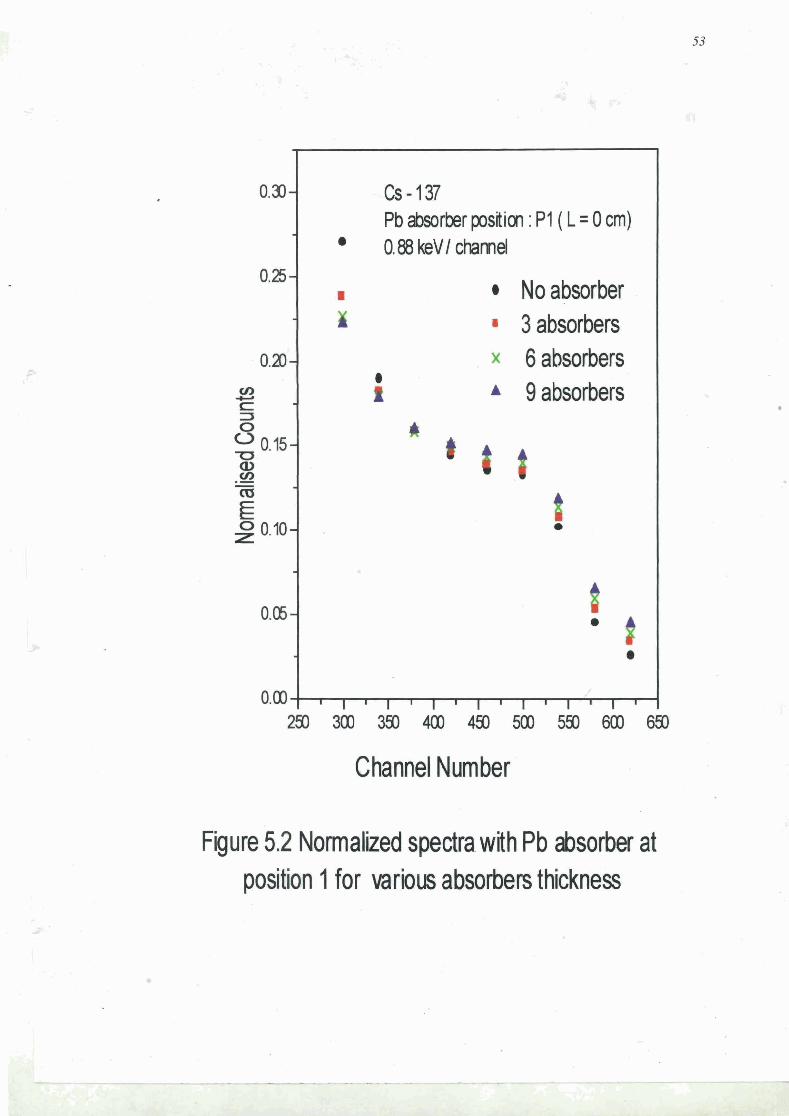
Figures 5.2 - 5.5 show the normalized spectra in the energy region 220 keV to 580
keV for the four absorber positions. Each figure contains the spectra for the four absorber
Channel Number
0.30 -
0.25 -
0.20 - <n c. r=
0.15- u Q) cn .- - E ,o 0.M-
0.06 -
0.00
Figure 5.2 Normalized spectra with Pb absorber at position 1 for various absorbers thickness
Cs-137 Pb &orber position : P I ( L 0 cm) 0.88 keVl charnel
@ Noabsorber a 3 absorbers
. w 6 absorbers A 9 absorbers
8 0
' 1 ' I I I I I I
2 5 0 3 0 0 3 5 0 4 0 0 4 5 0 5 0 0 5 9 0 6 0 0 6 5 0
-
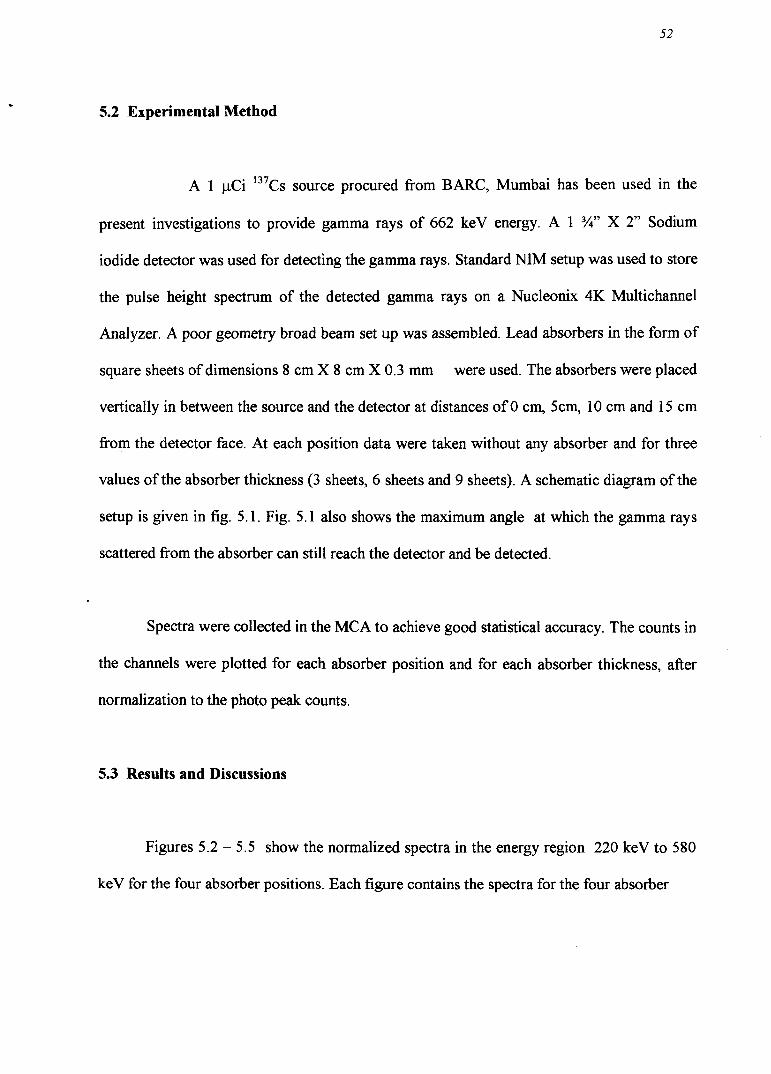
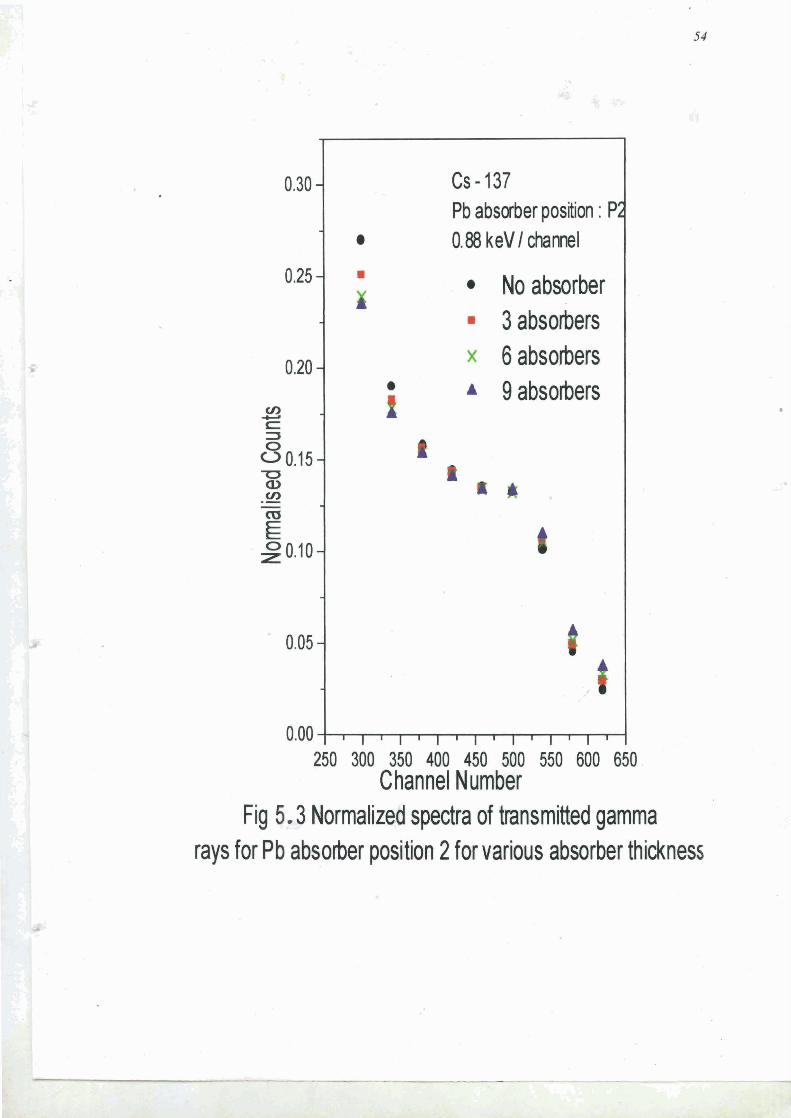
Fig 5.3 Normalized spectra of transmitted gamma
0.00 250 300 350 400 450 500 550 600
CS - 137 ,Pb absarber position : Pi
rays for Pb absorber position 2 for various absorber thickness
650 Channel Number
- 0.88 keV I channel
No absorber 3 absobers
- K 6 absobers A 9 absorbers
-
-
-
- ; 1 t l ~ I ~ l ~ l ~ I ~ ~ ~ l ~ I
2) " ,
,: . . ' A. r=; . , . . .:'.; ..- I ? . '!4 . ..-, , ,
. .~ : -:i .,
No absorber 3 absorbers 6 absorbers 9 absorbers
250 300 350 400 450 500 550 600 650
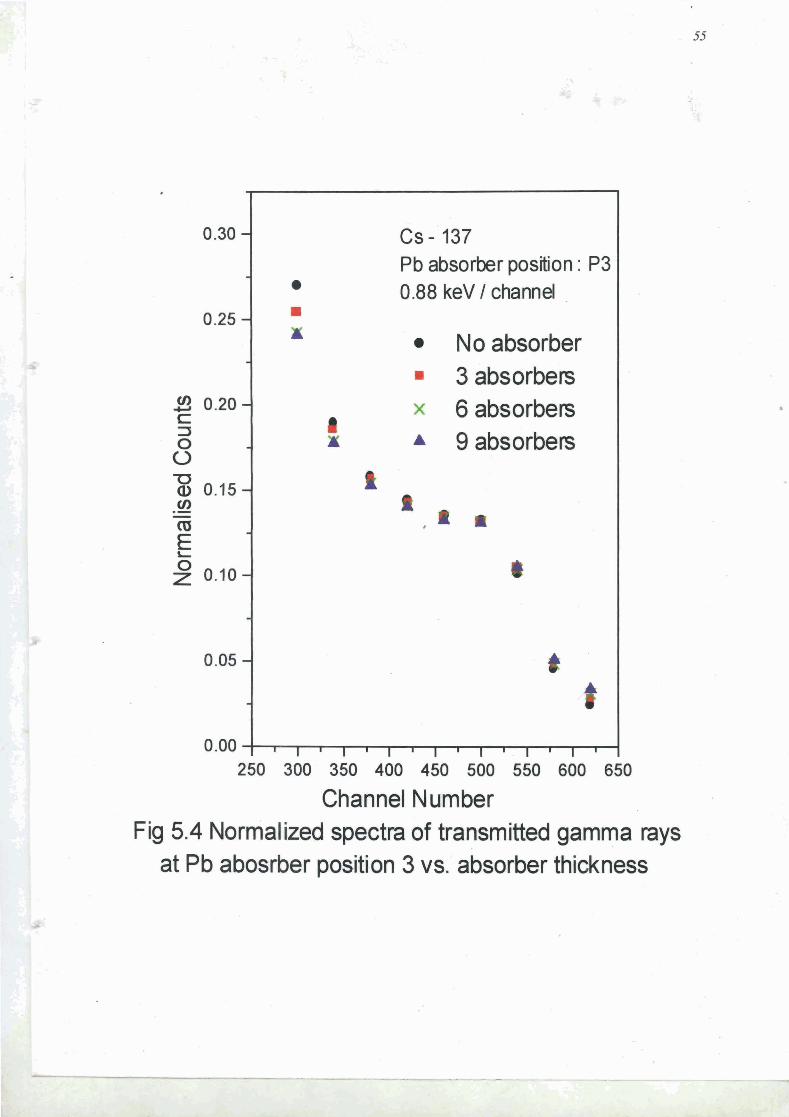
Channel Number Fig 5.4 Normalized spectra of transmitted gamma rays
at Pb abosrber position 3 vs. absorber thickness
-
-
-
-
-
- -
-
-
-
-
CS - 137 Pb absorber position : P3 0.88 keV 1 channel
8 I ~ l ~ l ~ I ~ l ~ l ~ l ~ I
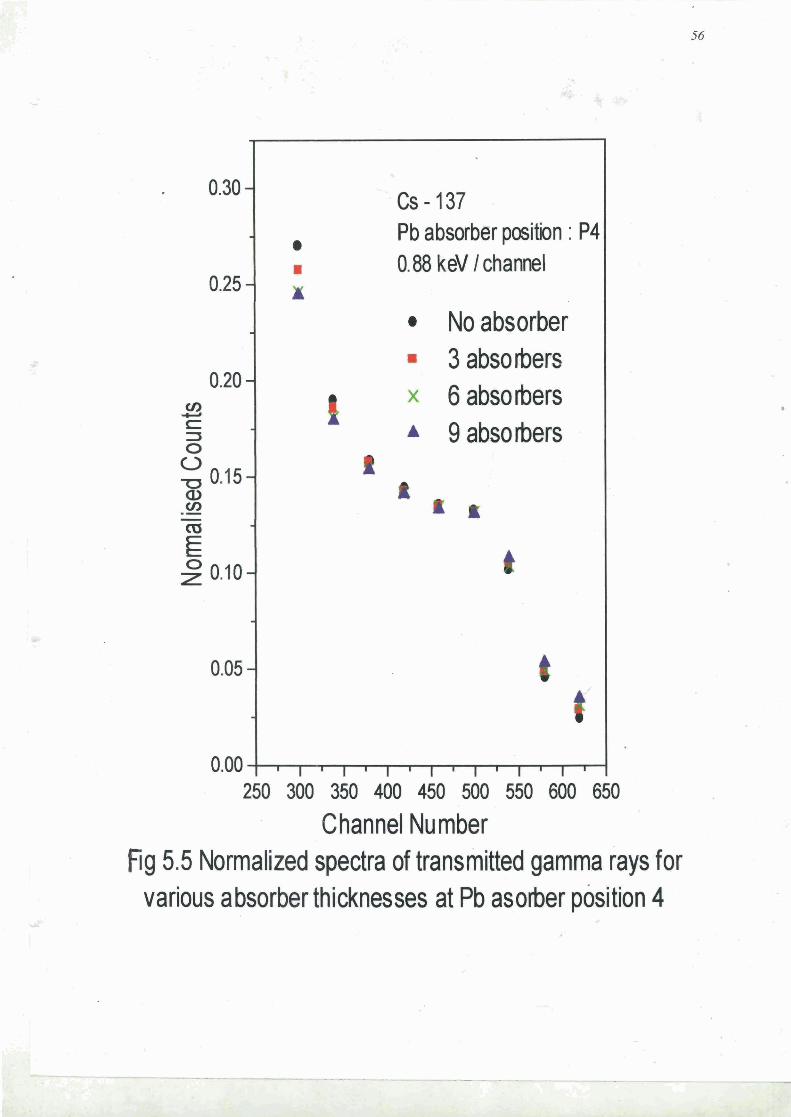
Channel Number Fig 5.5 Normalized spectra of transmitted gamma rays for
650
-
0.30 -
0.25 -
-
0.20 - cn -c. C 3 0
0.15- a, rn .- - e s 0.10-
0.05 -
various absorber thicknesses at Pb asorber position 4
CS-137 Pb absorber position : P4 0.88 kN I channel
No absorber 3absobers
x 6 absobers A 9 a b s o ~ r s
b o . o o , l ~ l ~ ~ ~ l ~ l ~ l ~ l ~ l ,
250 300 350 400 450 500 550 600
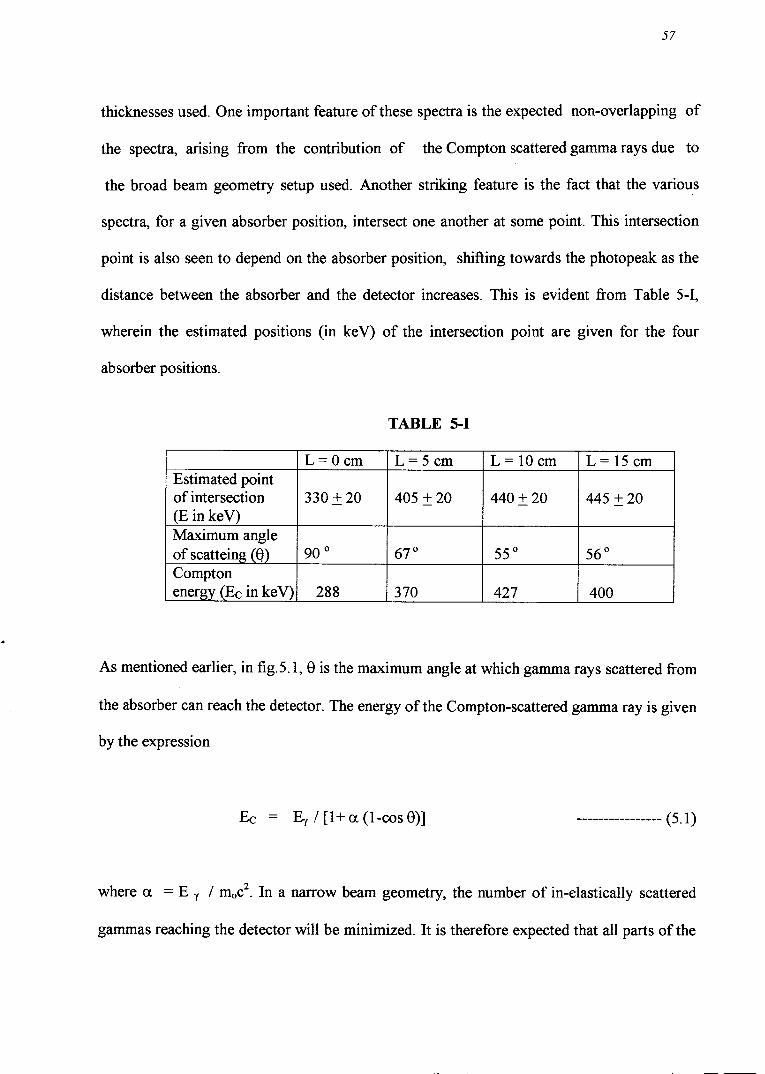
thicknesses used. One important feature of these spectra is the expected non-overlapping of
the spectra, arising from the contribution of the Compton scattered gamma rays due to
the broad beam geometry setup used. Another striking feature is the fact that the various
spectra, for a given absorber position, intersect one another at some point. This intersection
point is also seen to depend on the absorber position, shifting towards the photopeak as the
distance between the absorber and the detector increases. This is evident from Table 5-1,
wherein the estimated positions (in keV) of the intersection point are given for the four
absorber positions.
TABLE 5-1
Estimated point of intersection (E in keV) Maximum angle
As mentioned earlier, in fig.5.1, 8 is the maximum angle at which gamma rays scattered from
the absorber can reach the detector. The energy of the Compton-scattered gamma ray is given
by the expression
of scatteing (0) Compton energy (Ec in keV)
2 where a = E , 1 moc . In a narrow beam geometry, the number of in-elastically scattered
gammas reaching the detector will be minimized. It is therefore expected that all parts of the
L=Ocm
330 2 20
90 "
288
L = 1 5 c m
445 2 20
L = 5 c m
405 2 20
67 "
3 70
L= lOcm
440 2 20
55"
427
56"
400
spectrum will get attenuated by the same factor exp(-pt) for a given absorber thickness, p
being the attenuation coefficient for the incident gamma rays. So when normalized spectra
like those in figure 5.2 - 5.5 are plotted, they are expected to overlap one another
everywhere. In broad beam geometry Compton-scattered gamma rays also get detected and
contribute to the spectra in the energy region below the photopeak. The spectral counts per
channel will therefore, increase as t increases. The lower energy part of the spectrum gets
enhanced relative to the photopeak as t is increased, down to the minimum energy possible
i.e, EC corresponding to the maximum angle 8 (Table 5-1). Below this energy, one expects
overlapping of the normalized spectra. However, we actually see increasing suppression in
the energy region below EC as the absorber thickness increases. This behaviour can be
explained as due to the presence of the backscatter peak at 188 keV (Ec for 8 = 180) [See
reference 3 and Chapter 1x1. This peak corresponds to gammas of the lower energy
indicated, falling on the absorber along with the gammas of 662 keV energy. The attenuation
coefficient is larger for the backscattered energy and hence the observed behaviour below Ec.
The changing value of EC as the absorber position changes is seen to be nicely correlated to
the change in the intersection point in the figures 5.2 - 5.5.
References
1. Evans R.D., "The Atomic Nucleus" ( Tata McGraw Hill Publishing Co. - 1955 )
p. 728
2. Karunakaran Nair K., Unnikrishnan M.P. and Varier K.M., National symposium
on Radiation Physics, NSRP - 13, Mangalore (1999) 547
3. Varier K.M.and Karunakaran Nair K., Radiat. Phys. Chem. Vo1.5 1 ,No.4 - 6,
(1 998) 46 1