
eCommerce in Southeast Asia Population (in Millions) 54 Million are in Major Cities 12.9 10.3 9.3...
52
Transcript of eCommerce in Southeast Asia Population (in Millions) 54 Million are in Major Cities 12.9 10.3 9.3...
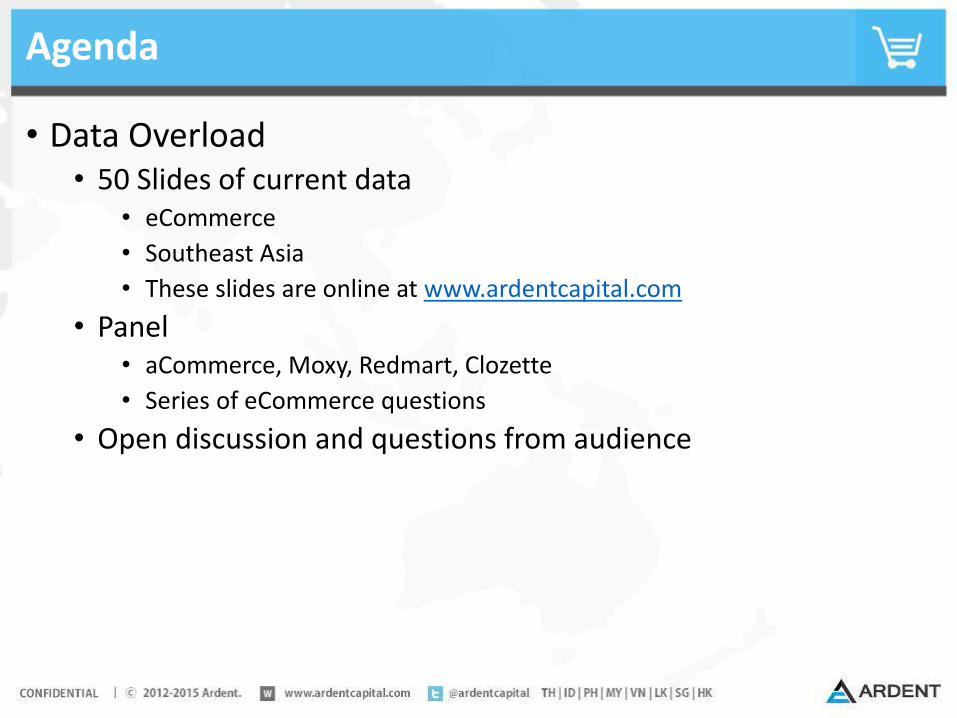
Agenda
• Data Overload• 50 Slides of current data
• eCommerce
• Southeast Asia
• These slides are online at www.ardentcapital.com
• Panel• aCommerce, Moxy, Redmart, Clozette
• Series of eCommerce questions
• Open discussion and questions from audience
Ardent = eCommerce
• Why is that?• Our three main portfolio companies
• Our investors
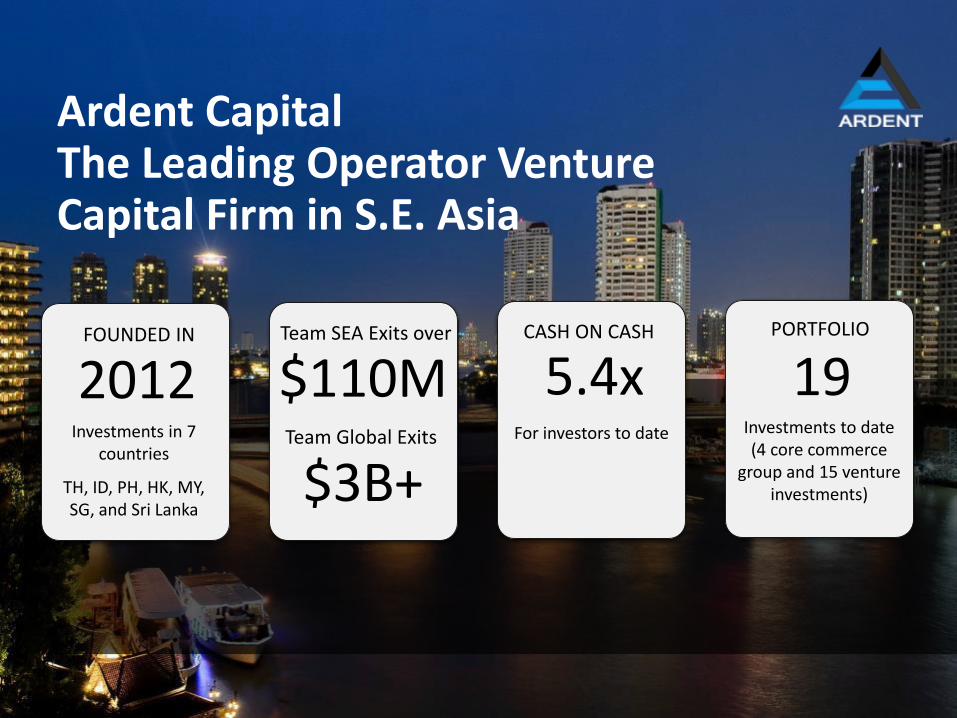
Ardent CapitalThe Leading Operator Venture Capital Firm in S.E. Asia
FOUNDED IN
2012Investments in 7
countries
TH, ID, PH, HK, MY, SG, and Sri Lanka
Team SEA Exits over
$110MPORTFOLIO
19Investments to date (4 core commerce
group and 15 venture investments)$3B+
Team Global Exits
CASH ON CASH
5.4xFor investors to date
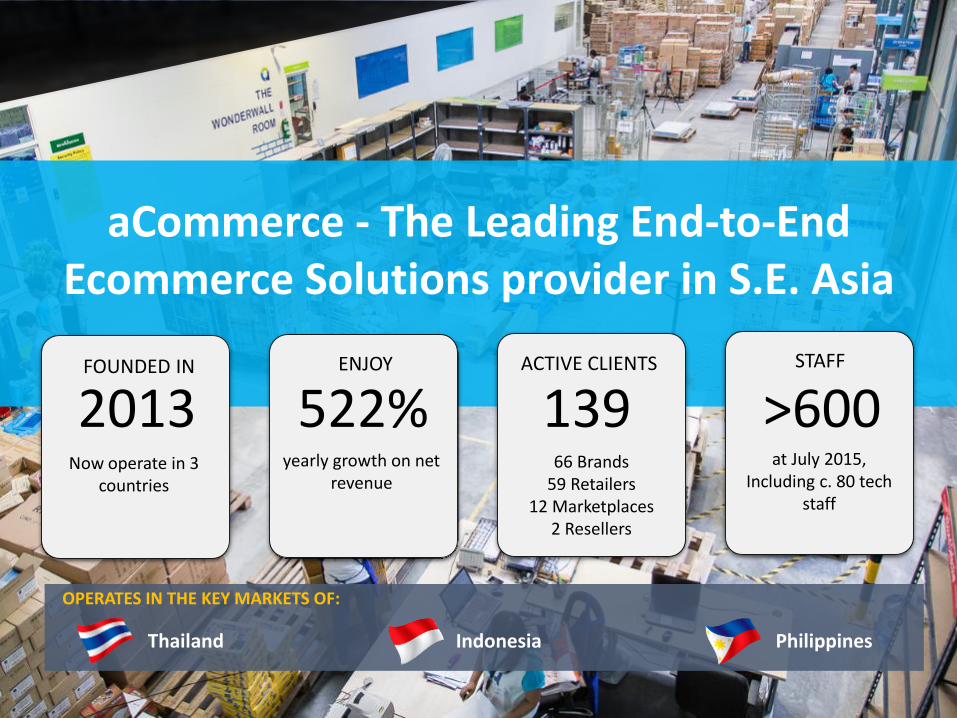
aCommerce - The Leading End-to-End Ecommerce Solutions provider in S.E. Asia
FOUNDED IN
2013Now operate in 3
countries
ENJOY
522%yearly growth on net
revenue
ACTIVE CLIENTS
13966 Brands
59 Retailers 12 Marketplaces
2 Resellers
STAFF
>600at July 2015,
Including c. 80 tech staff
Thailand Indonesia Philippines
OPERATES IN THE KEY MARKETS OF:
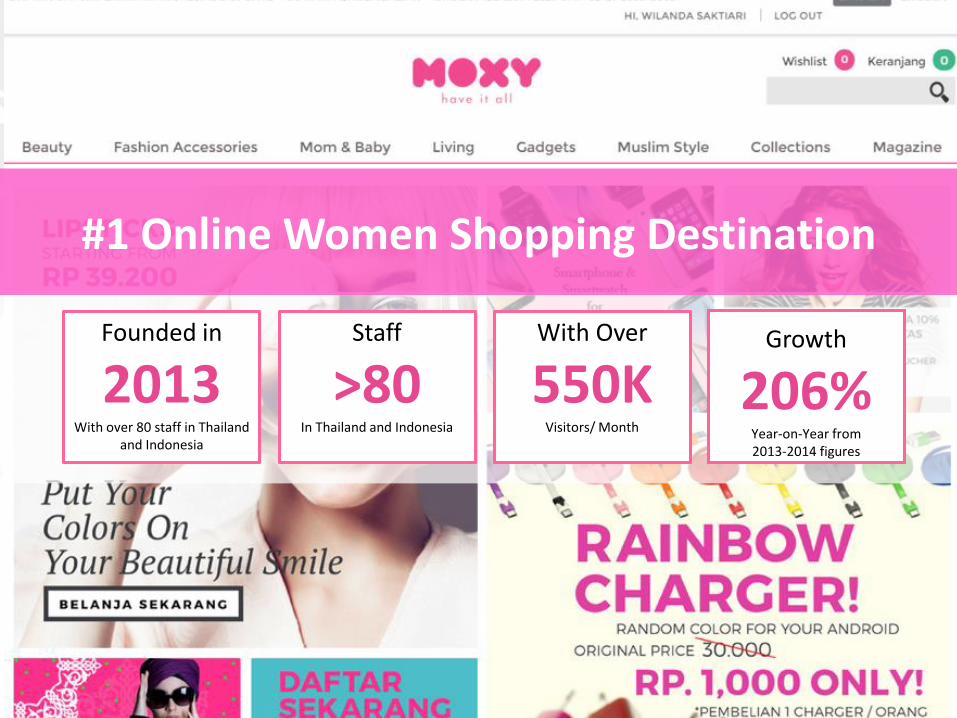
Founded in
2013With over 80 staff in Thailand
and Indonesia
Staff
>80In Thailand and Indonesia
With Over
550KVisitors/ Month
Growth
206%Year-on-Year from2013-2014 figures
#1 Online Women Shopping Destination
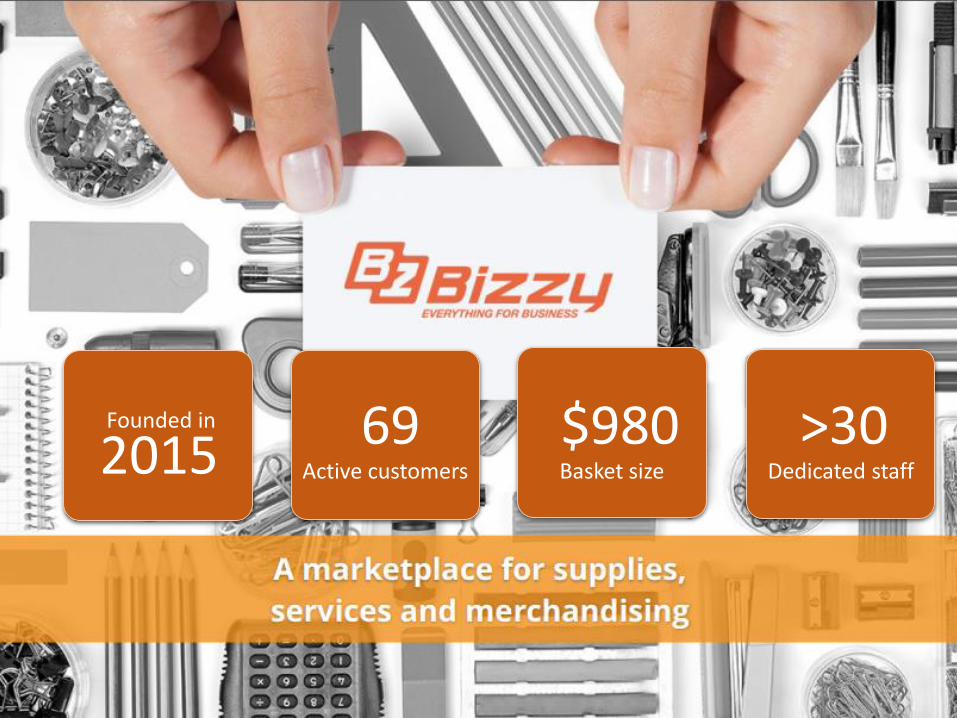
Founded in
201569 $980
Basket sizeActive customers
>30Dedicated staff
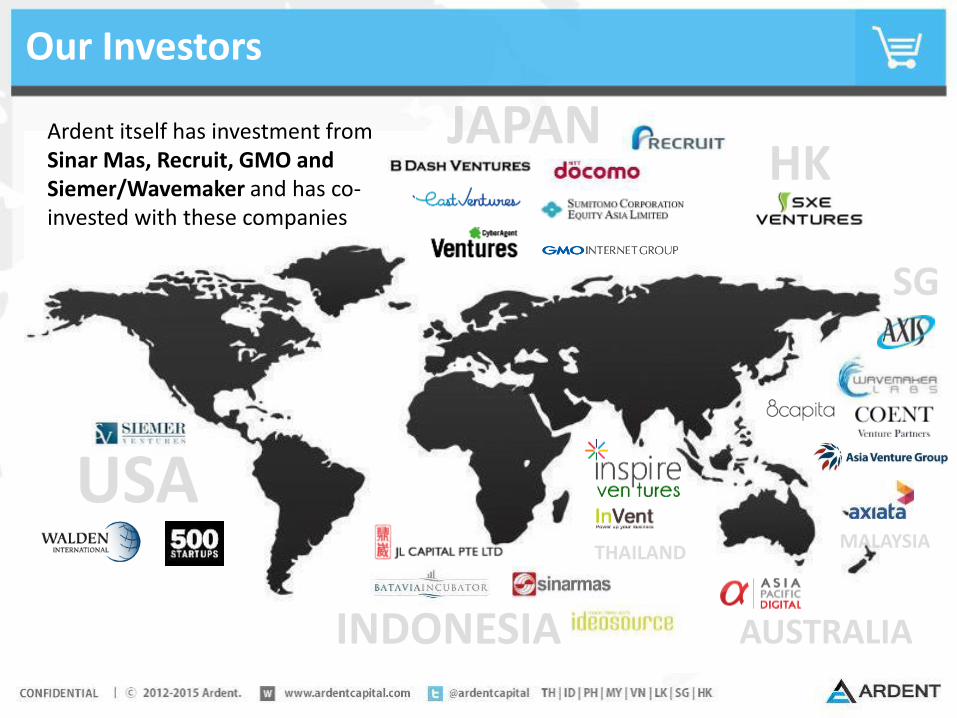
Our Investors
Ardent itself has investment fromSinar Mas, Recruit, GMO and Siemer/Wavemaker and has co-invested with these companies
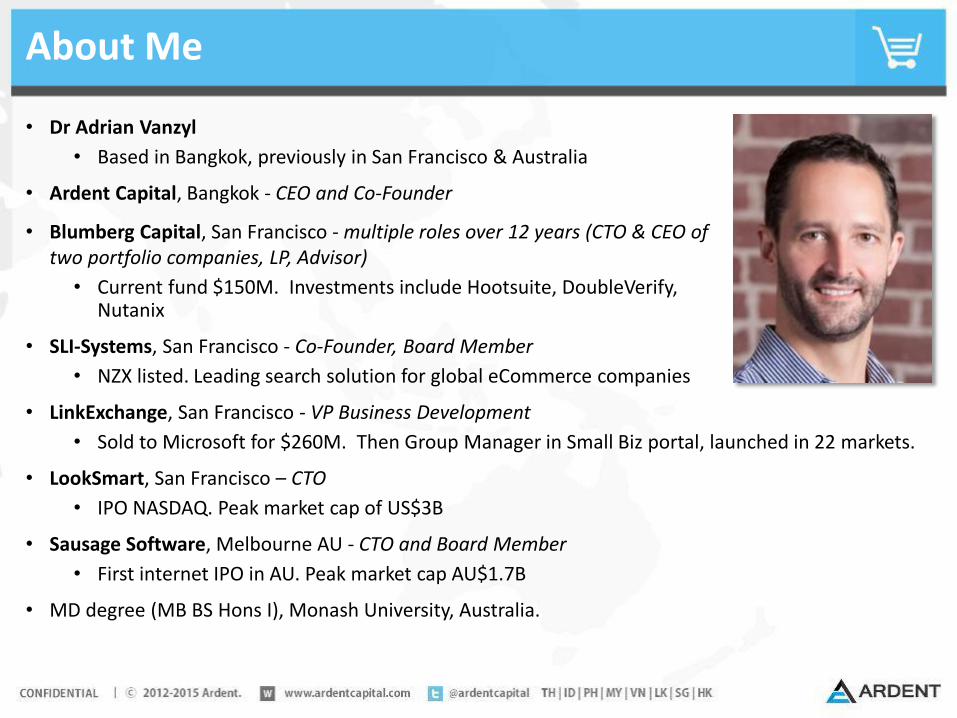
About Me
• Dr Adrian Vanzyl
• Based in Bangkok, previously in San Francisco & Australia
• Ardent Capital, Bangkok - CEO and Co-Founder
• Blumberg Capital, San Francisco - multiple roles over 12 years (CTO & CEO of two portfolio companies, LP, Advisor)
• Current fund $150M. Investments include Hootsuite, DoubleVerify, Nutanix
• SLI-Systems, San Francisco - Co-Founder, Board Member
• NZX listed. Leading search solution for global eCommerce companies
• LinkExchange, San Francisco - VP Business Development
• Sold to Microsoft for $260M. Then Group Manager in Small Biz portal, launched in 22 markets.
• LookSmart, San Francisco – CTO
• IPO NASDAQ. Peak market cap of US$3B
• Sausage Software, Melbourne AU - CTO and Board Member
• First internet IPO in AU. Peak market cap AU$1.7B
• MD degree (MB BS Hons I), Monash University, Australia.
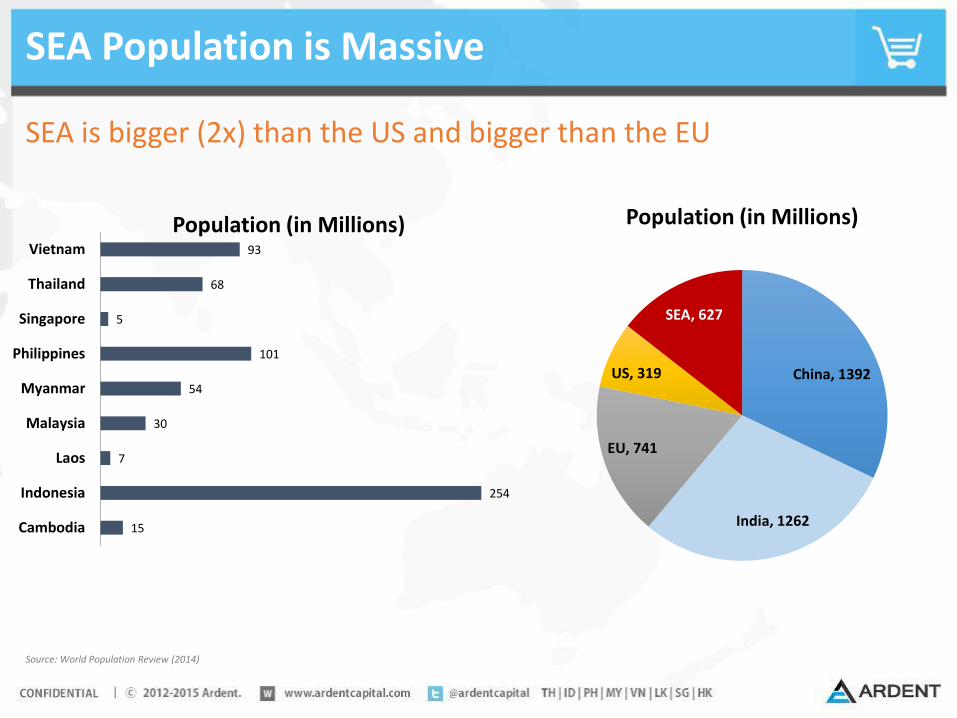
SEA Population is Massive
SEA is bigger (2x) than the US and bigger than the EU
Source: World Population Review (2014)
China, 1392
India, 1262
EU, 741
US, 319
SEA, 627
Population (in Millions)
15
254
7
30
54
101
5
68
93
Cambodia
Indonesia
Laos
Malaysia
Myanmar
Philippines
Singapore
Thailand
Vietnam
Population (in Millions)
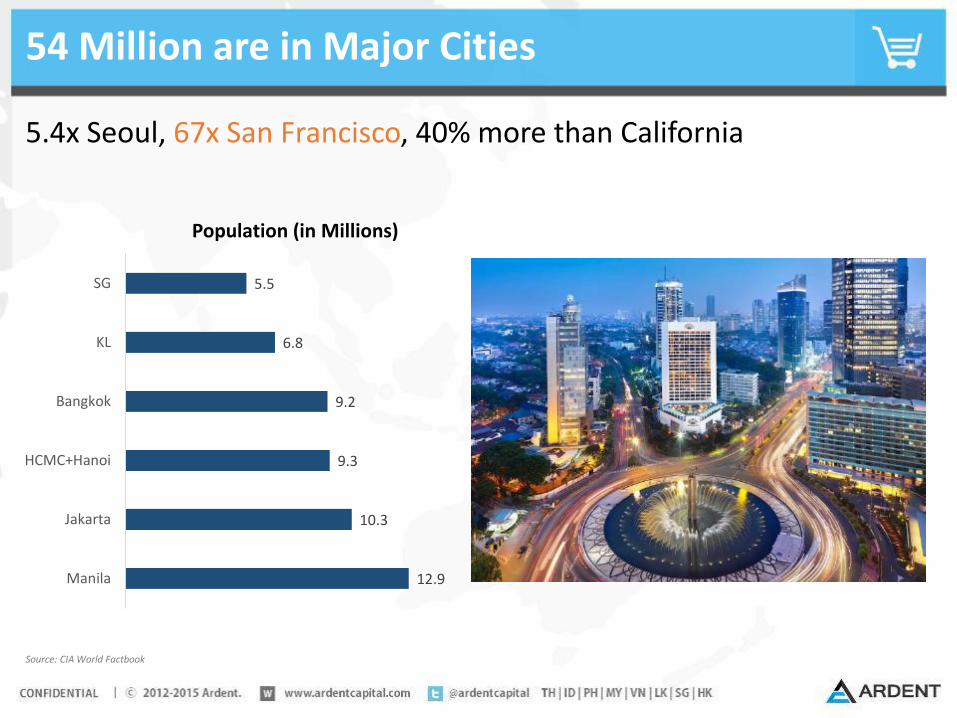
54 Million are in Major Cities
12.9
10.3
9.3
9.2
6.8
5.5
Manila
Jakarta
HCMC+Hanoi
Bangkok
KL
SG
Source: CIA World Factbook
5.4x Seoul, 67x San Francisco, 40% more than California
Population (in Millions)
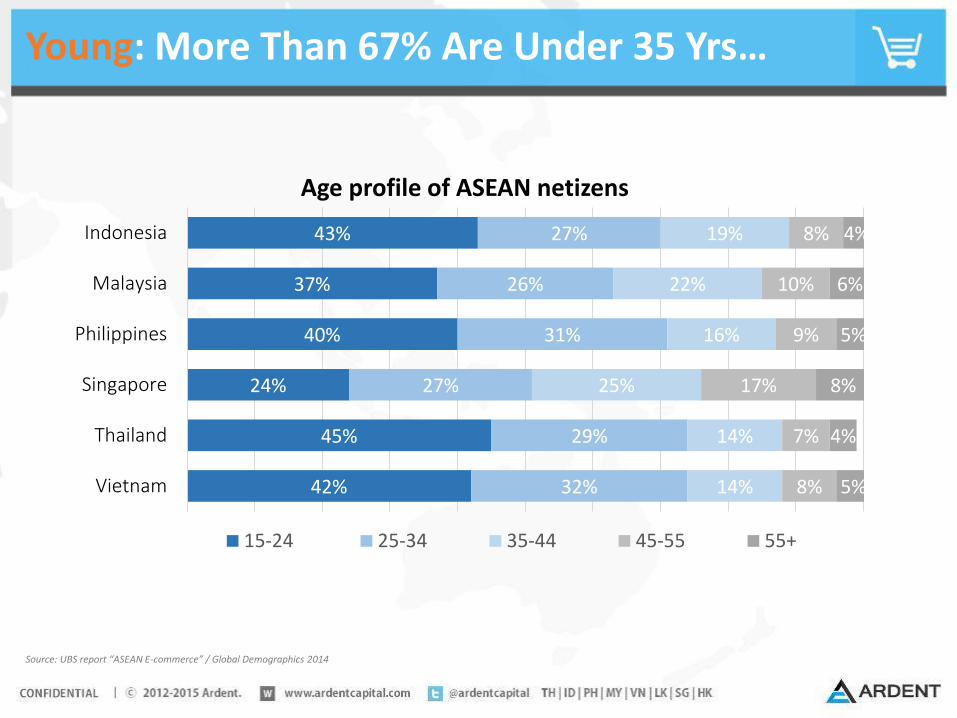
Young: More Than 67% Are Under 35 Yrs…
Source: UBS report “ASEAN E-commerce” / Global Demographics 2014
42%
45%
24%
40%
37%
43%
32%
29%
27%
31%
26%
27%
14%
14%
25%
16%
22%
19%
8%
7%
17%
9%
10%
8%
5%
4%
8%
5%
6%
4%
Vietnam
Thailand
Singapore
Philippines
Malaysia
Indonesia
Age profile of ASEAN netizens
15-24 25-34 35-44 45-55 55+
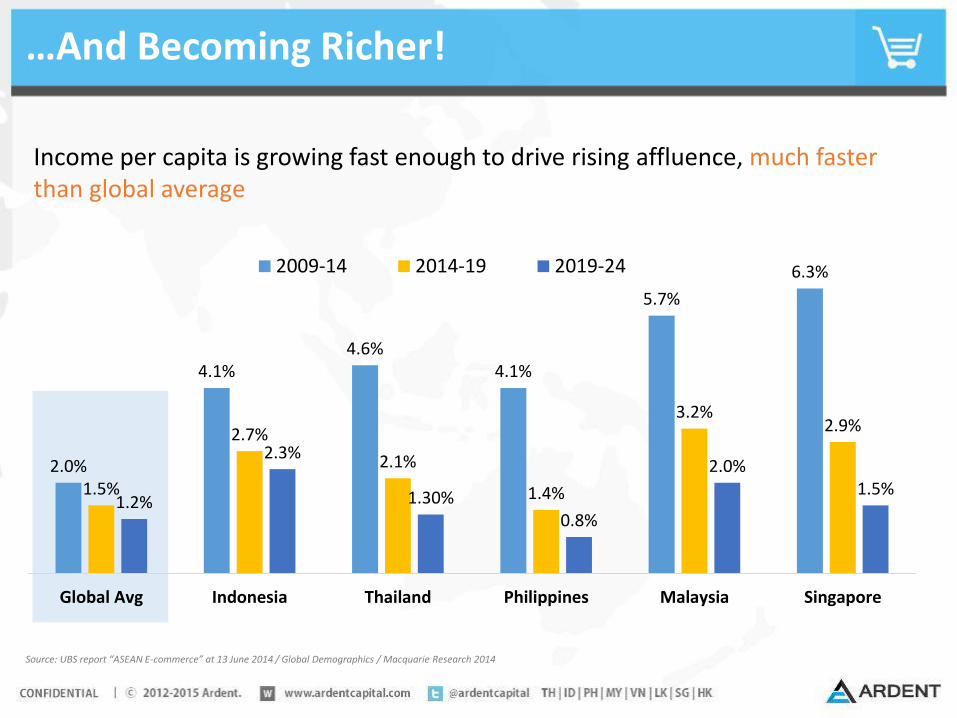
…And Becoming Richer!
Source: UBS report “ASEAN E-commerce” at 13 June 2014 / Global Demographics / Macquarie Research 2014
Income per capita is growing fast enough to drive rising affluence, much faster than global average
2.0%
4.1%4.6%
4.1%
5.7%
6.3%
1.5%
2.7%
2.1%
1.4%
3.2%2.9%
1.2%
2.3%
1.30%0.8%
2.0%1.5%
Global Avg Indonesia Thailand Philippines Malaysia Singapore
2009-14 2014-19 2019-24
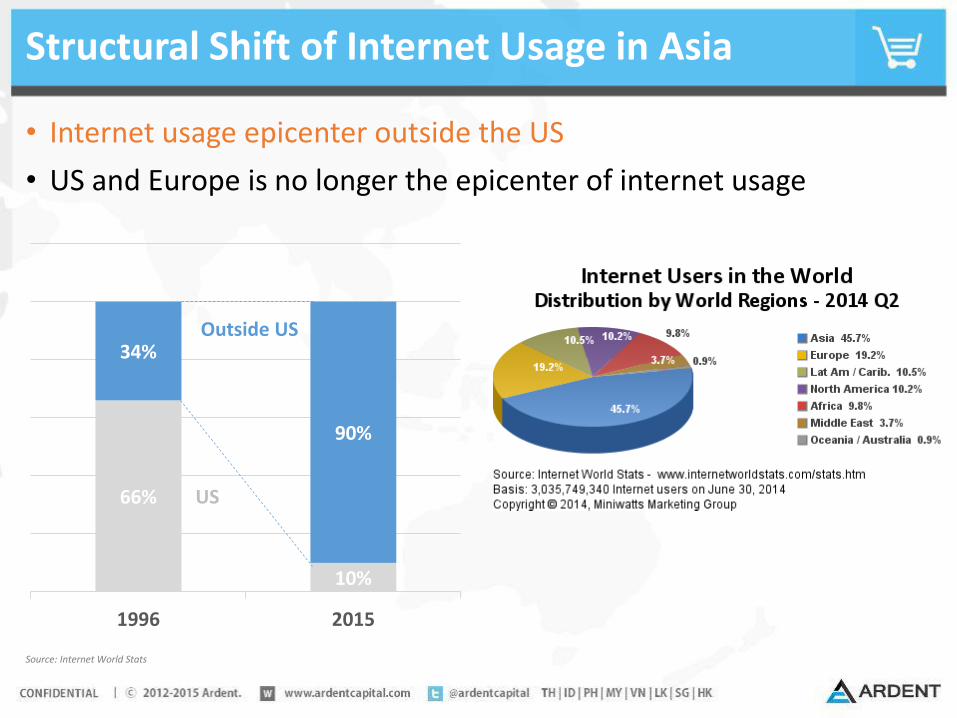
Structural Shift of Internet Usage in Asia
• Internet usage epicenter outside the US
• US and Europe is no longer the epicenter of internet usage
Source: Internet World Stats
66%
10%
34%
90%
1996 2015
Outside US
US
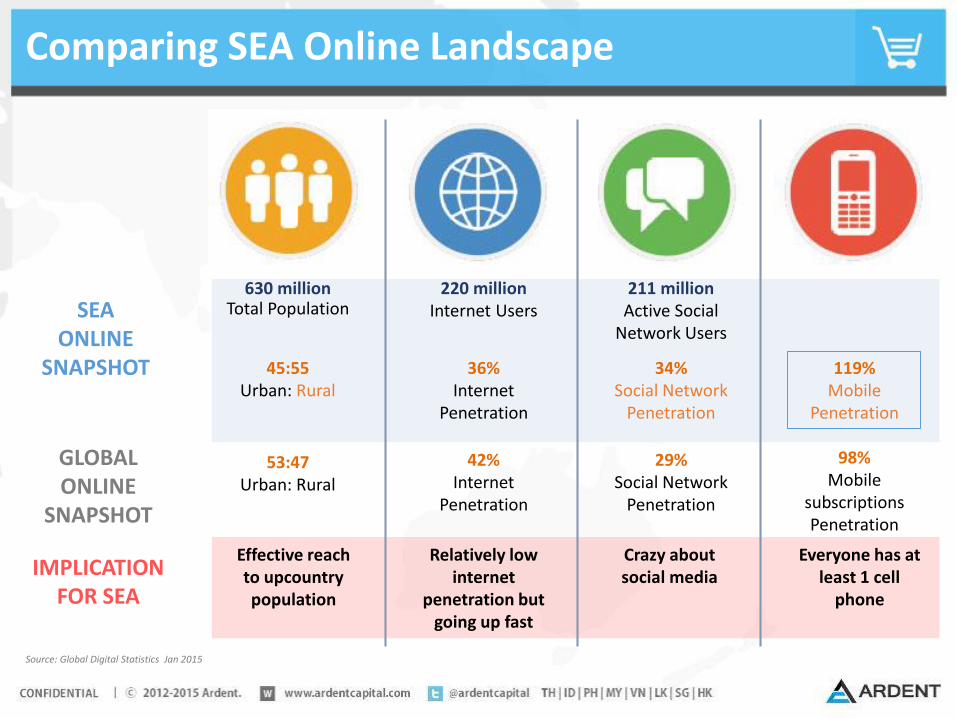
Comparing SEA Online Landscape
211 millionActive Social
Network UsersSEA
ONLINESNAPSHOT
220 million Internet Users
630 millionTotal Population
119%Mobile
Penetration
34% Social Network
Penetration
36% Internet
Penetration
45:55 Urban: Rural
98%Mobile
subscriptionsPenetration
29% Social Network
Penetration
42% Internet
Penetration
53:47Urban: Rural
GLOBALONLINE
SNAPSHOT
Source: Global Digital Statistics Jan 2015
Effective reach to upcountry population
Relatively low internet
penetration but going up fast
Crazy about social media
Everyone has at least 1 cell
phone
IMPLICATION FOR SEA
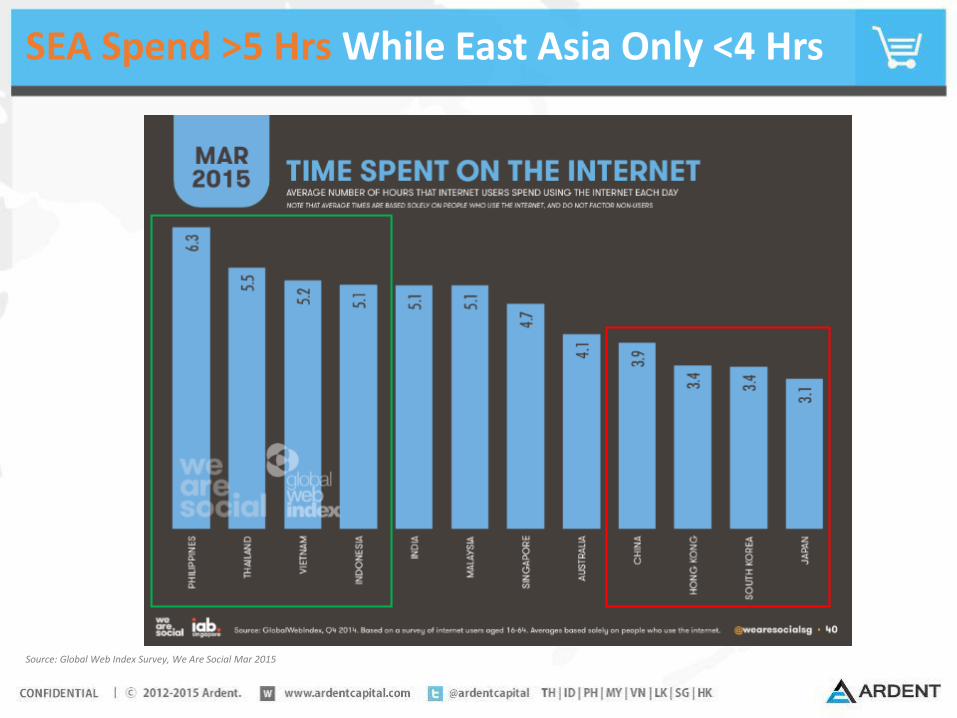
SEA Spend >5 Hrs While East Asia Only <4 Hrs
Source: Global Web Index Survey, We Are Social Mar 2015

Internet Has Surpassed TV in Most SEA
Source: Nielsen; eMarketer 2014
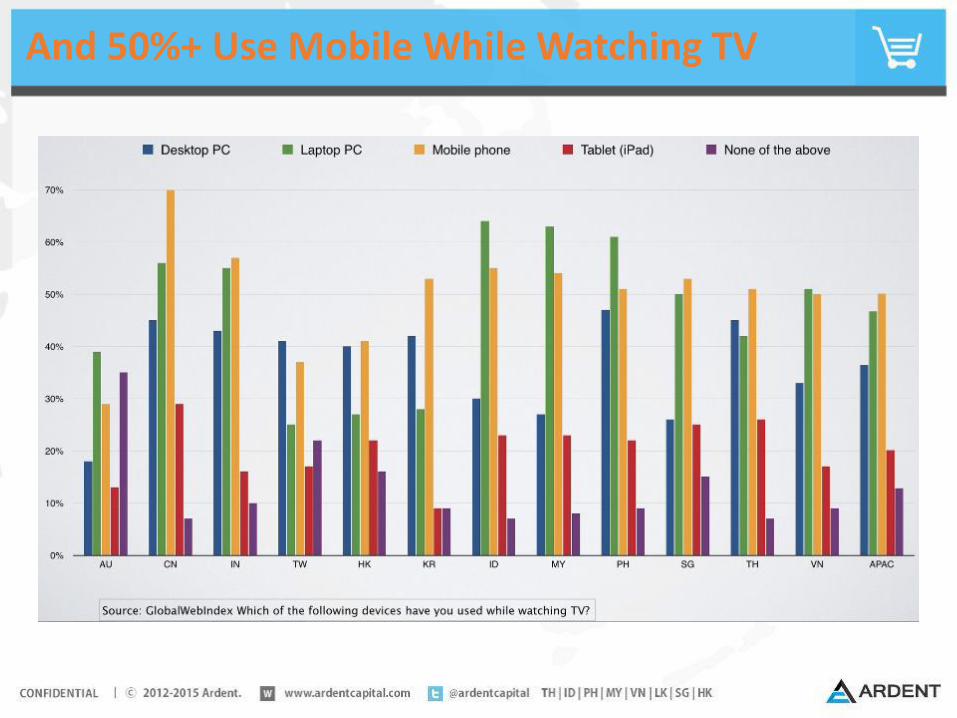
And 50%+ Use Mobile While Watching TV
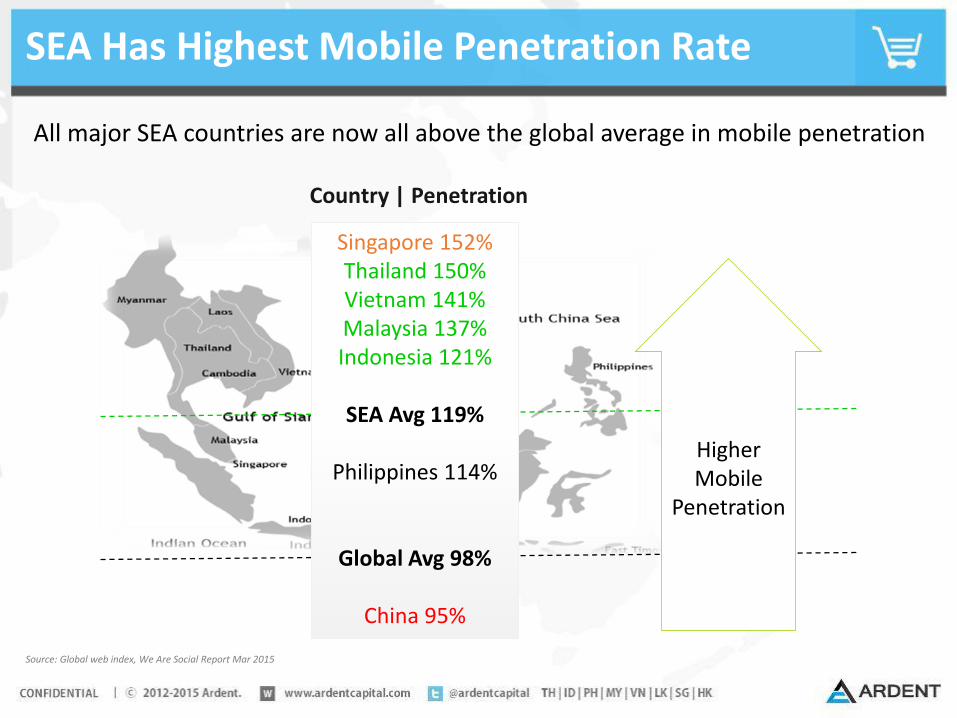
SEA Has Highest Mobile Penetration Rate
Source: Global web index, We Are Social Report Mar 2015
Higher Mobile
Penetration
Singapore 152%Thailand 150%Vietnam 141%Malaysia 137%Indonesia 121%
SEA Avg 119%
Philippines 114%
Global Avg 98%
China 95%
Country | Penetration
All major SEA countries are now all above the global average in mobile penetration
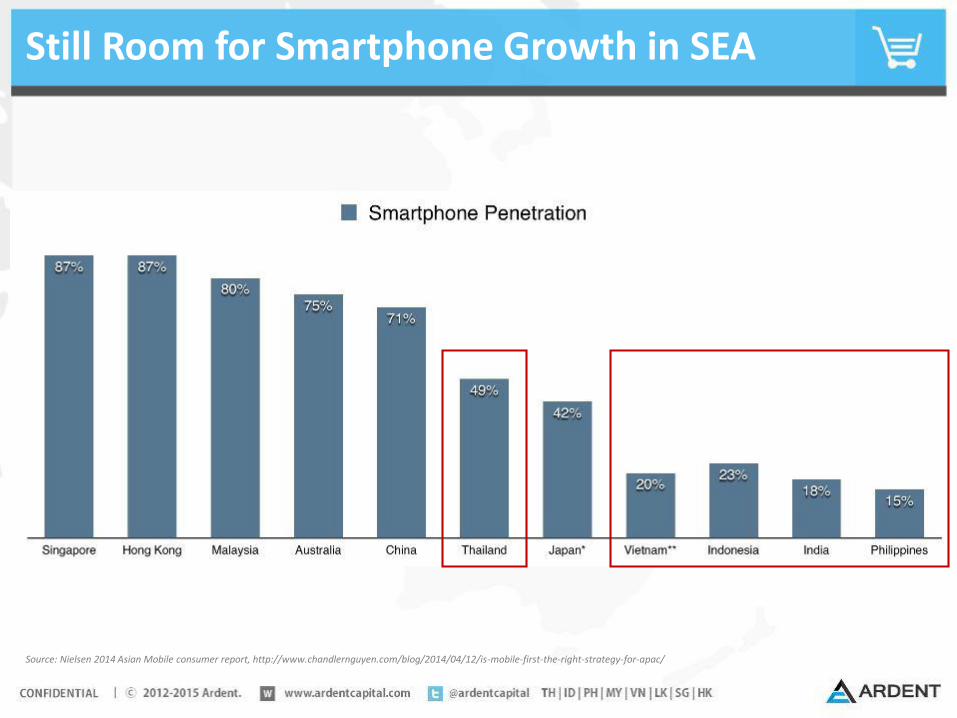
Still Room for Smartphone Growth in SEA
Source: Nielsen 2014 Asian Mobile consumer report, http://www.chandlernguyen.com/blog/2014/04/12/is-mobile-first-the-right-strategy-for-apac/
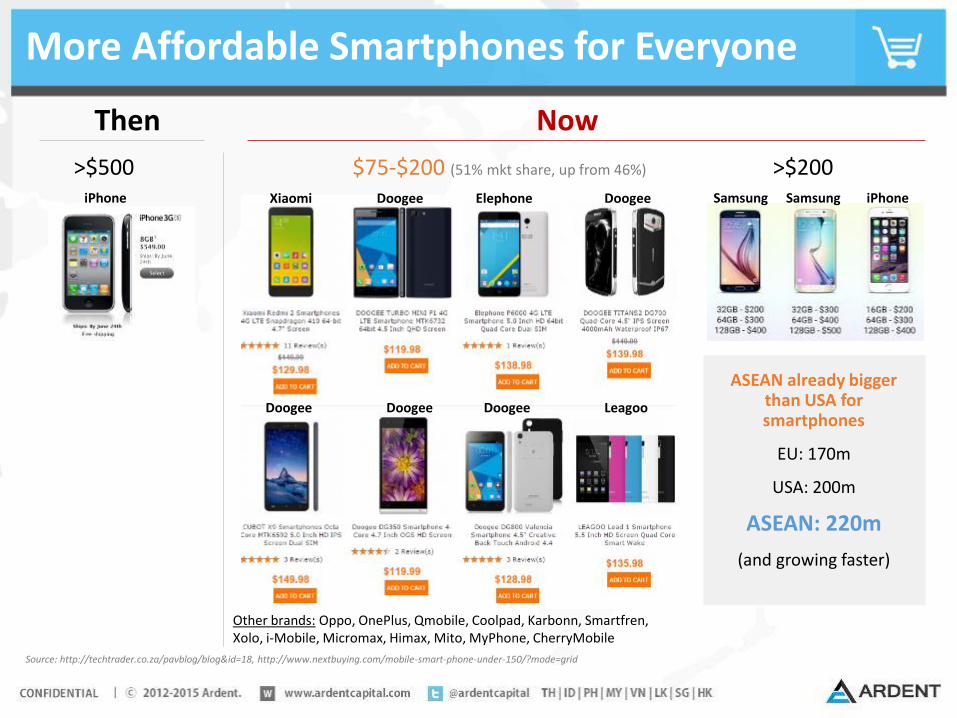
More Affordable Smartphones for Everyone
Source: http://techtrader.co.za/pavblog/blog&id=18, http://www.nextbuying.com/mobile-smart-phone-under-150/?mode=grid
Then Now
>$500 >$200$75-$200 (51% mkt share, up from 46%)
Xiaomi Doogee Elephone Doogee
LeagooDoogeeDoogeeDoogee
Samsung iPhoneSamsungiPhone
Other brands: Oppo, OnePlus, Qmobile, Coolpad, Karbonn, Smartfren, Xolo, i-Mobile, Micromax, Himax, Mito, MyPhone, CherryMobile
ASEAN already bigger than USA for smartphones
EU: 170m
USA: 200m
ASEAN: 220m
(and growing faster)

Mobile Operating System Market Share
Similar trend we see in Indonesia: 80% Android

Social Media Drives Internet Penetration in SEA
Active Internet Users to Total Population
Active Social Media Users to Total Population
Singapore 81% 91%
Malaysia 66% 56%
Thailand 54% 52%
Vietnam 45% 33%
Philippines 44% 42%
Indonesia 28% 29%
SEA Average 36% 34%
Global 42% 29%
Source: We Are Social Mar 2015 Report, Active internet users figure includes access via fixed and mobile connections, Active social media users represents active user accounts on the most active social platform in the country, not unique users
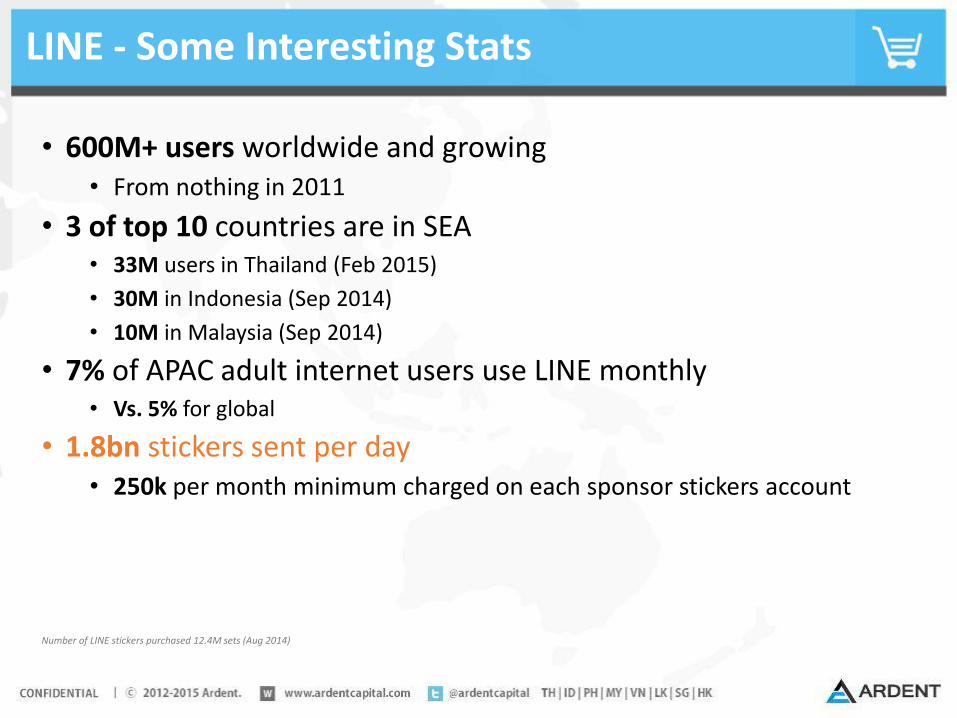
LINE - Some Interesting Stats
• 600M+ users worldwide and growing • From nothing in 2011
• 3 of top 10 countries are in SEA• 33M users in Thailand (Feb 2015)
• 30M in Indonesia (Sep 2014)
• 10M in Malaysia (Sep 2014)
• 7% of APAC adult internet users use LINE monthly• Vs. 5% for global
• 1.8bn stickers sent per day• 250k per month minimum charged on each sponsor stickers account
Number of LINE stickers purchased 12.4M sets (Aug 2014)

Facebook – Some Stats from Thailand
Source: Yozzo.com June 2015 report, Syndacast 2014
Thailand has the 3rd largest Facebook population in the world with 35 million users
Bangkok has more Facebook users than any other city in the world with 20 million
93% of Thai Internet users access Facebook every week, compared to 47% globally
19 million, access Facebook through their mobile device.

Mobile-First Behavior
44%56%
Global SEAMobile Shopping Desktop
Soure: Rocket Investor Presentation May 2015,
Lazada Traffic Overtime Online Shopping Source
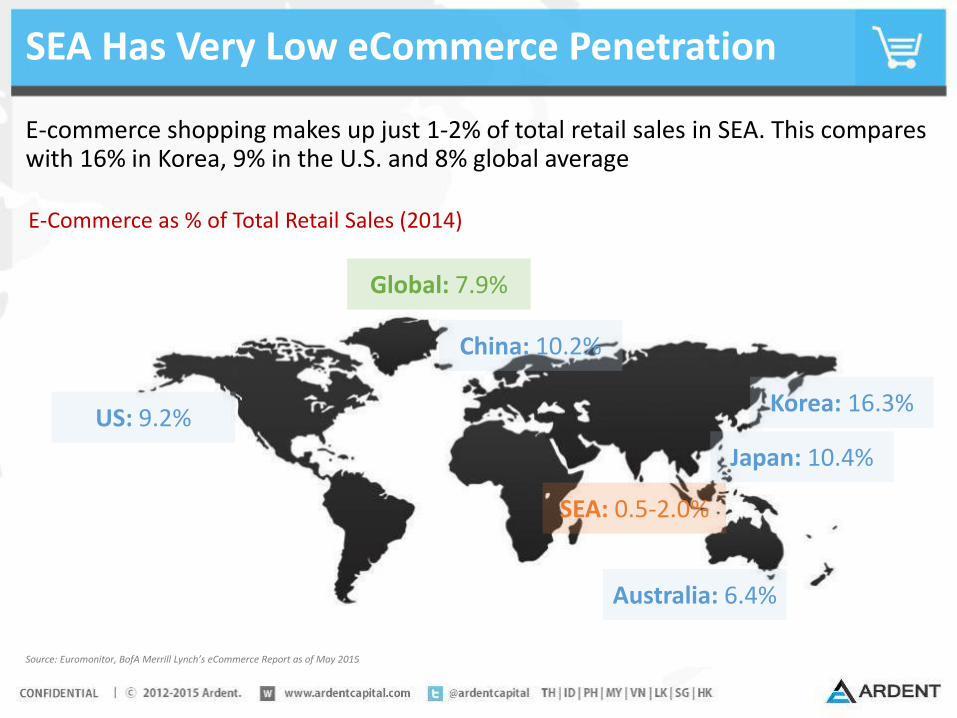
SEA Has Very Low eCommerce Penetration
E-commerce shopping makes up just 1-2% of total retail sales in SEA. This compares with 16% in Korea, 9% in the U.S. and 8% global average
Source: Euromonitor, BofA Merrill Lynch’s eCommerce Report as of May 2015
US: 9.2%Korea: 16.3%
Japan: 10.4%
Australia: 6.4%
Global: 7.9%
China: 10.2%
SEA: 0.5-2.0%
E-Commerce as % of Total Retail Sales (2014)
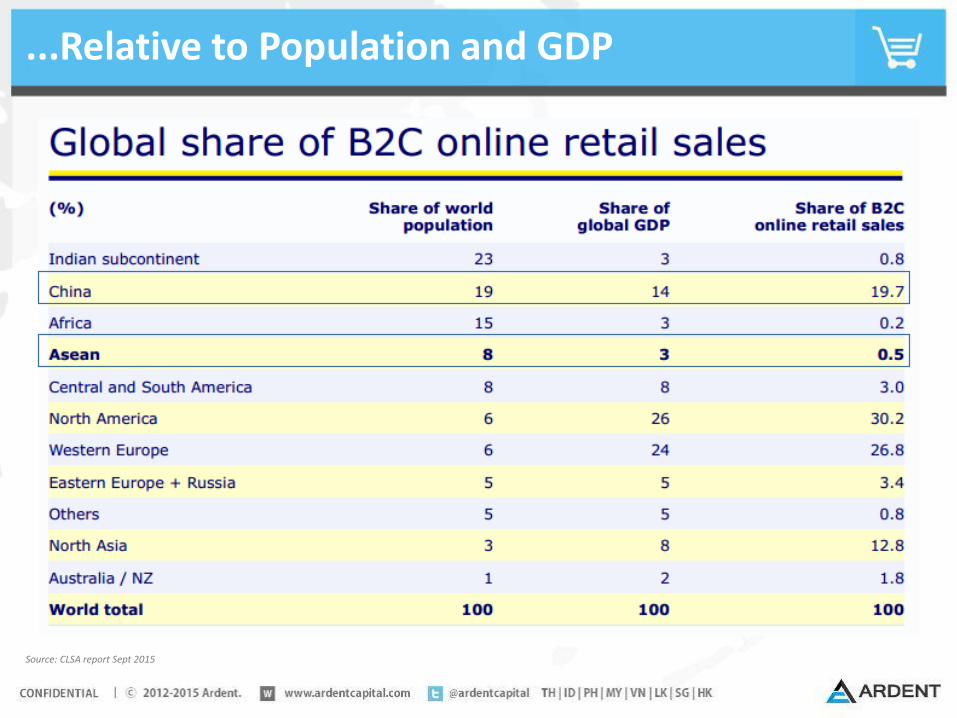
...Relative to Population and GDP
Source: CLSA report Sept 2015
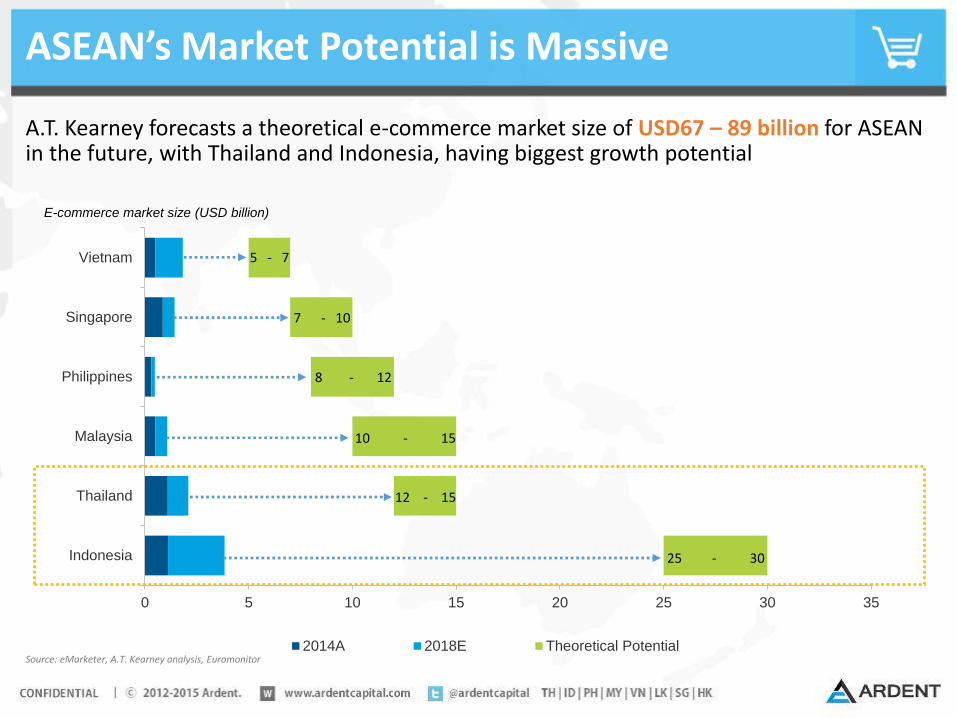
ASEAN’s Market Potential is Massive
Source: eMarketer, A.T. Kearney analysis, Euromonitor
0 5 10 15 20 25 30 35
Vietnam
Singapore
Philippines
Malaysia
Thailand
Indonesia
2014A 2018E Theoretical Potential
E-commerce market size (USD billion)
5 - 7
8 - 12
12 - 15
25 - 30
10 - 15
7 - 10
A.T. Kearney forecasts a theoretical e-commerce market size of USD67 – 89 billion for ASEAN in the future, with Thailand and Indonesia, having biggest growth potential
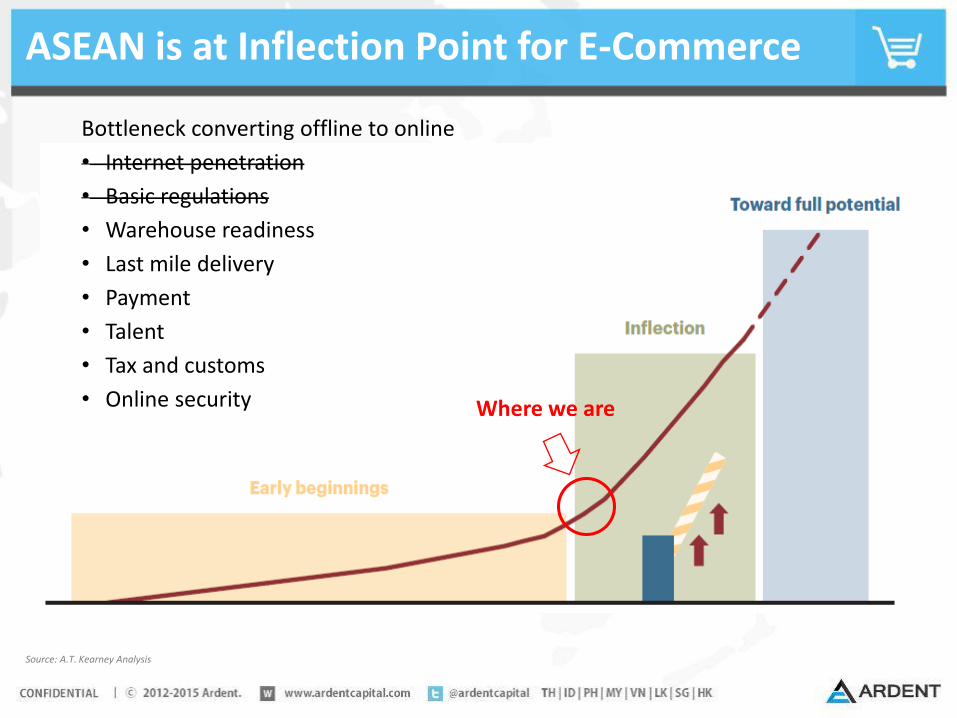
ASEAN is at Inflection Point for E-Commerce
Source: A.T. Kearney Analysis
Bottleneck converting offline to online
• Internet penetration
• Basic regulations
• Warehouse readiness
• Last mile delivery
• Payment
• Talent
• Tax and customs
• Online security Where we are

In Only 5 Years..
2010 2015
Internet Population 150M 225M
Internet Penetration 25% 36%
Social Platform FB, Hi5, BBM FB, LINE, Instagram, Twitter, Path
Mobile Choice Nokia, Blackberry Android, iPhone, BB
eCommerce Revenue 1Bn 7Bn
Payment Method Bank transfer Transfer, COD, Credit card, e-Wallet, e-banking
eCommerce Model B2C retail, C2C Forum B2C retail, B2C Marketplace, C2C Classified, B2B
Mobile Commerce 0% 30%
Source: We Are Social, Euromonitor, East Ventures, 2015

Digital Development in Global Perspective
Source: Digital Evolution Index, The Fletcher School at Tufts University, https://hbr.org/2015/02/where-the-digital-economy-is-moving-the-fastest
Potential to develop strong digital economies though overall score still
lowLow score currently and facing significant challenges to grow
High level of digital development and continue upward
Achieved high level but losing momentum
1
2
3
4
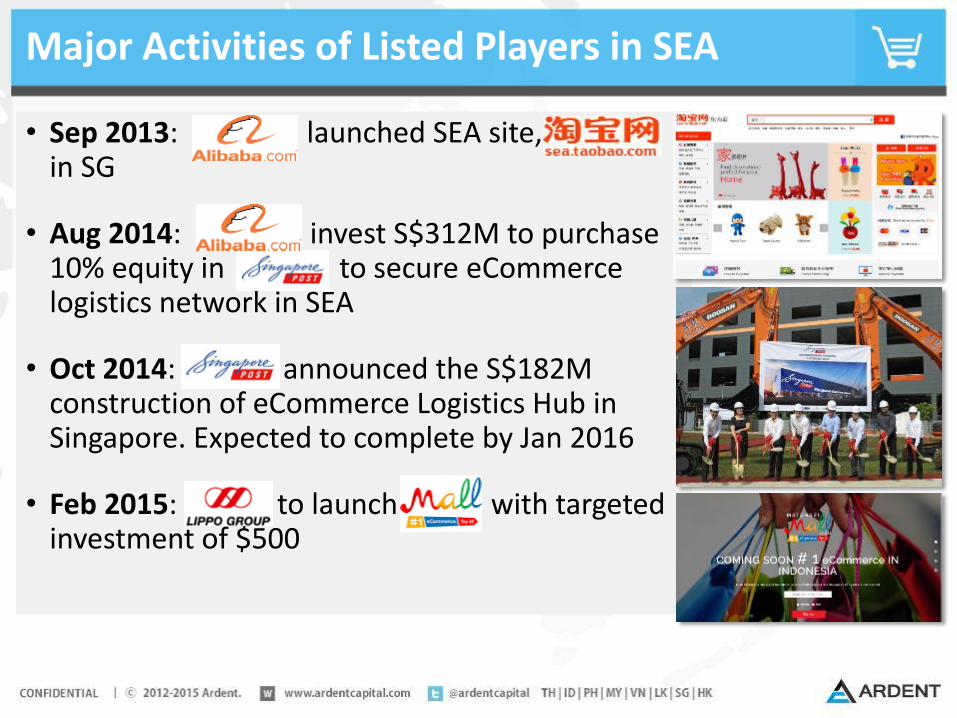
Major Activities of Listed Players in SEA
• Sep 2013: launched SEA site, in SG
• Aug 2014: invest S$312M to purchase 10% equity in to secure eCommercelogistics network in SEA
• Oct 2014: announced the S$182M construction of eCommerce Logistics Hub in Singapore. Expected to complete by Jan 2016
• Feb 2015: to launch with targeted investment of $500
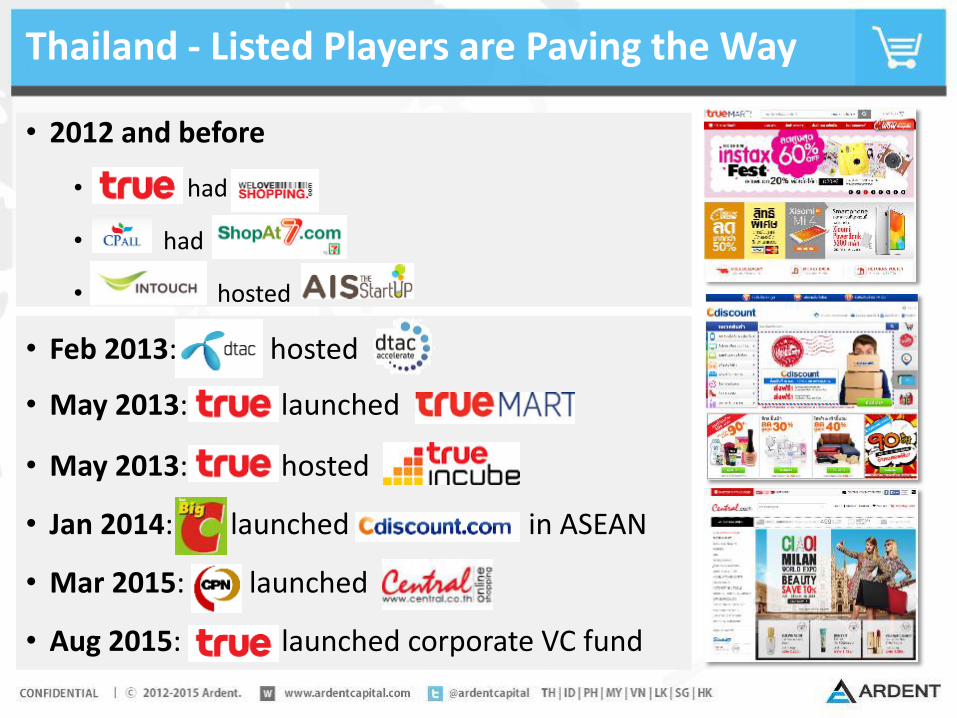
Thailand - Listed Players are Paving the Way
• 2012 and before
• had
• had
• hosted
• Feb 2013: hosted
• May 2013: launched
• May 2013: hosted
• Jan 2014: launched in ASEAN
• Mar 2015: launched
• Aug 2015: launched corporate VC fund
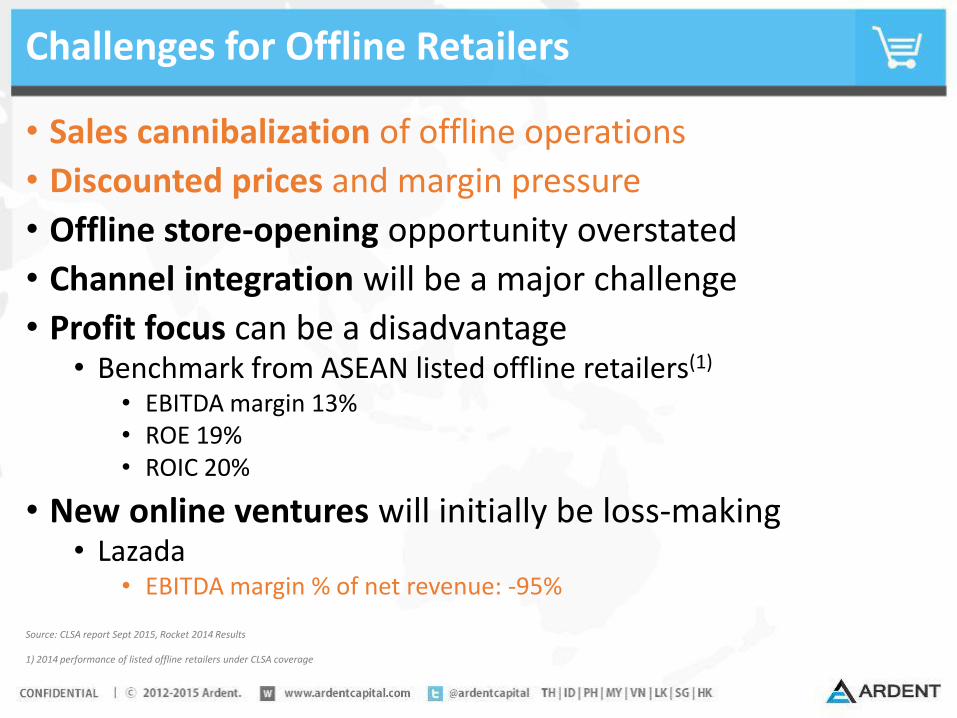
Challenges for Offline Retailers
• Sales cannibalization of offline operations
• Discounted prices and margin pressure
• Offline store-opening opportunity overstated
• Channel integration will be a major challenge
• Profit focus can be a disadvantage• Benchmark from ASEAN listed offline retailers(1)
• EBITDA margin 13%• ROE 19%• ROIC 20%
• New online ventures will initially be loss-making• Lazada
• EBITDA margin % of net revenue: -95%
Source: CLSA report Sept 2015, Rocket 2014 Results
1) 2014 performance of listed offline retailers under CLSA coverage
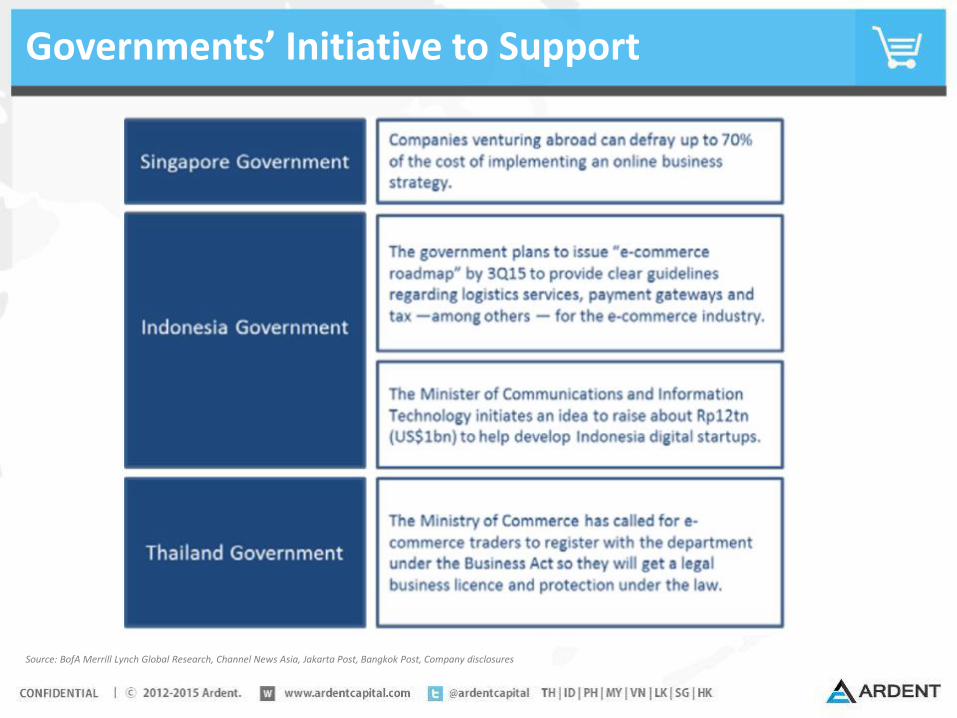
Governments’ Initiative to Support
Source: BofA Merrill Lynch Global Research, Channel News Asia, Jakarta Post, Bangkok Post, Company disclosures

SEA Tech Funding Has Reached Inflection Point
Investment by country
US$
M
924
5470
133
0
40
80
120
2010 2011 2012 2013 2014
Malaysia Thailand Philippines Indonesia Singapore Vietnam
Nu
mb
er
of
de
als
446 49 72
446
0
100
200
300
400
500
2010 2011 2012 2013 2014
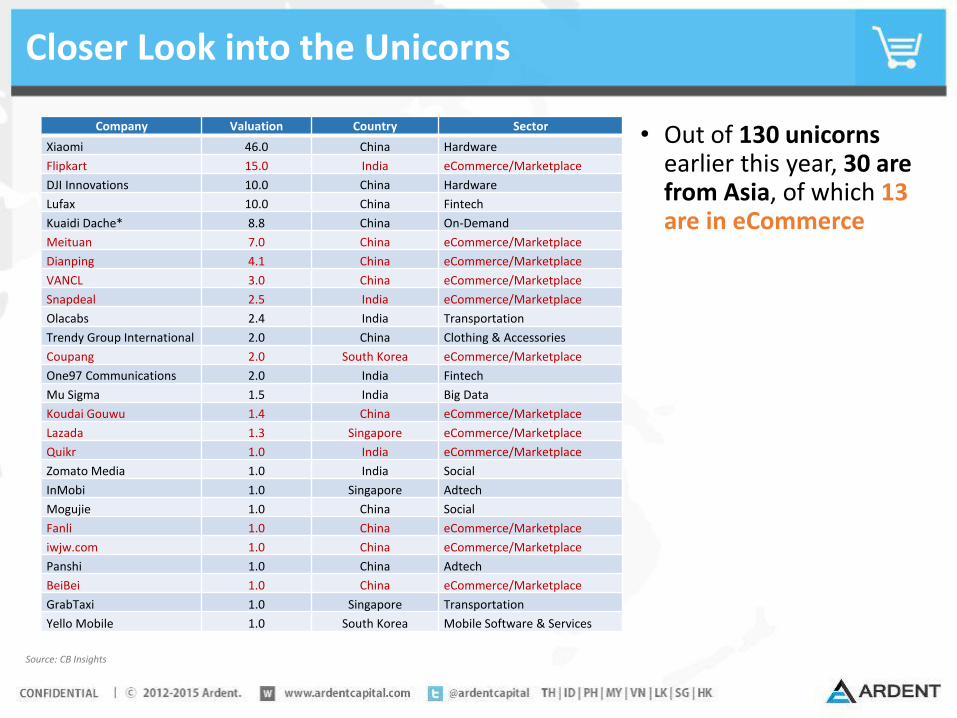
Closer Look into the Unicorns
Source: CB Insights
• Out of 130 unicorns earlier this year, 30 are from Asia, of which 13 are in eCommerce
• aCommerce (US$10.7M)
• Luxola (US$10M)
Company Valuation Country Sector
Xiaomi 46.0 China Hardware
Flipkart 15.0 India eCommerce/Marketplace
DJI Innovations 10.0 China Hardware
Lufax 10.0 China Fintech
Kuaidi Dache* 8.8 China On-Demand
Meituan 7.0 China eCommerce/Marketplace
Dianping 4.1 China eCommerce/Marketplace
VANCL 3.0 China eCommerce/Marketplace
Snapdeal 2.5 India eCommerce/Marketplace
Olacabs 2.4 India Transportation
Trendy Group International 2.0 China Clothing & Accessories
Coupang 2.0 South Korea eCommerce/Marketplace
One97 Communications 2.0 India Fintech
Mu Sigma 1.5 India Big Data
Koudai Gouwu 1.4 China eCommerce/Marketplace
Lazada 1.3 Singapore eCommerce/Marketplace
Quikr 1.0 India eCommerce/Marketplace
Zomato Media 1.0 India Social
InMobi 1.0 Singapore Adtech
Mogujie 1.0 China Social
Fanli 1.0 China eCommerce/Marketplace
iwjw.com 1.0 China eCommerce/Marketplace
Panshi 1.0 China Adtech
BeiBei 1.0 China eCommerce/Marketplace
GrabTaxi 1.0 Singapore Transportation
Yello Mobile 1.0 South Korea Mobile Software & Services
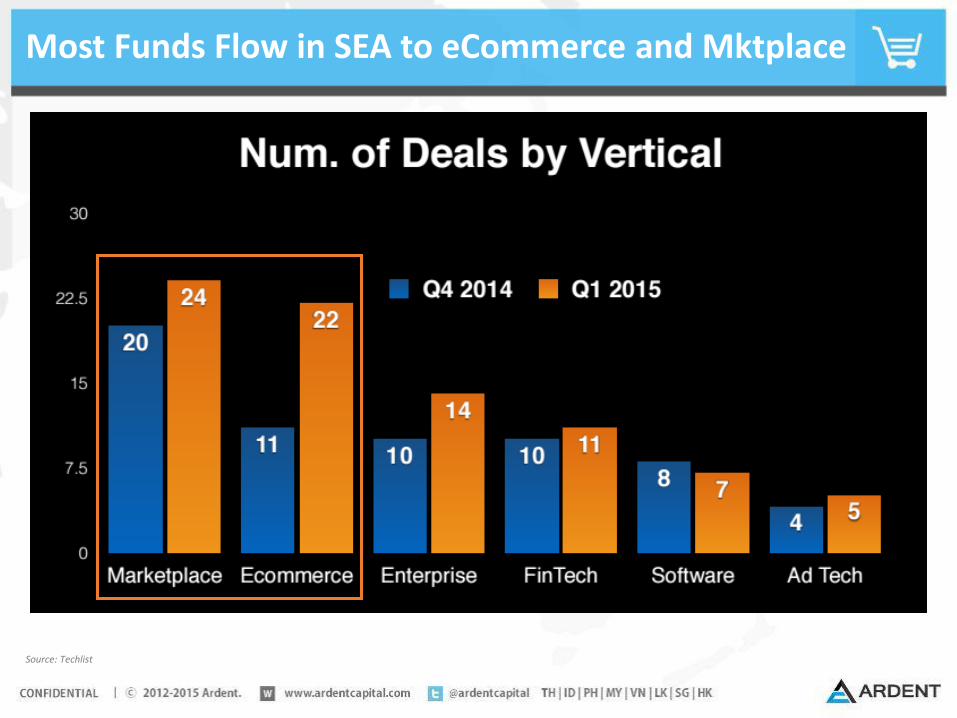
Most Funds Flow in SEA to eCommerce and Mktplace
Source: Techlist
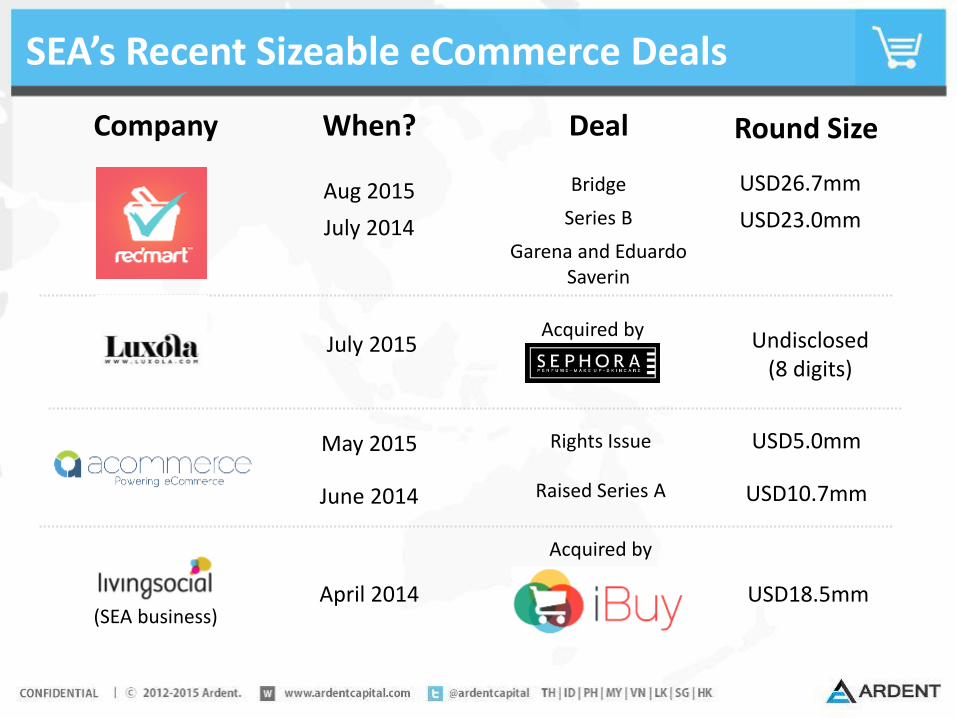
SEA’s Recent Sizeable eCommerce Deals
Company When? Deal
April 2014 USD18.5mm
Aug 2015
July 2014
USD26.7mm
USD23.0mm
Acquired by
Bridge
Series B
Garena and Eduardo Saverin
May 2015
June 2014
USD5.0mm
USD10.7mm
Rights Issue
Raised Series A
July 2015
(SEA business)
Round Size
Undisclosed (8 digits)
Acquired by
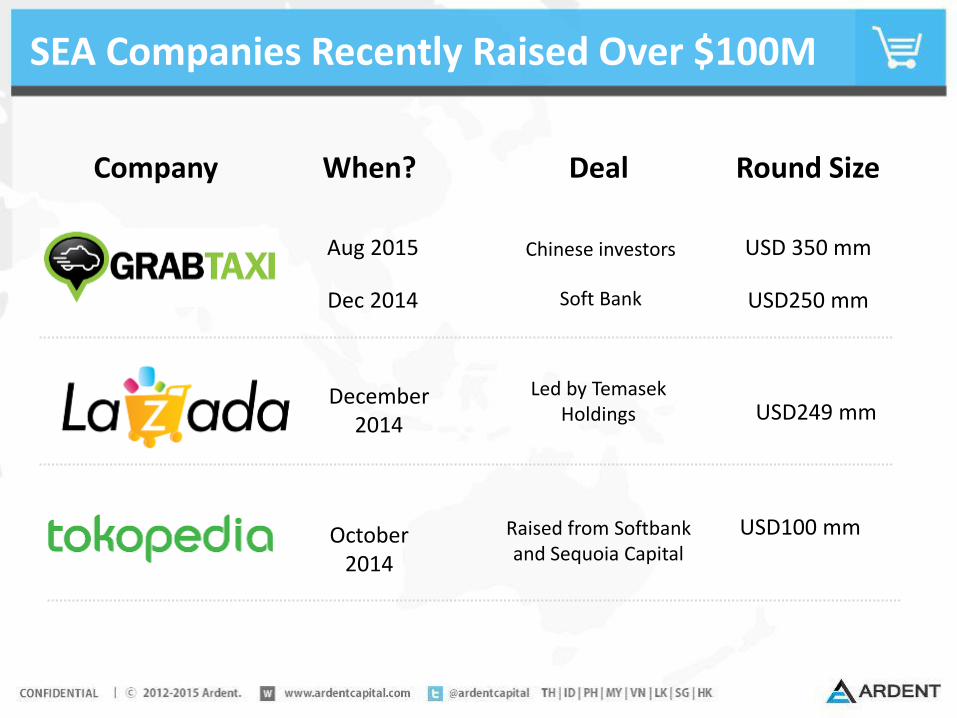
SEA Companies Recently Raised Over $100M
Company When? Deal Round Size
October 2014
USD100 mmRaised from Softbank and Sequoia Capital
Aug 2015
Dec 2014
USD 350 mm
USD250 mm
Chinese investors
Soft Bank
December 2014
USD249 mmLed by Temasek
Holdings
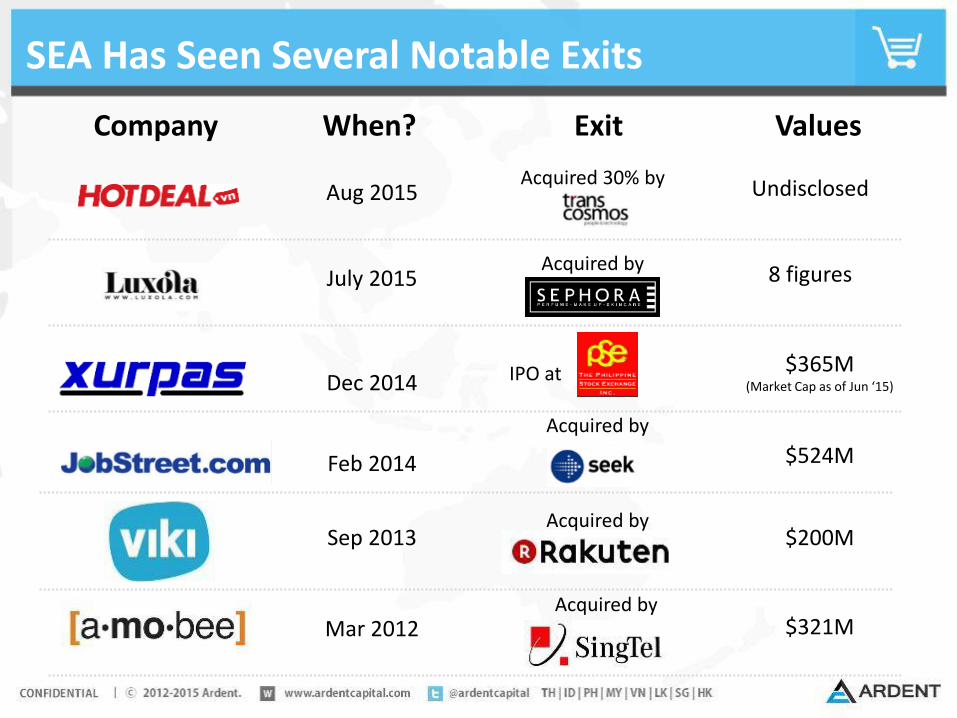
SEA Has Seen Several Notable Exits
Company When? Exit Values
Sep 2013 $200M
Mar 2012 $321M
Acquired by
Acquired by
Feb 2014
Acquired by
$524M
Dec 2014 IPO at $365M(Market Cap as of Jun ‘15)
July 2015 8 figuresAcquired by
Aug 2015 UndisclosedAcquired 30% by

Next?
2015 2020
Internet Population 225M 360
Internet Penetration 36% 62%
Social Platform FB, LINE, Instagram, Twitter, Path ?
Mobile Choice Android, iPhone, BB +Xiaomis and alike?
eCommerce Revenue 7Bn 70Bn
Payment Method Transfer, COD, Credit card, e-Wallet, e-banking+Fin tech, on-demand,
social discovery?eCommerce Model B2C, C2C, B2B
Mobile Commerce 30% >50%

Summary
• BIG: bigger than US (2x), bigger than EU
• Young and rich: much younger population than US and EU and becoming richer
• Internet focused: more time spent on the internet than other media
• Mobile: well over 100% penetration in most markets
• Social: everyone is on social media (Facebook, LINE)
• Growing fast: eCommerce CAGR 2011-2014 is 25.1%
• Inflection point: both eCommerce and funding in the region is growing ever faster than before
• Less competition: not (yet) dominated by global players
• Capital available: funding available from seed to growth

Thank You
Twitter: @ardentcapital
Visit us at www.ardentcapital.com
Adrian Vanzyl
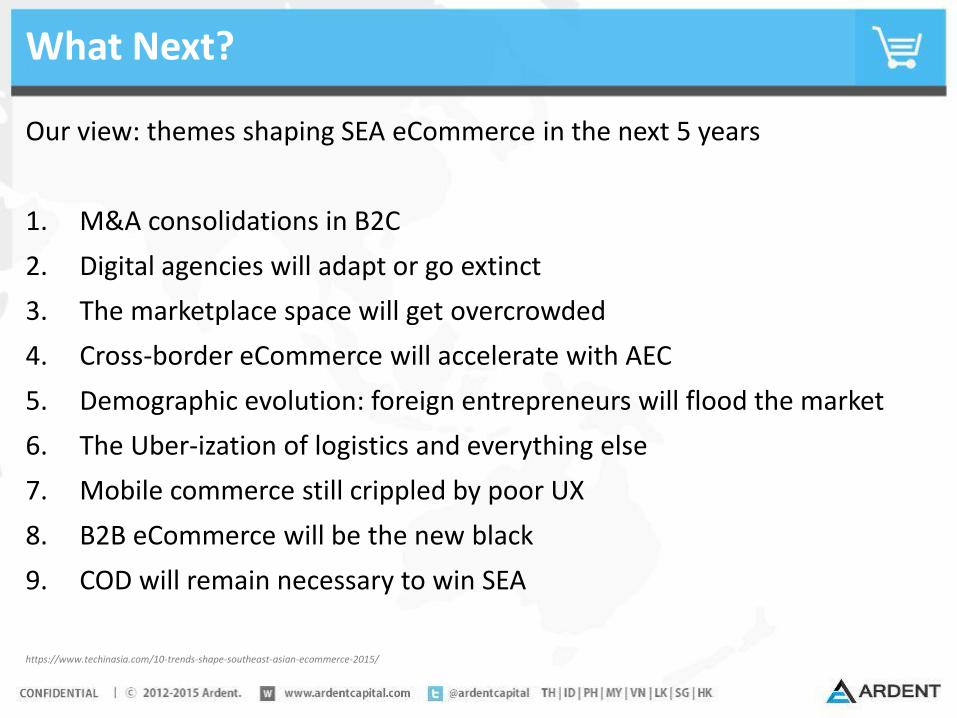
What Next?
Our view: themes shaping SEA eCommerce in the next 5 years
1. M&A consolidations in B2C
2. Digital agencies will adapt or go extinct
3. The marketplace space will get overcrowded
4. Cross-border eCommerce will accelerate with AEC
5. Demographic evolution: foreign entrepreneurs will flood the market
6. The Uber-ization of logistics and everything else
7. Mobile commerce still crippled by poor UX
8. B2B eCommerce will be the new black
9. COD will remain necessary to win SEA
https://www.techinasia.com/10-trends-shape-southeast-asian-ecommerce-2015/
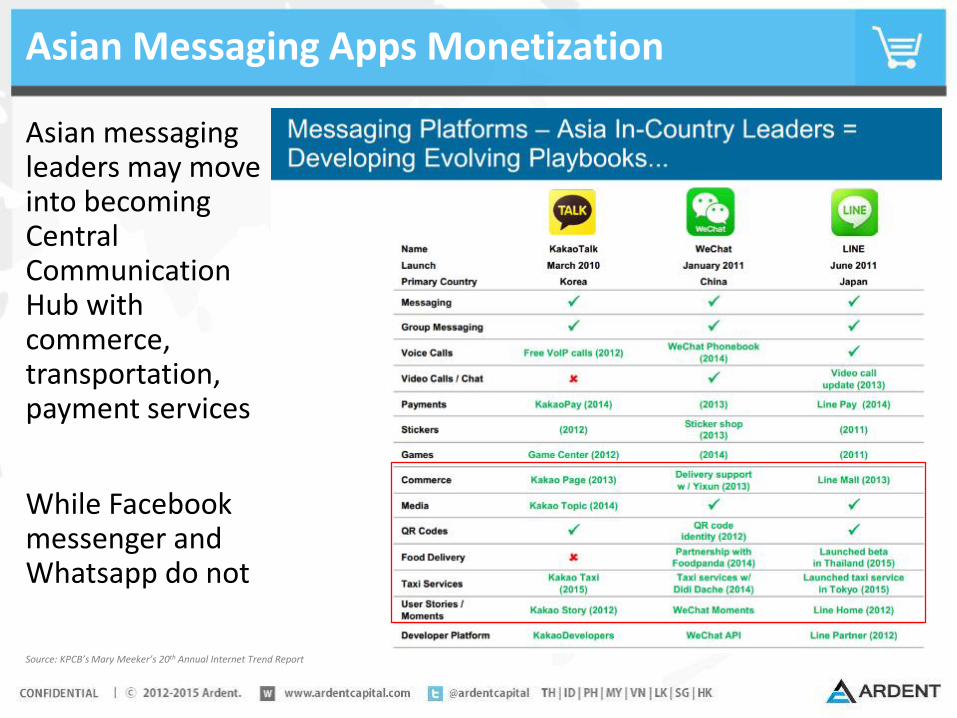
Asian Messaging Apps Monetization
Asian messaging leaders may move into becoming Central Communication Hub with commerce, transportation, payment services
While Facebook messenger and Whatsapp do not
Source: KPCB’s Mary Meeker’s 20th Annual Internet Trend Report
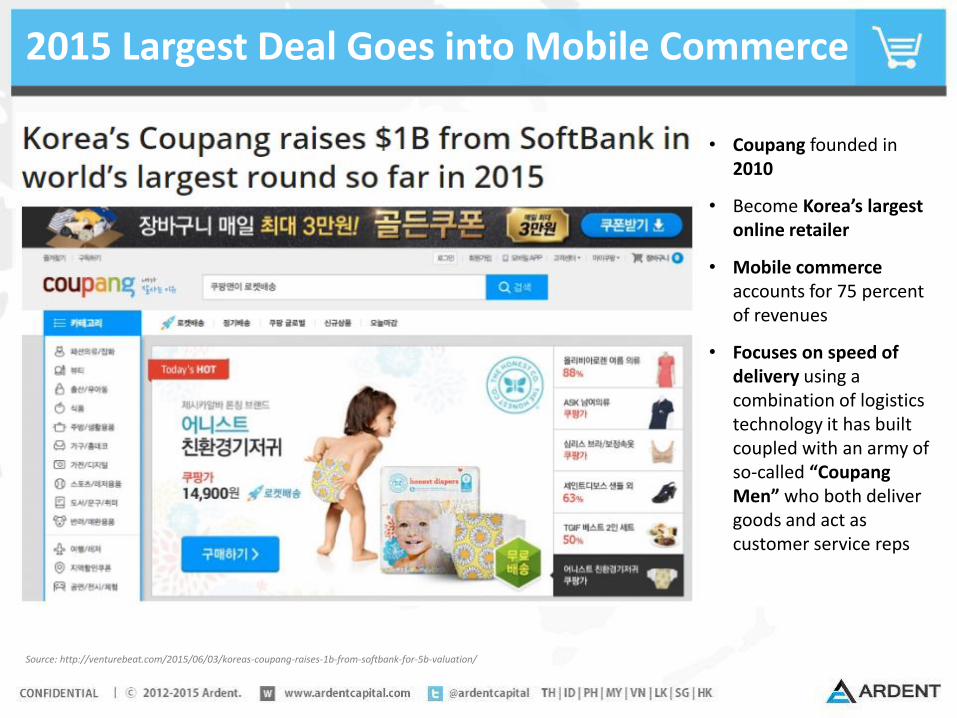
2015 Largest Deal Goes into Mobile Commerce
• Coupang founded in 2010
• Become Korea’s largest online retailer
• Mobile commerceaccounts for 75 percent of revenues
• Focuses on speed of delivery using a combination of logistics technology it has built coupled with an army of so-called “CoupangMen” who both deliver goods and act as customer service reps
Source: http://venturebeat.com/2015/06/03/koreas-coupang-raises-1b-from-softbank-for-5b-valuation/
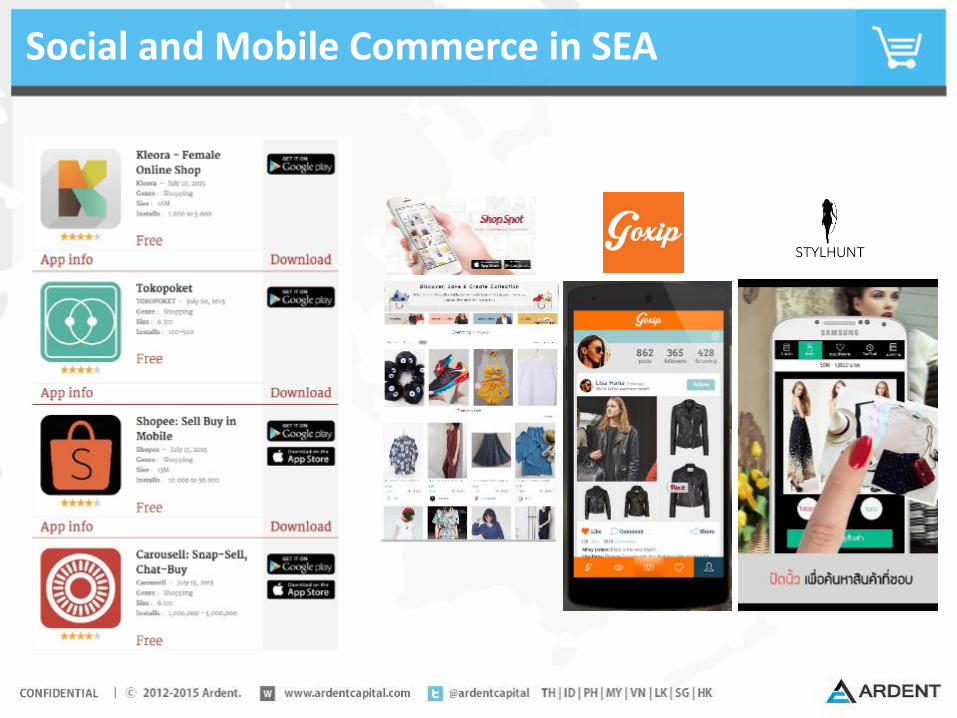
Social and Mobile Commerce in SEA

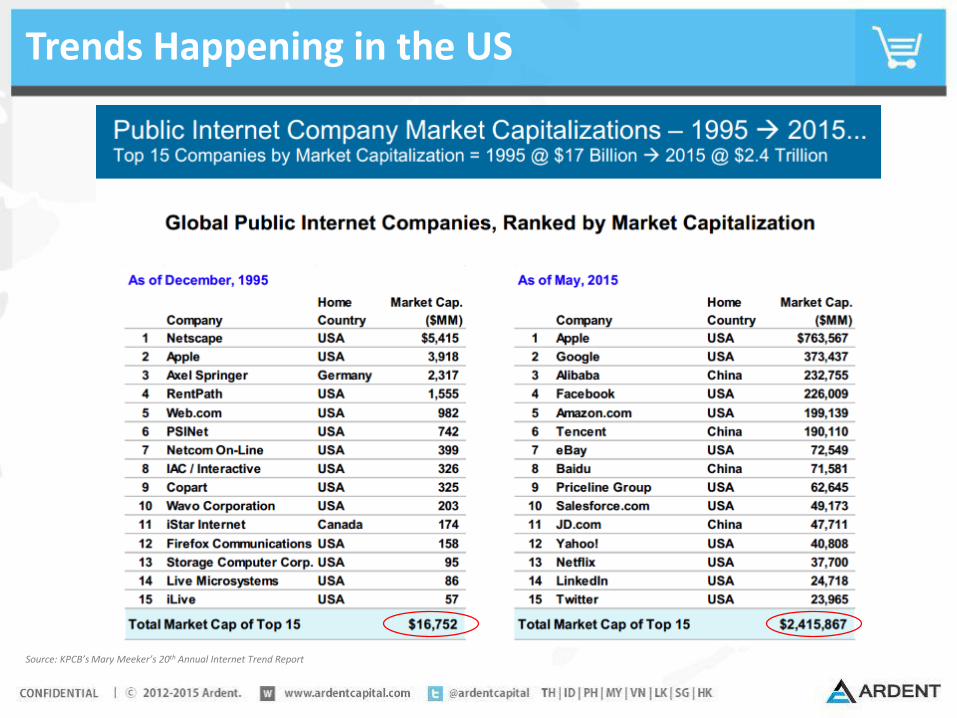
Trends Happening in the US
Sharing economy: marketplace + on-demand fulfilment for everything?
Source: KPCB’s Mary Meeker’s 20th Annual Internet Trend Report
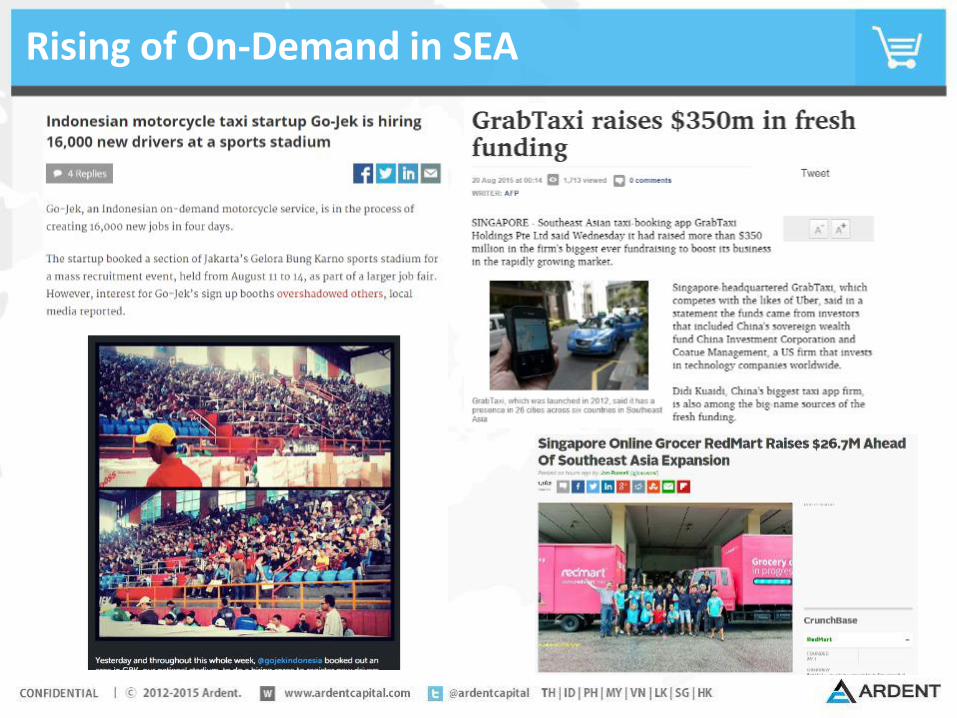
Rising of On-Demand in SEA
Trends Happening in the US
Source: KPCB’s Mary Meeker’s 20th Annual Internet Trend Report