An Experimental Evaluation of the Reliability of LoRa … of Actuator Networks Sensor and Article An...
19
Journal of Actuator Networks Sensor and Article An Experimental Evaluation of the Reliability of LoRa Long-Range Low-Power Wireless Communication Marco Cattani *, Carlo Alberto Boano and Kay Römer Institute for Technical Informatics, Graz University of Technology, Graz 8010, Austria; [email protected] (C.A.B.); [email protected] (K.R.) * Correspondence: [email protected]; Tel.: +43-316-873-6910 Received: 22 May 2017; Accepted: 9 June 2017; Published: 15 June 2017 Abstract: Recent technological innovations allow compact radios to transmit over long distances with minimal energy consumption and could drastically affect the way Internet of Things (IoT) technologies communicate in the near future. By extending the communication range of links, it is indeed possible to reduce the network diameter to a point that each node can communicate with almost every other node in the network directly. This drastically simplifies communication, removing the need of routing, and significantly reduces the overhead of data collection. Long-range low-power wireless technology, however, is still at its infancy, and it is yet unclear (i) whether it is sufficiently reliable to complement existing short-range and cellular technologies and (ii) which radio settings can sustain a high delivery rate while maximizing energy-efficiency. To shed light on this matter, this paper presents an extensive experimental study of the reliability of LoRa , one of the most promising long-range low-power wireless technologies to date. We focus our evaluation on the impact of physical layer settings on the effective data rate and energy efficiency of communications. Our results show that it is often not worth tuning parameters, thereby reducing the data rate in order to maximize the probability of successful reception, especially on links at the edge of their communication range. Furthermore, we study the impact of environmental factors on the performance of LoRa, and show that higher temperatures significantly decrease the received signal strength and may drastically affect packet reception. Keywords: LoRa; long-range technology; environmental impact; temperature; link quality; outdoor; underground; indoor; energy-efficiency; reliability 1. Introduction An increasing number of radio technologies enabling low-power wireless communication over long distances has emerged in the past years. Ultra-narrowband technologies such as Sigfox (Labège, France) and Weightless-N [1] (Cambridge, UK), as well as spread-spectrum technologies such as LoRa [2] (San Ramon, CA, USA), allow for communicating up to few kilometers, and to build up low-power wide area networks (LPWANs) that do not require the construction and maintenance of complex multi-hop topologies [3,4]. A key characteristic of LPWAN technologies is indeed the ability to trade throughput for range and vice versa, i.e., one has the ability to fine-tune physical layer (PHY) settings to select a more sensitive (but slow) configuration that allows communication over a longer distance. This flexibility makes LPWAN technologies particularly appealing to developers of Internet of Things (IoT) applications requiring long-range communications with relatively low data rates. At the same time, however, the ability to fine-tune PHY settings requires a thorough understanding of their impact on network performance, especially on the reliability and energy-efficiency of communications [5]. The research community has recently devoted significant attention to the role of PHY settings in the context of LPWANs [5–7], especially LoRa technology. Out of the existing LPWAN technologies, J. Sens. Actuator Netw. 2017, 6, 7; doi:10.3390/jsan6020007 www.mdpi.com/journal/jsan
Transcript of An Experimental Evaluation of the Reliability of LoRa … of Actuator Networks Sensor and Article An...
Journal of
Actuator NetworksSensor and
Article
An Experimental Evaluation of the Reliability of LoRaLong-Range Low-Power Wireless Communication
Marco Cattani *, Carlo Alberto Boano and Kay RömerInstitute for Technical Informatics, Graz University of Technology, Graz 8010, Austria;[email protected] (C.A.B.); [email protected] (K.R.)* Correspondence: [email protected]; Tel.: +43-316-873-6910
Received: 22 May 2017; Accepted: 9 June 2017; Published: 15 June 2017
Abstract: Recent technological innovations allow compact radios to transmit over long distanceswith minimal energy consumption and could drastically affect the way Internet of Things (IoT)technologies communicate in the near future. By extending the communication range of links, it isindeed possible to reduce the network diameter to a point that each node can communicate withalmost every other node in the network directly. This drastically simplifies communication, removingthe need of routing, and significantly reduces the overhead of data collection. Long-range low-powerwireless technology, however, is still at its infancy, and it is yet unclear (i) whether it is sufficientlyreliable to complement existing short-range and cellular technologies and (ii) which radio settingscan sustain a high delivery rate while maximizing energy-efficiency. To shed light on this matter, thispaper presents an extensive experimental study of the reliability of LoRa , one of the most promisinglong-range low-power wireless technologies to date. We focus our evaluation on the impact ofphysical layer settings on the effective data rate and energy efficiency of communications. Our resultsshow that it is often not worth tuning parameters, thereby reducing the data rate in order to maximizethe probability of successful reception, especially on links at the edge of their communication range.Furthermore, we study the impact of environmental factors on the performance of LoRa, and showthat higher temperatures significantly decrease the received signal strength and may drastically affectpacket reception.
Keywords: LoRa; long-range technology; environmental impact; temperature; link quality; outdoor;underground; indoor; energy-efficiency; reliability
1. Introduction
An increasing number of radio technologies enabling low-power wireless communication overlong distances has emerged in the past years. Ultra-narrowband technologies such as Sigfox (Labège,France) and Weightless-N [1] (Cambridge, UK), as well as spread-spectrum technologies such asLoRa [2] (San Ramon, CA, USA), allow for communicating up to few kilometers, and to build uplow-power wide area networks (LPWANs) that do not require the construction and maintenance ofcomplex multi-hop topologies [3,4].
A key characteristic of LPWAN technologies is indeed the ability to trade throughput for range andvice versa, i.e., one has the ability to fine-tune physical layer (PHY) settings to select a more sensitive(but slow) configuration that allows communication over a longer distance. This flexibility makesLPWAN technologies particularly appealing to developers of Internet of Things (IoT) applicationsrequiring long-range communications with relatively low data rates. At the same time, however,the ability to fine-tune PHY settings requires a thorough understanding of their impact on networkperformance, especially on the reliability and energy-efficiency of communications [5].
The research community has recently devoted significant attention to the role of PHY settings inthe context of LPWANs [5–7], especially LoRa technology. Out of the existing LPWAN technologies,
J. Sens. Actuator Netw. 2017, 6, 7; doi:10.3390/jsan6020007 www.mdpi.com/journal/jsan
J. Sens. Actuator Netw. 2017, 6, 7 2 of 19
LoRa has especially attracted a large body of work due to the availability of commercial off-the-shelfradio transceiver and platforms [8–10], as well as its ability to operate in an infrastructure-freemanner and to build up ad hoc mesh networks [5]). LoRa-based networks have been deployedin several settings, ranging from indoor [4] and urban [7] environments, to maritime [11] and mountainscenarios [12]. These deployments have shown the impact of PHY settings on connectivity range andsensitivity [5,13], as well as having given a first impression of the packet reception ratio that can beachieved at different distances with different hardware platforms and physical layer configurations.Bor et al. [14] have also shown through simulation that the choice of the PHY settings affects the numberof LoRa nodes that can concurrently access the channel, which has an impact on the scalability of LoRanetworks. Furthermore, Bor and Roedig [4] have presented the results of systematic indoor experimentsshowing that the set of LoRa settings leading to the most energy-efficient operation dynamicallychanges over time. Based on these results, the authors proposed a protocol that periodically probesdifferent settings and that dynamically picks the ones minimizing energy consumption at run-time.
Interplay between PHY settings and link quality. Although the aforementioned works startedto shed light on how to carry out an optimal selection of LoRa’s PHY settings, they all share acommon assumption: the best performance is obtained in the presence of highly reliable links. Mostworks, indeed, specifically target PHY settings maximizing the link quality, i.e., focus on selectingphysical layer configurations that allow to sustain a packet reception ratio of 90% or higher [4,12,14]This practice is likely influenced from the behavior of non opportunistic low-power wireless datacollection protocols for IEEE 802.15.4 radios, which favor high-quality links to intermediate andlossy ones [15,16]. However, adjusting the PHY settings of the radio to maximize the link quality hasimportant implications w.r.t. energy efficiency when using long-range low-power wireless technologiessuch as LoRa. Maximizing the link quality, indeed, typically implies an increase in the transmissionpower and data overhead, and the selection of a more sensitive (and hence slow) physical layerconfiguration. As a result, one increases not only the likelihood to receive packets, but also the energyconsumption of the radio, due to the higher transmission power, and the radio-on time, due to largerPHY layer overhead. This observation raises a yet unanswered question: is it worth selecting PHYsettings to reduce the data rate in order to increase the link quality? This question is particularly relevantwhen two nodes are at the edge of the communication range: should one select a setting that reducesthe data rate to increase the robustness of communication (and aim for a link achieving a high packetreception ratio) or rather accept having a link of intermediate quality (i.e., experiencing some packetloss), but with high data rate, and implement a re-transmission scheme on top? How this choice affectsthe energy-efficiency of the network still needs to be investigated.
Impact of environmental conditions on communication performance. The characteristics ofLPWANs make them suitable for outdoor deployments on a large scale, and it is hence important tostudy in detail the impact of environmental effects such as changes in meteorological conditions, as well asvariations in temperature and humidity on network performance. Unfortunately, to date, there is still littleunderstanding about the impact of the environment on the reliability of LoRa communication, especiallyfor links that are at the edge of their communication range. Iova et al. [12] have reported the vulnerability ofLoRa communications to environmental factors such as presence of vegetation and temperature variations,but without quantifying their impact. Other works in the low-power wireless community have shownthat some IEEE 802.15.4 radios are particularly vulnerable to changes in temperature, and that eventhe daily fluctuations recorded outdoors can render a good link useless [17–20]. However, these resultsare platform-specific and cannot be generalized to LoRa transceivers. Therefore, if and how muchtemperature affects LoRa’s communication performance is yet to be answered.
Our contributions. In this paper, we carry out an experimental evaluation of the reliability ofLoRa in different settings and provide an answer to the aforementioned open questions. First, we studyhow PHY settings and environmental factors affect the reliability of LoRa communications through anextensive experimental campaign indoor, outdoor, and underground. In line with earlier works [7],our experiments show that PHY settings have a significant impact on packet reception rate and that

J. Sens. Actuator Netw. 2017, 6, 7 3 of 19
indoor environments are more challenging for LoRa communications. Our results also suggest that itis better to use faster (but more fragile) settings together with a re-transmission mechanism rather thenselecting resilient and slower settings, maximizing packet reception rate and link quality. A detailedstudy of the overhead of each PHY setting in relation to its improvement on packet reception rateindeed shows that setting a maximizing data rate and minimizing range should be preferred.
Furthermore, our experimental results show a clear correlation between temperature, humidity,packet reception rate, and received signal strength. We hence analyze in depth how environmentalfactors such as temperature variations affect the reliability of LoRa communications by performing a seriesof systematic experiments in controlled settings on different hardware platforms. These experimentsshow that the reliability of LoRa drastically decreases at high temperatures. On the one hand, the signalstrength of received packets decreases linearly when temperature increases, as was also observedfor a number of IEEE 802.15.4 radios [17,18]. On the other hand, the decrease in signal strength cansignificantly affect LoRa links that are at the edge of the communication range, increasing packetcorruption and loss up to a point in which a link is totally compromised.
The contributions of this paper are hence threefold:
• We study how PHY settings and environmental factors affect the reliability of LoRa through anextensive experimental campaign indoor, outdoor, and underground;
• We analyze the impact of LoRa’s PHY settings on the effective data rate and energy efficiencyof communications, highlighting that it is not worth selecting settings to reduce the data rate inorder to increase the link quality;
• We systematically study the impact of temperature on the reliability of LoRa communications andshow that high temperatures decrease the received signal strength and drastically increase packetloss and corruption for nodes at the edge of the communication range.
The paper proceeds as follows. In the next section, we introduce the reader to long-rangetechnologies and to the LoRa physical layer settings that can be configured to fine-tune the operationsof LoRa transceivers. Section 3 highlights the yet open questions with respect to LoRa’s reliability as afunction of PHY settings and environmental conditions. In Section 4, we describe our experimentsindoor, outdoor, and underground, highlighting the strong impact of the chosen PHY settings andenvironmental conditions on the reliability of communications. Thereafter, we investigate in detail theinterplay between PHY settings and link quality in Section 5 and carry out experiments in controlledsettings to quantify the impact of temperature on LoRa’s communication performance in Section 6.We finally summarize our contributions in Section 7, along with a discussion of future work.
2. Primer on LPWANs and LoRa
Low-power wide area networks complement short range wireless technologies such as Wi-Fi,Bluetooth Low Energy, and IEEE 802.15.4, and represent an interesting alternative to cellular technologiesfor urban-scale IoT applications. The success of LPWANs is due to their ability of providinglong-range communication to thousands of devices at minimal cost and limited energy expenditure.Longer communication ranges allow for drastically simplifying duty cycling and networking protocol,as LPWANs can form star topologies where the low-power end devices are able to directly communicatewith a more powerful orchestrator. This also allows for designing asymmetric communication schemesand to shift the load to the more powerful central device.
In order to increase the communication range, LPWAN technologies must improve thesignal-to-noise ratio (SNR) at the receiver, either by narrowing down the receiver’s bandwidth(reducing the receiver’s noise-floor) or by spreading the energy of the signal over a wider freuency band(effectively reducing the spectral power density of the signal) [5]. NB-IoT [21] and Weightless-P [22],for example, encode the signal in low bandwidth (<25 kHz) to reduce the noise level and keep thetransceiver design as simple and cheap as possible. Sigfox [23] and Weightless-N [24] further narrowthe signal into ultra-narrow bands as narrow as 100 Hz, further reducing the perceived noise.

J. Sens. Actuator Netw. 2017, 6, 7 4 of 19
LoRa technology. Compared to these technologies, LoRa spreads the signal over a widerfrequency band, and is more resilient to jamming and interference. LoRa is a proprietary LPWANtechnology from Semtech (Camarillo, CA, USA) that recently attracted significant attention due to itsability to trade efficiently communication range against high data-rates, thus enabling IoT applicationsat an urban scale. The core of LoRa technology is its Chirp Spread Spectrum (CSS) modulation: thecarrier signal of LoRa consists of chirps, signals whose frequency increases or decreases over time.LoRa’s chirps allow the signal to travel long distances and to be demodulated even when its poweris up to 20 dB lower than the noise floor. Because of this aspect, carrier sensing in LoRa is quitechallenging: LoRa radios allow carrier detection via a CAD mode, a special reception state consuminghalf of the energy compared to the normal reception mode. However, the signals produced by differentLoRa networks operating on different settings could create interference leading to false detections [7].
LoRa’s communication performance can be fine-tuned by varying the selection of several PHYsettings, including bandwidth, spreading factor, coding rate, transmission power, and carrier frequency,as summarized in Table 1. We explain next in detail the impact of each PHY parameters on data rate,receiver sensitivity (including resilience to interference), transmission range, and energy-efficiency [25].
Table 1. Summary of LoRa’s configurable settings and their impact on communication performance.
Setting Values Effects
Bandwidth 125 . . . 500 kHz Higher bandwidths allow for transmitting packets at higher data rates(1 kHz = 1 kcps), but reduce receiver sensitivity and communication range.
Spreading Factor 26 . . . 212 chipssymbol
Bigger spreading factors increase the signal-to-noise ratio and hence radiosensitivity, augmenting the communication range at the cost of longerpackets and hence a higher energy expenditure.
Coding Rate 4/5 . . . 4/8Larger coding rates increase the resilience to interference burstsand decoding errors at the cost of longer packets and a higherenergy expenditure.
Transmission Power −4 . . . 20 dBm Higher transmission powers reduce the signal-to-noise ratio at the cost ofan increase in the energy consumption of the transmitter.
Bandwidth (BW). Varying the range of frequencies (bandwidth) over which LoRa chirp spreadallows for trading radio air time against radio sensitivity, thus energy efficiency against communicationrange and robustness. The higher is the bandwidth, the shorter is the air time and the lower is thesensitivity. A lower bandwidth also requires a more accurate crystal in order to minimize problemsrelated to the clock drift. Given a bandwidth BW, typically in the range of 125. . . 500 kHz, LoRa’schip-rate RC is computed as:
RC = BW chips/s.
Spreading Factor (SF). To transmit information, LoRa “spreads” each symbol over several chips(spreading factor) to increase the receiver’s sensitivity even more. LoRa’s spreading factor SF can beselected between 6 and 12, resulting in a spreading rate ranging from 26 to 212 chips/symbol and asymbol-rate RS that can be computed as:
RS =RC
2SF =BW2SF symbols/s,
and resulting in a modulation bit-rate that can be expressed as:
RM = SF · RS = SF · BW2SF bits/s.
Note that, in LoRa, packets transmitted with different spreading factors are orthogonal with eachother and do not cause collisions if transmitted concurrently.
J. Sens. Actuator Netw. 2017, 6, 7 5 of 19
Coding Rate (CR). To increase the resilience to corrupted bits, LoRa supports forward errorcorrection techniques with a variable number CR of redundant bits, ranging from 1 to 4. The resultingbit-rate BR of LoRa becomes:
BR = RM · 44 + CR
= SF · BW2SF · 4
4 + CRbits/s.
The more interference bursts are expected, the higher the coding rate that should be used tomaximize the probability of successful packet reception. Note that LoRa radios with different codingrates can still communicate, since the packet header (transmitted using the maximum coding rateof 4/8) can include the code rate used for the payload.
Transmission Power (TP). As most wireless radios, LoRa transceivers also allow for adjusting thetransmission power, drastically changing the energy required to transmit a packet. By switching thetransmission power, for example, from −4 to +20 dBm, the power consumption increases from 66 mWto 396 mW when using the RFM95 transceiver (HopeRF, Shenzhen, China) [26]. Note also that, fortransmission powers higher than +17 dBm, hardware limitations and legal regulations limit the radioduty cycle to a maximum of 1%.
Carrier Frequency (CF). LoRa transceivers use sub-GHz frequencies for their communication: amongothers, the 433 MHz, 868 MHz (Europe), and 915 MHz (North America) industrial, scientific and medical(ISM) radio bands. Common LoRa modules such as the Semtech SX1272 [27] and HopeRF RFM95 [26]support communication in the frequency range [860–1020] MHz and are programmable in stepsof 61 Hz. Ten channels with different bandwidths can be used to communicate using LoRa in theEuropean 868 MHz ISM band.
3. Related Work
We now summarize the body of works characterizing the performance of LoRa communicationsand the effects of environmental conditions on its operations.
Characterization of LoRa performance. Because LoRa technology is closed-source, only a fewdetails about its operations are actually available—mostly derived from Semtech’s patent describingthe modulation technology or from application notes written to help application designers fine-tunethe performance of the transceiver to their needs. Many researchers found this information too limitedand started benchmarking and reverse-engineering [28,29] the technology to better understand itsmechanism and characteristics.
The first experiments focused on the range of reliable links and on the receiver sensitivity [14]—LoRa’score characteristics. In [11], LoRa has been evaluated in urban and maritime scenarios, and a signalattenuation model was derived. In [5], instead, experiments focused on testing LoRa’s communicationrange on a set of diverse scenarios (from underground to overground, with and without line of sight)in order to provide a set of deployment guidelines.
Interestingly, in the evaluation process, different studies found that results were contradictingSemtech’s claims on LoRa performance. In [13], researchers were not able to observe an improvedsensitivity with increasing spreading factors. Bor et al. [14] found that LoRa’s ability of penetratingbuildings is rather limited compared to what was originally claimed. Similarly, the results that wepresent in this work show that communication in indoor scenarios with no line of sight are among themost challenging conditions for LoRa. Another challenge is represented by vegetation, as found byIova et al. [12]. Finally, in [14,30,31], the authors model LoRa self-interference and channel utilization,concluding that LoRa’s scalability is worse than what was originally promised. Other works focus on amore detailed characterization of LoRa, in particular on packet loss [32], on the ability of receiving packetsfrom concurrent transmissions [7], and on the energy consumption at different transmission powers [4].
Different from previous works, this paper analyzes LoRa’s PHY settings from a multi-objectiveperspective, with the goal of finding the best trade-off between data rate, packet reception rate, andenergy efficiency.
J. Sens. Actuator Netw. 2017, 6, 7 6 of 19
Environmental effects on low-power radios. A large body of works has studied the impactof environmental conditions on network performance in low-power wireless radios, especially onIEEE 802.15.4-compliant radio transceivers. Several authors report the impact of meteorologicalconditions on packet reception, including the impact of weather conditions [20,33,34], andhumidity [35], as well as the presence of vegetation [36]. One of the most comprehensive studies onwireless nodes deployed outdoors was carried out by Wennerström et al. [20], who have highlightedthat packet reception ratio and received signal strength correlate the most with temperature, whereasthe correlation with other factors such as absolute humidity and precipitation is less pronounced.
The strong impact of temperature on communication performance has been confirmed by severalother works, also almost entirely focused on IEEE 802.15.4 transceivers. Bannister et al. [19] haveshown the correlation between temperature and signal strength in a deployment in the Sonoran desert,and identified in a temperature-controlled chamber that the received signal strength of the TI CC2420radio attenuates at high temperatures due to the impact of temperature on the radio’s low-noise andpower amplifiers. Based upon this work, Boano et al. [17,18] have confirmed these findings alsoon other platforms such as the TI CC1020 and CC2520, and also highlighted how this can cause acomplete disruption of a wireless link. The authors have also shown how the impact of temperaturecannot be neglected when designing duty-cycled medium access control protocols for low-powerwireless radios [37,38]. To facilitate the study of how temperature affects the operation of low-powerwireless protocols on a larger scale than in a temperature-controlled chamber, several low-cost testbedinfrastructures have been proposed, the most popular being TempLab and HotBox [39,40].
The impact of environmental conditions on LPWAN radios, instead, has not yet been investigated indetail. Iova et al. [12] have deployed a number of LoRa networks in urban and mountain environments,and reported that environmental factors such as the presence of vegetation and temperature variationscan negatively affect communication performance. The authors, however, did not quantify the impactof these environmental factors and their work does not yet clarify whether high temperatures degradethe quality of LoRa links in a similar way as observed on several IEEE 802.15.4 transceiver platforms.
In the remainder of this paper, we conduct a number of experiments to complement the bodyof aforementioned related works and answer two key questions that are yet open: (i) how does theselection of LoRa’s PHY settings affect the efficiency of links, including the ones of intermediatequality? and (ii) how does temperature affect the performance of LoRa? To answer these questions,we start by carrying out experiments indoor, outdoor, and underground, and by analyzing how PHYsettings and environmental factors affect LoRa’s communication performance.
4. Evaluating the Performance of LoRa
To study the reliability and energy-efficiency of LoRa communications as a function of the PHYsettings described in Section 2 and as a function of environmental factors, we conduct a series ofsmall-scale deployments.
Experimental setup. All of our experiments are carried out at the Graz University of Technology,Austria: the exact location of the nodes is shown in Figure 1. We fix the senders at three given locations(S) and place three receivers at different distances (1, 2, 3) for three scenarios: indoor with obstacles (i),outdoor with direct line of sight (o), and underground covered by a metal manhole (u). Each transmittersends a packet with a 5-byte payload every 3 s at transmission power +20 dBm, emulating a timelyreport of a typical IoT sensor for urban monitoring. Every six minutes, transmitter and receiversreboot and switch to a different setting according to a set of hard-coded combinations shown inTable 2. For each of the three scenarios (indoor, outdoor, and underground), we test each settingconfiguration sequentially every six minutes for a duration of 24 h, hence resulting in a total of1600 packets exchanged per setting.

J. Sens. Actuator Netw. 2017, 6, 7 7 of 19
Figure 1. Deployment map for our experiments indoor (i), outdoor (o), and underground (u).The sender node for each scenario is indicated with iS, oS, and uS, respectively.
Table 2. LoRa settings used in our experiments: spreading factor (SF), code rate (CR), bandwidth (BW),and rit-rate (BR) Note that settings are ordered by decreasing bit-rate.
Setting ID 1 2 3 4 5 6 7 8 9 10 11 12 13 14 15 16 17 18
SF 7 7 7 9 7 7 9 9 7 9 9 12 9 12 12 12 12 12CR 4/5 4/8 4/5 4/5 4/8 4/5 4/8 4/5 4/8 4/8 4/5 4/5 4/8 4/8 4/5 4/8 4/5 4/8
BW (kHz) 500 500 250 500 250 125 500 250 125 125 125 500 125 500 250 250 125 125BR (kb/s) 21.87 13.62 10.93 7.03 6.83 5.47 4.39 3.51 3.41 2.2 1.76 1.16 1.09 0.72 0.58 0.37 0.30 0.18
Figure 2. Custom-built LoRa platform based on the Moteino MEGA (LowPowerLab, Canton, MI, USA)inside a water-proof enclosure (top removed) [41].
Hardware. The experiments are conducted using a custom-built platform (see Figure 2) basedon the Moteino MEGA (LowPowerLab, Canton, MI, USA) [42]. The latter is equipped with anATMega1284P microcontroller, and a HopeRF RFM95 LoRa transceiver operating at 868 MHz [26].The device is powered by a 3.7 V Li-Ion battery with a capacity of 3.4 Ah that can be charged via adedicated circuit. Without duty cycling the radio, this battery can sustain the device operation for morethan 24 h, the maximum duration of our experiments. The platform we have built also embeds sensorsto measure changes in the surrounding environment. In particular, temperature and humidity areread from a Bosch BME280 sensor (Gerlingen, Germany) via the I2C interface. For persistent storage,an SD card logs each received packet together with its sequence number, the sensed environmentalconditions, as well as the time-stamp provided by a Maxim DS3231 real-time clock (San Jose, CA,
J. Sens. Actuator Netw. 2017, 6, 7 8 of 19
USA). We also save the presence of cyclic redundancy check (CRC) errors in the received packets inour traces. This hardware setup was used in our experiments both for senders and receivers.
Metrics. For each 6-min experiment, we compute the packet reception ratio (prr) and the receiversensitivity, i.e., the lowest signal strength among successfully received packets. We then check thecorrelation of the computed prr with the employed PHY settings, as well as with the measuredtemperature, humidity, and received signal strength values.
4.1. Reliability of LoRa as a Function of PHY Settings
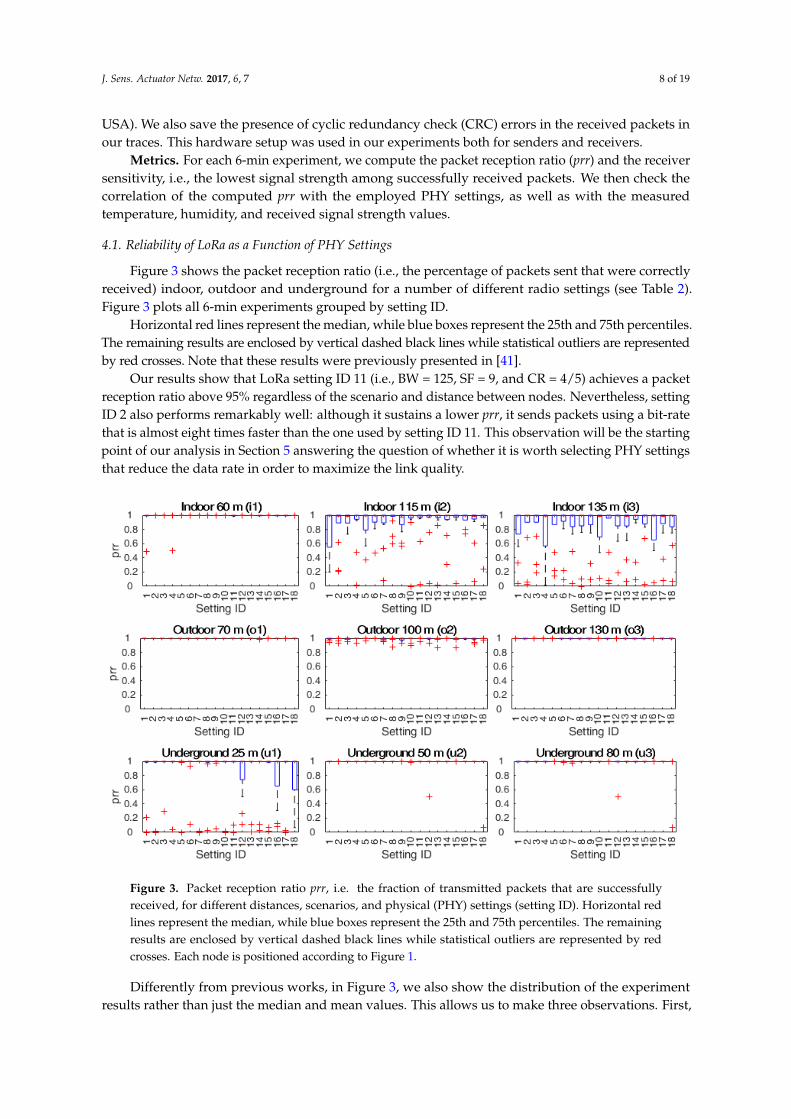
Figure 3 shows the packet reception ratio (i.e., the percentage of packets sent that were correctlyreceived) indoor, outdoor and underground for a number of different radio settings (see Table 2).Figure 3 plots all 6-min experiments grouped by setting ID.
Horizontal red lines represent the median, while blue boxes represent the 25th and 75th percentiles.The remaining results are enclosed by vertical dashed black lines while statistical outliers are representedby red crosses. Note that these results were previously presented in [41].
Our results show that LoRa setting ID 11 (i.e., BW = 125, SF = 9, and CR = 4/5) achieves a packetreception ratio above 95% regardless of the scenario and distance between nodes. Nevertheless, settingID 2 also performs remarkably well: although it sustains a lower prr, it sends packets using a bit-ratethat is almost eight times faster than the one used by setting ID 11. This observation will be the startingpoint of our analysis in Section 5 answering the question of whether it is worth selecting PHY settingsthat reduce the data rate in order to maximize the link quality.
Figure 3. Packet reception ratio prr, i.e. the fraction of transmitted packets that are successfullyreceived, for different distances, scenarios, and physical (PHY) settings (setting ID). Horizontal redlines represent the median, while blue boxes represent the 25th and 75th percentiles. The remainingresults are enclosed by vertical dashed black lines while statistical outliers are represented by redcrosses. Each node is positioned according to Figure 1.
Differently from previous works, in Figure 3, we also show the distribution of the experimentresults rather than just the median and mean values. This allows us to make three observations. First,

J. Sens. Actuator Netw. 2017, 6, 7 9 of 19
while the median prr is close to 1 for most settings, the quartiles and minima are not. Second, due to thelower multi-path and fading effects outdoor and underground, LoRa communications are more reliablein these scenarios rather than indoors (in line with what is observed in [7]), with packet receptionratios above 97% for almost all setting IDs. Third, the range of the LoRa radios is consistent throughoutthe different settings: even though the reception rate changes, all settings are able to deliver packets insimilar conditions.
4.2. Factors Affecting LoRa Reliability
We explore next which environmental factors affect the reliability of LoRa. Towards this goal,we use the traces collected in the previous experiments and focus on the correlation between thepacket reception rate (prr), setting ID (set), temperature (temp), humidity (hum), spreading factor (sf ),coding rate (cr), bandwidth (bw), receiver sensitivity (sens), receiver signal strength (rss), and hour ofthe day (hour). In particular, we plot the Pearson correlation of each pair of parameters for differentexperimental scenarios in Figure 4: a value close to 1 (black) means that the two parameters are linearlycorrelated, whereas a value of 0 (white) implies that the two parameters are independent.
A
Indoor 135 m (i3)
prr set tmp hum sf cr bw sen rss hour
prr
set
temp
hum
sf
cr
bw
sen
rss
hour
0
0.1
0.2
0.3
0.4
0.5
0.6
0.7
0.8
0.9
1Outdoor 100 m (o2)
prr set tmp hum sf cr bw sen rss hour
prr
set
temp
hum
sf
cr
bw
sen
rss
hour
0
0.1
0.2
0.3
0.4
0.5
0.6
0.7
0.8
0.9
1
Underground 80 m (u3)
prr set sf cr bw sen rss hour
prr
set
temp
hum
sf
cr
bw
sen
rss
hour
0
0.1
0.2
0.3
0.4
0.5
0.6
0.7
0.8
0.9
1All experiments combined
prr set sf cr bw sen rss hour
prr
set
temp
hum
sf
cr
bw
sen
rss
hour
0
0.1
0.2
0.3
0.4
0.5
0.6
0.7
0.8
0.9
1
B
CD E
E
A
tmp hum tmp hum
Figure 4. Correlation matrix for different LoRa settings indoor, outdoor, and underground. The plot onthe bottom right combines all nine of the settings from Figure 3.
Figure 4 shows that, in all three scenarios (indoor, outdoor and underground), there are someobvious correlations. First (A), the setting ID depends on the bandwidth, coding rate (cr), and spreadingfactor (sf ). This is to be expected, because the setting ID unequivocally describes a combination of

J. Sens. Actuator Netw. 2017, 6, 7 10 of 19
these three PHY parameters. Second (B), temperature (temp) is highly correlated with humidity (hum)and both are correlated with the time of the day (hour). This is also an expected correlation, as theseenvironmental factors are highly dependent on the sun exposure. Third (C), the radio sensitivity (sen)is correlated to the received signal strength (rss), since the former is defined as the minimum of thelatter. Furthermore, one can also note in Figure 4 that the received signal strength (rss) is correlatedwith the packet reception ratio (prr) (D), as the LoRa radio is able to successfully decode packets thatare above a certain signal-to-noise ratio.
Figure 4 also shows that temperature is tightly correlated with the received signal strength (rss)and the packet reception ratio (prr). This seem to hint that temperature variations may affect theoperation of the employed LoRa radio in a similar way as observed on some IEEE 802.15.4 transceivers(see Section 3). When analyzing the figure in detail, one can actually observe a correlation cluster (E)between temperature, humidity, time of the day, packet reception ratio, and received signal strength:the strength of these correlations varies depending on the scenario and is stronger outdoors. To betterunderstand the inter-dependency between the reliability performance (rss and prr) and environmentalfactors (temp), we carry out experiments in controlled settings in Section 6.
5. The Efficiency of LoRa as a Function of PHY Settings
The experimental campaign presented in the previous section has shown that it is possible toimprove the reliability of LoRa by carefully choosing the PHY settings, i.e., some of the settings allowfor sustaining a higher prr. In this section, we analyze the costs of such improvement in terms of energyefficiency and analyze in detail the trade-off between packet delivery rate and setting’s bandwidth,providing an answer to the question: is it more efficient to use resilient and slow settings or to use faster (butmore fragile) configurations together with a re-transmission mechanism?
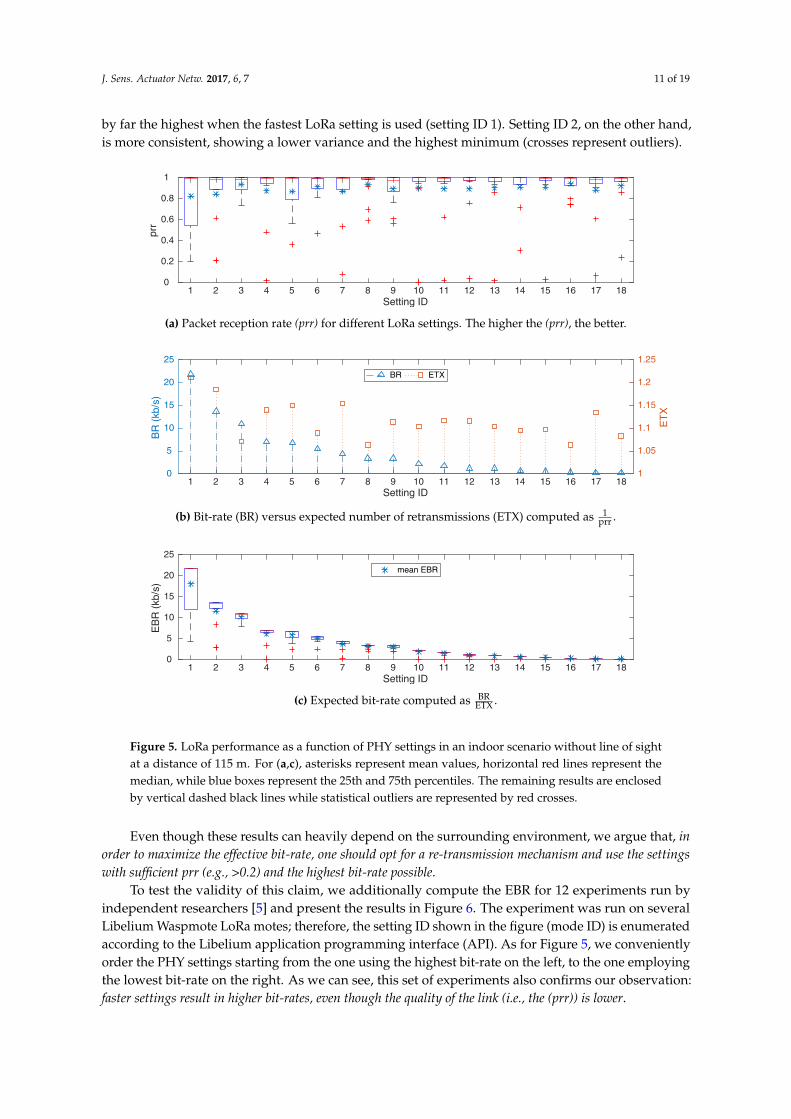
To answer this question, we focus on the most challenging scenario in our experimental campaign,i.e., indoor, no line of sight, and with a distance between two devices of 115 m. Figure 5a shows thedistribution of packet reception ratios as a function of setting ID. Averages are represented by ’*’,while median, quartiles, and extreme values are enclosed by a blue box and two black bars (outliersare indicated with crosses). PHY settings are ordered by decreasing bit-rate, from faster and morelightweight settings on the left, to slower settings increasing the transceiver’s on-time on the right.As we can see, using the fastest setting (setting ID 1 and 2), the average prr is 80% with a worst casescenario where prr is as low as 20%. As expected, by selecting a PHY configuration that reduces thebit-rate (i.e., by decreasing the bandwidth and increasing the bit redundancy), the packet receptionratio improves, as well as its distribution.
Nevertheless, one can argue that it is more energy-efficient to re-transmit a packet using the fastersettings available rather than employing PHY settings that reduce the bit-rate. To prove our point, wecompute the expected number of re-transmissions (ETX) as:
ETX =1
prr
and compare them against each setting’s original bit-rate (BR). As we can see in Figure 5b, the expectednumber of re-transmissions (squares) does not directly depend on the settings’ bit-rate (triangles),suggesting that not all settings are worth their overhead.
In order to give an indication on how efficiently LoRa settings trade communication efficiencyagainst reliability, we compute the effective bit-rate (EBR) as:
EBR[kb/s] =BR
ETX= BR · prr
and show both mean and distribution in Figure 5c.The EBR shows the expected bit-rate of each setting in the case packets are re-transmitted
back-to-back until one is successfully received. As we can see from Figure 5c, the mean EBR is
J. Sens. Actuator Netw. 2017, 6, 7 11 of 19
by far the highest when the fastest LoRa setting is used (setting ID 1). Setting ID 2, on the other hand,is more consistent, showing a lower variance and the highest minimum (crosses represent outliers).
1 2 3 4 5 6 7 8 9 10 11 12 13 14 15 16 17 18Setting ID
0
0.2
0.4
0.6
0.8
1
prr
(a) Packet reception rate (prr) for different LoRa settings. The higher the (prr), the better.
1 2 3 4 5 6 7 8 9 10 11 12 13 14 15 16 17 18Setting ID
0
5
10
15
20
25
BR
(kb
/s)
1
1.05
1.1
1.15
1.2
1.25
ET
X
BR ETX
(b) Bit-rate (BR) versus expected number of retransmissions (ETX) computed as 1prr .
1 2 3 4 5 6 7 8 9 10 11 12 13 14 15 16 17 18Setting ID
0
5
10
15
20
25
EB
R (
kb/s
)
mean EBR
(c) Expected bit-rate computed as BRETX .
Figure 5. LoRa performance as a function of PHY settings in an indoor scenario without line of sightat a distance of 115 m. For (a,c), asterisks represent mean values, horizontal red lines represent themedian, while blue boxes represent the 25th and 75th percentiles. The remaining results are enclosedby vertical dashed black lines while statistical outliers are represented by red crosses.
Even though these results can heavily depend on the surrounding environment, we argue that, inorder to maximize the effective bit-rate, one should opt for a re-transmission mechanism and use the settingswith sufficient prr (e.g., >0.2) and the highest bit-rate possible.
To test the validity of this claim, we additionally compute the EBR for 12 experiments run byindependent researchers [5] and present the results in Figure 6. The experiment was run on severalLibelium Waspmote LoRa motes; therefore, the setting ID shown in the figure (mode ID) is enumeratedaccording to the Libelium application programming interface (API). As for Figure 5, we convenientlyorder the PHY settings starting from the one using the highest bit-rate on the left, to the one employingthe lowest bit-rate on the right. As we can see, this set of experiments also confirms our observation:faster settings result in higher bit-rates, even though the quality of the link (i.e., the (prr)) is lower.

J. Sens. Actuator Netw. 2017, 6, 7 12 of 19
Next, we extend this analysis to different transmission power levels and explicitly also evaluatethe energy efficiency of LoRa transmissions.
1 2 4 6 7 8 10Libelium Waspmote mode ID
0
5
10
15
20
25
EB
R (
kb/s
)
2400m semi-los2080m semi-los1600m semi-los1200m semi-los460m semi-los477m urban690m urban0m overground0m underground255m overground406m overground760m overground
Figure 6. Effective bit-rate for 12 experiments run by independent researchers and presented in [5].
Energy efficiency of LoRa transmissions. We evaluate the energy efficiency of different PHYsettings by repeating the indoor experiments without line of sight at a distance of 115 m. This time,we slightly vary the experimental setup as follows: we position the two nodes at the edge oftransmission range and send each packet with a different power level, sequentially selected from theset {+20, +17, +15, +11, +7, +5} dBm. We first check if using the fastest PHY setting leads to the highestenergy efficiency both in challenging and non challenging conditions (the lower the transmissionpower, the more challenging the communication). We then compute the most energy-efficient settingby computing the effective energy consumed to send a kilobit of data EKB as follows:
EKB[J/kb] =P
EBR,
where P is the power consumption of the radio in watts and EBR is the effective bit rate.Figure 7a shows the packet reception rate when using three different power levels: +20, +15,
and +11 dBm. As expected, changing the transmission power drastically affects the prr, since thenodes are intentionally placed on the edge of the communication range. In agreement with the resultspresented previously, Figure 7b shows that the fastest settings are the ones with highest effectivebit-rate EBR—independently of the employed transmission power. As lower transmission powers implylower energy expenditures, we still need to answer which transmission power configuration results in thehighest energy efficiency.
Figure 7c shows the energy required by each PHY setting to transmit a kilobit of data (EKB),including the cost of the re-transmissions. As we can see, the most efficient transmission powerconfiguration (i.e., leading to the lowest EKB) is the highest, i.e., +20 dBm. Therefore, our experimentalresults suggest that, together with the fastest setting, the highest transmission power should be preferred:this combination provides the highest bit-rate EBR and the lowest energy consumption EKB. It isworth highlighting that, in less challenging scenarios in which several transmission powers achieve aprr = 1, the lowest one should be used, as the higher transmission powers may increase the energyconsumption without any additional benefit.

J. Sens. Actuator Netw. 2017, 6, 7 13 of 19
1 2 3 4 5 6 7 8 9 10 11 12 13 14 15 16 17 18Setting ID
0
0.2
0.4
0.6
0.8
1
prr
(a) Packet reception rate ((prr)) for different LoRa settings. The higher the (prr), the better.
1 2 3 4 5 6 7 8 9 10 11 12 13 14 15 16 17 18Setting ID
0
5
10
15
20
25
EB
R (
kb/s
)
Effective bit-rate at 20 dBmEffective bit-rate at 15 dBmEffective bit-rate at 11 dBmBit-rate with prr = 1
(b) Expected bit-rate computed as BRETX .
1 2 3 4 5 6 7 8 9 10 11 12 13 14 15 16 17 18Setting ID
0.01
0.1
1
10
EK
B (
J/kb
)
(c) Expected energy per kilobit (EKB). The lower EKB, the more energy efficient is LoRa.
Figure 7. LoRa performance for different settings and transmission powers.
6. Impact of Temperature on LoRa Transceivers
Our experimental campaign presented in Section 4 has shown that there is a strong correlationbetween temperature, packet reception rate, and received signal strength. To quantify this correlationand shed light on the impact of temperature on LoRa communications, we carry out a deeperinvestigation in controlled settings.
Experimental setup. We use the TempLab testbed [39] to expose a number of LoRa nodes torepeatable temperature variations as shown in Figure 8. The TempLab testbed available at GrazUniversity of Technology has two different types of nodes [38]: LO nodes only heating the sensornodes above room temperature and PE nodes having the capability to also cool down the node’stemperature below zero degrees thanks to enclosures made of hard Polystyrene foam and ATA-050-24Peltier air-to-air assembly modules (Custom Thermoelectric, Bishopville, MD, USA). Both LO andPE nodes are remotely controlled using an Aeon Z-Wave Stick Series 2 (Aeon Labs LLC, El Cerrito,CA, USA) sending commands to (i) Vesternet EVR_AD1422 Z-Wave Everspring wireless dimmers(Smartech Holdings Ltd., Manchester, UK) connected to Philips E27 infra-red 100 W light bulbs (Philips,Eindhoven, The Netherlands) and (ii) to Vesternet EVR_AN1572 Z-Wave Everspring on–off wirelessswitches connected to the Peltier modules.

J. Sens. Actuator Netw. 2017, 6, 7 14 of 19
Tem
per
. (°C
)
PE
LOLO
Figure 8. Sketch of the employed TempLab’s setup to control the temperature of LoRa nodes.
We place the LoRa nodes without a connected SubMiniature version A (SMA) antenna insidePE nodes and let the nodes transmit packets as fast as possible without any radio duty cycling whiletemperature varies in the range of 0–60 ◦C. In particular, we scripted TempLab to first slowly increasetemperature from 0 to 60 ◦C and then to quickly cool down to 0 ◦C. Each test has a duration of fivehours and was repeated for different PHY settings and hardware platforms.
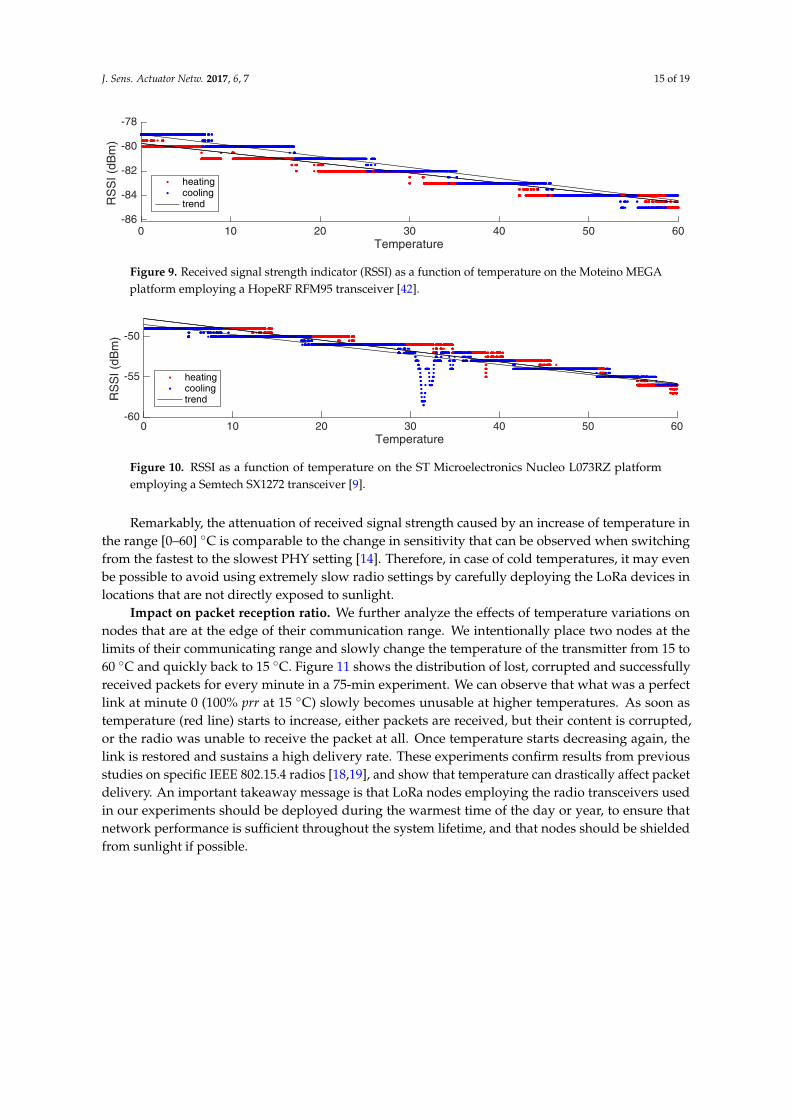
Impact on received signal strength. We plot the relationship between the received signal strengthindicator (RSSI) of received packets and the median temperature measured by the two nodes for differenthardware platforms. Figure 9 shows the curve recorded when using a Moteino MEGA board [42]equipped with a HopeRF RFM95 LoRa radio (the same platform used for the experiments described inSection 4). Each dot represents the median of the RSSI over 40 received packets. Similarly to what wasreported in [18], the RSSI decreases linearly in discrete steps for a total of about 6 dB in the temperaturerange of 0–60 ◦C. This is because, for a given voltage, a higher temperature increases the resistanceof conductors, while reducing the pass-trough current. For radio transceivers, this implies that highertemperatures reduce the received signal strength and signal-to-noise ratio.
Also according to [18], we observe an hysteresis in the relationship between RSSI andtemperature when comparing the curves obtained when heating and when cooling the LoRa nodes.Similarly, Figure 10 shows the relationship between RSSI and temperature recorded when exposingST Nucleo L073RZ boards (STMicroelectronics, Geneva, Switzerland) [9] equipped with a SemtechSX1272 radio to temperature variations. Also using this hardware, we observe a linear decrease ofabout 6 dB in the RSSI at high temperatures. We attribute the spikes recorded on the experiment ofFigure 10 (when temperature varies between 30 and 40 ◦C) to a temporary multi-path fading effectof the environment. Note that Figures 9 and 10 refer to different experiments, both carried out usingsetting ID 6 (i.e., CR = 4/5, SF = 7, BW = 125 MHz).
J. Sens. Actuator Netw. 2017, 6, 7 15 of 19
0 10 20 30 40 50 60Temperature
-86
-84
-82
-80
-78R
SS
I (dB
m)
heatingcoolingtrend
Figure 9. Received signal strength indicator (RSSI) as a function of temperature on the Moteino MEGAplatform employing a HopeRF RFM95 transceiver [42].
0 10 20 30 40 50 60Temperature
-60
-55
-50
RS
SI (
dBm
)
heatingcoolingtrend
Figure 10. RSSI as a function of temperature on the ST Microelectronics Nucleo L073RZ platformemploying a Semtech SX1272 transceiver [9].
Remarkably, the attenuation of received signal strength caused by an increase of temperature inthe range [0–60] ◦C is comparable to the change in sensitivity that can be observed when switchingfrom the fastest to the slowest PHY setting [14]. Therefore, in case of cold temperatures, it may evenbe possible to avoid using extremely slow radio settings by carefully deploying the LoRa devices inlocations that are not directly exposed to sunlight.
Impact on packet reception ratio. We further analyze the effects of temperature variations onnodes that are at the edge of their communication range. We intentionally place two nodes at thelimits of their communicating range and slowly change the temperature of the transmitter from 15 to60 ◦C and quickly back to 15 ◦C. Figure 11 shows the distribution of lost, corrupted and successfullyreceived packets for every minute in a 75-min experiment. We can observe that what was a perfectlink at minute 0 (100% prr at 15 ◦C) slowly becomes unusable at higher temperatures. As soon astemperature (red line) starts to increase, either packets are received, but their content is corrupted,or the radio was unable to receive the packet at all. Once temperature starts decreasing again, thelink is restored and sustains a high delivery rate. These experiments confirm results from previousstudies on specific IEEE 802.15.4 radios [18,19], and show that temperature can drastically affect packetdelivery. An important takeaway message is that LoRa nodes employing the radio transceivers usedin our experiments should be deployed during the warmest time of the day or year, to ensure thatnetwork performance is sufficient throughout the system lifetime, and that nodes should be shieldedfrom sunlight if possible.

J. Sens. Actuator Netw. 2017, 6, 7 16 of 19
0 5 10 15 20 25 30 35 40 45 50 55 60 65 70 75Time (minutes)
0
0.1
0.2
0.3
0.4
0.5
0.6
0.7
0.8
0.9
1
Pac
ket r
ecep
tion
rate
0
10
20
30
40
50
60
Tem
pera
ture
LostCorruptedSuccesfullTemperature
Figure 11. Increase of packet corruption and loss at higher temperature on a LoRa link at the edge ofthe communication range.
7. Conclusions
This paper presents an analysis of the performance of LoRa as a function of different PHY settingsand environmental conditions. We first study the effects of different LoRa settings on the effectivebit-rate that can be achieved (i.e., on the amount of information that LoRa is able to successfully deliverduring a given period). Our experimental results suggest that, when nodes are at the edge of theircommunication range, using the fastest PHY setting and the highest transmission power is moreefficient than selecting slower settings that maximize the link quality. Even though, for example, thefastest PHY setting in our experiments yields an average packet reception rate that is 10% lower thanthe slowest setting, the former’s effective bitrate is 100× faster than the latter’s. Compared to the slowersettings, the efficiency of the fastest PHY setting is so high that even in its worst case scenario—whenthe minimum prr reaches 20%—the effective bitrate is faster than twelve of the slowest PHY settings(settings 7–18, from 1× to 25× better). Second, we analyze the external factors affecting the reliabilityof LoRa. Our outdoor experiments show a clear correlation between temperature, humidity, packetreception rate, and received signal strength. A deeper investigation in controlled settings showsthat the signal strength of received packets decreases linearly when temperature increases in twodifferent LoRa transceivers. Different LoRa radios have shown that, over a range of 60 ◦C, the receivedsignal strength is consistently reduced by 6 dBm (1 dBm/10 ◦C). This decrease in signal strength cansignificantly affect LoRa links that are at the edge of the communication range, increasing packetcorruption and loss, and rendering a perfectly good link (100% prr at 15 ◦C) completely unusable (0%prr at 60 ◦C).
As a future work, we plan to quantify the impact of other environmental factors on LoRaperformance, e.g., humidity and radio interference. Our ultimate goal is to design and implement anenvironmental-aware MAC protocol tailored to LoRa that can sustain reliable and energy-efficientoperations regardless of changes in the surrounding environmental conditions.
Acknowledgments: This work has been supported by the Sino Austrian Electronic Technology Innovation Center.This work was also partially performed within the LEAD-Project “Dependable Internet of Things in AdverseEnvironments”, funded by Graz University of Technology.
Author Contributions: Marco Cattani has conceived and designed the experiments evaluating the interplaybetween LoRa’s PHY settings and link quality described in Sections 4 and 5, as well as taken care of the write-upof the whole manuscript. Carlo Alberto Boano has conceived and designed the experiments evaluating the impactof temperature on LoRa transceivers described in Section 6 and taken care of the write-up of the whole manuscript.Kay Römer has participated to the general discussions and help revising the write-up of the manuscript.
Conflicts of Interest: The authors declare no conflict of interest.
J. Sens. Actuator Netw. 2017, 6, 7 17 of 19
References
1. Real Wireless Ltd. A Comparison of UNB and Spread Spectrum Wireless Technologies as Used in LPWA M2MApplications; Real Wireless: West Sussex, UK, 2015.
2. LoRa Alliance. LoRa: Wide Area Networks for IoT, 2017. Available online: http://www.lora-alliance.org/What-Is-LoRa/Technology (accessed on 22 May 2017).
3. Raza, U.; Kulkarni, P.; Sooriyabandara, M. Low Power Wide Area Networks: An Overview. IEEE Commun.Surv. Tutor. 2017, 19, 855–873.
4. Bor, M.; Roedig, U. LoRa Transmission Parameter Selection. In Proceedings of the 13th IEEE InternationalConference on Distributed Computing in Sensor Systems (DCOSS), Ottawa, ON, Canada, 5–7 June 2017.
5. Gnawali, O.; Fonseca, R.; Jamieson, K.; Moss, D.; Levis, P. Demystifying Low-Power Wide-AreaCommunications for City IoT Applications. In Proceedings of the 10th ACM Workshop on Wireless NetworkTestbeds, Experimental Evaluation, and Characterization (WiNTECH), New York, NY, USA, 3 October 2016;pp. 2–8.
6. Baños-Gonzalez, V.; Afaqui, M.S.; López-Aguilera, E.; Villegas, E.G. Throughput and Range Characterizationof IEEE 802.11ah. arXiv 2016, arXiv:1604.08625.
7. Bor, M.; Vidler, J.; Roedig, U. LoRa for the Internet of Things. In Proceedings of the 1st InternationalWorkshop on New Wireless Communication Paradigms for the Internet of Things (MadCom), Graz, Austria,15–17 February 2016; pp. 361–366.
8. Libelium. Waspmote-LoRa-868MHz-915MHz-SX1272 Networking Guide, v7.0; Libelium: Zaragoza, Spain, 2017.9. ST Microelectronics. STM32 Nucleo Pack for LoRa Technology (P-NUCLEO-LRWAN1), DocID029505 Rev. 2;
ST Microelectronics: Geneva, Switzerland, 2016.10. NetBlocks Embedded Networking. XRange SX1272 LoRa RF module. Available online: http://www.netblocks.eu/
(accessed on 22 May 2017).11. Petäjäjärvi, J.; Mikhaylov, K.; Roivainen, A.; Hänninen, T.; Pettissalo, M. On the Coverage of LPWANs:
Range Evaluation and Channel Attenuation Model for LoRa Technology. In Proceedings of the 14th IEEEInternational Conference on ITS Telecommunications (ITST), Copenhagen, Denmark, 2–4 December 2015;pp. 55–59.
12. Iova, O.; Murphy, A.L.; Ghiro, L.; Molteni, D.; Ossi, F.; Cagnacci, F. LoRa from the City to the Mountains:Exploration of Hardware and Environmental Factors. In Proceedings of the 2nd International Workshop onNew Wireless Communication Paradigms for the Internet of Things (MadCom), Uppsala, Sweden, 20–22February 2017.
13. Augustin, A.; Yi, J.; Clausen, T.; Townsley, W.M. A Study of LoRa: Long Range & Low Power Networks forthe Internet of Things. Sensors 2016, 16, 1466.
14. Bor, M.; Roedig, U.; Voigt, T.; Alonso, J.M. Do LoRa Low-Power Wide-Area Networks Scale? In Proceedingsof the 19th ACM International Conference on Modeling, Analysis and Simulation of Wireless and MobileSystems (MSWiM), Valletta, Malta, 13–17 November 2016; pp. 59–67.
15. Baccour, N.; Koubâa, A.; Mottola, L.; Youssef, H.; Zúñiga, M.A.; Boano, C.A.; Alves, M. Radio Link QualityEstimation in Wireless Sensor Networks: A Survey. ACM Trans. Sensor Netw. 2012, 8, 34.
16. Gnawali, O.; Fonseca, R.; Jamieson, K.; Moss, D.; Levis, P. Collection Tree Protocol. In Proceedings ofthe 7th International Conference on Embedded Networked Sensor Systems (SenSys), Berkeley, CA, USA,4–6 November 2009; pp. 1–14.
17. Boano, C.A.; Brown, J.; Tsiftes, N.; Roedig, U.; Voigt, T. The Impact of Temperature on Outdoor IndustrialSensornet Applications. IEEE Trans. Ind. Inform. 2010, 6, 451–459.
18. Boano, C.A.; Wennerström, H.; Zúñiga, M.A.; Brown, J.; Keppitiyagama, C.; Oppermann, F.J.; Roedig, U.;Nordén, L.Å.; Voigt, T.; Römer, K. Hot Packets: A Systematic Evaluation of the Effect of Temperature onLow Power Wireless Transceivers. In Proceedings of the 5th Extreme Conference on Communication(ExtremeCom), Reykjavik, Iceland, 24–29 August 2013; pp. 7–12.
19. Bannister, K.; Giorgetti, G.; Gupta, S.K. Wireless Sensor Networking for Hot Applications: Effects ofTemperature on Signal Strength, Data Collection and Localization. In Proceedings of the 5th InternationalWorkshop on Embedded Networked Sensors (HotEmNets), Charlottesville, VA, USA, 2–3 June 2008.
J. Sens. Actuator Netw. 2017, 6, 7 18 of 19
20. Wennerström, H.; Hermans, F.; Rensfelt, O.; Rohner, C.; Nordén, L.A. A Long-Term Study of Correlationsbetween Meteorological Conditions and 802.15.4 Link Performance. In Proceedings of the 10th IEEEInternational Conference on Sensing, Communication, and Networking (SECON), New Orleans, LA, USA,24–27 June 2013; pp. 221–229.
21. Ratasuk, R.; Vejlgaard, B.; Mangalvedhe, N.; Ghosh, A. NB-IoT system for M2M communication.In Proceedings of the IEEE Wireless Communications and Networking Conference (WCNC), Doha, Qatar,3–6 April 2016; pp. 1–5.
22. Weightless SIG. Weightless-P Open Standard, 2017. Available online: http://www.weightless.org/about/weightlessp (accessed on 22 May 2017).
23. Sigfox. Sigfox Technology, 2017. Available online: http://www.sigfox.com (accessed on 22 May 2017).24. Weightless SIG. Weightless-N Open Standard, 2017. Available online: http://www.weightless.org/about/
weightlessn (accessed on 22 May 2017).25. Semtech Corporation. LoRa Modulation Basics—Application Note 1200.22, Revision 2; Semtech Corporation:
Camarillo, CA, USA, 2015.26. Hope RF Microelectronics. RFM95/96/97/98(W)—Low Power Long Range Transceiver Module, v1.0; Hope RF
Microelectronics: Shenzhen, China, 2016.27. Semtech Corporation. SX1272/73—860 MHz to 1020 MHz Low-Power Long-Range Transceiver, Revision 3.1;
Semtech Corporation: Camarillo, CA, USA, 2017.28. Myriad-RF. LoRa-SDR, 2017. Available online: http://github.com/myriadrf/LoRa-SDR (accessed on
22 May 2017).29. DecodingLora, 2017. Available online: http://revspace.nl/DecodingLora (accessed on 22 May 2017).30. Georgiou, O.; Raza, U. Low Power Wide Area Network Analysis: Can LoRa Scale? IEEE Wirel. Commun. Lett.
2017, 6, 162–165.31. Voigt, T.; Bor, M.; Roedig, U.; Alonso, J. Mitigating Inter-network Interference in LoRa Networks.
In Proceedings of the 2nd International Workshop on New Wireless Communication Paradigms for theInternet of Things (MadCom), Uppsala, Sweden, 20–22 February 2017.
32. Marcelis, P.; Rao, V.; Prasad, R.V. DaRe: Data Recovery through Application Layer Coding for LoRaWAN.In Proceedings of the 2nd International Conference on Internet-of-Things Design and Implementation (IoTDI),Pittsburgh, PA, USA, 18–21 April 2017; pp. 97–108.
33. Anastasi, G.; Falchi, A.; Passarella, A.; Conti, M.; Gregori, E. Performance Measurements of Motes SensorNetworks. In Proceedings of the 7th ACM International Symposium on Modeling, Analysis and Simulationof Wireless and Mobile Systems (MSWiM), Venice, Italy, 4–6 October 2004; pp. 174–181.
34. Boano, C.A. Application Support Design for Wireless Sensor Networks. Master’s Thesis, Politecnico di Torino,Turin, Italy; Kungliga Tekniska Högskolan, Stockholm, Sweden, 2009.
35. Thelen, J.; Goense, D.; Langendoen, K. Radio Wave Propagation in Potato Fields. In Proceedings of the 1stWorkshop on Wireless Network Measurement (WiNMee), Garda, Italy, 1–5 April 2005.
36. Marfievici, R.; Murphy, A.L.; Picco, G.P.; Ossi, F.; Cagnacci, F. How Environmental Factors Impact OutdoorWireless Sensor Networks: A Case Study. In Proceedings of the 10th IEEE International Conference onMobile Ad-Hoc and Sensor Systems (MASS), Hangzhou, China, 14–16 October 2013; pp. 565–573.
37. Boano, C.A.; Römer, K.; Tsiftes, N. Mitigating the Adverse Effects of Temperature on Low-Power WirelessProtocols. In Proceedings of the 11th IEEE International Conference on Mobile Ad Hoc and SensorSystems (MASS), Philadelphia, PA, USA, 27–30 October 2014; pp. 336–344.
38. Boano, C.A. Dependable Wireless Sensor Networks. Ph.D. Thesis, Graz University of Technology,Graz, Austria, 2014.
39. Boano, C.A.; Zúñiga, M.A.; Brown, J.; Roedig, U.; Keppitiyagama, C.; Römer, K. TempLab: A TestbedInfrastructure to Study the Impact of Temperature on Wireless Sensor Networks. In Proceedings of the13th ACM/IEEE International Conference on Information Processing in Sensor Networks (IPSN), Berlin,Germany, 15–17 April 2014; pp. 95–106.
40. Schmidt, F.; Ceriotti, M.; Hauser, N.; Wehrle, K. If You Can’t Take the Heat: Temperature Effects onLow-Power Wireless Networks and How to Mitigate Them. In Proceedings of the 12th European Conferenceon Wireless Sensor Networks (EWSN), Porto, Portugal, 9–11 February 2015.

J. Sens. Actuator Netw. 2017, 6, 7 19 of 19
41. Cattani, M.; Boano, C.A.; Steffelbauer, D.; Kaltenbacher, S.; Günther, M.; Römer, K.; Fuchs-Hanusch,D.; Horn, M. Adige: An Efficient Smart Water Network based on Long-Range Wireless Technology.In Proceedings of the 3rd International Workshop on Cyber-Physical Systems for Smart Water Networks(CySWATER), Pittsburgh, PA, USA, 18–21 April 2017.
42. LowPowerLab. Moteino MEGA LoRa, 2016. Available online: http://lowpowerlab.com/shop/product/119(accessed on 22 May 2017).
c© 2017 by the authors. Licensee MDPI, Basel, Switzerland. This article is an open accessarticle distributed under the terms and conditions of the Creative Commons Attribution(CC BY) license (http://creativecommons.org/licenses/by/4.0/).