chambleems.dekalb.k12.ga.uschambleems.dekalb.k12.ga.us/Downloads/VII-T1-REPRESENT DATA-30-KEY...The...
21
4/3/2016 USATestprep, Inc. http://www.usatestprep.com/modules/quiz_factory/qf.php?testid=535 1/21 Coordinate Algebra EOC (GSE) Quiz Answer Key Interpreting Categorical and Quantitative Data - (MGSE9‐12.S.ID.1 ) Represent Data Student Name: _______________________ Date: _________ Teacher Name: THUYNGA DAO Score: _________ 1) Small packages of raisins contain different numbers of raisins in each package. The dot plot here shows the distribution of the number of raisins found in 15 individual packages. What can you conclude from this dot plot? A) The most common number of raisins per box was 24. B) The most common number of raisins per box was 25. C) More packages contained 25 raisins than 23 raisins. D) More packages contained 22 raisins than 23 raisins. Explanation: The most common number of raisins per box was 24. This occurred in 6 of 15 packages. 2)
Transcript of chambleems.dekalb.k12.ga.uschambleems.dekalb.k12.ga.us/Downloads/VII-T1-REPRESENT DATA-30-KEY...The...
4/3/2016 USATestprep, Inc.
http://www.usatestprep.com/modules/quiz_factory/qf.php?testid=535 1/21
Coordinate Algebra EOC (GSE) Quiz Answer KeyInterpreting Categorical and Quantitative Data - (MGSE9‐12.S.ID.1 ) Represent Data
Student Name: _______________________ Date: _________Teacher Name: THUYNGA DAO Score: _________
1)
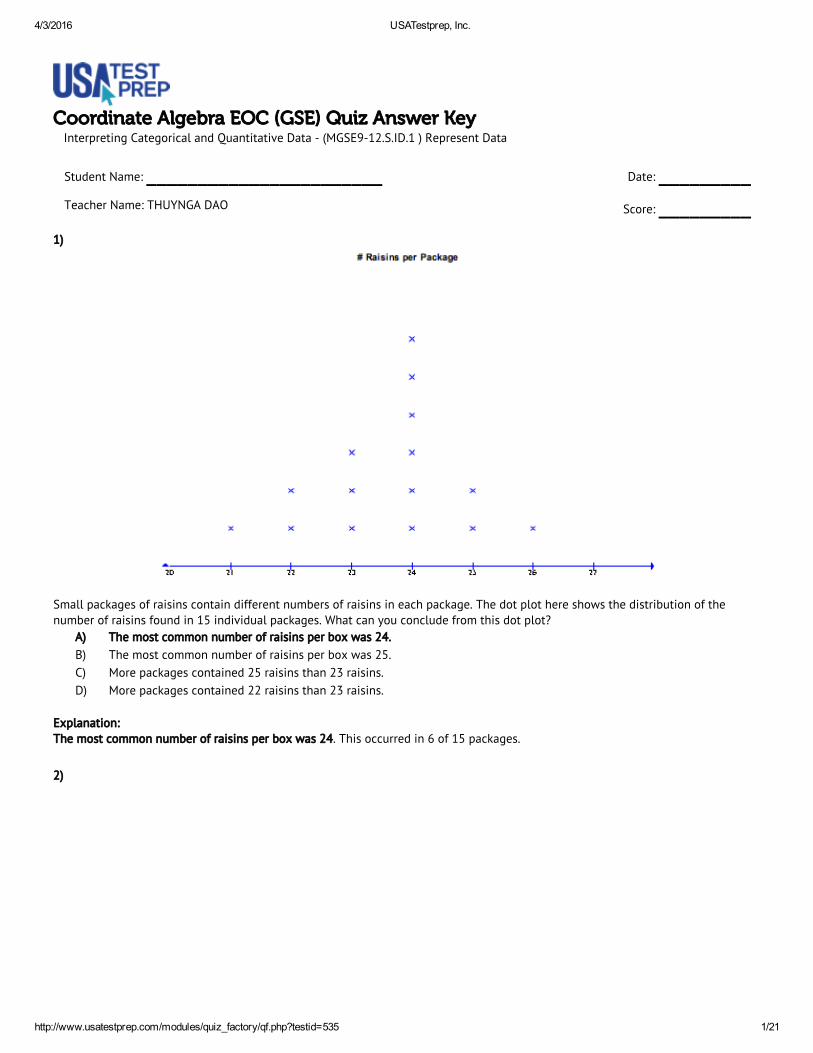
Small packages of raisins contain different numbers of raisins in each package. The dot plot here shows the distribution of thenumber of raisins found in 15 individual packages. What can you conclude from this dot plot?
A) The most common number of raisins per box was 24.
B) The most common number of raisins per box was 25.
C) More packages contained 25 raisins than 23 raisins.
D) More packages contained 22 raisins than 23 raisins.
Explanation:The most common number of raisins per box was 24. This occurred in 6 of 15 packages.
2)
4/3/2016 USATestprep, Inc.
http://www.usatestprep.com/modules/quiz_factory/qf.php?testid=535 2/21
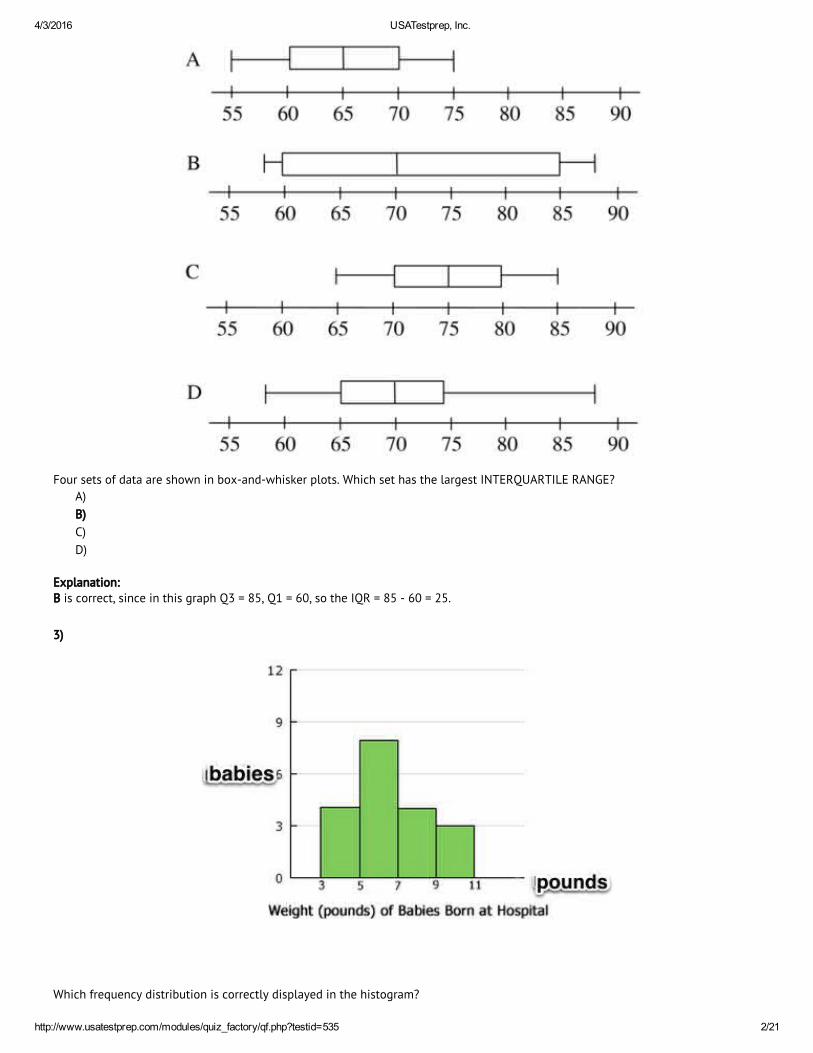
Four sets of data are shown in box-and-whisker plots. Which set has the largest INTERQUARTILE RANGE?
A)
B)
C)
D)
Explanation:B is correct, since in this graph Q3 = 85, Q1 = 60, so the IQR = 85 - 60 = 25.
3)
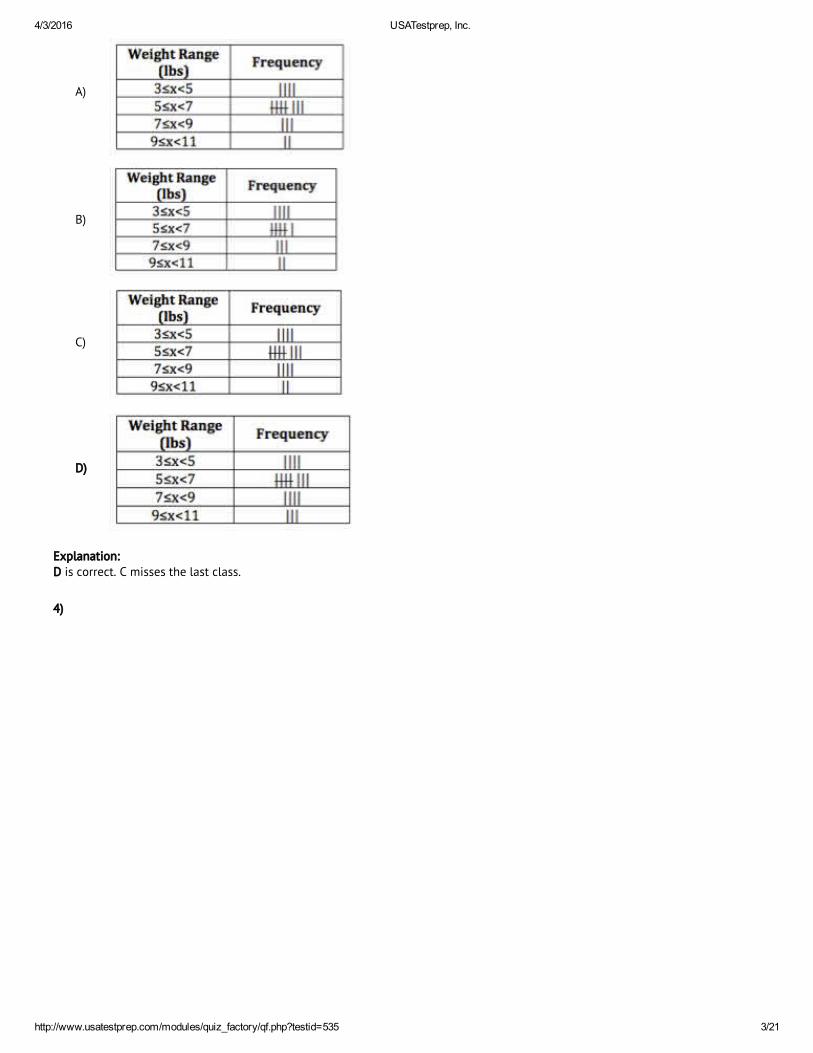
Which frequency distribution is correctly displayed in the histogram?
4/3/2016 USATestprep, Inc.
http://www.usatestprep.com/modules/quiz_factory/qf.php?testid=535 3/21
A)
B)
C)
D)
Explanation:D is correct. C misses the last class.
4)

4/3/2016 USATestprep, Inc.
http://www.usatestprep.com/modules/quiz_factory/qf.php?testid=535 4/21
Four sets of data are shown in box-and-whisker plots. Which set has the largest MEDIAN?
A)
B)
C)
D)
Explanation:C is correct, since in this graph the median line is at about 75.

4/3/2016 USATestprep, Inc.
http://www.usatestprep.com/modules/quiz_factory/qf.php?testid=535 5/21
5)
Four sets of data are shown in box-and-whisker plots. Which set has the largest 3rd Quartile value?
A)
B)
C)
D)
Explanation:B is correct, since in this graph the 3rd quartile line is at about 85.
6)
Mr. Gatlin had each of his students record how many pieces of pizza they ate during the class party.

4/3/2016 USATestprep, Inc.
http://www.usatestprep.com/modules/quiz_factory/qf.php?testid=535 6/21
How many more students ate 3 pieces of pizza than ate 5 pieces of pizza?
A) 2
B) 3
C) 4
D) 5
Explanation:The correct answer is 4. Find each number, then subtract.
7)
The prices (in dollars) of 50 randomly chosen types of shoes at 4 different stores are shown in the box plots. At which store would aperson MOST LIKELY pay $60 for a pair of shoes?
A)
B)
C)
D)
Explanation:Box plot C shows the most prices between $46 and $64. $60 is within this range. Box plot D also so $60 within its interquartilerange. However, the range is so large it is more likely that someone will pay $60 at store C.
8)
Temperature

4/3/2016 USATestprep, Inc.
http://www.usatestprep.com/modules/quiz_factory/qf.php?testid=535 7/21
Temperature(°F)
50 42 31 62 51 55 45
Which boxplot correctly displays the data in the set?
A)
B)
C)
D)
Explanation:B is correct. Be sure the min, max, and median match.

4/3/2016 USATestprep, Inc.
http://www.usatestprep.com/modules/quiz_factory/qf.php?testid=535 8/21
9)
Jenny recorded the weight of 5 dogs. Each dog weighed a different amount. She recorded the results on a box plot. Which conclusioncan be made about the interquartile range of Jenny’s box plot?
A) All the dogs weighed 15 pounds or less.
B) All the dogs weighed between 5 and 15 pounds.
C) The middle 50% of the dogs weighed between 5 and 15 pounds.
D) The interquartile range was higher than it should be because of the dog that weighed 20 pounds.
Explanation:The interquartile range tells you information about the middle 50% of the data. It is not affected by any outliers. Therefore thecorrect statement is The middle 50% of the dogs weighed between 5 and 15 pounds.
10)
The boxplots show sales data for Angela and Carl. Which conclusion can be CORRECTLY made about the interquartile ranges (IQRs)of their data?
A) No sure conclusion can be made.
B) Angela's IQR is larger than Carl's IQR.
C) Carl's IQR is larger than Angela's IQR.
D) Angela's and Carl's IQRs are about the same.

4/3/2016 USATestprep, Inc.
http://www.usatestprep.com/modules/quiz_factory/qf.php?testid=535 9/21
Explanation:Carl's IQR is larger than Angela's IQR. The shaded blue region of each boxplot shows the IQR, which is Q3 - Q1, where Q1 is thelower end and Q3 is the upper end of the region. Carl's is about 31, Angela's is about 24.
11)
Adam recorded the number of flower blooms on each of his ten rose bushes.
9, 10, 4, 12, 15, 17, 18, 10, 12, 13
If he combined the number of blooms into one data set, which box plot correctly displays the data?
A)
B)
C)
D)
Explanation:In order, the number of blooms are 4 9 10 10 12 12 13 15 17 18. The median is 12. The lower quartile is 10. The upper quartile is 15.The lowest value is 4 and the highest value is 18. This is reflected in box plot A.
12)
4/3/2016 USATestprep, Inc.
http://www.usatestprep.com/modules/quiz_factory/qf.php?testid=535 10/21
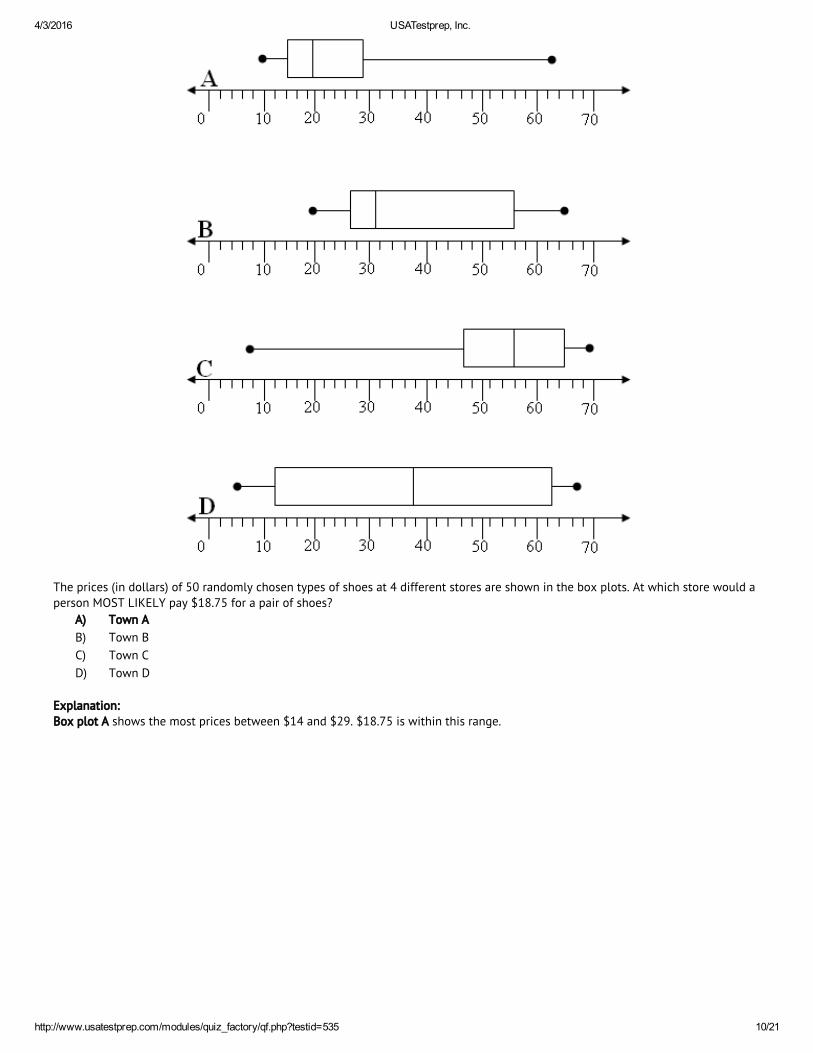
The prices (in dollars) of 50 randomly chosen types of shoes at 4 different stores are shown in the box plots. At which store would aperson MOST LIKELY pay $18.75 for a pair of shoes?
A) Town A
B) Town B
C) Town C
D) Town D
Explanation:Box plot A shows the most prices between $14 and $29. $18.75 is within this range.
4/3/2016 USATestprep, Inc.
http://www.usatestprep.com/modules/quiz_factory/qf.php?testid=535 11/21
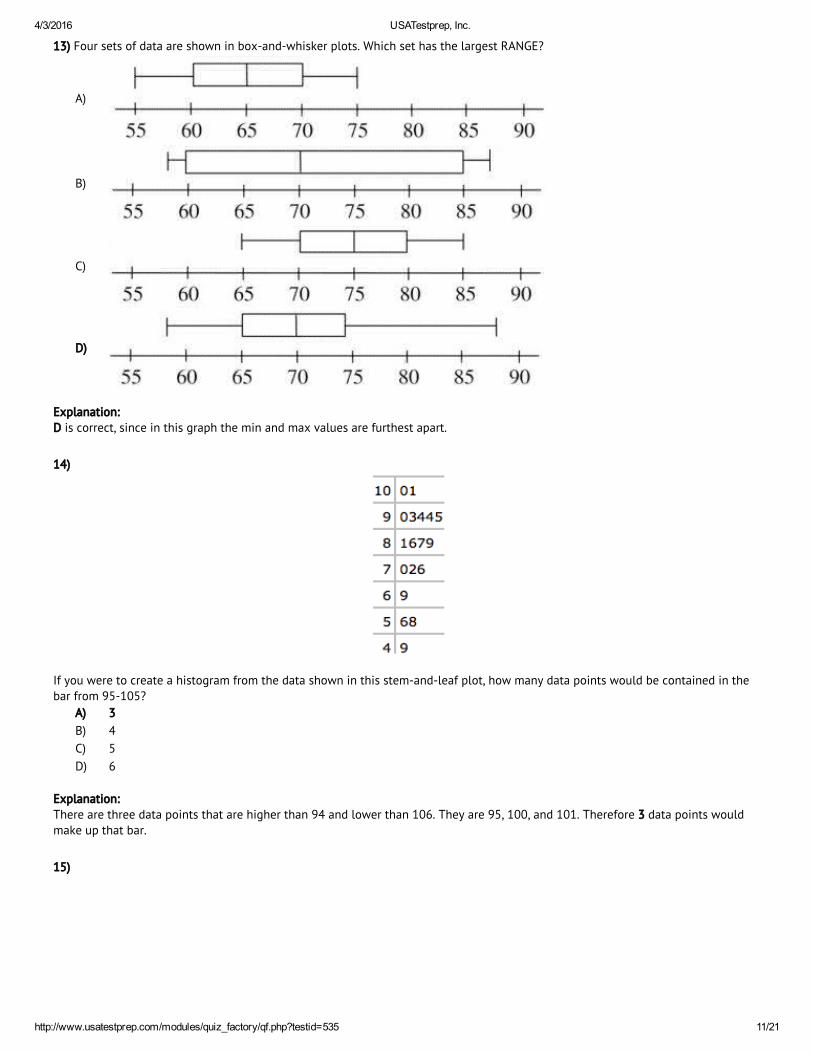
13) Four sets of data are shown in box-and-whisker plots. Which set has the largest RANGE?
A)
B)
C)
D)
Explanation:D is correct, since in this graph the min and max values are furthest apart.
14)
If you were to create a histogram from the data shown in this stem-and-leaf plot, how many data points would be contained in thebar from 95-105?
A) 3
B) 4
C) 5
D) 6
Explanation:There are three data points that are higher than 94 and lower than 106. They are 95, 100, and 101. Therefore 3 data points wouldmake up that bar.
15)

4/3/2016 USATestprep, Inc.
http://www.usatestprep.com/modules/quiz_factory/qf.php?testid=535 12/21
A doctor surveyed 100 people. She asked them how many caffeinated drinks the people consumed in a week. The results are shownin the box plot. Which is the BEST conclusion that could be made about the results?
A) The middle 50% of the people surveyed drink 6 caffeinated drinks a week.
B) The middle 50% of the people surveyed drink 4 to 6 caffeinated drinks a week.
C) The middle 50% of the people surveyed drink 4 to 10 caffeinated drinks a week.
D) The middle 50% of the people surveyed drink 0 to 19 caffeinated drinks a week.
Explanation:The interquartile range details information about the middle 50% of the data set. The interquartile range is from 4 to 10 drinks.Therefore, The middle 50% of the people surveyed drink 4 to 10 caffeinated drinks a week.
16) The interquartile range of a data set is 10 units. What does this represent?
A) There are 10 units below the lower quartile.
B) The median value of the data set must be 10 units.
C) There are 10 units between the upper and lower quartiles.
D) The middle 50% of the data in the set are less than 10 units.
Explanation:If the interquartile range is 10, then there are 10 units between the upper and lower quartiles.
17)
If you were to create a histogram from the data shown in this stem-and-leaf plot, with each bar covering six values from 13 to 42,which bar would not have any data points?
A) 13-18
B) 19-24
C) 25-30
D) 31-36
Explanation:
4/3/2016 USATestprep, Inc.
http://www.usatestprep.com/modules/quiz_factory/qf.php?testid=535 13/21
Bar covering values 25-30 would be empty, as there are no data points between 23 and 35.

4/3/2016 USATestprep, Inc.
http://www.usatestprep.com/modules/quiz_factory/qf.php?testid=535 14/21
18)
Mrs. Jones created a box plot from two of her classes (Data set 1 and 2) quiz scores. Which class, if any, had the smaller interquartilerange?
A) Data Set 1
B) Data set 2
C) The interquartile ranges are equal.
D) You cannot determine interquartile ranges from boxplots.
Explanation:Data set 2 has a smaller interquartile range. The box is more narrow for this class.
19)
Students are randomly pulling blocks of wood from a bag. The weights of the blocks are shown in the box-and-whisker plot. Whatcan the interquartile range tell the students about the weights of all the blocks in the bag?
A) Most of the blocks weigh 8 ounces.
B) The middle 50% of the blocks weigh less than 7 ounces.
C) The middle 50% of the blocks weigh more than 17 ounces.
D) The middle 50% of the blocks weigh between 7 and 17 ounces.
Explanation:The interquartile range represents the middle 50% of the blocks. Therefore, The middle 50% of the blocks weigh between 7 and 17ounces.
20) Suppose that, for a set of data, the range is x and the interquartile range is y. Which statement MUST be true?
A) x = y
B) x ≤ y
C) x ≥ y

4/3/2016 USATestprep, Inc.
http://www.usatestprep.com/modules/quiz_factory/qf.php?testid=535 15/21
D) x + y = 1
Explanation:x ≥ y is correct. Since x = MAX - MIN, and y = Q3 - Q1, and we know that Q3 and Q1 cannot be farther apart than MIN and MAX.
21)
If you were to create a histogram from the data shown in the stem-and-leaf plot, with each bar covering six values from 13 to 42,how many data points would be in the bar from 13 - 18?
A) 0
B) 1
C) 2
D) 4
Explanation:4 data points are between 13 and 18 they are 13, 14, 14, 15, and 18.
22)
Consider the characteristics of the center, shape, spread, and any unusual features. Which statement correctly describes the data?
A) There is an outlier at 7.
B) The mode and median are 7.
C) The range of the data is 10.
D) The data shows a positive skew.
Explanation:The mode and median are 7.

4/3/2016 USATestprep, Inc.
http://www.usatestprep.com/modules/quiz_factory/qf.php?testid=535 16/21
The median is the middle value of the numbers. The mode is the value that occurs most often.
4/3/2016 USATestprep, Inc.
http://www.usatestprep.com/modules/quiz_factory/qf.php?testid=535 17/21
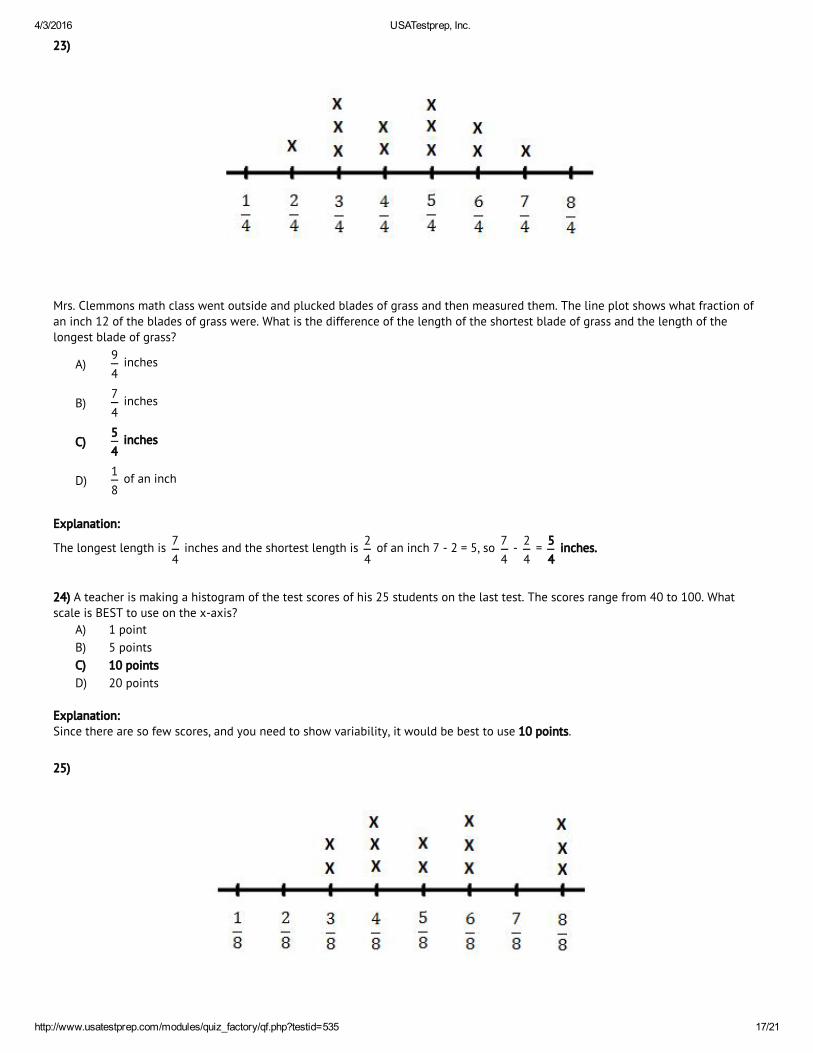
23)
Mrs. Clemmons math class went outside and plucked blades of grass and then measured them. The line plot shows what fraction ofan inch 12 of the blades of grass were. What is the difference of the length of the shortest blade of grass and the length of thelongest blade of grass?
A)9
4 inches
B)7
4 inches
C)5
4 inches
D)1
8 of an inch
Explanation:
The longest length is 7
4 inches and the shortest length is
2
4 of an inch 7 - 2 = 5, so
7
4 -
2
4 =
5
4 inches.
24) A teacher is making a histogram of the test scores of his 25 students on the last test. The scores range from 40 to 100. Whatscale is BEST to use on the x-axis?
A) 1 point
B) 5 points
C) 10 points
D) 20 points
Explanation:Since there are so few scores, and you need to show variability, it would be best to use 10 points.
25)
4/3/2016 USATestprep, Inc.
http://www.usatestprep.com/modules/quiz_factory/qf.php?testid=535 18/21
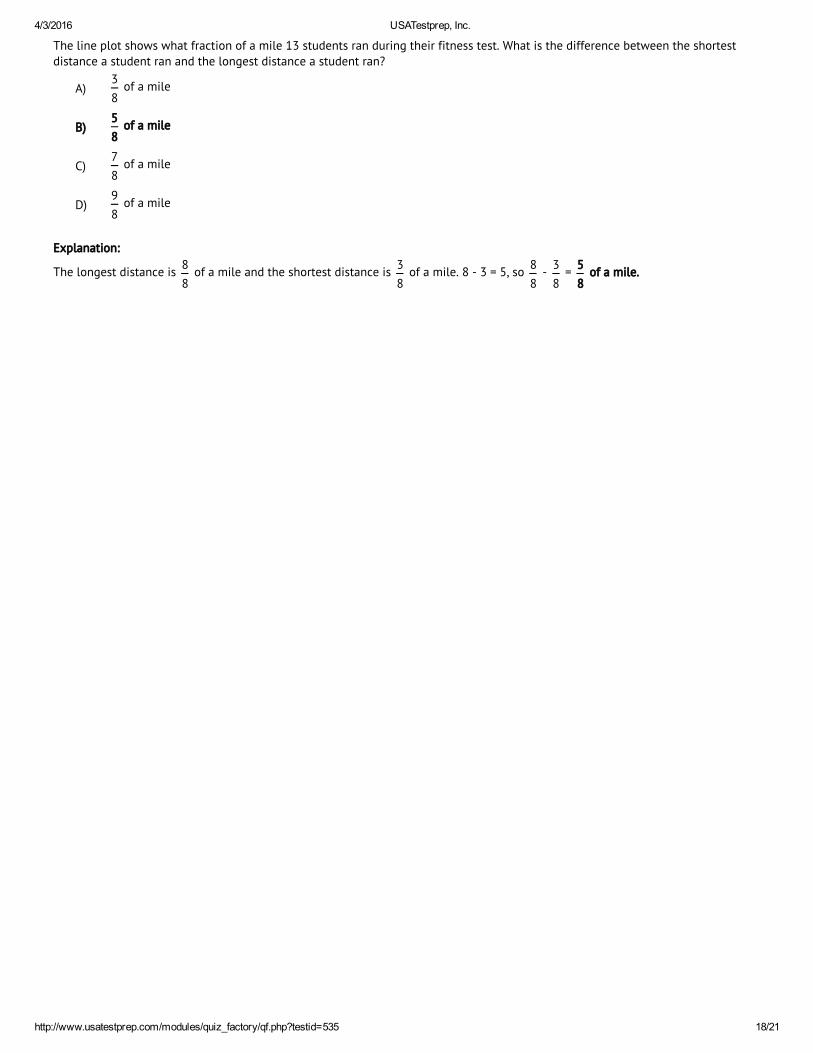
The line plot shows what fraction of a mile 13 students ran during their fitness test. What is the difference between the shortestdistance a student ran and the longest distance a student ran?
A)3
8 of a mile
B)5
8 of a mile
C)7
8 of a mile
D)9
8 of a mile
Explanation:
The longest distance is 8
8 of a mile and the shortest distance is
3
8 of a mile. 8 - 3 = 5, so
8
8 -
3
8 =
5
8 of a mile.

4/3/2016 USATestprep, Inc.
http://www.usatestprep.com/modules/quiz_factory/qf.php?testid=535 19/21
26)
Consider the characteristics of the center, shape, spread, and any unusual features. Which statement correctly describes the data?
A) There is an outlier at 3.
B) There is an outlier at 7.
C) The range of the data is 10.
D) There are outliers are at 3 and 10.
Explanation:There is an outlier at 3.
An outlier is a statistical observation that is markedly different in value from the others of the sample.
27)
The line plot shows what fraction of a mile 13 students ran during their fitness test. What is the sum of the shortest distance astudent ran and the longest distance a student ran?
A) 1 mile
B)5
8 of a mile
C)9
8 of a mile
D)11
8 of a mile
Explanation:
The longest distance is 8
8 of a mile and the shortest distance is
3
8 of a mile. 8 + 3 = 11, so
8
8 +
3
8 =
11
8 of a mile.

4/3/2016 USATestprep, Inc.
http://www.usatestprep.com/modules/quiz_factory/qf.php?testid=535 20/21
28) A football conference is making a histogram of number of points scored in each game by its 14 team for the 12 weeks each teamplayed (168 scores). The scores range from 0 to 70. What scale should be used for the x-axis?
A) 1 point
B) 5 points
C) 15 points
D) 20 points
Explanation:Since there are so many games,and a 70 point range, you should count by 5 points.
29)
For the data set summarized in the boxplot, identify the MEAN.
A) 57
B) 59
C) 57.5
D) not enough information
Explanation:not enough information is correct. The boxplot doesn't report the frequencies with which the values occur in the data set, so wecannot calculate the mean.
4/3/2016 USATestprep, Inc.
http://www.usatestprep.com/modules/quiz_factory/qf.php?testid=535 21/21
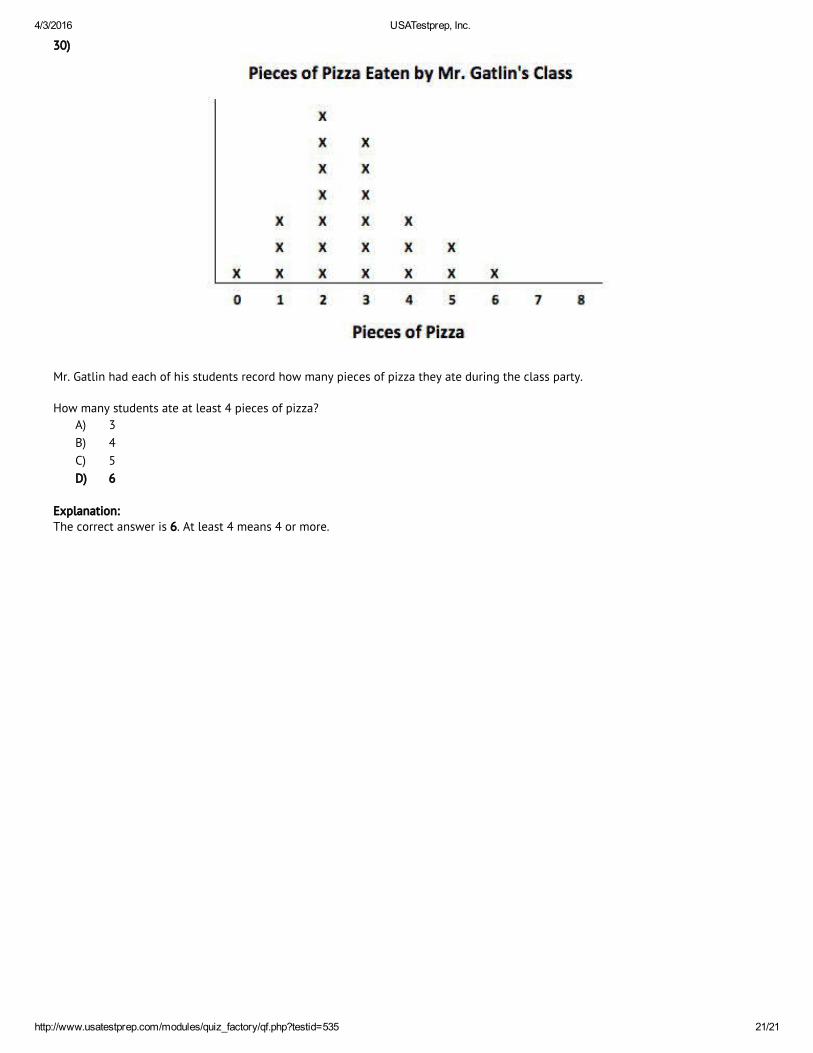
30)
Mr. Gatlin had each of his students record how many pieces of pizza they ate during the class party.
How many students ate at least 4 pieces of pizza?
A) 3
B) 4
C) 5
D) 6
Explanation:The correct answer is 6. At least 4 means 4 or more.