PDF (1.63 MB) - IOPscience
9
Journal of Physics: Conference Series OPEN ACCESS Quench nucleation obtained by local reduction of I c in coated conductors To cite this article: F Roy et al 2010 J. Phys.: Conf. Ser. 234 032050 View the article online for updates and enhancements. You may also like Theoretical estimation of quench occurrence and propagation based on generalized thermoelasticity for LTS/HTS tapes triggered by a spot heater Yujin Tong, Mingzhi Guan and Xingzhe Wang - Feasible voltage-tap based quench detection in a Ag/Bi-2212 coil enabled by fast 3D normal zone propagation Tengming Shen, Liyang Ye and Pei Li - SMART conductor on round core (CORC ® ) wire via integrated optical fibers F Scurti, J D Weiss, D C van der Laan et al. - Recent citations Stability of DC transport in HTS conductor with local critical current reduction Fedor Gömöry and Ján Šouc - Engineering of second generation HTS coated conductor architecture to enhance the normal zone propagation velocity in various operating conditions C Lacroix et al - Multi-scale model of resistive-type superconducting fault current limiters based on 2G HTS coated conductors Charles-Henri Bonnard et al - This content was downloaded from IP address 108.168.3.151 on 21/12/2021 at 06:11
Transcript of PDF (1.63 MB) - IOPscience

Journal of Physics Conference Series
OPEN ACCESS
Quench nucleation obtained by local reduction ofIc in coated conductors
To cite this article F Roy et al 2010 J Phys Conf Ser 234 032050
View the article online for updates and enhancements
You may also likeTheoretical estimation of quenchoccurrence and propagation based ongeneralized thermoelasticity for LTSHTStapes triggered by a spot heaterYujin Tong Mingzhi Guan and XingzheWang
-
Feasible voltage-tap based quenchdetection in a AgBi-2212 coil enabled byfast 3D normal zone propagationTengming Shen Liyang Ye and Pei Li
-
SMART conductor on round core(CORCreg) wire via integrated optical fibersF Scurti J D Weiss D C van der Laan etal
-
Recent citationsStability of DC transport in HTS conductorwith local critical current reductionFedor Goumlmoumlry and Jaacuten Šouc
-
Engineering of second generation HTScoated conductor architecture to enhancethe normal zone propagation velocity invarious operating conditionsC Lacroix et al
-
Multi-scale model of resistive-typesuperconducting fault current limitersbased on 2G HTS coated conductorsCharles-Henri Bonnard et al
-
This content was downloaded from IP address 1081683151 on 21122021 at 0611
Quench nucleation obtained by local reduction of Ic
in coated conductors
F Roy1 B Dutoit1 and F Sirois2
1 EPFL Ecole polytechnique federale de Lausanne Lausanne 1015 Switzerland2 Ecole polytechnique de Montreal Montreal QC H3C 3A7 Canada
E-mail francoisroyepflch
Abstract The normal zone propagation velocity in coated conductors is very small compareto YBCO on sapphire For fault current limiter it is more difficult to use them and obtainpredictable behaviors under electrical faults In the present work we have measured thenormal zone propagation on short coated conductors samples submitted to current pulses ofvariable length and amplitude (from 10-500 ms and asymp09-20 Ic respectively) The normal zonenucleation is obtained using a magnetic tip to reduce locally the critical current density ofthe tape This reproducible technique allows to choose and modify the initial nucleation siteposition as well as to perform multiple experiments on the same sample without making anyphysical defect on the conductor The normal zone propagation measurements as well as thecharacteristic shape of the resulting I-V curves obtained from various current pulse waveformsare presented here From the experiments it is shown that field-induced defects allow to increasethe normal zone propagation velocity as well as to reduce the initial delay before quenches incoated conductors In addition sub-cooled measurements have shown that an increase of theheat diffusivity obtained by lowering the coolant temperature improve the quench propagation
1 IntroductionThe overall growing needs of electrical energy as well as the increased interconnections ofthe actualfuture grids lead to higher fault currents This has the consequence that in thenear future networks may reach or even exceed their limits with respect to the short-circuitcurrent withstand capability of actual protection devices [1] Accordingly there are many effortsdeployed to incorporate new technologies from those that have been traditionally installed tomodernize aging-electrical grids and make them more secure and efficient Superconductingpower equipment as fault current limiters (FCLs) could be an important element in thoseefforts [2 3]
Up to now some of the promising FCLs projects are plan to use coated conductors ascurrent limiting component [4] Besides the actual producing cost of such conductors oneof the important issue related to their prospective use is the difficulty to anticipate and preventdestructive quenches as well as to ensure a uniform transition of the superconductor over itsentire length The ability of conductors to quench uniformly is characterized by the normalzone propagation velocity (NZPV) There are several ways to act on the NZPV eg acting onsubstrate thermal properties [5 6] stabilizer architecture [7] interfacial resistance [8] or troughshunts configurations [9 10] In the present work we investigate the influence of field-induced-defects and of the coolant temperature on the normal zone propagation
9th European Conference on Applied Superconductivity (EUCAS 09) IOP PublishingJournal of Physics Conference Series 234 (2010) 032050 doi1010881742-65962343032050
ccopy 2010 IOP Publishing Ltd 1
2 Experimental setupMeasurements of the NZPV are made on 4 mm-wide 50 mm-long coated conductors providedby SuperPowerinc having basically the structure HastelloyRcopyMgOYBCOAg ndash see productdatasheet SF4050 [11] The experimental setup is based on a typical voltage taps arrangementndash see figure 1 in which quenches are monitored through 16 thin aluminum wires (diameterasymp 100 microm) soldered at the tape center Each wire is disposed approximately 25 plusmn 02 mmapart along the tapes length allowing voltage measurements at the terminals of 15 equallyspaced sections of the conductor
Samples are submitted to current-driven pulses of different amplitude and duration ie 80-175 A and 10-500 ms respectively Quench nucleation is obtained using a small permenormRcopyelectromagnet used to create non-destructive variable-size field-induced defects in one of the 15wire-delimited sections of the tape In order to reach a reasonable magnetic field the magnetcoil is made of 610 turns of 02 mm diameter-size copper wires Using coil current (Im) in therange 05-2 A we measured the localized DC magnetic flux with a small movable cryogenicHall probe (0127times0127 mm2 active area) controlled by a steeper motor placed at the exteriorof the cryostat The magnetic flux obtained from the coil has shown to be as large as 225 mTndash see figure 2 Considering the inset in figure 2 which is the field dependance of the criticalcurrent [11] we estimate the reduction of Ic to be as large as 70 for the section being in themagnet air-gap All our data acquisition and controls are realized with a standard NationalInstruments M-series DAQ card [12] allowing a 16-bits quasi-simultaneous voltage monitoringof the sections with a sampling rate up to 125 kSchannel
The measurements methodology is as follows defects in tapes are produced using a localizedDC magnetic field During the imposition of transport-current pulses quenches are initiated inthe magnet air-gap where the external magnetic flux is maximum Due to current redistributionand heat generation the normal zone start to propagates in the sections adjacent to the coilair-gap building up an electric potential difference between the end-taps of the correspondingsections This voltage directly associated to the normal state arising in the material gives anestimate of the transition dynamics occurring during the current pulses
Figure 3 illustrates typical time-resolved voltage traces obtained during the experiments An
5 mm
S11 S10
Figure 1 Voltage taps (16 overall) are asymp 25 plusmn 02 mm apart and made of 100 microm aluminumwire to reduce probe artifacts on the measurements The permenormRcopy coil is made of 610 turnsof 02 mm diameter-size copper wire On the left picture S11 and S10 represent wire-delimitedsections (respectively sections 11 and 10) for which the voltage is monitored ndash see for examplefigure 3
9th European Conference on Applied Superconductivity (EUCAS 09) IOP PublishingJournal of Physics Conference Series 234 (2010) 032050 doi1010881742-65962343032050
2
minus8 minus6 minus4 minus2 00
50
100
150
200
250
111098M
ag
ne
tic flu
x (
mT
)
Position (mm)
Im
=025A
Im
=050A
Im
=075A
Im
=100A
Im
=150A
Im
=200A 0 200 400
02
04
06
08
1
B (mT)Ic
(B)
Ic0
77K measurements [11]Kimrsquos law B
0=130mT
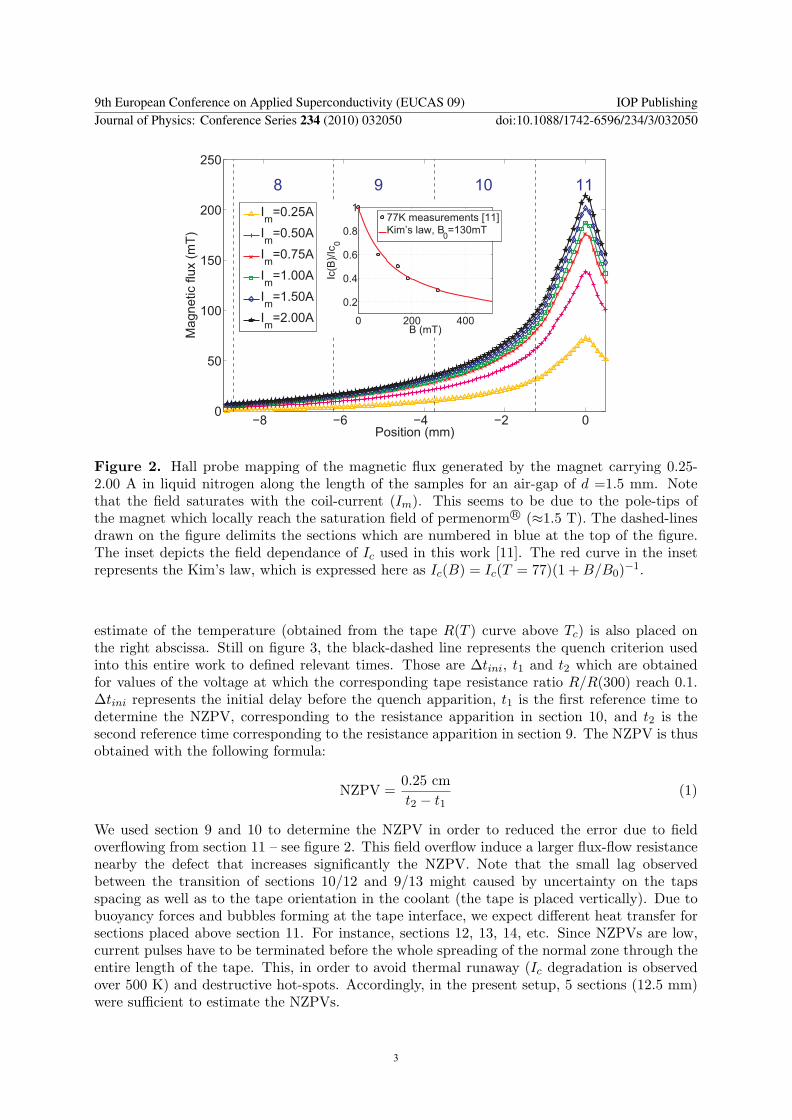
Figure 2 Hall probe mapping of the magnetic flux generated by the magnet carrying 025-200 A in liquid nitrogen along the length of the samples for an air-gap of d =15 mm Notethat the field saturates with the coil-current (Im) This seems to be due to the pole-tips ofthe magnet which locally reach the saturation field of permenormRcopy (asymp15 T) The dashed-linesdrawn on the figure delimits the sections which are numbered in blue at the top of the figureThe inset depicts the field dependance of Ic used in this work [11] The red curve in the insetrepresents the Kimrsquos law which is expressed here as Ic(B) = Ic(T = 77)(1 + BB0)minus1
estimate of the temperature (obtained from the tape R(T ) curve above Tc) is also placed onthe right abscissa Still on figure 3 the black-dashed line represents the quench criterion usedinto this entire work to defined relevant times Those are ∆tini t1 and t2 which are obtainedfor values of the voltage at which the corresponding tape resistance ratio RR(300) reach 01∆tini represents the initial delay before the quench apparition t1 is the first reference time todetermine the NZPV corresponding to the resistance apparition in section 10 and t2 is thesecond reference time corresponding to the resistance apparition in section 9 The NZPV is thusobtained with the following formula
NZPV =025 cmt2 minus t1
(1)
We used section 9 and 10 to determine the NZPV in order to reduced the error due to fieldoverflowing from section 11 ndash see figure 2 This field overflow induce a larger flux-flow resistancenearby the defect that increases significantly the NZPV Note that the small lag observedbetween the transition of sections 1012 and 913 might caused by uncertainty on the tapsspacing as well as to the tape orientation in the coolant (the tape is placed vertically) Due tobuoyancy forces and bubbles forming at the tape interface we expect different heat transfer forsections placed above section 11 For instance sections 12 13 14 etc Since NZPVs are lowcurrent pulses have to be terminated before the whole spreading of the normal zone through theentire length of the tape This in order to avoid thermal runaway (Ic degradation is observedover 500 K) and destructive hot-spots Accordingly in the present setup 5 sections (125 mm)were sufficient to estimate the NZPVs
9th European Conference on Applied Superconductivity (EUCAS 09) IOP PublishingJournal of Physics Conference Series 234 (2010) 032050 doi1010881742-65962343032050
3
0 5 10 15 200
01
02
03
04
05
t1
t2
larr ∆tinirarr
400
300
200
100
time (ms)
Vo
lta
ge
(V
)
8
9
10
11M
12
13
14
criterion
T (
K)
NZPV= =34 cms025minust
1 t
2
0 10 200
50
100
150
time (ms)
Cu
rre
nt (A
)
Figure 3 Typical time-resolved voltage measurements for a current pulse of 140 A and 20 msof duration (see the waveform in the inset) Each curve represents the resistance increase comingfrom the builded-up electrical field generated in the sections Section 11 (labeled with a ldquoMrdquo)is the section in which the magnet is located The NZPV is obtained using equation 1 TheDC current in the coil (Im) is 2 A and the air-gap 1 mm The black-dashed line represents thequench criterion corresponding to R =01R(300)
3 ResultsThe first thing to note from figure 3 is that as expected the first section presenting a growingvoltage is the section in which the magnet is located (section 11 orange curve) followed by theadjacent sections ie 1012 913 etc One may also notice that all the curves presented in thefigure show a kink The kink appearing on all curves is observed once the section under studybecomes fully normal (confirmed by numerical simulations) Since the magnetic field generatedby the coil (Ic reduction) is more intense in section 11 ndash see figure 2 the kink is observed ata smaller temperature in this section than in the others Considering the relatively long tapspacing (25 mm) we expect the temperature to be not uniform across the whole sections Oncethe farthest end (from the defect) of a section transit to the normal state the closest end alreadyat a temperature above Tc Nevertheless the voltages monitored during experiments representan average of the sections temperatures This averaging artifact may explain the discrepancyobserve in the transition temperature (around 160 K instead of 90 K) This phenomenon isemphasized by the low NZPV values observed in coated conductors This is further supportedby the fact that adjacents sections begin to show potential difference once the former sectionsare fully normal ie just after the kink appears without overlap meaning that the normal zonefront is very steep
Figure 4 shows NZPV obtained by varying current pulses amplitude and duration for differentDC coil-currents According to this figure one can notice that the velocities have about twicethe magnitude than that usually found in literature for similar tape ndash see for example [13]This is explained by the absence of the copper clad usually present on commercial tape aswell as to the magnetic field overflowing from section 11 that we supposed respectively helpsto reduce heat generation during the current pulse and increases the flux-flow resistance alongthe tape length Besides this fact figure 4 shows that over 120 A (asymp14 Ic) the effect of thecoil current (localized magnetic field) is more important than at lower current pulses where
9th European Conference on Applied Superconductivity (EUCAS 09) IOP PublishingJournal of Physics Conference Series 234 (2010) 032050 doi1010881742-65962343032050
4
80 100 120 140 160 1800
10
20
30
40
50
60
70
80
I (A)
NZ
PV
(cm
s)
Ic0
093 116 140 163 186 209
Im
=050A
Im
=060A
Im
=075A
Im
=100A
Im
=150A
Im
=200A
IIc0
Figure 4 NZPV as a function of current pulse amplitude (the top axis displays the normalizedcurrent ie IIc0) Im is the DC current passing through the magnet The magnet air-gap is1 mm Note that the critical current without any defect is Ic0=86 A [11] At I = Ic0 the NZPVis approximately 11 plusmn 1 cms for any field-induced defect
the NZPVs seems independent of the defect strength (Im) This feature may come from ohmiclosses occurring in the silver shunt once the superconductor has transited As a matter of factan increase of the defects strength allows more current to be diverted into the shunt whichcontributes additional heat and thus increases the velocities Since losses are proportional toRI2 the effect of the magnetic flux becomes less apparent at lower pulse amplitude we believethat the NZPV is roughly proportional to Joule losses occurring in the tape
Another important feature observed from voltage traces is the time needed for the normalzone to appears in the samples Following figure 5 it can be shown that at currents below140 A smaller defects take more time to make section 11 transiting (large ∆tini) In fact mostof the samples that were burned during experiments was at low transport-current pulses (belowthe sample Ic not below the defect Ic) The energy injected in the tape being proportional topulses duration the flux-flow resistance developing along the length of the conductor was largeenough to burn those samples This initial time is of primary concerns for making FCLs sinceduring faults meters of conductors must quench quickly in order to rapidly detect and interruptthe electrical fault This is particularly true if the prospected FCL must deal with transientcurrents in the range of the critical current
Finally thermal effects on the NZPV were observed in sub-cooled liquid nitrogen (at ambientpressure) Figure 6 shows velocities obtained for transport current pulses of 150 A with coil-current of 2 A For this particular current value a considerable reduction of the NZPVs withthe bath temperature is observed However if we consider the temperature dependance of Ic
(see top axis) the NZPVs are larger in comparison with experiments made at 77 K for the samenormalized current IIc (figure 4) The improvement is approximately equals to 30 and 115at I =142Ic and I =162Ic respectively In fact the reduction of the temperature improves thethermal diffusivity (reduces the heat capacity) of the substrate [14] and also diminish the heat
9th European Conference on Applied Superconductivity (EUCAS 09) IOP PublishingJournal of Physics Conference Series 234 (2010) 032050 doi1010881742-65962343032050
5
80 100 120 140 160 1800
10
20
30
40
50
60
I (A)
∆t in
i (m
s)
093 116 140 163 186 209
Im
=050
Im
=060
Im
=075
Im
=100
Im
=150
Im
=200
IIc0
Figure 5 Initial time before quenching (∆tini) for a magnet air-gap of 1 mm Long initialtimes make the propagation hard to achieve and lead to hot-spots
71 72 73 74 75 76 77 7825
30
35
40
45
50119 126 133 142 151 162 174 189
T (K)
NZ
PV
(cm
s)
Im
=200A
IIc(T)
Figure 6 NZPVs for a sub-cooled tape This measurement was done by reducing the pressureinto the cryostat which in turn induces the temperature reduction Once the minimumtemperature was reached the ambiant pressure was reestablished inside the cryostat Then theresponse to current pulses of 150 A with Im=2 was monitored at every 10 seconds during thebath warming-up (asymp10 minutes) The top axis shows the normalized current (IcIc(T )) obtainedfrom a linear extrapolation ie Ic(T ) = Ic0(Tc minus T )(TC minus T0)minus1 T0=77 K and Tc=90 K
9th European Conference on Applied Superconductivity (EUCAS 09) IOP PublishingJournal of Physics Conference Series 234 (2010) 032050 doi1010881742-65962343032050
6
transfer [15] expected at such time-scale (tens of ms) This improve the propagation velocitiesand confirms our belief that the NZP is mostly a thermal effect
4 ConclusionThe present work shows that field-induced defects can improve the normal zone propagationvelocity Considering the NZP to be mostly a thermal effect we believe that the improvementis related to the local reduction of Ic and consequently to the additional heat generated inthe stabilizer Results also showed that induced-defects can reduced the initial delay beforequench propagation in coated conductors begins and make them more prompt to respond to anelectrical fault This is particularly true for currents in the range of Ic From the experimentspresented here sub-cooled experiments have shown that lowering the bath temperature causesan improvement in the NZPVs considering normalized currents This confirms that the NZPis mostly a thermal effect since this improvement seems to originates from the increase of theheat diffusion arising with the reduction of the coolant temperature
AcknowledgmentsThis work was partly supported by the Swiss National Science Foundation through the NationalCenter of Competence in Research ldquoMaterials with Novel Electronic Properties-MaNEPrdquo andpartly by the Natural Sciences and Engineering Research Council of Canada-NSERC Theauthors also thank SuperPower for providing the samples used in this experiment as well asDr Louis Antognazza Dr Michel Decroux and Dr Mathieu Therasse for useful discussionsabout the interpretation of the results
References[1] Electric Power Research Institute (EPRI) 2006 Fault current management guidebook -
updated EPRI Palo Alto CA 1012419 URL wwwmyepricom[2] Noe M and Steurer M 2007 Supercond Sci Technol 20 R15[3] International Council on Large Electric Systems (CIGRE) Working group (WG A316) 2008
Fault current limiters -Impact on existing and new protection schemes Technical brochureNo 339
[4] Electric Power Research Institute (EPRI) 2008 Survey of fault current limiter (FCL)technologies update EPRI Palo Alto CA 1016389 URL wwwmyepricom
[5] Antognazza L Therasse M Decroux M Roy F Dutoit B Abplanalp M and Fischer O 2009IEEE Trans Appl Supercond 19 1960
[6] Roy F Perez S Therasse M Dutoit B Sirois F Decroux M and Antognazza L 2009Physica C 469 1462
[7] Wang X Trociewitz U P and Schwartz J 2009 Supercond Sci Technol 22 085005[8] Levin G A Barnes P N Rodriguez J P Connors J A and Bulmer J S 2009 IEEE Trans
Appl Supercond 19 2504[9] Prusseit W Kinder H Handke J Noe M Kudymow A and Goldacker W 2006 Physica C
665[10] Arai K Yamasaki H Kaiho K Furuse M Nakagawa Y Sohma M and Yamaguchi I 2008 J
Phys Conf Ser 97 012031[11] SuperPower 2009 URL wwwsuperpower-inccom[12] National Instruments 2009 URL wwwnicom[13] Wang X Trociewitz U P and Schwartz J 2007 J Appl Phys 101 053904[14] Lu J Choi E S and Zhou H D 2008 J Appl Phys 103 064908
9th European Conference on Applied Superconductivity (EUCAS 09) IOP PublishingJournal of Physics Conference Series 234 (2010) 032050 doi1010881742-65962343032050
7
[15] Tixador P Cointe Y Nguyen N T and Villard C 2009 IEEE Trans Appl Supercond 191938
9th European Conference on Applied Superconductivity (EUCAS 09) IOP PublishingJournal of Physics Conference Series 234 (2010) 032050 doi1010881742-65962343032050
8

Quench nucleation obtained by local reduction of Ic
in coated conductors
F Roy1 B Dutoit1 and F Sirois2
1 EPFL Ecole polytechnique federale de Lausanne Lausanne 1015 Switzerland2 Ecole polytechnique de Montreal Montreal QC H3C 3A7 Canada
E-mail francoisroyepflch
Abstract The normal zone propagation velocity in coated conductors is very small compareto YBCO on sapphire For fault current limiter it is more difficult to use them and obtainpredictable behaviors under electrical faults In the present work we have measured thenormal zone propagation on short coated conductors samples submitted to current pulses ofvariable length and amplitude (from 10-500 ms and asymp09-20 Ic respectively) The normal zonenucleation is obtained using a magnetic tip to reduce locally the critical current density ofthe tape This reproducible technique allows to choose and modify the initial nucleation siteposition as well as to perform multiple experiments on the same sample without making anyphysical defect on the conductor The normal zone propagation measurements as well as thecharacteristic shape of the resulting I-V curves obtained from various current pulse waveformsare presented here From the experiments it is shown that field-induced defects allow to increasethe normal zone propagation velocity as well as to reduce the initial delay before quenches incoated conductors In addition sub-cooled measurements have shown that an increase of theheat diffusivity obtained by lowering the coolant temperature improve the quench propagation
1 IntroductionThe overall growing needs of electrical energy as well as the increased interconnections ofthe actualfuture grids lead to higher fault currents This has the consequence that in thenear future networks may reach or even exceed their limits with respect to the short-circuitcurrent withstand capability of actual protection devices [1] Accordingly there are many effortsdeployed to incorporate new technologies from those that have been traditionally installed tomodernize aging-electrical grids and make them more secure and efficient Superconductingpower equipment as fault current limiters (FCLs) could be an important element in thoseefforts [2 3]
Up to now some of the promising FCLs projects are plan to use coated conductors ascurrent limiting component [4] Besides the actual producing cost of such conductors oneof the important issue related to their prospective use is the difficulty to anticipate and preventdestructive quenches as well as to ensure a uniform transition of the superconductor over itsentire length The ability of conductors to quench uniformly is characterized by the normalzone propagation velocity (NZPV) There are several ways to act on the NZPV eg acting onsubstrate thermal properties [5 6] stabilizer architecture [7] interfacial resistance [8] or troughshunts configurations [9 10] In the present work we investigate the influence of field-induced-defects and of the coolant temperature on the normal zone propagation
9th European Conference on Applied Superconductivity (EUCAS 09) IOP PublishingJournal of Physics Conference Series 234 (2010) 032050 doi1010881742-65962343032050
ccopy 2010 IOP Publishing Ltd 1
2 Experimental setupMeasurements of the NZPV are made on 4 mm-wide 50 mm-long coated conductors providedby SuperPowerinc having basically the structure HastelloyRcopyMgOYBCOAg ndash see productdatasheet SF4050 [11] The experimental setup is based on a typical voltage taps arrangementndash see figure 1 in which quenches are monitored through 16 thin aluminum wires (diameterasymp 100 microm) soldered at the tape center Each wire is disposed approximately 25 plusmn 02 mmapart along the tapes length allowing voltage measurements at the terminals of 15 equallyspaced sections of the conductor
Samples are submitted to current-driven pulses of different amplitude and duration ie 80-175 A and 10-500 ms respectively Quench nucleation is obtained using a small permenormRcopyelectromagnet used to create non-destructive variable-size field-induced defects in one of the 15wire-delimited sections of the tape In order to reach a reasonable magnetic field the magnetcoil is made of 610 turns of 02 mm diameter-size copper wires Using coil current (Im) in therange 05-2 A we measured the localized DC magnetic flux with a small movable cryogenicHall probe (0127times0127 mm2 active area) controlled by a steeper motor placed at the exteriorof the cryostat The magnetic flux obtained from the coil has shown to be as large as 225 mTndash see figure 2 Considering the inset in figure 2 which is the field dependance of the criticalcurrent [11] we estimate the reduction of Ic to be as large as 70 for the section being in themagnet air-gap All our data acquisition and controls are realized with a standard NationalInstruments M-series DAQ card [12] allowing a 16-bits quasi-simultaneous voltage monitoringof the sections with a sampling rate up to 125 kSchannel
The measurements methodology is as follows defects in tapes are produced using a localizedDC magnetic field During the imposition of transport-current pulses quenches are initiated inthe magnet air-gap where the external magnetic flux is maximum Due to current redistributionand heat generation the normal zone start to propagates in the sections adjacent to the coilair-gap building up an electric potential difference between the end-taps of the correspondingsections This voltage directly associated to the normal state arising in the material gives anestimate of the transition dynamics occurring during the current pulses
Figure 3 illustrates typical time-resolved voltage traces obtained during the experiments An
5 mm
S11 S10
Figure 1 Voltage taps (16 overall) are asymp 25 plusmn 02 mm apart and made of 100 microm aluminumwire to reduce probe artifacts on the measurements The permenormRcopy coil is made of 610 turnsof 02 mm diameter-size copper wire On the left picture S11 and S10 represent wire-delimitedsections (respectively sections 11 and 10) for which the voltage is monitored ndash see for examplefigure 3
9th European Conference on Applied Superconductivity (EUCAS 09) IOP PublishingJournal of Physics Conference Series 234 (2010) 032050 doi1010881742-65962343032050
2
minus8 minus6 minus4 minus2 00
50
100
150
200
250
111098M
ag
ne
tic flu
x (
mT
)
Position (mm)
Im
=025A
Im
=050A
Im
=075A
Im
=100A
Im
=150A
Im
=200A 0 200 400
02
04
06
08
1
B (mT)Ic
(B)
Ic0
77K measurements [11]Kimrsquos law B
0=130mT
Figure 2 Hall probe mapping of the magnetic flux generated by the magnet carrying 025-200 A in liquid nitrogen along the length of the samples for an air-gap of d =15 mm Notethat the field saturates with the coil-current (Im) This seems to be due to the pole-tips ofthe magnet which locally reach the saturation field of permenormRcopy (asymp15 T) The dashed-linesdrawn on the figure delimits the sections which are numbered in blue at the top of the figureThe inset depicts the field dependance of Ic used in this work [11] The red curve in the insetrepresents the Kimrsquos law which is expressed here as Ic(B) = Ic(T = 77)(1 + BB0)minus1
estimate of the temperature (obtained from the tape R(T ) curve above Tc) is also placed onthe right abscissa Still on figure 3 the black-dashed line represents the quench criterion usedinto this entire work to defined relevant times Those are ∆tini t1 and t2 which are obtainedfor values of the voltage at which the corresponding tape resistance ratio RR(300) reach 01∆tini represents the initial delay before the quench apparition t1 is the first reference time todetermine the NZPV corresponding to the resistance apparition in section 10 and t2 is thesecond reference time corresponding to the resistance apparition in section 9 The NZPV is thusobtained with the following formula
NZPV =025 cmt2 minus t1
(1)
We used section 9 and 10 to determine the NZPV in order to reduced the error due to fieldoverflowing from section 11 ndash see figure 2 This field overflow induce a larger flux-flow resistancenearby the defect that increases significantly the NZPV Note that the small lag observedbetween the transition of sections 1012 and 913 might caused by uncertainty on the tapsspacing as well as to the tape orientation in the coolant (the tape is placed vertically) Due tobuoyancy forces and bubbles forming at the tape interface we expect different heat transfer forsections placed above section 11 For instance sections 12 13 14 etc Since NZPVs are lowcurrent pulses have to be terminated before the whole spreading of the normal zone through theentire length of the tape This in order to avoid thermal runaway (Ic degradation is observedover 500 K) and destructive hot-spots Accordingly in the present setup 5 sections (125 mm)were sufficient to estimate the NZPVs
9th European Conference on Applied Superconductivity (EUCAS 09) IOP PublishingJournal of Physics Conference Series 234 (2010) 032050 doi1010881742-65962343032050
3
0 5 10 15 200
01
02
03
04
05
t1
t2
larr ∆tinirarr
400
300
200
100
time (ms)
Vo
lta
ge
(V
)
8
9
10
11M
12
13
14
criterion
T (
K)
NZPV= =34 cms025minust
1 t
2
0 10 200
50
100
150
time (ms)
Cu
rre
nt (A
)
Figure 3 Typical time-resolved voltage measurements for a current pulse of 140 A and 20 msof duration (see the waveform in the inset) Each curve represents the resistance increase comingfrom the builded-up electrical field generated in the sections Section 11 (labeled with a ldquoMrdquo)is the section in which the magnet is located The NZPV is obtained using equation 1 TheDC current in the coil (Im) is 2 A and the air-gap 1 mm The black-dashed line represents thequench criterion corresponding to R =01R(300)
3 ResultsThe first thing to note from figure 3 is that as expected the first section presenting a growingvoltage is the section in which the magnet is located (section 11 orange curve) followed by theadjacent sections ie 1012 913 etc One may also notice that all the curves presented in thefigure show a kink The kink appearing on all curves is observed once the section under studybecomes fully normal (confirmed by numerical simulations) Since the magnetic field generatedby the coil (Ic reduction) is more intense in section 11 ndash see figure 2 the kink is observed ata smaller temperature in this section than in the others Considering the relatively long tapspacing (25 mm) we expect the temperature to be not uniform across the whole sections Oncethe farthest end (from the defect) of a section transit to the normal state the closest end alreadyat a temperature above Tc Nevertheless the voltages monitored during experiments representan average of the sections temperatures This averaging artifact may explain the discrepancyobserve in the transition temperature (around 160 K instead of 90 K) This phenomenon isemphasized by the low NZPV values observed in coated conductors This is further supportedby the fact that adjacents sections begin to show potential difference once the former sectionsare fully normal ie just after the kink appears without overlap meaning that the normal zonefront is very steep
Figure 4 shows NZPV obtained by varying current pulses amplitude and duration for differentDC coil-currents According to this figure one can notice that the velocities have about twicethe magnitude than that usually found in literature for similar tape ndash see for example [13]This is explained by the absence of the copper clad usually present on commercial tape aswell as to the magnetic field overflowing from section 11 that we supposed respectively helpsto reduce heat generation during the current pulse and increases the flux-flow resistance alongthe tape length Besides this fact figure 4 shows that over 120 A (asymp14 Ic) the effect of thecoil current (localized magnetic field) is more important than at lower current pulses where
9th European Conference on Applied Superconductivity (EUCAS 09) IOP PublishingJournal of Physics Conference Series 234 (2010) 032050 doi1010881742-65962343032050
4
80 100 120 140 160 1800
10
20
30
40
50
60
70
80
I (A)
NZ
PV
(cm
s)
Ic0
093 116 140 163 186 209
Im
=050A
Im
=060A
Im
=075A
Im
=100A
Im
=150A
Im
=200A
IIc0
Figure 4 NZPV as a function of current pulse amplitude (the top axis displays the normalizedcurrent ie IIc0) Im is the DC current passing through the magnet The magnet air-gap is1 mm Note that the critical current without any defect is Ic0=86 A [11] At I = Ic0 the NZPVis approximately 11 plusmn 1 cms for any field-induced defect
the NZPVs seems independent of the defect strength (Im) This feature may come from ohmiclosses occurring in the silver shunt once the superconductor has transited As a matter of factan increase of the defects strength allows more current to be diverted into the shunt whichcontributes additional heat and thus increases the velocities Since losses are proportional toRI2 the effect of the magnetic flux becomes less apparent at lower pulse amplitude we believethat the NZPV is roughly proportional to Joule losses occurring in the tape
Another important feature observed from voltage traces is the time needed for the normalzone to appears in the samples Following figure 5 it can be shown that at currents below140 A smaller defects take more time to make section 11 transiting (large ∆tini) In fact mostof the samples that were burned during experiments was at low transport-current pulses (belowthe sample Ic not below the defect Ic) The energy injected in the tape being proportional topulses duration the flux-flow resistance developing along the length of the conductor was largeenough to burn those samples This initial time is of primary concerns for making FCLs sinceduring faults meters of conductors must quench quickly in order to rapidly detect and interruptthe electrical fault This is particularly true if the prospected FCL must deal with transientcurrents in the range of the critical current
Finally thermal effects on the NZPV were observed in sub-cooled liquid nitrogen (at ambientpressure) Figure 6 shows velocities obtained for transport current pulses of 150 A with coil-current of 2 A For this particular current value a considerable reduction of the NZPVs withthe bath temperature is observed However if we consider the temperature dependance of Ic
(see top axis) the NZPVs are larger in comparison with experiments made at 77 K for the samenormalized current IIc (figure 4) The improvement is approximately equals to 30 and 115at I =142Ic and I =162Ic respectively In fact the reduction of the temperature improves thethermal diffusivity (reduces the heat capacity) of the substrate [14] and also diminish the heat
9th European Conference on Applied Superconductivity (EUCAS 09) IOP PublishingJournal of Physics Conference Series 234 (2010) 032050 doi1010881742-65962343032050
5
80 100 120 140 160 1800
10
20
30
40
50
60
I (A)
∆t in
i (m
s)
093 116 140 163 186 209
Im
=050
Im
=060
Im
=075
Im
=100
Im
=150
Im
=200
IIc0
Figure 5 Initial time before quenching (∆tini) for a magnet air-gap of 1 mm Long initialtimes make the propagation hard to achieve and lead to hot-spots
71 72 73 74 75 76 77 7825
30
35
40
45
50119 126 133 142 151 162 174 189
T (K)
NZ
PV
(cm
s)
Im
=200A
IIc(T)
Figure 6 NZPVs for a sub-cooled tape This measurement was done by reducing the pressureinto the cryostat which in turn induces the temperature reduction Once the minimumtemperature was reached the ambiant pressure was reestablished inside the cryostat Then theresponse to current pulses of 150 A with Im=2 was monitored at every 10 seconds during thebath warming-up (asymp10 minutes) The top axis shows the normalized current (IcIc(T )) obtainedfrom a linear extrapolation ie Ic(T ) = Ic0(Tc minus T )(TC minus T0)minus1 T0=77 K and Tc=90 K
9th European Conference on Applied Superconductivity (EUCAS 09) IOP PublishingJournal of Physics Conference Series 234 (2010) 032050 doi1010881742-65962343032050
6
transfer [15] expected at such time-scale (tens of ms) This improve the propagation velocitiesand confirms our belief that the NZP is mostly a thermal effect
4 ConclusionThe present work shows that field-induced defects can improve the normal zone propagationvelocity Considering the NZP to be mostly a thermal effect we believe that the improvementis related to the local reduction of Ic and consequently to the additional heat generated inthe stabilizer Results also showed that induced-defects can reduced the initial delay beforequench propagation in coated conductors begins and make them more prompt to respond to anelectrical fault This is particularly true for currents in the range of Ic From the experimentspresented here sub-cooled experiments have shown that lowering the bath temperature causesan improvement in the NZPVs considering normalized currents This confirms that the NZPis mostly a thermal effect since this improvement seems to originates from the increase of theheat diffusion arising with the reduction of the coolant temperature
AcknowledgmentsThis work was partly supported by the Swiss National Science Foundation through the NationalCenter of Competence in Research ldquoMaterials with Novel Electronic Properties-MaNEPrdquo andpartly by the Natural Sciences and Engineering Research Council of Canada-NSERC Theauthors also thank SuperPower for providing the samples used in this experiment as well asDr Louis Antognazza Dr Michel Decroux and Dr Mathieu Therasse for useful discussionsabout the interpretation of the results
References[1] Electric Power Research Institute (EPRI) 2006 Fault current management guidebook -
updated EPRI Palo Alto CA 1012419 URL wwwmyepricom[2] Noe M and Steurer M 2007 Supercond Sci Technol 20 R15[3] International Council on Large Electric Systems (CIGRE) Working group (WG A316) 2008
Fault current limiters -Impact on existing and new protection schemes Technical brochureNo 339
[4] Electric Power Research Institute (EPRI) 2008 Survey of fault current limiter (FCL)technologies update EPRI Palo Alto CA 1016389 URL wwwmyepricom
[5] Antognazza L Therasse M Decroux M Roy F Dutoit B Abplanalp M and Fischer O 2009IEEE Trans Appl Supercond 19 1960
[6] Roy F Perez S Therasse M Dutoit B Sirois F Decroux M and Antognazza L 2009Physica C 469 1462
[7] Wang X Trociewitz U P and Schwartz J 2009 Supercond Sci Technol 22 085005[8] Levin G A Barnes P N Rodriguez J P Connors J A and Bulmer J S 2009 IEEE Trans
Appl Supercond 19 2504[9] Prusseit W Kinder H Handke J Noe M Kudymow A and Goldacker W 2006 Physica C
665[10] Arai K Yamasaki H Kaiho K Furuse M Nakagawa Y Sohma M and Yamaguchi I 2008 J
Phys Conf Ser 97 012031[11] SuperPower 2009 URL wwwsuperpower-inccom[12] National Instruments 2009 URL wwwnicom[13] Wang X Trociewitz U P and Schwartz J 2007 J Appl Phys 101 053904[14] Lu J Choi E S and Zhou H D 2008 J Appl Phys 103 064908
9th European Conference on Applied Superconductivity (EUCAS 09) IOP PublishingJournal of Physics Conference Series 234 (2010) 032050 doi1010881742-65962343032050
7
[15] Tixador P Cointe Y Nguyen N T and Villard C 2009 IEEE Trans Appl Supercond 191938
9th European Conference on Applied Superconductivity (EUCAS 09) IOP PublishingJournal of Physics Conference Series 234 (2010) 032050 doi1010881742-65962343032050
8
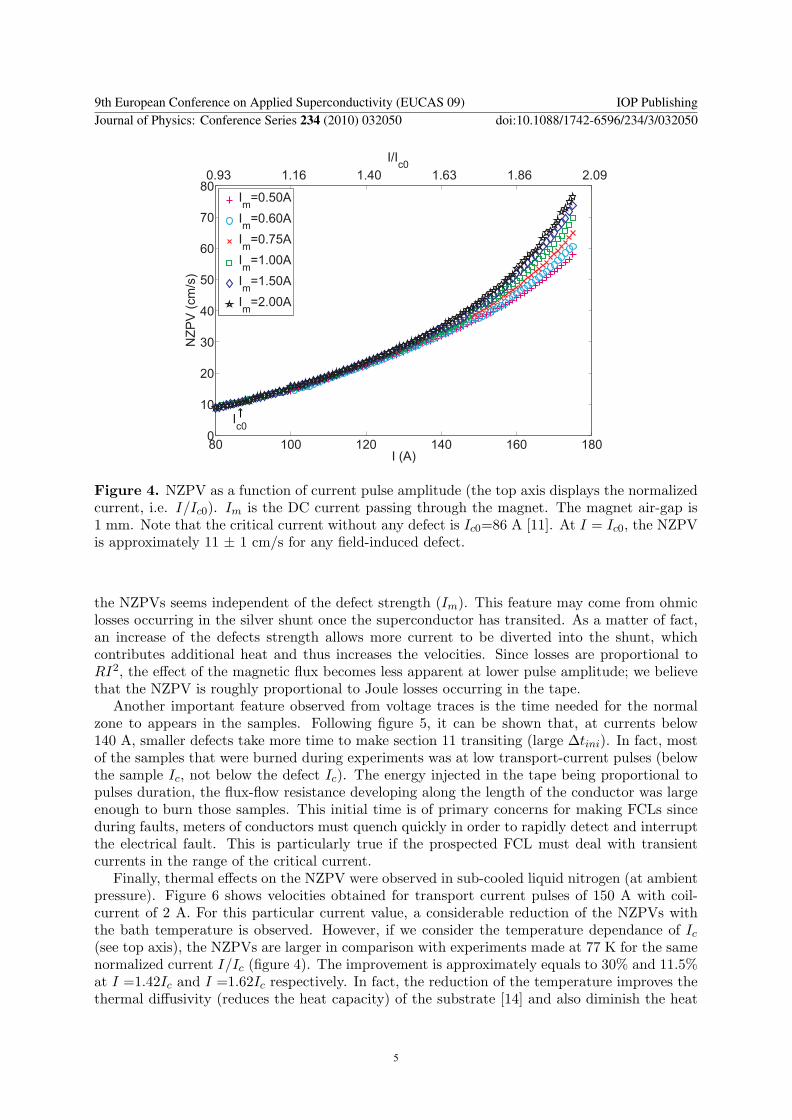
80 100 120 140 160 1800
10
20
30
40
50
60
I (A)
∆t in
i (m
s)
093 116 140 163 186 209
Im
=050
Im
=060
Im
=075
Im
=100
Im
=150
Im
=200
IIc0
Figure 5 Initial time before quenching (∆tini) for a magnet air-gap of 1 mm Long initialtimes make the propagation hard to achieve and lead to hot-spots
71 72 73 74 75 76 77 7825
30
35
40
45
50119 126 133 142 151 162 174 189
T (K)
NZ
PV
(cm
s)
Im
=200A
IIc(T)
Figure 6 NZPVs for a sub-cooled tape This measurement was done by reducing the pressureinto the cryostat which in turn induces the temperature reduction Once the minimumtemperature was reached the ambiant pressure was reestablished inside the cryostat Then theresponse to current pulses of 150 A with Im=2 was monitored at every 10 seconds during thebath warming-up (asymp10 minutes) The top axis shows the normalized current (IcIc(T )) obtainedfrom a linear extrapolation ie Ic(T ) = Ic0(Tc minus T )(TC minus T0)minus1 T0=77 K and Tc=90 K
9th European Conference on Applied Superconductivity (EUCAS 09) IOP PublishingJournal of Physics Conference Series 234 (2010) 032050 doi1010881742-65962343032050
6
transfer [15] expected at such time-scale (tens of ms) This improve the propagation velocitiesand confirms our belief that the NZP is mostly a thermal effect
4 ConclusionThe present work shows that field-induced defects can improve the normal zone propagationvelocity Considering the NZP to be mostly a thermal effect we believe that the improvementis related to the local reduction of Ic and consequently to the additional heat generated inthe stabilizer Results also showed that induced-defects can reduced the initial delay beforequench propagation in coated conductors begins and make them more prompt to respond to anelectrical fault This is particularly true for currents in the range of Ic From the experimentspresented here sub-cooled experiments have shown that lowering the bath temperature causesan improvement in the NZPVs considering normalized currents This confirms that the NZPis mostly a thermal effect since this improvement seems to originates from the increase of theheat diffusion arising with the reduction of the coolant temperature
AcknowledgmentsThis work was partly supported by the Swiss National Science Foundation through the NationalCenter of Competence in Research ldquoMaterials with Novel Electronic Properties-MaNEPrdquo andpartly by the Natural Sciences and Engineering Research Council of Canada-NSERC Theauthors also thank SuperPower for providing the samples used in this experiment as well asDr Louis Antognazza Dr Michel Decroux and Dr Mathieu Therasse for useful discussionsabout the interpretation of the results
References[1] Electric Power Research Institute (EPRI) 2006 Fault current management guidebook -
updated EPRI Palo Alto CA 1012419 URL wwwmyepricom[2] Noe M and Steurer M 2007 Supercond Sci Technol 20 R15[3] International Council on Large Electric Systems (CIGRE) Working group (WG A316) 2008
Fault current limiters -Impact on existing and new protection schemes Technical brochureNo 339
[4] Electric Power Research Institute (EPRI) 2008 Survey of fault current limiter (FCL)technologies update EPRI Palo Alto CA 1016389 URL wwwmyepricom
[5] Antognazza L Therasse M Decroux M Roy F Dutoit B Abplanalp M and Fischer O 2009IEEE Trans Appl Supercond 19 1960
[6] Roy F Perez S Therasse M Dutoit B Sirois F Decroux M and Antognazza L 2009Physica C 469 1462
[7] Wang X Trociewitz U P and Schwartz J 2009 Supercond Sci Technol 22 085005[8] Levin G A Barnes P N Rodriguez J P Connors J A and Bulmer J S 2009 IEEE Trans
Appl Supercond 19 2504[9] Prusseit W Kinder H Handke J Noe M Kudymow A and Goldacker W 2006 Physica C
665[10] Arai K Yamasaki H Kaiho K Furuse M Nakagawa Y Sohma M and Yamaguchi I 2008 J
Phys Conf Ser 97 012031[11] SuperPower 2009 URL wwwsuperpower-inccom[12] National Instruments 2009 URL wwwnicom[13] Wang X Trociewitz U P and Schwartz J 2007 J Appl Phys 101 053904[14] Lu J Choi E S and Zhou H D 2008 J Appl Phys 103 064908
9th European Conference on Applied Superconductivity (EUCAS 09) IOP PublishingJournal of Physics Conference Series 234 (2010) 032050 doi1010881742-65962343032050
7
[15] Tixador P Cointe Y Nguyen N T and Villard C 2009 IEEE Trans Appl Supercond 191938
9th European Conference on Applied Superconductivity (EUCAS 09) IOP PublishingJournal of Physics Conference Series 234 (2010) 032050 doi1010881742-65962343032050
8

[15] Tixador P Cointe Y Nguyen N T and Villard C 2009 IEEE Trans Appl Supercond 191938
9th European Conference on Applied Superconductivity (EUCAS 09) IOP PublishingJournal of Physics Conference Series 234 (2010) 032050 doi1010881742-65962343032050
8