PDF (1.6 MB) - DTC - University of Minnesota
18
TOPTMH: Topology Predictor for Transmembrane α-Helices Rezwan Ahmed, Huzefa Rangwala, and George Karypis Abstract 1 Motivation: Alpha-helical transmembrane proteins mediate many key biological pro- cesses and represent 20–30% of all genes in many organisms. Due to the difficulties in experimentally determining their high-resolution 3D struc- ture, computational methods that predict their topology (transmembrane helical segments and their orientation) are essential in advancing the un- derstanding of membrane proteins’ structures and functions. 2 Methods: We developed a new topology prediction method for transmembrane he- lices called TOPTMH that combines a helix residue predictor with a helix segment identification method and determines the overall orientation us- ing the positive-inside rule. The residue predictor is built using Support Vector Machines (SVM) that utilize evolutionary information in the form of PSI-BLAST generated sequence profiles to annotate each residue by its likelihood of being part of a helix segment. The helix segment identifica- tion method is built by combining the segments predicted by two Hidden Markov Models (HMM)—one based on the SVM predictions and the other based on the hydrophobicity values of the sequence’s amino acids. This approach combines the power of SVM-based models to discriminate be- tween the helical and non-helical residues with the power of HMMs to identify contiguous segments of helical residues that take into account the SVM predictions and the hydrophobicity values of neighboring residues. 3 Results: We present empirical results on two standard datasets and show that both the per-residue (Q2) and per-segment (Q ok ) scores obtained by TOPTMH are higher than those achieved by well-known methods such as Phobius and MEMSAT3. In addition, on an independent static bench- mark, TOPTMH achieved the highest scores on high-resolution sequences (Q2 score of 84% and Q ok score of 86%) against existing state-of-the-art systems while achieving low signal peptide error. 1
Transcript of PDF (1.6 MB) - DTC - University of Minnesota
TOPTMH: Topology Predictor for
Transmembrane α-Helices
Rezwan Ahmed, Huzefa Rangwala, and George Karypis
Abstract
1 Motivation:
Alpha-helical transmembrane proteins mediate many key biological pro-cesses and represent 20–30% of all genes in many organisms. Due to thedifficulties in experimentally determining their high-resolution 3D struc-ture, computational methods that predict their topology (transmembranehelical segments and their orientation) are essential in advancing the un-derstanding of membrane proteins’ structures and functions.
2 Methods:
We developed a new topology prediction method for transmembrane he-lices called TOPTMH that combines a helix residue predictor with a helixsegment identification method and determines the overall orientation us-ing the positive-inside rule. The residue predictor is built using SupportVector Machines (SVM) that utilize evolutionary information in the formof PSI-BLAST generated sequence profiles to annotate each residue by itslikelihood of being part of a helix segment. The helix segment identifica-tion method is built by combining the segments predicted by two HiddenMarkov Models (HMM)—one based on the SVM predictions and the otherbased on the hydrophobicity values of the sequence’s amino acids. Thisapproach combines the power of SVM-based models to discriminate be-tween the helical and non-helical residues with the power of HMMs toidentify contiguous segments of helical residues that take into account theSVM predictions and the hydrophobicity values of neighboring residues.
3 Results:
We present empirical results on two standard datasets and show thatboth the per-residue (Q2) and per-segment (Qok) scores obtained byTOPTMH are higher than those achieved by well-known methods suchas Phobius and MEMSAT3. In addition, on an independent static bench-mark, TOPTMH achieved the highest scores on high-resolution sequences(Q2 score of 84% and Qok score of 86%) against existing state-of-the-artsystems while achieving low signal peptide error.
1

4 Introduction
Alpha-helical transmembrane proteins perform several cellular functions, suchas cell-to-cell communication, transportation of ions and small molecules, andcell signalling [3]. Moreover, these proteins are of key interest for drug dis-covery, since about 50% of all existing drugs are targeted against membraneproteins [14]. These proteins are encoded by 20% to 30% genes in several or-ganisms [29], but only 1% of known 3D structures represent membrane pro-teins [2]. Transmembrane proteins are hard to crystallize and not suitable forNMR spectroscopy. Hence, computational methods attempt to characterize the3D structure of membrane proteins from sequence by identifying the locationand orientation of helical segments i.e., topological structure.
Over the years a number of methods have been developed for predicting thetopology of transmembrane helical (TMH) proteins. The early methods reliedon the fact that the helical segments helical segments are usually hydrophobicin nature. Hence, these methods used simple hydrophobicity values [15] foridentification of these segments. The TopPred [27] devised a simple methodbased on the fact that intra-cellular loop regions had a higher positive chargecompared to the extra-cellular loop regions. This “positive-inside rule” was veryefficient in predicting the topology of the TM proteins. MEMSAT [10] useda dynamic-programming based approach encapsulating composition statisticsof various residues. Recently, several methods use evolutionary informationwithin a machine learning framework for the prediction problem. In particular,TMHMM [23] and HMMTOP [24] model different segments of TM proteinsusing complex hidden markov models. Several prediction methods also attemptto reduce the erroneous prediction of signal-peptide residues as TMH segments.Phobius [16] models the signal peptide cleavage sites using a HMM framework,in conjunction with the TMH topology segments. MEMSAT3 [9] uses a neuralnetwork approach and a dynamic-programming based post processing to predictthe TM topology.
In this work we developed a new topology prediction method for alpha-helical transmembrane proteins called TOPTMH. This method combines ahelix residue predictor along with a helix segment identification method, anduse the positive-inside rule to determine the overall orientation. We used a dis-criminatory learning framework, in the form of support vector machines (SVM)to train a helix residue predictor. Evolutionary information in the form of PSI-BLAST [1] generated profiles were used as features to annotate each residue byits likelihood of being part of a helix segment. The helix segment identificationmethod used two hidden markov models (HMMs). The first HMM was basedon the SVM predictions, and the second HMM was based on the hydrophobicityvalues of the sequence’s amino acids. TOPTMH integrates the power of SVM-based models to discriminate between the helical and non-helical residues withthe power of HMMs to identify contiguous segments of helical residues. TheHMM models take into account the SVM predictions and the hydrophobicityvalues of adjacent residues. This combination is one of the key contributions ofour work.
2

We assess the performance of the TOPTMH method by performing a thor-ough set of experiments. We present empirical results on two standard datasetsand show that both the per-residue (Q2) and per-segment (Qok) scores obtainedby TOPTMH are higher than those achieved by well-known methods such asPhobius [16] and MEMSAT3 [9]. TOPTMH is able to annotate TM helix with75.71% accuracy compared to Phobius accuracy of 63.60%. In addition, on anindependent static benchmark, TOPTMH achieved the highest scores on high-resolution sequences (Q2 score of 84% and Qok score of 86%) against existingstate-of-the-art systems while achieving low signal peptide error.
The rest of the paper is organized as follows. Section 5 describes the TMhelix prediction problem and introduces different input features and algorithmsused in developing TOPTMH system. Section 6 describes the datasets and per-formance metrics used to analyze our experimental results. Section 7 comparesand discusses the results obtained. Finally, Section 8 summarizes the overallcontribution of this paper.
5 Methods and Algorithms
5.1 Problem Definition
The purpose of the transmembrane helix (TMH) prediction problem is to solvethe following two aspects of the structure of transmembrane proteins: (i) de-termine the helix regions of the protein that pass through the lipid bilayer and(ii) determine the topology of the protein by identifying the orientation of theN -terminus of the protein relative to the cytoplasm.
5.2 Position Specific Scoring Matrices
The position specific scoring matrix (PSSM) of a protein is obtained from amultiple sequence alignment of that protein and a set of other proteins thathave a statistical significant sequence similarity (i.e., they are expected to behomologs). For a sequence X of length n, its PSSM is represented by a n× 20matrix PX . The n rows of this matrix correspond to the various positions in Xand the columns correspond to the 20 distinct amino acids. The position specificscoring matrices used by TOPTMH were generated using the latest version ofthe PSI-BLAST algorithm [1] (available in NCBI’s blast release 2.2.13), andwere derived from the multiple sequence alignment constructed after five itera-tions using an e value of 10−2 for initial and subsequent sequence inclusions (i.e.,we used blastpgp -j 5 -e 0.01 -h 0.01). The PSI-BLAST was performedagainst the SWISS-PROT [4] database release 53.0 that contains 269,293 se-quences. In the cases in which PSI-BLAST could not produce meaningful align-ments for certain positions of X, the corresponding rows of the PSSM werederived from the scores of BLOSUM62.
3

5.3 Hydrophobicity Scale
Hydrophobicity (HP) scales are commonly used by many of the existing TMHprediction methods, as TMH regions mostly consist of hydrophobic residues.There are many hydrophobicity scales that are commonly used, such as, Kyteand Doolittle scale [15], GES-scale [6], etc. However, these scales are based onbiophysical or statistical analysis of high-resolution membrane protein structuresand does not fully capture the cellular context of the membrane proteins [8]. Weuse a recently published [8] hydrophobicity scale (∆Gaa
app scale) that capturesthe energetics of the protein-lipid interaction in biological contexts and thus ismore biologically relevant. It has been shown that this hydrophobicity scale isable to determine the topology of membrane proteins with higher precision thanother hydrophobicity scales [28].
5.4 TOPTMH Algorithm
The TOPTMH algorithm solves the TMH prediction problem by first assigninga score to each residue based on its likelihood to be in a helix state (residueannotation phase) and then using these scores to determine the overall topologyof the protein (topology prediction phase). The per-residue scores are assignedby training an SVM [26] classifier to predict whether a residue is in a helixstate or not using features obtained from the protein’s PSSM. The topology isdetermined using three different approaches. The first approach utilizes a simplescheme based on empirical rules and the other two predict the topology byemploying hidden Markov models (HMM) [20]. The first HMM-based approachuses a single HMM based solely on the SVM scores, whereas the second usestwo HMMs—one based on SVM scores and one based on hydrophobicity scales.Figure 1 provides an overview of the residue annotation and topology predictionphases.
5.5 TMH Residue Annotation
The structure of the SVM-based TMH residue annotation approach employedby TOPTMH is similar to that used by existing methods for SVM-based struc-tural and functional annotation of protein residues using position specific scoringmatrices (e.g., secondary structure for globular proteins [12], solvent accessiblesurface area [22], disorder prediction [22], and DNA-binding [22]).
For each position i of a sequence X, the input to the SVM is a (2w+1)-lengthsubsequence (wmer) of X centered at position i. Each wmer is represented by avector xi of length (2w + 1)× 20 that is obtained by concatenating the rows ofthe PSSM for each position of the wmer. This wmer-based input is used for bothtraining and prediction. The parameter w determines the length of the localenvironment around the ith sequence position used while building and applyingthe model and its optimal value is determined experimentally.
TOPTMH formulates the residue annotation problem as a binary classifica-tion problem whose goal is to predict if a residue belongs to a helix state (positive
4

Figure 1: The system overview of the TOPTMH.
5

class H+) or not (negative class H−). TOPTMH uses the ProSAT [22] libraryto build the SVM model and employs the second order exponential function(soe) as its kernel function. The soe kernel has been shown to produce supe-rior results than the traditional radial basis function (rbf ) kernel for varioussequence annotation problems [12, 21, 22]. In the context of TOPTMH, thesoe kernel function is given by
Ksoe(xi, yj) = exp
(1 + K2(xi, yj)√
K2(xi, yj)K2(xi, yj)
), (1)
where xi and yj are the vector representations of two wmers, K2 is given by
K2(xi, yj) = 〈xi, yj〉+ 〈xi, yj〉2, (2)
and 〈xi, yj〉 denotes the dot-product of the xi and yj vectors.Given a set of labeled residues and their corresponding vector representa-
tions, ProSAT learns a classification function f() using a soft-margin SVMformulation. Each unlabeled residue xi is predicted (annotated) to be in H+ orH− depending on whether f(xi) is positive or negative, respectively. Moreover,the value of f(xi) (SVM score) can be considered as the likelihood of an instanceto be part of H+ or H− class and can be used to rank the instances.
5.6 Rule-Based Topology Prediction
The rule-based topology prediction approach post-process the SVM-based residueannotations and identifies the segments by applying some heuristics rules thattake into account the minimum and maximum lengths of the TMH segments.Specifically, for each protein, this approach traverses the SVM annotated residuesand identifies all maximal contiguous segments that were annotated as TMHsby the SVM. Any TMH segment that is shorter than the minimum length ofLmin residues is rejected (i.e., converted into non-helix residues). If any of theremaining segments are longer than the maximum length of Lmax, it splits thatsegment into two separate segments. If the length of the segment is greater than2Lopt +C, then it splits it into two segments consisting of the first and last Lopt
residues and converts the central residues into non-helix residues. Otherwise, itsplits the long segment by changing the C residues in the middle to non-helix.The threshold values Lmin, Lmax, Lopt and C are set as 9, 38, 19 and 6 respec-tively. These values were initially chosen based on a literature review [27, 3, 30]and then optimized to provide the best results given the SVM-based annotationsproduced by TOPTMH.
For the TMH orientation prediction, we applied the positive-inside rule [27]and used the technique presented in the THUMBUP [30] program to determinethe orientation of the N -terminus. Once we decide on the final set of TMHsegments, we apply this rule to decide the orientation information.
6

Figure 2: The layout of the HMM model used in TOPTMH.
5.7 HMM-Based Topology Prediction
The HMM-based topology prediction approaches implemented in TOPTMHdetermine the topology of a TMH protein by threading the sequence into anHMM model that is designed to capture the various structural components ofa TMH protein. These approaches were motivated by recent studies whichshowed that HMM-based TMH prediction methods are well-suited for predict-ing the topology of TMH proteins as they can directly learn from the data thevarious structural constraints associated with TMH protein segments and theirrelations to the protein’s underlying sequence and/or PSSM [3, 17, 5]. However,unlike these methods, the HMM-based approaches used by TOPTMH take intoaccount the SVM-scores produced by the residue annotation step, which providebetter per-residue predictions for the helix/non-helix states than the maximumlikelihood approaches used by HMMs.
The architecture of TOPTMH’s HMM model, shown in Figure 5.7, is de-signed to capture the known structural information of TMH proteins and issimilar to that employed by Phobius [16]. The model contains four major com-
7

partments: (i) helix, (ii) inside loop, (iii) outside loop, and (iv) signal peptide.The helix compartment is composed of two submodels each containing 35 states.One submodel is used for modeling helix segments that go from inside towardsthe outside, and the other for the helix segments that go from outside towardsthe inside. In each of these submodes, states 1–8 contain transitions to only thenext state, whereas states 9–34 can transition to the next state or to state 35(last state). Thus, any predicted helix segment will be of length 9–35 residueslong. The outside loop compartment is divided into two submodels to repre-sent long and short non-cytoplasmic loops. Each of these submodels contains20 states to model loops that are at least 1–20 residues long. Each submodelalso has a state with self-transition to represent long cytoplasmic loops. Theinside loop compartment also contains 20 states to allow it to model loops thatare 1–20 residues long. The signal peptide compartment was designed based onPhobius model and it has three regions: the n-region (10 states), the h-region(20 states), and the c-region (20 states). The last state of the c-region representsa cleavage site transitioning to a outside loop state.
TOPTMH incorporates two different HMM-based topology prediction meth-ods, described in the rest of this section. The HMM models were built using acustomized version of the UMDHMM [11] package (version 1.02). The thread-ing of a sequence through the HMM model was done using the Viterbi [20]algorithm.
5.7.1 HMM Based on SVM Scores (HMM-SVM).
This approach builds an HMM model that only takes into account the per-residue SVM scores produced by the annotation step. To construct the trainingset, the SVM score for each residue is computed. Since, HMMs are primarilydesigned to operate on finite size alphabets, the raw SVM scores are discretizedinto a finite number of bins with each bin corresponding to a distinct symbol.The final training set for the HMM corresponds to a set of proteins with knownTMH topology represented as sequences of SVM-score based bins. A similarSVM-based prediction followed by discretization is performed when this modelis used to predict the topology of a test protein. TOPTMH discretizes theSVM scores into equal-size intervals, and assigns all the residues with scores≤ −3 and ≥ 3 into the first and last bin, respectively.
5.7.2 HMM Based on SVM Scores and Hydrophobicity Values (HMM-SVM+HP).
This model builds a pair of HMM models—one based on SVM scores (HMM-SVM) and one based on the hydrophobicity values (HMM-HP) of known TMHsequences and combines the topology predictions from both HMM models. Thisapproach was motivated by the fact that in certain cases, the SVM-based residueannotation may fail to identify certain hydrophobic TMH segments. This isfurther discussed in Section 7.
The HMM-SVM model is identical to that described in the previous section.
8

The HMM-HP model is built by first encoding the amino acids of each TMHprotein as a sequence of discretized hydrophobicity values. Table 1 shows thescheme used to discretize the hydrophobicity values for each amino acid. Boththe HMM-SVM and HMM-HP models are used independently to predict theTMH segments. The final set of predictions consists of the segments predictedby HMM-SVM and those segments predicted by HMM-HP that do not overlapwith any of the segments of HMM-SVM. Two segments are considered to overlapif they have more than five residues in common. We used the positive-insiderule [27] to supplement the HMM-based results for an improved performance inthe TMH orientation prediction.
Table 1: Discretization of Hydrophobicity values.
Labels Amino Acids HP Values
1 R, E, K, D 2.5 < h2 N, H, P, Q 1.0 < h < 2.53 T, Y, G, S −0.1 < h < 0.94 F, V, C, A, M, W −0.4 < h < −0.15 I, L h < −0.5
HP Values denotes a range of hydrophobicity values de-cided based on [8]
6 Experimental Design
6.1 Datasets
We evaluated the prediction performance of the TOPTMH method on datasetsintroduced by the Phobius and MEMSAT3 methods and on the static bench-mark [13]. The datasets obtained from the Phobius study included a set of 247transmembrane proteins and a set of 45 transmembrane proteins that containedsignal peptide residues with transmembrane helix segments. We will denote thefirst dataset as TM-Only and the second as TM-SP. The dataset obtainedfrom MEMSAT3 consisted of a set of 184 transmembrane proteins denoted asMoller.
The static benchmark consists of a set of 2247 sequences whose true an-notations are not given to the public. A method predicts the annotations forthese sequences and uploads them to the evaluation server. The server assessesthe quality of the predictions and compares them to that obtained by othermethods. The 2247 sequences contain four distinct subsets. The first is thehigh-resolution subset which contains sequences of proteins whose high resolu-tion structure is available, the second is the low-resolution subset that includesmembrane proteins detected using low resolution structures, the third subset isthe globular protein subset which includes globular protein sequences and thefourth is the signal peptide subset that includes proteins sequences with signal
9
peptide residues. The sequences provided to the public is not grouped in theabove mentioned subsets, but the results published on the evaluation server ispresented accordingly.
6.2 Learning & Testing Methodology
We used a standard protocol for training and testing during evaluation of thedifferent methods. We divided each dataset into 10 different parts and main-tained this strict separation during the evaluation of both the SVM and HMMmodels of TOPTMH system. Firstly, we ran a 10 fold cross validation to pre-dict the residue-wise annotations using SVM for each sequence in the dataset.Then using the predicted annotations we repeated the same cross validation forthe HMM model. To obtain the TMH predictions for the static benchmark, wetrained the SVM and HMM models using all the sequences from TM-SP andTM-Only datasets.
Note that the split of the TM-SP and TM-Only datasets in 10 differentparts was identical to that used by Phobius. The sequence identifies betweenthe different folds are at most 30% and 35% for the TM-Only and TM-SPdatasets.
6.3 Evaluation Metrics
The performance of our methods was evaluated using well-established met-rics [3]. The performance of TMH prediction is measured on a per-residue orper-segment basis. The residue-wise measures evaluate the accuracy of meth-ods to correctly annotate a residue and the segment-wise measures evaluate theaccuracy of methods to identify a TMH segment location. Although, the per-residue measures capture the accuracy of a method to predict the annotationlabel for a residue, it is not able to assess the ability of the method to iden-tify the TMH segments separated by loop regions of different lengths. Hence,TMH prediction algorithms are mostly evaluated using per-segment accuracymeasures.
The percentage of correctly predicting a residue as TMH or non-TMH ismeasured using the standard two-state per-residue metric Q2:
Q2 =100
Nprot
Nprot∑i=1
# of correctly predicted residues in protein i
# of residues in protein i. (3)
The efficiency in predicting TMH residues is measured by two of the followingmetrics. Q%obs
2T represents the percentage of observed TMH residues that arepredicted correctly (helix recall):
Q%obs2T = 100× # of correctly predicted helix residues
# of observed helix residues. (4)
Q%prd2T denotes the percentage of predicted TMH residues that are predicted
10

correctly (helix precision):
Q%prd2T = 100× # of correctly predicted helix residues
# of predicted helix residues. (5)
For TMH topology prediction, per-segment measures are mostly used. Q%obshtm
represents the percentage of observed TMH segments that are predicted cor-rectly (helix segment recall):
Q%obshtm =
# of correctly predicted TM
# of observed TM× 100%. (6)
To capture the precision of the prediction, we use Q%prdhtm , which is the percent-
age of predicted TMH segments that are predicted correctly (helix segmentprecision):
Q%prdhtm =
# of correctly predicted TM
# of total predicted TM× 100%. (7)
Overall segment prediction performance that captures both Q%obshtm and Q%prd
htm isdenoted as Qok, which is the percentage of proteins for which all TMH segmentsare predicted correctly:
Qok =100
Nprot×
Nprot∑i
δi,with δi = {1,Q%obshtm ∧Q%prd
htm =100
0,else . (8)
A TMH segment is identified accurately, if we can find an overlap of fiveresidues between the predicted and observed helix segments. This procedure wasused in the evaluation of Phobius. Also a predicted helix segment is countedonly once if correctly predicted. This is illustrated by considering the followingexamples:
• Obs1 : TTTTTTTTTTTT------TTTTTTTTTTT
• Pred1: -----TTTTTTTTTTTTTTTTTTTTT---
• Obs2 : ---TTTTTTTTTTTTTTTTTTTTTTTT--
• Pred2: TTTTTTTTTTT------TTTTTTTTTTTT
In this example, Obs1 and Pred1 are the observed and predicted TMH segmentsfor a particular protein sequence. During evaluation, the second segment of theObs1 sequence will not be considered as correctly predicted, since the onlysegment predicted in Pred1 is already accounted for in the first segment of theObs1 sequence. On the other hand, the second segment of the Pred2 sequencewill be considered as incorrectly predicted as the first segment will be consideredfor the only segment in Obs2 sequence.
11
Table 2: Residue Annotation Perfor-mance with varying wmer length.
wmer Q2 Q%obs2T Q%prd
2T
2 86.6 78.1 76.95 88.2 85.3 75.57 88.3 84.7 77.411 88.3 85.5 76.6
The numbers in bold show the best wmer
length performance as measured for that met-ric. Q%obs
2T denotes the helix precision and
Q%prd2T denotes the helix recall for the per-
residue based performance evaluation.
7 Results
7.1 Residue Annotation Performance
The performance achieved by the SVM-based residue annotation for differentvalues of w is shown in Table 2. This table shows the per-residue performancemetrics (Q2, Q%obs
2T and Q%prd2T ) for a subset of the TM-Only dataset. We
observe that in terms of the various metrics, the performance achieved for dif-ferent values of w is rather similar. The only exception is w = 2, where theperformance is substantially lower than the rest. Overall, the best performancewas obtained using wmer of length seven. For this reason, all the remainingexperiments presented in this study use w = 7.
7.2 Topology Prediction Performance
Table 3 presents the per-residue and per-segment based results of differentTOPTMH topology prediction approaches on the TM-Only and TM-SPdatasets. For the SVM-HMM approach, Table 3 shows three different setsof results that were obtained by binning the SVM scores into 5, 7, and 12bins (HMM-SVM-D5, HMM-SVM-D7, and HMM-SVM-D12). The row labeled“Raw-SVM” shows the results obtained by using as TMH segments the maximalcontiguous segments that were predicted as TMHs by the SVM (i.e., the set ofsegments that form the input to the rule-based topology prediction approach).
Comparing the per-residue performance achieved by the various approacheswe see that Raw-SVM achieves very good per-residue two-state accuracy (Q2).It has the highest Q2 value for TM-Only and the second highest for TM-SP.However, focusing on this metric alone is misleading because most of the residuesin transmembrane proteins are non-helix [18] and relatively high Q2 values canbe obtained by simply predicting most of the residues as being in a non-helixstate. Consequently, high Q2 values represent good performance only if theyare accompanied with high helix recall (Q%obs
2T ) values. In light of this dis-cussion, we see that the HMM-based topology prediction approaches tend to
12
achieve considerably better recall values (especially for TM-SP) while theirhelix precision (Q%prd
2T ) is in some cases better than that of the Raw-SVM ap-proach. Among the different schemes, the rule-based approach achieves the bestprecision results, whereas the approach that combines the SVM- and HP-basedHMMs (HMM-SVM-D7+HP) achieves the best recall. However, unlike the highprecision achieved by the HMM-SVM-D7+HP approach, the rule-based schemeachieves the lowest recall leading to the worst Q2 values.
Comparing the per-segment performance, we see that the Raw-SVM ap-proach achieves Qok scores that range from 35%–40%, which are by far thelowest among the different approaches. These results indicate that even thoughthe Raw-SVM approach can correctly predict a large fraction of the helicalresidues, it fails to predict correctly all the residues of each helical segment. Onthe other hand, the per-segment performance achieved by the other topologyprediction approaches are considerably higher. Both the rule- and HMM-basedapproaches are able to significantly improve over Raw-SVM for both the TM-SPand TM-Only datasets. Among them, the approaches based on HMM-SVMoutperform the rule-based approach by 2%–12%, even though the latter achievedthe highest Q%prd
htm scores (100% and 96.44% for TM-SP and TM-Only, respec-tively). The overall best Qok results were obtained by the HMM-SVM-D7+HPapproach. In particular, the Qok values achieved by HMM-SVM-D7+HP are19% and 3% better than the next best performing scheme (HMM-SVM-D7) onthe TM-SP and TM-Only datasets, respectively. These performance improve-ments are mainly due to improvements in the recall values (Q%obs
htm ).
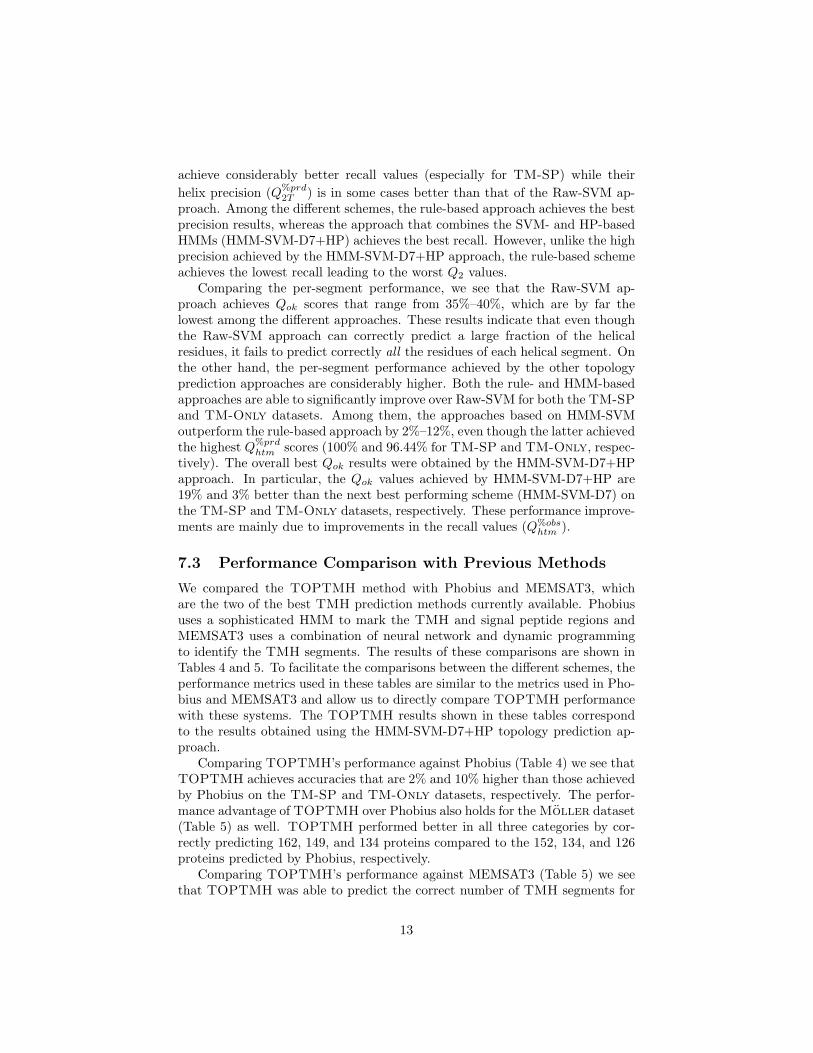
7.3 Performance Comparison with Previous Methods
We compared the TOPTMH method with Phobius and MEMSAT3, whichare the two of the best TMH prediction methods currently available. Phobiususes a sophisticated HMM to mark the TMH and signal peptide regions andMEMSAT3 uses a combination of neural network and dynamic programmingto identify the TMH segments. The results of these comparisons are shown inTables 4 and 5. To facilitate the comparisons between the different schemes, theperformance metrics used in these tables are similar to the metrics used in Pho-bius and MEMSAT3 and allow us to directly compare TOPTMH performancewith these systems. The TOPTMH results shown in these tables correspondto the results obtained using the HMM-SVM-D7+HP topology prediction ap-proach.
Comparing TOPTMH’s performance against Phobius (Table 4) we see thatTOPTMH achieves accuracies that are 2% and 10% higher than those achievedby Phobius on the TM-SP and TM-Only datasets, respectively. The perfor-mance advantage of TOPTMH over Phobius also holds for the Moller dataset(Table 5) as well. TOPTMH performed better in all three categories by cor-rectly predicting 162, 149, and 134 proteins compared to the 152, 134, and 126proteins predicted by Phobius, respectively.
Comparing TOPTMH’s performance against MEMSAT3 (Table 5) we seethat TOPTMH was able to predict the correct number of TMH segments for
13
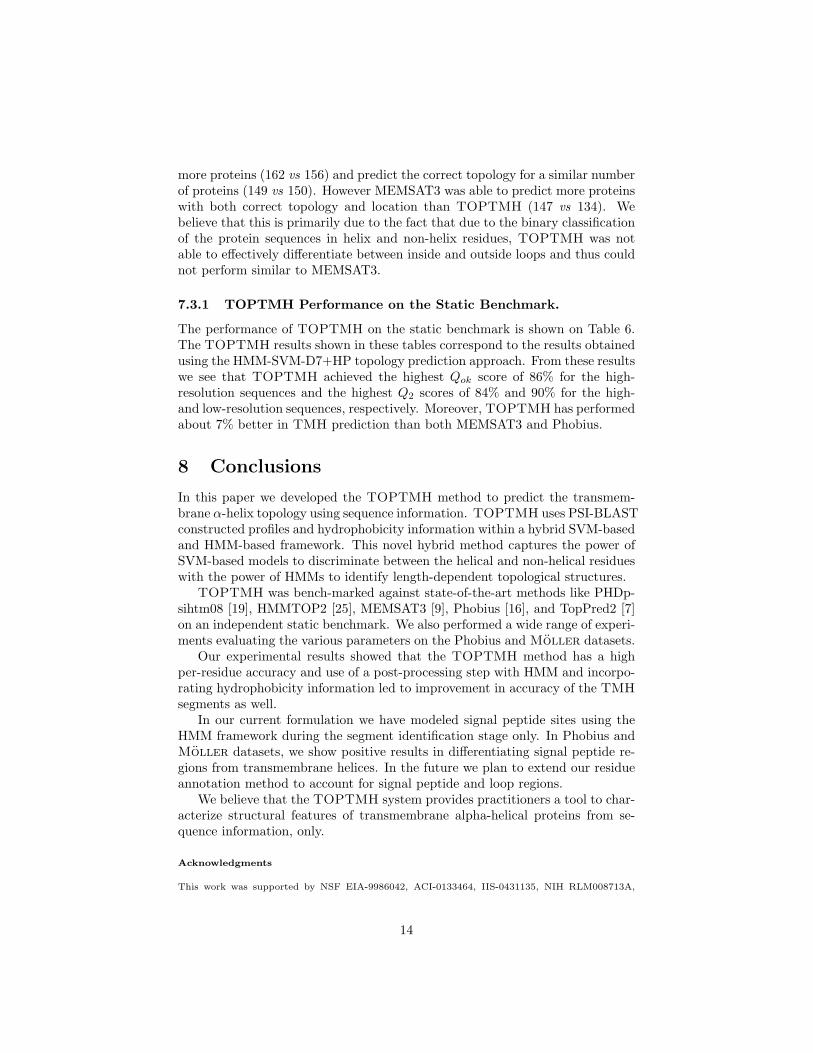
more proteins (162 vs 156) and predict the correct topology for a similar numberof proteins (149 vs 150). However MEMSAT3 was able to predict more proteinswith both correct topology and location than TOPTMH (147 vs 134). Webelieve that this is primarily due to the fact that due to the binary classificationof the protein sequences in helix and non-helix residues, TOPTMH was notable to effectively differentiate between inside and outside loops and thus couldnot perform similar to MEMSAT3.
7.3.1 TOPTMH Performance on the Static Benchmark.
The performance of TOPTMH on the static benchmark is shown on Table 6.The TOPTMH results shown in these tables correspond to the results obtainedusing the HMM-SVM-D7+HP topology prediction approach. From these resultswe see that TOPTMH achieved the highest Qok score of 86% for the high-resolution sequences and the highest Q2 scores of 84% and 90% for the high-and low-resolution sequences, respectively. Moreover, TOPTMH has performedabout 7% better in TMH prediction than both MEMSAT3 and Phobius.
8 Conclusions
In this paper we developed the TOPTMH method to predict the transmem-brane α-helix topology using sequence information. TOPTMH uses PSI-BLASTconstructed profiles and hydrophobicity information within a hybrid SVM-basedand HMM-based framework. This novel hybrid method captures the power ofSVM-based models to discriminate between the helical and non-helical residueswith the power of HMMs to identify length-dependent topological structures.
TOPTMH was bench-marked against state-of-the-art methods like PHDp-sihtm08 [19], HMMTOP2 [25], MEMSAT3 [9], Phobius [16], and TopPred2 [7]on an independent static benchmark. We also performed a wide range of experi-ments evaluating the various parameters on the Phobius and Moller datasets.
Our experimental results showed that the TOPTMH method has a highper-residue accuracy and use of a post-processing step with HMM and incorpo-rating hydrophobicity information led to improvement in accuracy of the TMHsegments as well.
In our current formulation we have modeled signal peptide sites using theHMM framework during the segment identification stage only. In Phobius andMoller datasets, we show positive results in differentiating signal peptide re-gions from transmembrane helices. In the future we plan to extend our residueannotation method to account for signal peptide and loop regions.
We believe that the TOPTMH system provides practitioners a tool to char-acterize structural features of transmembrane alpha-helical proteins from se-quence information, only.
Acknowledgments
This work was supported by NSF EIA-9986042, ACI-0133464, IIS-0431135, NIH RLM008713A,
14

NIH T32GM008347, the Digital Technology Center, University of Minnesota and the MinnesotaSupercomputing Institute.
References[1] S. F. Altschul, L. T. Madden, A. A. Schffer, J. Zhang, Z. Zhang, W. Miller, and D. J. Lipman.
Gapped blast and psi-blast: a new generation of protein database search programs. NucleicAcids Research, 25(17):3389–402, 1997.
[2] H. M. Berman, T. Battistuz, T. N. Bhat, W. F. Bluhm, P. E. Bourne, K. Burkhardt, Z. Feng,G. L. Gilliland, L. Iype, S. Jain, P Fagan, J. Marvin, D. Padilla, V. Ravichandran, B. Schneider,N. Thanki, H. Weissig, J. D. Westbrook, and C. Zardecki. The protein data bank. NucleicAcids Res, 28:235–242, 2000.
[3] C. P. Chen and B. Rost. State-of-the-art in membrane protein prediction. Appl Bioinformatics,1(1):21–35, 2002.
[4] The UniProt Consortium. The universal protein resource (uniprot). Nucleic Acids Res.,35:D193–D197, 2007.
[5] A. Elofsson and G. von Heijne. Membrane protein structure: Prediction versus reality. Annu.Rev. Biochem, 76:125–140, 2007.
[6] D. M. Engelman, T. A. Steitz, and A. Goldman. Identifying nonpolar transbilayer helices inamino acid sequences of membrane proteins. Annual Review of Biophysics and BiophysicalChemistry, 15:321–353, 1986.
[7] D. M. Engelman, T. A. Steitz, and A. Goldman. Identifying nonpolar transbilayer helices inamino acid sequences of membrane proteins. Annu Rev Biophys Biophys Chem, 15:321–353,1986.
[8] T. Hessa, H. Kim, K. Bihlmaier, C. Lundin, J. Boekel, H. Andersson, I. Nilsson, S. H. White,and G. von Heijne. Recognition of transmembrane helices by the endoplasmic reticulum translo-con. Nature, 433(7024):377–381, 2005.
[9] D. T. Jones. Improving the accuracy of transmembrane protein topology prediction usingevolutionary information. Bioinformatics, 23(5):538–544, 2007.
[10] D. T. Jones, W. R. Taylor, and J. M. Thornton. A model recognition approach to the predictionof all-helical membrane protein structure and topology. Biochemistry, 33(10):3038–3049, 1994.
[11] Tapas Kanungo. UMDHMM: Hidden Markov Model Toolkit. Cambridge University Press,1999.
[12] George Karypis. Yasspp: Better kernels and coding schemes lead to improvements in svm-based secondary structure prediction. Proteins: Structure, Function and Bioinformatics,64(3):575–586, 2006.
[13] A. Kernytsky and B. Rost. Static benchmarking of membrane helix predictions. Nucl AcidsRes, 31(13):3642–3644, 2003.
[14] T. Klabunde and G. Hessler. Drug design strategies for targeting g-protein-coupled receptors.ChemBioChem, 3:928–944, 2002.
[15] J. Kyte and R. F. Doolittle. A simple method for displaying the hydropathic character of aprotein. Journal of Molecular Biology, 157(1):105–132, 1982.
[16] L. Kll, A. Krogh, and E. L. L. Sonnhammer. A combined transmembrane topology and signalpeptide prediction method. Journal of Molecular Biology, 338:1027–1036, 2004.
[17] L. Kll and E. L. L. Sonnhammer. Reliability of transmembrane predictions in whole-genomedata. FEBS Lett., 532(3):415–418, 2002.
[18] J. Liu and B. Rost. Comparing function and structure between entire proteomes. Protein Sci.,10:1970–1979, 2001.
[19] Topology prediction for helical transmembrane proteins at 86% accuracy. B. rost and p. fariselliand r. casadio. Protein Sci., 5(8):1704–1718, 1996.
15

[20] L. R. Rabiner. A tutorial on hidden markov models and selected applications in speech recog-nition. In Proceedings of the IEEE, volume 77, pages 257–286, 1989.
[21] H. Rangwala and G. Karypis. frmsdpred: Predicting local rmsd between structural fragmentsusing sequence information. In Proceedings of the LSS Computational Systems Biology Con-ference, volume 6, pages 311–322, 2007.
[22] H. Rangwala, C. Kauffman, and G. Karypis. Prosat: A generalized framework for proteinsequence annotation. Bioinformatics, (under review), 2008.
[23] E. L. L. Sonnhammer, G. von Heijne, and A. Krogh. A hidden markov model for predict-ing transmembrane helices in protein sequences. In Proceedings of the Sixth InternationalConference on Intelligent Systems for Molecular Biology, pages 175–82, 1998.
[24] G. E. Tusndya and I. Simon. Principles governing amino acid composition of integral membraneproteins: application to topology prediction. Journal of Molecular Biology, 283(2):489–506,1998.
[25] G. E. Tusndya and I. Simon. The hmmtop transmembrane topology prediction server. Bioin-formatics, 17(9):849–850, 2001.
[26] Vladimir N. Vapnik. The Nature of Statistical Learning Theory. Springer Verlag, 1995.
[27] G. von Heijne. Membrane protein structure prediction. hydrophobicity analysis and thepositive-inside rule. Journal of Molecular Biology, 225(2):487–494, 1992.
[28] Gunnar von Heijne. Formation of transmembrane helices in vivo–is hydrophobicity all thatmatters? The Journal of general physiology, 129(5):353–356, 2007.
[29] E. Wallin and G. von Heijne. Genome-wide analysis of integral membrane proteins from eu-bacterial, archaean, and eukaryotic organisms. Protein Sci, 7(4):1029–38, 1998.
[30] H. Zhou and Y. Zhou. Predicting the topology of transmembrane helical proteins using meanburial propensity and a hidden-markov-model-based method. Protein Sci, 12:1547–1555, 2003.
16

Table 3: Topology Prediction Performance.
Per-Residues Scores
TM-SP TM-Only
Methods Q2 Q%obs2T Q%prd
2T Q2 Q%obs2T Q%prd
2T
Raw-SVM 96.73 71.10 86.60 90.64 84.30 83.10Rule 95.16 59.56 95.89 89.19 79.65 87.36HMM-SVM-D5 96.28 76.39 84.87 89.40 85.54 82.25HMM-SVM-D7 96.45 76.85 87.72 89.34 85.61 82.23HMM-SVM-D12 96.24 77.56 84.45 89.31 86.13 81.35HMM-SVM-D7+HP 97.08 84.80 88.50 89.46 86.21 82.04
Per-Segment Scores
Methods Qok Q%obshtm Q%prd
htm Qok Q%obshtm Q%prd
htm
Raw SVM 35.55 85.23 70.09 40.48 95.87 75.54Rule 64.44 75.00 100.00 73.28 94.34 96.44HMM-SVM-D5 64.44 84.09 87.05 72.87 96.12 94.44HMM-SVM-D7 71.11 85.23 92.59 73.68 96.52 94.39HMM-SVM-D12 60.00 85.22 85.22 71.25 96.44 93.56HMM-SVM-D7+HP 84.44 93.18 93.18 75.71 97.17 94.13
Q2 and Qok represent the overall prediciton accuracy for per-residuebased and per-segment based evaluation. Q%obs
2T denotes the helix
precision and Q%prd2T denotes the helix recall for the per-residue based
performance evaluation. Q%obshtm denotes the helix segment precision
and Q%prdhtm denotes the helix segment recall for the per-segment based
performance evaluation.
Table 4: Performance Comparison with Phobius.
TM-SP TM-Only
Method Accuracy Accuracy
TOPTMH 93.18 75.71Phobius 91.10 63.60
Accuracy denotes the percentage of the correctly pre-dicted proteins and a prediction was counted correct whenall predicted TMH segments overlap all observed TMHsegments over a five residue stretch and loops were locatedcorrectly. Prediction accuracy did not consider incorrectprediction of signal peptide segments to be consistent as[16].
17
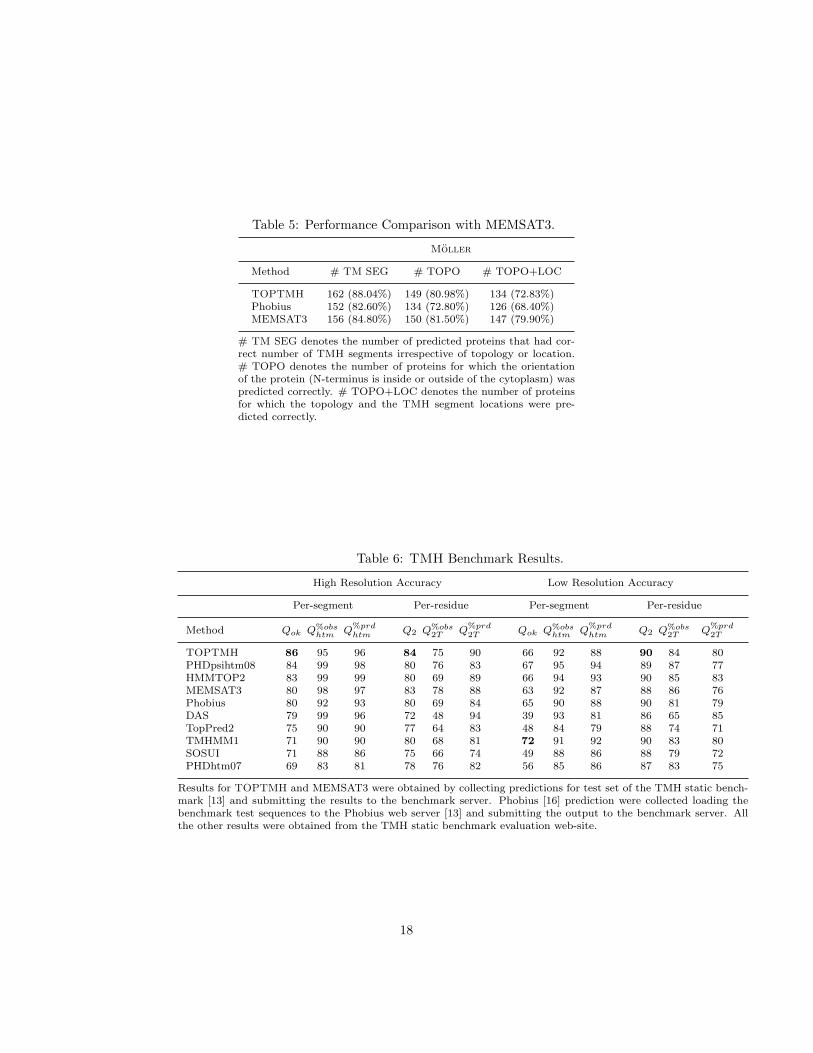
Table 5: Performance Comparison with MEMSAT3.
Moller
Method # TM SEG # TOPO # TOPO+LOC
TOPTMH 162 (88.04%) 149 (80.98%) 134 (72.83%)Phobius 152 (82.60%) 134 (72.80%) 126 (68.40%)MEMSAT3 156 (84.80%) 150 (81.50%) 147 (79.90%)
# TM SEG denotes the number of predicted proteins that had cor-rect number of TMH segments irrespective of topology or location.# TOPO denotes the number of proteins for which the orientationof the protein (N-terminus is inside or outside of the cytoplasm) waspredicted correctly. # TOPO+LOC denotes the number of proteinsfor which the topology and the TMH segment locations were pre-dicted correctly.
Table 6: TMH Benchmark Results.
High Resolution Accuracy Low Resolution Accuracy
Per-segment Per-residue Per-segment Per-residue
Method Qok Q%obshtm Q%prd
htm Q2 Q%obs2T Q%prd
2T Qok Q%obshtm Q%prd
htm Q2 Q%obs2T Q%prd
2T
TOPTMH 86 95 96 84 75 90 66 92 88 90 84 80PHDpsihtm08 84 99 98 80 76 83 67 95 94 89 87 77HMMTOP2 83 99 99 80 69 89 66 94 93 90 85 83MEMSAT3 80 98 97 83 78 88 63 92 87 88 86 76Phobius 80 92 93 80 69 84 65 90 88 90 81 79DAS 79 99 96 72 48 94 39 93 81 86 65 85TopPred2 75 90 90 77 64 83 48 84 79 88 74 71TMHMM1 71 90 90 80 68 81 72 91 92 90 83 80SOSUI 71 88 86 75 66 74 49 88 86 88 79 72PHDhtm07 69 83 81 78 76 82 56 85 86 87 83 75
Results for TOPTMH and MEMSAT3 were obtained by collecting predictions for test set of the TMH static bench-mark [13] and submitting the results to the benchmark server. Phobius [16] prediction were collected loading thebenchmark test sequences to the Phobius web server [13] and submitting the output to the benchmark server. Allthe other results were obtained from the TMH static benchmark evaluation web-site.
18
![Download the PowerPoint slides [PDF - 1.6 MB] - Healthy People 2020](https://static.fdocuments.us/doc/165x107/620616d18c2f7b1730047ec6/download-the-powerpoint-slides-pdf-16-mb-healthy-people-2020.jpg)