PDF (1.091 MB)
12
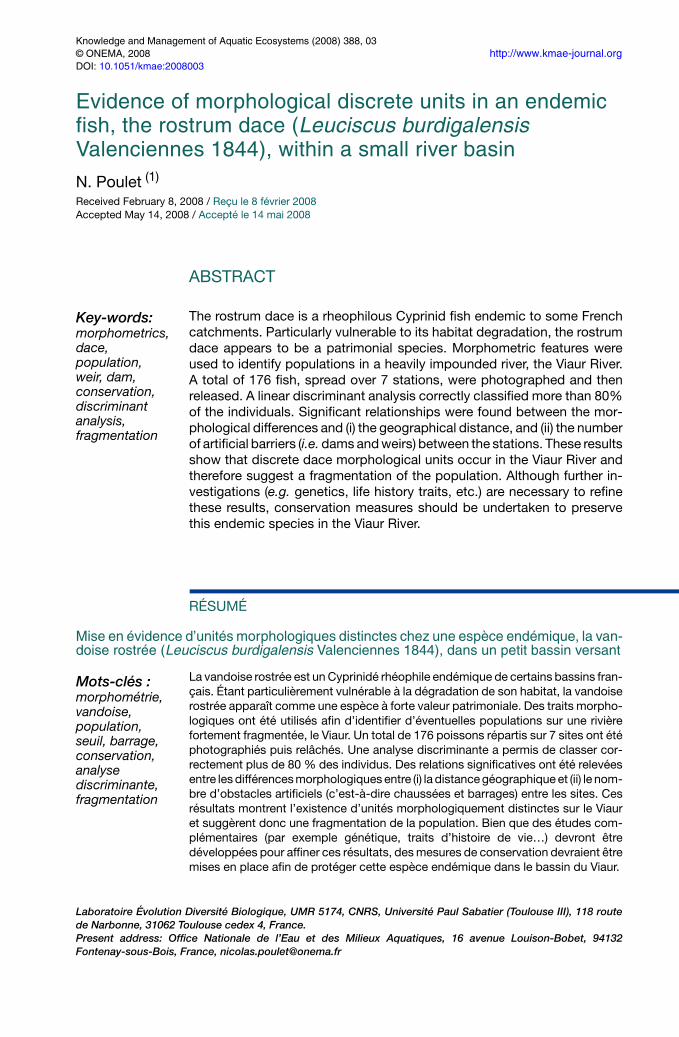
Knowledge and Management of Aquatic Ecosystems (2008) 388, 03 © ONEMA, 2008 http://www.kmae-journal.org DOI: 10.1051/kmae:2008003 Evidence of morphological discrete units in an endemic fish, the rostrum dace (Leuciscus burdigalensis Valenciennes 1844), within a small river basin N. Poulet (1) Received February 8, 2008 / Reçu le 8 février 2008 Accepted May 14, 2008 / Accepté le 14 mai 2008 ABSTRACT The rostrum dace is a rheophilous Cyprinid fish endemic to some French catchments. Particularly vulnerable to its habitat degradation, the rostrum dace appears to be a patrimonial species. Morphometric features were used to identify populations in a heavily impounded river, the Viaur River. A total of 176 fish, spread over 7 stations, were photographed and then released. A linear discriminant analysis correctly classified more than 80% of the individuals. Significant relationships were found between the mor- phological differences and (i) the geographical distance, and (ii) the number of artificial barriers (i.e. dams and weirs) between the stations. These results show that discrete dace morphological units occur in the Viaur River and therefore suggest a fragmentation of the population. Although further in- vestigations (e.g. genetics, life history traits, etc.) are necessary to refine these results, conservation measures should be undertaken to preserve this endemic species in the Viaur River. RÉSUMÉ Mise en évidence d’unités morphologiques distinctes chez une espèce endémique, la van- doise rostrée (Leuciscus burdigalensis Valenciennes 1844), dans un petit bassin versant La vandoise rostrée est un Cyprinidé rhéophile endémique de certains bassins fran- çais. Étant particulièrement vulnérable à la dégradation de son habitat, la vandoise rostrée apparaît comme une espèce à forte valeur patrimoniale. Des traits morpho- logiques ont été utilisés afin d’identifier d’éventuelles populations sur une rivière fortement fragmentée, le Viaur. Un total de 176 poissons répartis sur 7 sites ont été photographiés puis relâchés. Une analyse discriminante a permis de classer cor- rectement plus de 80 % des individus. Des relations significatives ont été relevées entre les différences morphologiques entre (i) la distance géographique et (ii) le nom- bre d’obstacles artificiels (c’est-à-dire chaussées et barrages) entre les sites. Ces résultats montrent l’existence d’unités morphologiquement distinctes sur le Viaur et suggèrent donc une fragmentation de la population. Bien que des études com- plémentaires (par exemple génétique, traits d’histoire de vie…) devront être développées pour affiner ces résultats, des mesures de conservation devraient être mises en place afin de protéger cette espèce endémique dans le bassin du Viaur. Laboratoire Évolution Diversité Biologique, UMR 5174, CNRS, Université Paul Sabatier (Toulouse III), 118 route de Narbonne, 31062 Toulouse cedex 4, France. Present address: Office Nationale de l’Eau et des Milieux Aquatiques, 16 avenue Louison-Bobet, 94132 Fontenay-sous-Bois, France, [email protected] Key-words: morphometrics, dace, population, weir, dam, conservation, discriminant analysis, fragmentation Mots-clés : morphométrie, vandoise, population, seuil, barrage, conservation, analyse discriminante, fragmentation
Transcript of PDF (1.091 MB)
Knowledge and Management of Aquatic Ecosystems (2008) 388, 03 © ONEMA, 2008 http://www.kmae-journal.orgDOI: 10.1051/kmae:2008003
Evidence of morphological discrete units in an endemic fish, the rostrum dace (Leuciscus burdigalensis Valenciennes 1844), within a small river basin
N. Poulet (1)
Received February 8, 2008 / Reçu le 8 février 2008 Accepted May 14, 2008 / Accepté le 14 mai 2008
ABSTRACT
The rostrum dace is a rheophilous Cyprinid fish endemic to some French catchments. Particularly vulnerable to its habitat degradation, the rostrum dace appears to be a patrimonial species. Morphometric features were used to identify populations in a heavily impounded river, the Viaur River. A total of 176 fish, spread over 7 stations, were photographed and then released. A linear discriminant analysis correctly classified more than 80% of the individuals. Significant relationships were found between the mor-phological differences and (i) the geographical distance, and (ii) the number of artificial barriers (i.e. dams and weirs) between the stations. These results show that discrete dace morphological units occur in the Viaur River and therefore suggest a fragmentation of the population. Although further in-vestigations (e.g. genetics, life history traits, etc.) are necessary to refine these results, conservation measures should be undertaken to preserve this endemic species in the Viaur River.
RÉSUMÉ
Mise en évidence d’unités morphologiques distinctes chez une espèce endémique, la van-doise rostrée (Leuciscus burdigalensis Valenciennes 1844), dans un petit bassin versant
La vandoise rostrée est un Cyprinidé rhéophile endémique de certains bassins fran-çais. Étant particulièrement vulnérable à la dégradation de son habitat, la vandoise rostrée apparaît comme une espèce à forte valeur patrimoniale. Des traits morpho-logiques ont été utilisés afin d’identifier d’éventuelles populations sur une rivière fortement fragmentée, le Viaur. Un total de 176 poissons répartis sur 7 sites ont été photographiés puis relâchés. Une analyse discriminante a permis de classer cor-rectement plus de 80 % des individus. Des relations significatives ont été relevées entre les différences morphologiques entre (i) la distance géographique et (ii) le nom-bre d’obstacles artificiels (c’est-à-dire chaussées et barrages) entre les sites. Ces résultats montrent l’existence d’unités morphologiquement distinctes sur le Viaur et suggèrent donc une fragmentation de la population. Bien que des études com-plémentaires (par exemple génétique, traits d’histoire de vie…) devront être développées pour affiner ces résultats, des mesures de conservation devraient être mises en place afin de protéger cette espèce endémique dans le bassin du Viaur.
Laboratoire Évolution Diversité Biologique, UMR 5174, CNRS, Université Paul Sabatier (Toulouse III), 118 route de Narbonne, 31062 Toulouse cedex 4, France. Present address: Office Nationale de l’Eau et des Milieux Aquatiques, 16 avenue Louison-Bobet, 94132 Fontenay-sous-Bois, France, [email protected]
Key-words:morphometrics, dace, population, weir, dam, conservation, discriminant analysis, fragmentation
Mots-clés :morphométrie, vandoise, population, seuil, barrage, conservation, analyse discriminante, fragmentation

N. Poulet: Knowl. Managt. Aquatic Ecosyst. (2008) 388, 03
INTRODUCTION
Due to their restricted natural distribution, endemic species are particularly vulnerable to environmental changes which enhance the extinction risks (Myers et al., 2000; IUCN, 2001). This is particularly true for freshwater organisms since continental aquatic ecosystems are subjected to a wide variety of stresses such as draining, canalisation, impoundment, pollution, etc. (e.g. Dynesius and Nilsson, 1994; Nilsson et al., 2005). And in that context, rheophilous species are particularly vulnerable (Mann, 1996; Penczak and Kruk, 2000).The rostrum dace (Leuciscus burdigalensis Valenciennes 1844) is a Cyprinid fish inhabiting central and south-western French rivers (Costedoat et al., 2006; Kottelat and Freyhof, 2007). This fish is morphologically and genetically distinct from the common dace (Leuciscus leuciscus (L.)) (Costedoat et al., 2006; Kottelat and Freyhof, 2007) and has been considered as a real species (Kottelat and Freyhof, 2007). Daces are rheophilous, intolerant to the degradation of their habitat (Lelek, 1987; Penczak and Kruk, 2000; Bruslé and Quignard, 2001; Persat, 2001); in France, they are on the national list of protected fish so that altering or destroying their spawning sites is forbidden (ministerial order, 22nd December 1988).Identifying populations and their exchange is of great importance for preserving and managing populations (Camus and Lima, 2002). Phenotypic traits such as morphological features have been widely used, and still are, to discriminate fish stocks, especially the exploited species (e.g. Casselman et al., 1981; Hurlbut and Clay, 1998; Cadrin, 2000; Silva, 2003; Turan et al., 2006). One should note that a “stock” is quite similar to a “population” (Begg and Waldman, 1999), whose definition is still under debate (Camus and Lima, 2002). Morphological variations can be induced by environmental and/or genetic differences. The phenotype is determined by the genome, the environmental factors and their interaction (e.g.Robinson and Wilson, 1996; Hard et al., 1999). During the early ontogeny, phenotypic features are built from a genetically determined scheme. However, this scheme is not strictly fixed and may be influenced by environmental factors. This is phenotypic plasticity, i.e. “the ability of a single genotype to produce more than one alternative form of morphology, physiological state, and/or behaviour in response to environmental conditions” (West-Eberhard, 1989). For example, water velocity increases the body depth of the Atlantic salmon (Salmo salar L.) and brown trout (Salmo trutta L.) (Pakkasmaa and Piironen, 2000) and feeding specialisation produces changes in the skull of the largemouth bass (Micropterus salmoides (Lacepède)) (Wintzer and Motta, 2005). Variations in morphology may also be due to genetic differences. When reproductive isolation occurs between groups experiencing different environmental conditions, some phenotypes may be selected (Carvalho, 1993). The genetic differentiation and the morphological changes following this local adaptation may be reinforced by genetic drift when populations are small and isolated (e.g. Jordan and Snell, 2008). Thus, in many cases, morphological differences can reflect genetic differences (e.g. Nicieza, 1995; Robinson and Wilson, 1996). In conclusion, whatever the basis for the morphological differences among individual groups, whether they be geographically distinct or not, this testifies to their isolation (Cadrin, 2000).The Viaur, a south-western French river, is widely impacted by both hydroelectric dams and weirs. Several studies have shown that small obstacles can significantly limit fish movements (Winter and Van Densen, 2001; Ovidio and Philippart, 2002) leading to population isolation (Meldgaard et al., 2003); they may finally have a negative effect on the persistence of fish populations (Morita and Yamamoto, 2002). In the case of the Viaur River, weirs largely influence fish both at the community and population scales (Poulet et al., 2005; Poulet, 2007). For instance, based on scale shape, three distinct units of rostrum dace have been discriminated, suggesting that the population was probably fragmented. The present study aimed to refine these results, assessing if the rostrum daces in the Viaur River belonged to a single and continuous population or if they were split into isolated distinct units. For this purpose, four more sites (i.e. a total of 7) distributed between the three used in the former study were added and another method was used to discriminate the sites: the body shape morphometrics.
03p2

N. Poulet: Knowl. Managt. Aquatic Ecosyst. (2008) 388, 03
MATERIALS AND METHODS
> STUDY SITE
The Viaur River is a 170-km river located in the Garonne catchment in south-western France (Figure 1). The source of this rain-fed river is at 1090 m above sea level, and maximum flow is observed between December and March. The sampling sites range along 80 km of the main course. This part of the Viaur is generally shallow (less than 1 m), the width ranges between 5 to 20 m and the mean slope is about 0.5%. In the upstream sections, the temperature remains below 20 °C all year round, whereas it may reach 27 °C in the downstream section during the summer, notably because of the numerous managements (see below).Since 1953, about 80% of the Viaur catchment has been impacted by hydrological perturbations due to the building of five hydroelectric dams in the upper tributaries and one on the lower main course (Figure 1). Each associated reservoir has been drained twice since the initial filling. Furthermore, there are 57 weirs between the source and mouth but no natural barrier such as a waterfall or dry area (Guilmet, pers. comm.). Many are the remains of water mills built during Medieval times which are presently out of use. The sluices are closed and water flows over the weir or runs through a small gap. The weirs, which are between 1 and 4 m high, form large and deep pools (1–4 m depth) with surface areas between 3000 and 25 000 m². Before 2001, only four weirs were equipped with fish-passes; since then, a few others have been built but most of the weirs cannot be passed by fish migrating upstream.
Figure 1Localisation of the sampling sites (arrows), dams (lightning) and weirs (open circles) (map adapted from BDCarthage IGN(c)).
Figure 1 Localisation des sites échantillonnés (flèches), barrages (éclairs) et chaussées (cercles) (carte modifiée à partir de la BDCarthage IGN(c)).
03p3
N. Poulet: Knowl. Managt. Aquatic Ecosyst. (2008) 388, 03
> MORPHOMETRIC DATA ACQUISITION
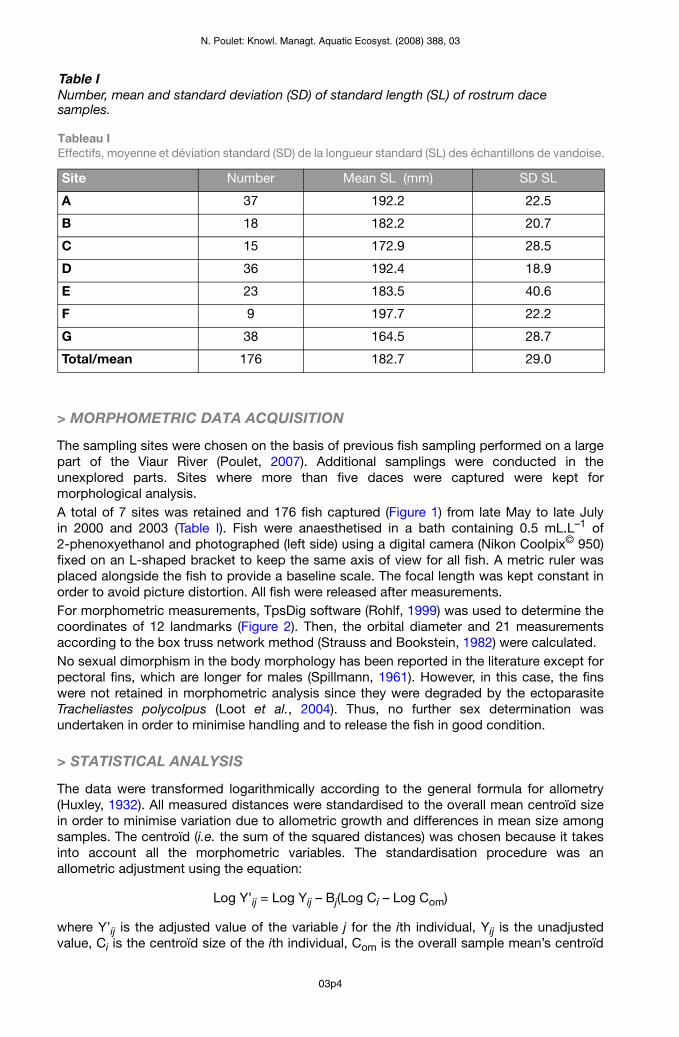
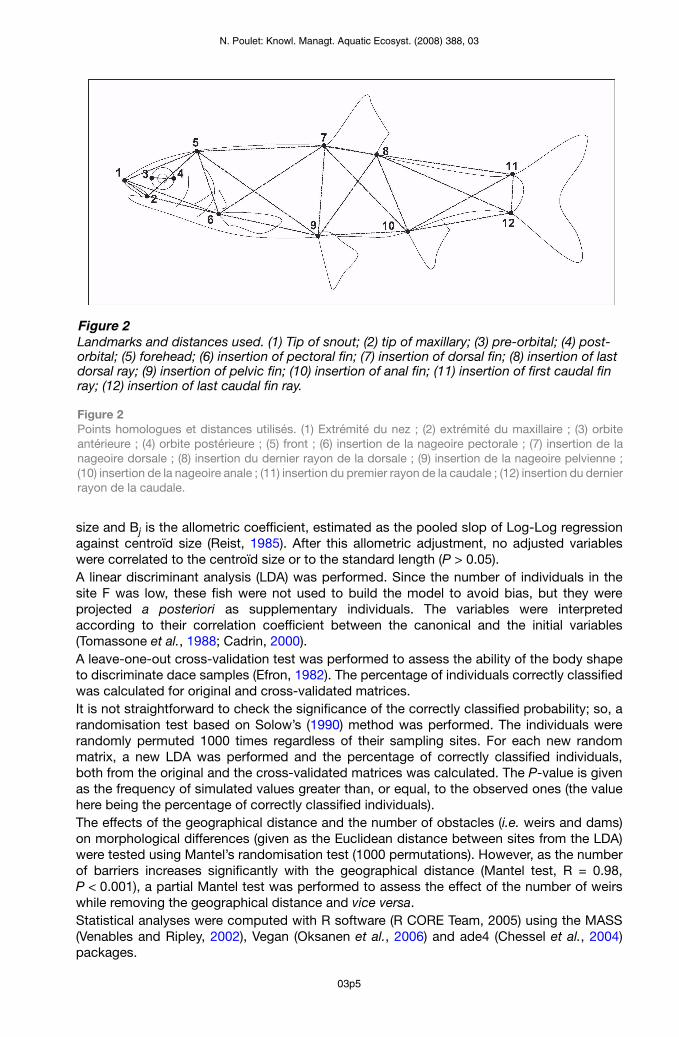
The sampling sites were chosen on the basis of previous fish sampling performed on a large part of the Viaur River (Poulet, 2007). Additional samplings were conducted in the unexplored parts. Sites where more than five daces were captured were kept for morphological analysis.A total of 7 sites was retained and 176 fish captured (Figure 1) from late May to late July in 2000 and 2003 (Table I). Fish were anaesthetised in a bath containing 0.5 mL.L–1 of 2-phenoxyethanol and photographed (left side) using a digital camera (Nikon Coolpix© 950) fixed on an L-shaped bracket to keep the same axis of view for all fish. A metric ruler was placed alongside the fish to provide a baseline scale. The focal length was kept constant in order to avoid picture distortion. All fish were released after measurements.For morphometric measurements, TpsDig software (Rohlf, 1999) was used to determine the coordinates of 12 landmarks (Figure 2). Then, the orbital diameter and 21 measurements according to the box truss network method (Strauss and Bookstein, 1982) were calculated. No sexual dimorphism in the body morphology has been reported in the literature except for pectoral fins, which are longer for males (Spillmann, 1961). However, in this case, the fins were not retained in morphometric analysis since they were degraded by the ectoparasite Tracheliastes polycolpus (Loot et al., 2004). Thus, no further sex determination was undertaken in order to minimise handling and to release the fish in good condition.
> STATISTICAL ANALYSIS
The data were transformed logarithmically according to the general formula for allometry (Huxley, 1932). All measured distances were standardised to the overall mean centroïd size in order to minimise variation due to allometric growth and differences in mean size among samples. The centroïd (i.e. the sum of the squared distances) was chosen because it takes into account all the morphometric variables. The standardisation procedure was an allometric adjustment using the equation:
Log Y’ij = Log Yij – Bj(Log Ci – Log Com)
where Y’ij is the adjusted value of the variable j for the ith individual, Yij is the unadjusted value, Ci is the centroïd size of the ith individual, Com is the overall sample mean’s centroïd
Table INumber, mean and standard deviation (SD) of standard length (SL) of rostrum dace samples.
Tableau I Effectifs, moyenne et déviation standard (SD) de la longueur standard (SL) des échantillons de vandoise.
Site Number Mean SL (mm) SD SL
A 37 192.2 22.5
B 18 182.2 20.7
C 15 172.9 28.5
D 36 192.4 18.9
E 23 183.5 40.6
F 9 197.7 22.2
G 38 164.5 28.7
Total/mean 176 182.7 29.0
03p4
N. Poulet: Knowl. Managt. Aquatic Ecosyst. (2008) 388, 03
size and Bj is the allometric coefficient, estimated as the pooled slop of Log-Log regression against centroïd size (Reist, 1985). After this allometric adjustment, no adjusted variables were correlated to the centroïd size or to the standard length (P > 0.05). A linear discriminant analysis (LDA) was performed. Since the number of individuals in the site F was low, these fish were not used to build the model to avoid bias, but they were projected a posteriori as supplementary individuals. The variables were interpreted according to their correlation coefficient between the canonical and the initial variables (Tomassone et al., 1988; Cadrin, 2000).A leave-one-out cross-validation test was performed to assess the ability of the body shape to discriminate dace samples (Efron, 1982). The percentage of individuals correctly classified was calculated for original and cross-validated matrices.It is not straightforward to check the significance of the correctly classified probability; so, a randomisation test based on Solow’s (1990) method was performed. The individuals were randomly permuted 1000 times regardless of their sampling sites. For each new random matrix, a new LDA was performed and the percentage of correctly classified individuals, both from the original and the cross-validated matrices was calculated. The P-value is given as the frequency of simulated values greater than, or equal, to the observed ones (the value here being the percentage of correctly classified individuals).The effects of the geographical distance and the number of obstacles (i.e. weirs and dams) on morphological differences (given as the Euclidean distance between sites from the LDA) were tested using Mantel’s randomisation test (1000 permutations). However, as the number of barriers increases significantly with the geographical distance (Mantel test, R = 0.98, P < 0.001), a partial Mantel test was performed to assess the effect of the number of weirs while removing the geographical distance and vice versa.Statistical analyses were computed with R software (R CORE Team, 2005) using the MASS (Venables and Ripley, 2002), Vegan (Oksanen et al., 2006) and ade4 (Chessel et al., 2004) packages.
Figure 2Landmarks and distances used. (1) Tip of snout; (2) tip of maxillary; (3) pre-orbital; (4) post-orbital; (5) forehead; (6) insertion of pectoral fin; (7) insertion of dorsal fin; (8) insertion of last dorsal ray; (9) insertion of pelvic fin; (10) insertion of anal fin; (11) insertion of first caudal fin ray; (12) insertion of last caudal fin ray.
Figure 2 Points homologues et distances utilisés. (1) Extrémité du nez ; (2) extrémité du maxillaire ; (3) orbite antérieure ; (4) orbite postérieure ; (5) front ; (6) insertion de la nageoire pectorale ; (7) insertion de la nageoire dorsale ; (8) insertion du dernier rayon de la dorsale ; (9) insertion de la nageoire pelvienne ; (10) insertion de la nageoire anale ; (11) insertion du premier rayon de la caudale ; (12) insertion du dernier rayon de la caudale.
03p5
N. Poulet: Knowl. Managt. Aquatic Ecosyst. (2008) 388, 03
RESULTS
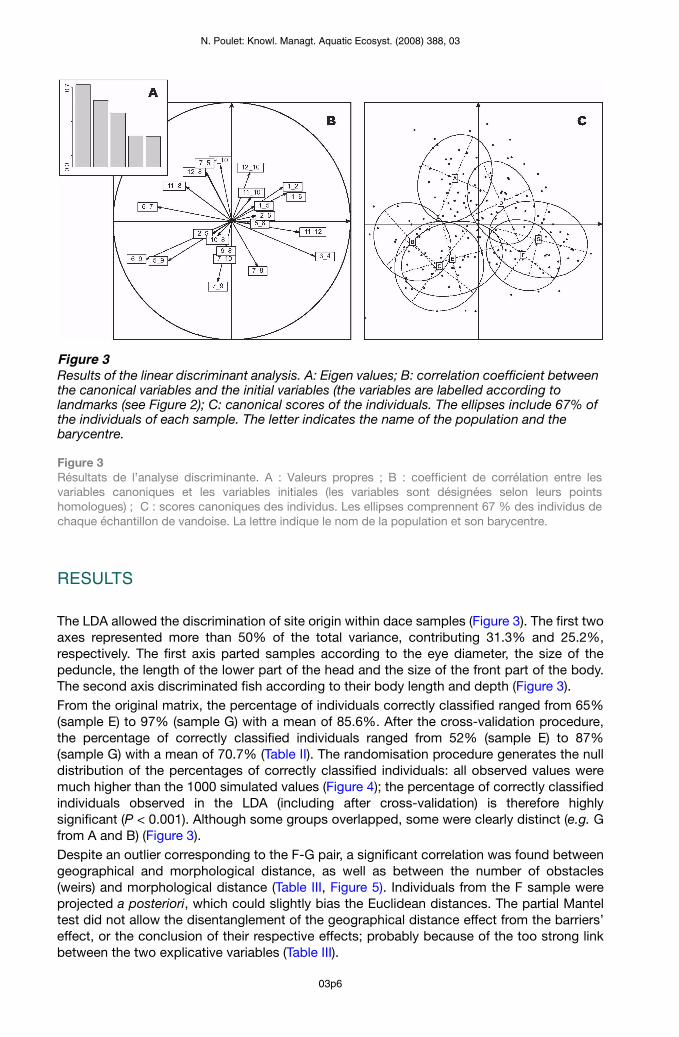
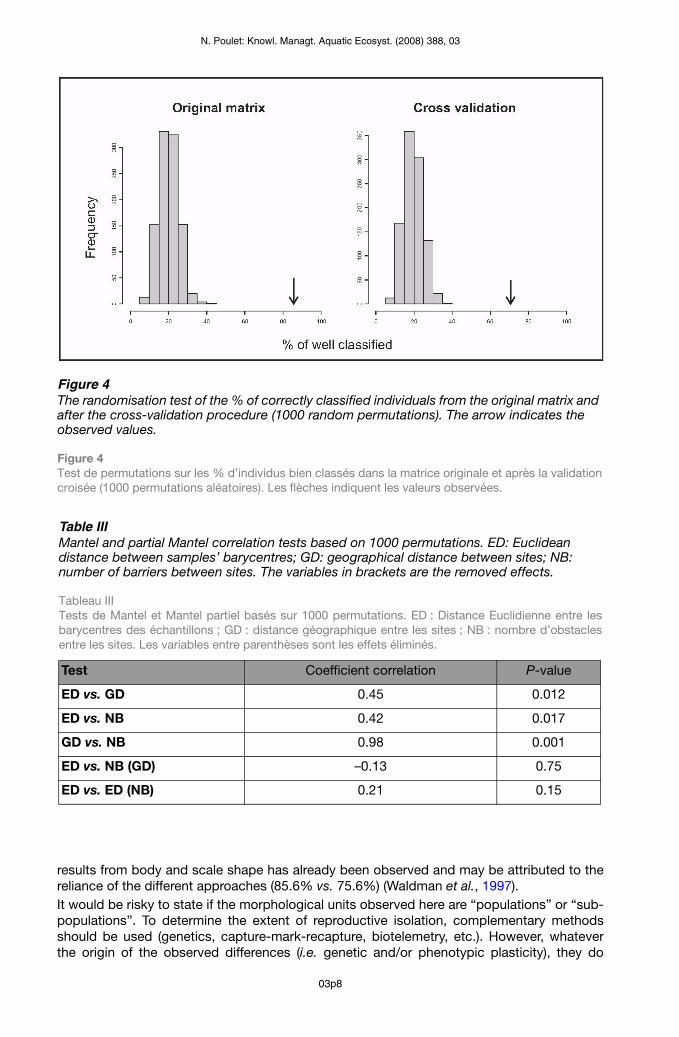
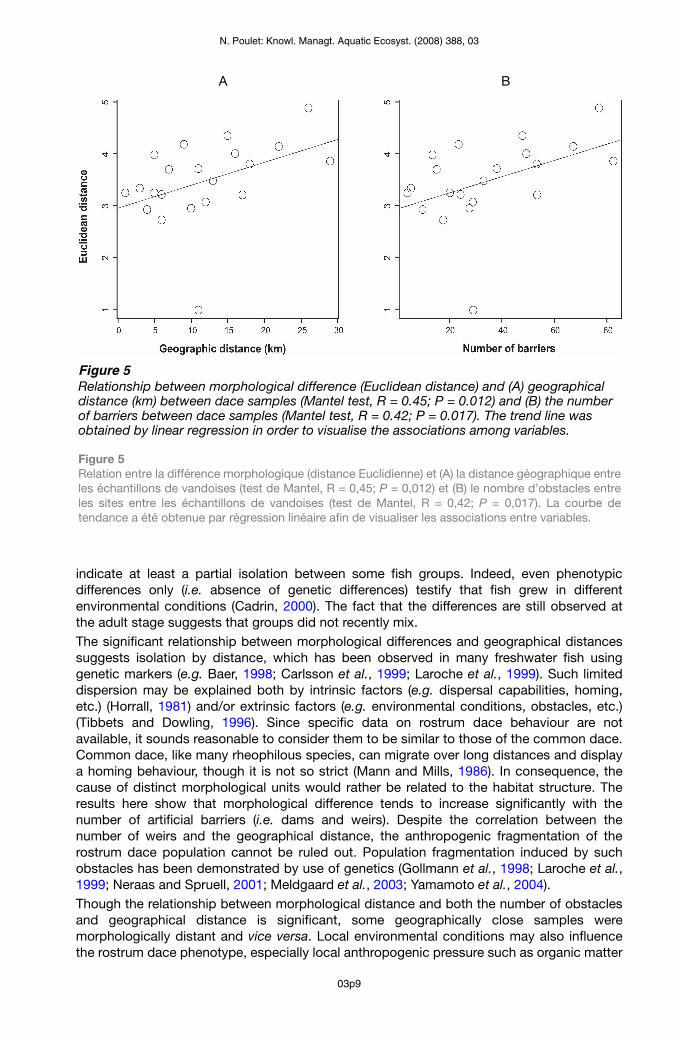
The LDA allowed the discrimination of site origin within dace samples (Figure 3). The first two axes represented more than 50% of the total variance, contributing 31.3% and 25.2%, respectively. The first axis parted samples according to the eye diameter, the size of the peduncle, the length of the lower part of the head and the size of the front part of the body. The second axis discriminated fish according to their body length and depth (Figure 3).From the original matrix, the percentage of individuals correctly classified ranged from 65% (sample E) to 97% (sample G) with a mean of 85.6%. After the cross-validation procedure, the percentage of correctly classified individuals ranged from 52% (sample E) to 87% (sample G) with a mean of 70.7% (Table II). The randomisation procedure generates the null distribution of the percentages of correctly classified individuals: all observed values were much higher than the 1000 simulated values (Figure 4); the percentage of correctly classified individuals observed in the LDA (including after cross-validation) is therefore highly significant (P < 0.001). Although some groups overlapped, some were clearly distinct (e.g. G from A and B) (Figure 3).Despite an outlier corresponding to the F-G pair, a significant correlation was found between geographical and morphological distance, as well as between the number of obstacles (weirs) and morphological distance (Table III, Figure 5). Individuals from the F sample wereprojected a posteriori, which could slightly bias the Euclidean distances. The partial Mantel test did not allow the disentanglement of the geographical distance effect from the barriers’ effect, or the conclusion of their respective effects; probably because of the too strong link between the two explicative variables (Table III).
Figure 3Results of the linear discriminant analysis. A: Eigen values; B: correlation coefficient between the canonical variables and the initial variables (the variables are labelled according to landmarks (see Figure 2); C: canonical scores of the individuals. The ellipses include 67% of the individuals of each sample. The letter indicates the name of the population and the barycentre.
Figure 3 Résultats de l’analyse discriminante. A : Valeurs propres ; B : coefficient de corrélation entre les variables canoniques et les variables initiales (les variables sont désignées selon leurs points homologues) ; C : scores canoniques des individus. Les ellipses comprennent 67 % des individus de chaque échantillon de vandoise. La lettre indique le nom de la population et son barycentre.
03p6

N. Poulet: Knowl. Managt. Aquatic Ecosyst. (2008) 388, 03
DISCUSSION
Morphological differences were observed between rostrum dace samples captured along the same river. Generally, morphometric studies deal with exploited species in oceans and/or large lakes, and very distant populations (Casselman et al., 1981; Hurlbut and Clay, 1998; Cadrin, 2000). To identify populations in a narrower range, such as within a river, genetic markers have almost exclusively been used (Carlsson et al., 1999; Laroche et al., 1999; Meldgaard et al., 2003). An exception is the identification of morphotypes (e.g. resident vs.migrant) (Pakkasmaa and Piironen, 2001), where morphological features may be used. However, very few studies used morphometrics to identify distinct fish units belonging to the same species on a fine scale (but see Bjøru and Sandlund, 1995). The present work shows that a non-invasive, simple and economical technique like morphometrics can be used, as a first step, or in complement with other techniques to investigate fish population structure on a fine scale.There is a very little chance that the morphological difference observed was due to sexual dimorphism: some samples with numerous individuals (i.e. > 30) appear well discriminated (e.g. A vs. G); this would suppose that each sample was composed of one sex exclusively, which does not seem realistic in a wild population of a gonochoristic species.The morphological differences found here are congruent with a previous study using scale shape for three sites studied here (A, D and G) (Poulet et al., 2005). However, the percentage of correct classification obtained from the body shape is higher. This discrepancy between
Table IIConfusion matrix from the linear discriminant analysis. The values are the % of correctly classified individuals (both from the original matrix and from the cross-validation procedure). The mean % of correctly classified individuals is 85.6% in the original matrix and 70.7% after the cross-validation procedure.
Tableau II Matrice de confusion de l’analyse discriminante. Les valeurs sont les % d’individus bien classés (calculés à partir de la matrice originale et de la validation croisée). Le pourcentage moyen d’individus bien classés est 85,6 % dans la matrice originale et 70,7 % après validation croisée.
Matrix Observed site Predicted site membership
Original A B C D E G Total
A 92 5 0 3 0 0 100
B 11 72 0 6 11 0 100
C 0 7 87 0 6 0 100
D 3 0 0 86 0 11 100
E 9 4 13 0 65 9 100
G 0 0 0 0 3 97 100
Cross-validation
A 73 8 5 11 0 3 100
B 11 56 0 6 27 0 100
C 0 20 60 0 20 0 100
D 6 0 3 75 0 16 100
E 13 4 13 9 52 9 100
G 0 0 3 3 7 87 100
03p7
N. Poulet: Knowl. Managt. Aquatic Ecosyst. (2008) 388, 03
results from body and scale shape has already been observed and may be attributed to the reliance of the different approaches (85.6% vs. 75.6%) (Waldman et al., 1997).It would be risky to state if the morphological units observed here are “populations” or “sub-populations”. To determine the extent of reproductive isolation, complementary methods should be used (genetics, capture-mark-recapture, biotelemetry, etc.). However, whatever the origin of the observed differences (i.e. genetic and/or phenotypic plasticity), they do
Figure 4The randomisation test of the % of correctly classified individuals from the original matrix and after the cross-validation procedure (1000 random permutations). The arrow indicates the observed values.
Figure 4 Test de permutations sur les % d’individus bien classés dans la matrice originale et après la validation croisée (1000 permutations aléatoires). Les flèches indiquent les valeurs observées.
Table IIIMantel and partial Mantel correlation tests based on 1000 permutations. ED: Euclidean distance between samples’ barycentres; GD: geographical distance between sites; NB: number of barriers between sites. The variables in brackets are the removed effects.
Tableau III Tests de Mantel et Mantel partiel basés sur 1000 permutations. ED : Distance Euclidienne entre les barycentres des échantillons ; GD : distance géographique entre les sites ; NB : nombre d’obstacles entre les sites. Les variables entre parenthèses sont les effets éliminés.
Test Coefficient correlation P-value
ED vs. GD 0.45 0.012
ED vs. NB 0.42 0.017
GD vs. NB 0.98 0.001
ED vs. NB (GD) –0.13 0.75
ED vs. ED (NB) 0.21 0.15
03p8
N. Poulet: Knowl. Managt. Aquatic Ecosyst. (2008) 388, 03
indicate at least a partial isolation between some fish groups. Indeed, even phenotypic differences only (i.e. absence of genetic differences) testify that fish grew in different environmental conditions (Cadrin, 2000). The fact that the differences are still observed at the adult stage suggests that groups did not recently mix.The significant relationship between morphological differences and geographical distances suggests isolation by distance, which has been observed in many freshwater fish using genetic markers (e.g. Baer, 1998; Carlsson et al., 1999; Laroche et al., 1999). Such limited dispersion may be explained both by intrinsic factors (e.g. dispersal capabilities, homing, etc.) (Horrall, 1981) and/or extrinsic factors (e.g. environmental conditions, obstacles, etc.) (Tibbets and Dowling, 1996). Since specific data on rostrum dace behaviour are not available, it sounds reasonable to consider them to be similar to those of the common dace. Common dace, like many rheophilous species, can migrate over long distances and display a homing behaviour, though it is not so strict (Mann and Mills, 1986). In consequence, the cause of distinct morphological units would rather be related to the habitat structure. The results here show that morphological difference tends to increase significantly with the number of artificial barriers (i.e. dams and weirs). Despite the correlation between the number of weirs and the geographical distance, the anthropogenic fragmentation of the rostrum dace population cannot be ruled out. Population fragmentation induced by such obstacles has been demonstrated by use of genetics (Gollmann et al., 1998; Laroche et al., 1999; Neraas and Spruell, 2001; Meldgaard et al., 2003; Yamamoto et al., 2004). Though the relationship between morphological distance and both the number of obstacles and geographical distance is significant, some geographically close samples were morphologically distant and vice versa. Local environmental conditions may also influence the rostrum dace phenotype, especially local anthropogenic pressure such as organic matter
A B
Figure 5Relationship between morphological difference (Euclidean distance) and (A) geographical distance (km) between dace samples (Mantel test, R = 0.45; P = 0.012) and (B) the number of barriers between dace samples (Mantel test, R = 0.42; P = 0.017). The trend line was obtained by linear regression in order to visualise the associations among variables.
Figure 5 Relation entre la différence morphologique (distance Euclidienne) et (A) la distance géographique entre les échantillons de vandoises (test de Mantel, R = 0,45; P = 0,012) et (B) le nombre d’obstacles entre les sites entre les échantillons de vandoises (test de Mantel, R = 0,42; P = 0,017). La courbe de tendance a été obtenue par régression linéaire afin de visualiser les associations entre variables.
03p9
N. Poulet: Knowl. Managt. Aquatic Ecosyst. (2008) 388, 03
discharge from duck or pork breeding or from wastewater treatment plants. To disentangle the respective influences of the different factors (i.e. environmental factors, geographical distance and number of obstacles) on the dace phenotype, comparison with rostrum dace populations living in comparable rivers (i.e. drainage area, geology and slope) but displaying no obstacles should be undertaken.The present study suggests a limited dispersal of the rostrum daces in the Viaur River. This might be a problem for the survival of this species. First, rostrum dace is dramatically impacted by parasites (Loot et al., 2004). Then, both the hydroelectric and the numerous hillside dams have dramatically decreased water flow in winter and therefore, increased siltation, especially after their flushing (Dauba, 1994; Salvan, 1996; Guilmet, 1997). Siltation has worsened because of the numerous weirs which prevent the drain-off of the silt. Consequently, this might dramatically decrease the area of rostrum dace spawning grounds (Mills, 1981) but also those of the other native lithophilous species such as brown trout and French nase (Chondrostoma toxostoma). Historical data (Buffault, 1904) suggest that these species have decreased since the beginning of the twentieth century in the Viaur catchment. Oral reports from residents confirmed this and included the rostrum dace among the declining species. All these events suggest that rostrum dace is particularly vulnerable in the Viaur catchment. A risk of local extinction cannot be ruled out, especially for the most upstream units which are particularly isolated due to the numerous barriers preventing the upstream migrations from the downstream units. Further studies using complementary techniques (i.e. genetic, life history traits, otolith chemistry, etc.) may be useful to refine this result (Begg and Waldman, 1999). From a conservation point of view, several actions could help to recover fish dispersal and habitat such as increasing minimum flow downstream of the dams, erase weirs when possible, or failing this, build fish passes.
ACKNOWLEDGMENTS
Grateful thanks to S. Lek (University of Toulouse III) for his assistance throughout this study and to P. Berrebi (University of Montpellier II) for his useful comments on the earlier version of this manuscript. Many thanks to G. Loot (University of Toulouse III) who added a new dace sample and to M. Guilmet (Aveyron Anglers’ Federation) who provided invaluable information about the Viaur River. I am indebted to M. Pratt for his assistance with the English language and to P. Balaresque for her useful comments on the last version of the manuscript. I also wish to thank the two anonymous referees who considerably helped to improve this manuscript.
REFERENCES
Baer C.F., 1998. Population structure in a south-eastern US freshwater fish, Heterandria formosa. II. Gene flow and biogeography within the St. Johns River drainage. Heredity, 81, 404–411.
Begg G.A. and Waldman J.R., 1999. An holistic approach to fish stock identification. Fish. Res., 43, 35–44.Bjøru B. and Sandlund O.T., 1995. Differences in morphology and ecology within a stunted Arctic char
population. Nordic J. Freshw. Res., 71, 163–172.Bruslé J. and Quignard J.P., 2001. Biologie des poissons d'eau douce européens, Paris, Lavoisier Tec
& Doc, 625 p.Buffault P., 1904. Essai sur les eaux et la pêche fluviale dans le département de l'Aveyron, Rodez,
Imprimerie P. Carrère, 159 p.Cadrin S.X., 2000. Advances in morphometric identification of fishery stocks. Rev. Fish Biol. Fish., 10,
91–112.Camus P.A. and Lima M., 2002. Populations, metapopulations, and the open-closed dilemma: the conflict
between operational and natural population concepts. Oikos, 97, 433–438.Carlsson J., Olsen K.H., Nilsson J., Overli O. and Stabell O.B., 1999. Microsatellites reveal fine-scale
genetic structure in stream-living brown trout. J. Fish Biol., 55, 1290–1303.
03p10
N. Poulet: Knowl. Managt. Aquatic Ecosyst. (2008) 388, 03
Carvalho G.R., 1993. Evolutionary aspects of fish distribution: genetic variability and adaptation. J. Fish Biol., 43, 53–73.
Casselman J.M., Collins J.J., Crossman E.J., Ihssen P.E. and Spangler G.R., 1981. Lake whitefish (Coregonus clupeaformis) stocks of the Ontario waters of Lake Huron. Can. J. Fish. Aquat. Sci., 38, 1772–1789.
Chessel D., Dufour A.B. and Thioulouse J., 2004. The ade4 package-I: One-table methods. R News, 4, 5–10.
Costedoat C., Chappaz R., Barascud B., Guillard O. and Gilles A., 2006. Heterogeneous colonization pattern of European Cyprinids, as highlighted by the dace complex (Teleostei: Cyprinidae). Mol. Phyl. Evol., 41, 127–148.
Dauba F., 1994. Étude de l’influence de la vidange de Pareloup sur la faune des poissons et du Viaur, Rapport d'étude, ENSAT, Toulouse, 22 p.
Dynesius M. and Nilsson C., 1994. Fragmentation and flow regulation of river systems in the northern 3rd of the world. Science, 266, 753–762.
Efron B., 1982. The jacknife, the bootstrap and other resampling plans, Philadelphia, Society for Industrial and Applied Mathematics, 90 p.
Gollmann G., Bouvet Y., Brito R.M., Coelho M.M., Collares Pereira M.J., Imsiridou A., Karakousis Y., Pattee E. and Triantaphyllidis C., 1998. Effects of river engineering on genetic structure of European fish populations. In: Jungwirth M., Schmutz S. and Weiss S., Fish Migration and Fish Bypasses, Blackwell Science Ltd, Oxford, pp. 113–126.
Guilmet M., 1997. Schéma départemental de vocation piscicole – Aveyron – Bassin du Viaur – Synthèse, FDAAPPMA de l'Aveyron, Rodez, 102 p.
Hard J.J., Winans G.A. and Richardson J.C., 1999. Phenotypic and genetic architecture of juvenile morphometry in Chinook salmon. J. Hered., 90, 597–606.
Horrall R.M., 1981. Behavioral stock-isolating mechanisms in Great Lakes fishes with special reference to homing and site imprinting. Can. J. Fish. Aquat. Sci., 38, 1481–1496.
Hurlbut T. and Clay D., 1998. Morphometric and meristic differences between shallow- and deep-water populations of white hake (Urophycis tenuis) in the southern Gulf of St. Lawrence. Can. J. Fish. Aquat. Sci., 55, 2274–2282.
Huxley J.S., 1932. Problems of relative growth, London, Methuen & Co, 360 p.Iucn, 2001. IUCN Red list categories and criteria, v. 3.1. Gland, Switzerland, IUCN — The World
Conservation Union, 32 p.Jordan M.A. and Snell H.L., 2008. Historical fragmentation of islands and genetic drift in populations of
Galapagos lava lizards (Microlophus albemarlensis complex). Mol. Ecol., 17, 1224–1237.Kottelat M. and Freyhof J., 2007. Handbook of European freshwater fishes, Cornol, Switzerland and
Berlin, Germany, 646 p.Laroche J., Durand J.D., Bouvet Y., Guinand B. and Brohon B., 1999. Genetic structure and differentiation
among populations of two cyprinids, Leuciscus cephalus and Rutilus rutilus, in a large European river. Can. J. Fish. Aquat. Sci., 56, 1659–1667.
Lelek A., 1987. Threatened fishes of Europe, Aulag-Verlag, European Committee for Conservation of Nature and Natural Resource, Council of Europe, 343 p.
Loot G., Poulet N., Reyjol Y., Blanchet S. and Lek S., 2004. The effects of the ectoparasite Tracheliastes polycolpus (Copepoda: Lernaeopodidae) on the fins of rostrum dace (Leuciscus leuciscus burdigalensis). Parasitol. Res., 94, 16–23.
Mann R.H.K., 1996. Environmental requirements of European non-salmonid fish in rivers. Hydrobiologia, 323, 223–235.
Mann R.H.K. and Mills C.A., 1986. Biological and climatic influences on the dace Leuciscus leuciscus in a southern chalk-stream. Annu. Rep. Freshwater. Biol. Assoc., 54, 123–136.
Meldgaard T., Nielsen E.E. and Loeschcke V., 2003. Fragmentation by weirs in a riverine system: A study of genetic variation in time and space among populations of European grayling (Thymallus thymallus) in a Danish river system. Conserv. Genet., 4, 735–747.
Mills C.A., 1981. The attachment of dace, Leuciscus leuciscus (L.), eggs to the spawning substratum and the influence of changes in water current on their survival. J. Fish Biol., 19, 129–134.
Morita K. and Yamamoto S., 2002. Effects of habitat fragmentation by damming on the persistence of stream-dwelling charr populations. Conserv. Biol., 16, 1318–1323.
Myers N., Mittermeier R.A., Mittermeier C.G., DA Fonseca G.A.B. and Kent J., 2000. Biodiversity hotspots for conservation priorities. Nature, 403, 853–858.
Neraas L.P. and Spruell P., 2001. Fragmentation of riverine systems: the genetic effects of dams on bull trout (Salvelinus confluentus) in the Clark Fork River system. Mol. Ecol., 10, 1153–1164.
03p11
N. Poulet: Knowl. Managt. Aquatic Ecosyst. (2008) 388, 03
Nicieza A.G., 1995. Morphological variation between geographically disjunct populations of Atlantic salmon: the effects of ontogeny and habitat shift. Funct. Ecol., 9, 448–456.
Nilsson C., Reidy C.A., Dynesius M. and Revenga C., 2005. Fragmentation and flow regulation of the world’s large river systems. Science, 308, 405–408.
Oksanen J., Kindt R., Legendre P. and O'Hara R.B., 2006. vegan: Community Ecology Package version 1.8–2.
Ovidio M. and Philippart J.C., 2002. The impact of small physical obstacles on upstream movements of six species of fish – Synthesis of a 5-year telemetry study in the River Meuse basin. Hydrobiologia, 483, 55–69.
Pakkasmaa S. and Piironen J., 2000. Water velocity shapes juvenile salmonids. Evol. Ecol., 14, 721–730.Pakkasmaa S. and Piironen J., 2001. Morphological differentiation among local trout (Salmo trutta)
populations. Biol. J. Linn. Soc., 72, 231–239.Penczak T. and Kruk A., 2000. Threatened obligatory riverine fishes in human-modified Polish rivers. Ecol.
Freshwat. Fish, 9, 109–117.Persat H., 2001. La vandoise. In: Keith P. and Allardi J. (eds.), Atlas des poissons d'eau douce de France,
p. 387, Patrimoines naturels, Paris.Poulet N., 2007. Impact of weirs on fish community in a piedmont stream. Riv. Res. Appl., 23, 1038–1047.Poulet N., Reyjol Y., Collier H. and Lek S., 2005. Does fish scale morphology allow the identification of
populations at a local scale? A case study for rostrum dace Leuciscus leuciscus burdigalensis in River Viaur (SW France). Aquat. Sci., 67, 122–127.
Reist J.D., 1985. An empirical evaluation of several univariate methods that adjust for size variation in morphometric data. Can. J. Zool., 63, 1429–1439.
Robinson B.W. and Wilson D.S., 1996. Genetic variation and phenotypic plasticity in a trophically polymorphic population of pumpkinseed sunfish (Lepomis gibbosus). Evol. Ecol., 10, 631–652.
Rohlf F.J., 1999. TpsDig. Version 1.20, Department of Ecology and Evolution, Stony Brook, NY, State University of New York.
Salvan S., 1996. Étude des impacts de la vidange de la retenue de Pont de Salars sur les macroinvertébrés benthiques et sur les salmonidés (Salmo trutta fario L.) dans la partie aval du Viaur. Synthèse des trois vidanges : Pareloup, Bage et Pont de Salars (1993–1995), Université Paul Sabatier, Toulouse.
Silva A., 2003. Morphometric variation among sardine (Sardina pilchardus) populations from the northeastern Atlantic and the western Mediterranean. ICES J. Mar. Sci., 60, 1352–1360.
Solow A.R., 1990. A randomization test for misclassification probability in discriminant analysis. Ecology, 71, 2379–2382.
Spillmann C.J., 1961. Faune de France, 65 poissons d'eau douce, Paris, Éditions Paul Lechevalier, 304 p.Strauss R.E. and Bookstein F.L., 1982. The truss: body form reconstruction in morphometrics. Syst. Zool.,
31, 113–135.Team R.D.C., 2005. R: A language and environment for statistical computing. R Foundation for Statistical
Computing, Vienna, Austria.Tibbets C.A. and Dowling T.E., 1996. Effects of intrinsic and extrinsic factors on population fragmentation
in three species of North American minnows (Teleostei: Cyprinidae). Evolution, 50, 1280–1292.Tomassone R., Danzard M., Daudin J.J. and Masson J.P., 1988. Discrimination et classement, Paris,
Masson, 173 p.Turan C., Oral M., Ozturk B. and Duzgunes E., 2006. Morphometric and meristic variation between stocks
of Bluefish (Pomatomus saltatrix) in the Black, Marmara, Aegean and northeastern Mediterranean Seas. Fish. Res., 79, 139–147.
Venables W.N. and RIPLEY B.D., 2002. Modern applied statistics with S, New York, Springer-Verlag, Inc., 495 p.
Waldman J.R., Richards R.A., Schill W.B., Wirgin I. and Fabrizio M.C., 1997. An empirical comparison of stock identification techniques applied to striped bass. Trans. Am. Fish. Soc., 126, 369–385.
West-Eberhard M.J., 1989. Phenotypic plasticity and the origins of diversity. Ann. Rev. Ecol. Syst., 20, 249–278.
Winter H.V. and Van Densen W.L.T., 2001. Assessing the opportunities for upstream migration of non- salmonid fishes in the weir-regulated River Vecht. Fish. Manage. Ecol., 8, 513–532.
Wintzer A.P. and Motta P.J., 2005. Diet-induced phenotypic plasticity in the skull morphology of hatchery-reared Florida largemouth bass, Micropterus salmoides floridanus. Ecol. Freshwat. Fish, 14, 311–318.
Yamamoto S., Morita K., Koizumi I. and Maekawa K., 2004. Genetic differentiation of white-spotted charr (Salvelinus leucomaenis) populations after habitat fragmentation: Spatial-temporal changes in gene frequencies. Conserv. Genet., 5, 529–538.
03p12