PCSL Security Solution Performance Review - PCSL IT Consulting
21
PCSL Security Solution Performance Review Platform: Windows 8 x64 Jiaxing Chenxiang Information Technology CO., LTD. 2013 October
Transcript of PCSL Security Solution Performance Review - PCSL IT Consulting

PCSL Security Solution
Performance Review
Platform: Windows 8 x64
Jiaxing Chenxiang Information Technology CO., LTD. 2013 October

PCSL Security Solution Performance Review ■ 2013 October
© 2011-2014 JIAXING CHENXIANG INFORMATION TECHNOLOGY CO., LTD. All rights reserved. 1
Table of Contents
1. BACKGROUD .................................................................................................................................... 2
2. INTRODUCTION ............................................................................................................................... 2
3. REVIEW PROCESS ......................................................................................................................... 3
4. PRODUCT TESTED ......................................................................................................................... 3
5. RESULTS ............................................................................................................................................ 4
5.1 SYSTEM IDLE (15MINS)............................................................................................................. 4
5.1.1 AVERAGE POWER CONSUMPTION .................................................................................. 4
5.1.2 AVERAGE CPU USAGE ......................................................................................................... 5
5.1.3 AVERAGE RAM USAGE ......................................................................................................... 6
5.2 WEB BROWSING AND VIDEO PLAY(15MINS) .................................................................... 7
5.2.1 AVERAGE POWER CONSUMPTION .................................................................................. 7
5.2.2 AVERAGE CPU USAGE ......................................................................................................... 8
5.2.3 AVERAGE RAM USAGE ......................................................................................................... 9
5.3 FILE COPY(15MINS) ................................................................................................................. 10
5.3.1 AVERAGE POWER CONSUMPTION ................................................................................ 10
5.3.2 AVERAGE CPU USAGE ....................................................................................................... 11
5.3.3 AVERAGE RAM USAGE ....................................................................................................... 12
5.4 PROGRAM INSTALLATION(15MINS) ................................................................................... 13
5.4.1 AVERAGE POWER CONSUMPTION ................................................................................ 13
5.4.2 AVERAGE CPU USAGE ....................................................................................................... 14
5.4.3 AVERAGE RAM USAGE ....................................................................................................... 15
5.5 OVERALL SCORE ...................................................................................................................... 16
6. TESTER INTRODUCTION ............................................................................................................ 17
7. RIGHTS STATEMENT ................................................................................................................... 17
8. DISCLAIMER ................................................................................................................................... 18
CONTACT US
ROOM 3304-3306, BUILDING 3, NO.3339 LINGGONGTANG ROAD, JIAXING, ZHEJIANG, P. R. CHINA
TEL: +86 573 82809089 FAX: +86 573 82808561 Mail:[email protected]
PCSL Security Solution Performance Review ■ 2013 October
© 2011-2014 JIAXING CHENXIANG INFORMATION TECHNOLOGY CO., LTD. All rights reserved. 2
1. BACKGROUD
Regardless of mobility devices and computer machines, people always complain that the
system is too slow, faster battery drain happens all the time, etc. Although the technical
development of hardware can bring higher performance improvement, we still think that
through the optimization of software, a better system performance can be achieved. That
is to say, software is an influence factor to system performance and also user experience.
We can use tools and also electronic equipment to monitor the hardware and electricity
consumption of the whole system and then we can indirectly find the lowest system
resource consuming software out of many software of the same type.
2. INTRODUCTION
In electrical engineering, power consumption often refers to the electrical energy over
time supplied to operate an electrical appliance. The energy used by equipment is always
more than the energy really needed. This is because no equipment is 100% efficient. Power
is wasted as heat, vibrations and/or electromagnetic radiation. Power consumption is
usually measured in units of kilowatt hours (kWh).More accurately, power is the rate of
consumption of energy, measured in watts or horsepower.
Mobility devices and computer machines are all made of different hardware components,
e.g. CPU, RAM, Disk, etc. Hardware components consumes electricity or energy from
battery to run and software utilizes hardware to realize the functions. So, higher overall
hardware resources consumption, slower system operation speed, higher power
consumption (no matter computer power supply or battery). We have tools on both
android system and also windows system to monitor the overall CPU usage and RAM
usage and also electronic equipment (regulated power supply for mobility devices and
power meter for computers) to monitor the power consumption.
PCSL Security Solution Performance Review ■ 2013 October
© 2011-2014 JIAXING CHENXIANG INFORMATION TECHNOLOGY CO., LTD. All rights reserved. 3
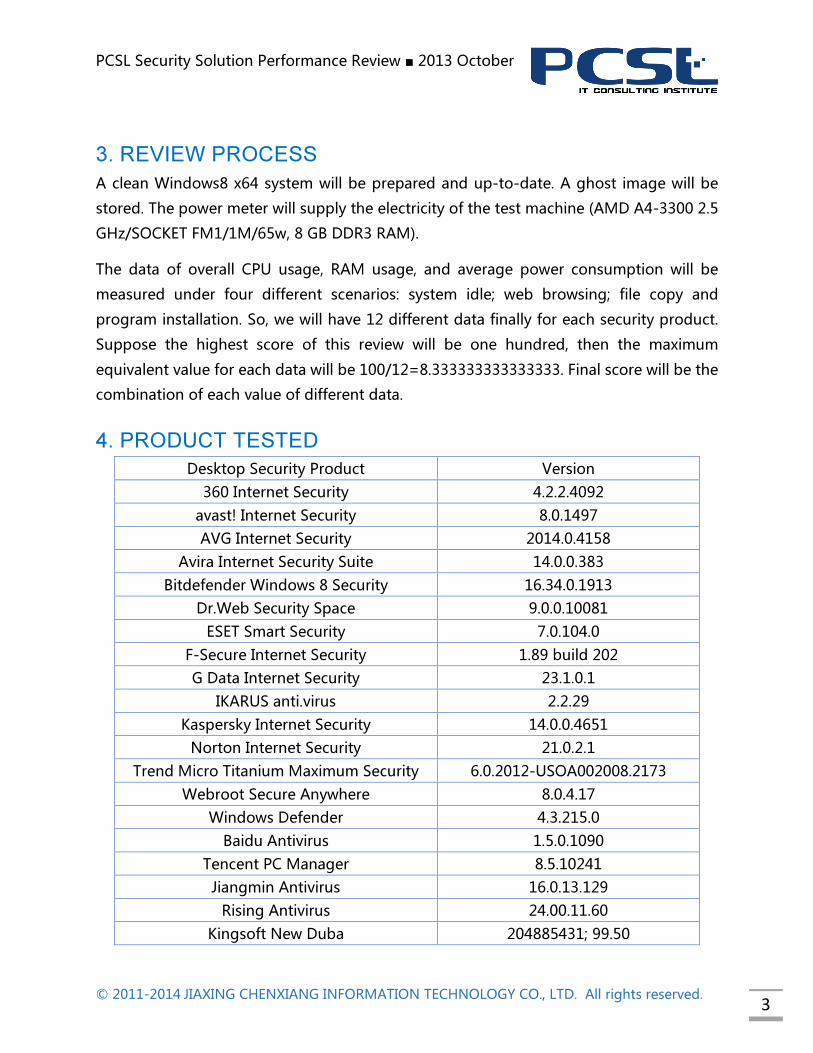
3. REVIEW PROCESS
A clean Windows8 x64 system will be prepared and up-to-date. A ghost image will be
stored. The power meter will supply the electricity of the test machine (AMD A4-3300 2.5
GHz/SOCKET FM1/1M/65w, 8 GB DDR3 RAM).
The data of overall CPU usage, RAM usage, and average power consumption will be
measured under four different scenarios: system idle; web browsing; file copy and
program installation. So, we will have 12 different data finally for each security product.
Suppose the highest score of this review will be one hundred, then the maximum
equivalent value for each data will be 100/12=8.333333333333333. Final score will be the
combination of each value of different data.
4. PRODUCT TESTED
Desktop Security Product Version
360 Internet Security 4.2.2.4092
avast! Internet Security 8.0.1497
AVG Internet Security 2014.0.4158
Avira Internet Security Suite 14.0.0.383
Bitdefender Windows 8 Security 16.34.0.1913
Dr.Web Security Space 9.0.0.10081
ESET Smart Security 7.0.104.0
F-Secure Internet Security 1.89 build 202
G Data Internet Security 23.1.0.1
IKARUS anti.virus 2.2.29
Kaspersky Internet Security 14.0.0.4651
Norton Internet Security 21.0.2.1
Trend Micro Titanium Maximum Security 6.0.2012-USOA002008.2173
Webroot Secure Anywhere 8.0.4.17
Windows Defender 4.3.215.0
Baidu Antivirus 1.5.0.1090
Tencent PC Manager 8.5.10241
Jiangmin Antivirus 16.0.13.129
Rising Antivirus 24.00.11.60
Kingsoft New Duba 204885431; 99.50
PCSL Security Solution Performance Review ■ 2013 October
© 2011-2014 JIAXING CHENXIANG INFORMATION TECHNOLOGY CO., LTD. All rights reserved. 4
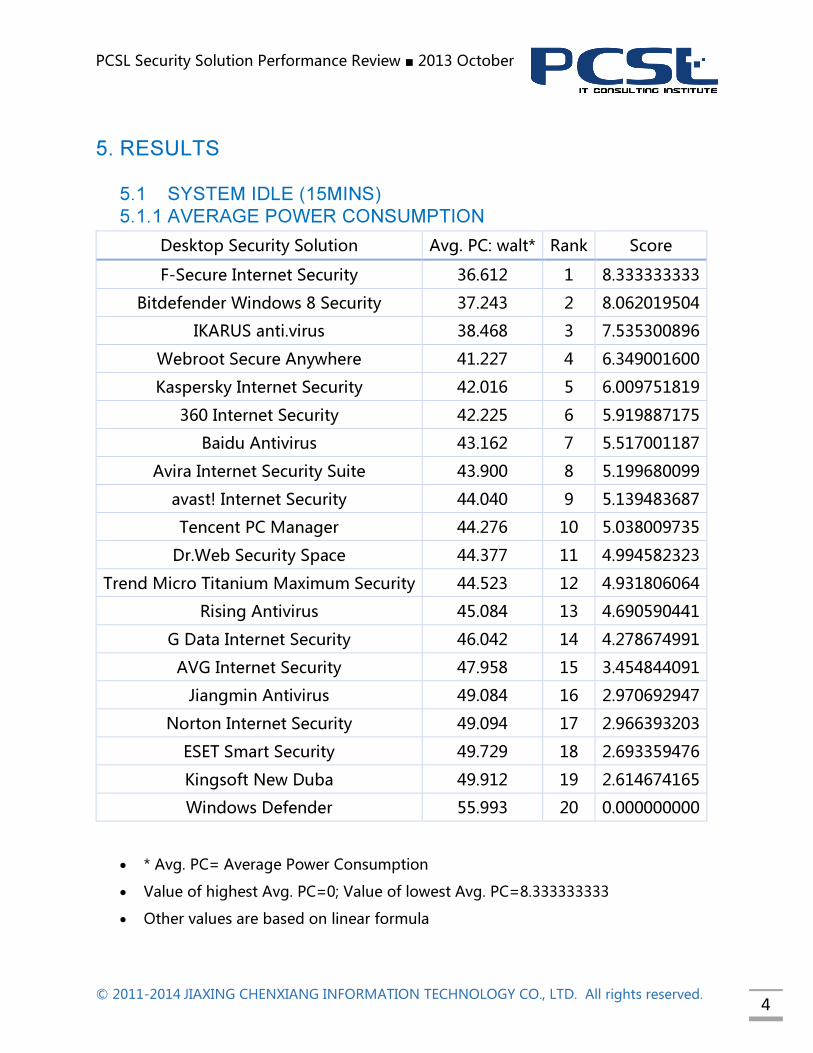
5. RESULTS
5.1 SYSTEM IDLE (15MINS)
5.1.1 AVERAGE POWER CONSUMPTION
Desktop Security Solution Avg. PC: walt* Rank Score
F-Secure Internet Security 36.612 1 8.333333333
Bitdefender Windows 8 Security 37.243 2 8.062019504
IKARUS anti.virus 38.468 3 7.535300896
Webroot Secure Anywhere 41.227 4 6.349001600
Kaspersky Internet Security 42.016 5 6.009751819
360 Internet Security 42.225 6 5.919887175
Baidu Antivirus 43.162 7 5.517001187
Avira Internet Security Suite 43.900 8 5.199680099
avast! Internet Security 44.040 9 5.139483687
Tencent PC Manager 44.276 10 5.038009735
Dr.Web Security Space 44.377 11 4.994582323
Trend Micro Titanium Maximum Security 44.523 12 4.931806064
Rising Antivirus 45.084 13 4.690590441
G Data Internet Security 46.042 14 4.278674991
AVG Internet Security 47.958 15 3.454844091
Jiangmin Antivirus 49.084 16 2.970692947
Norton Internet Security 49.094 17 2.966393203
ESET Smart Security 49.729 18 2.693359476
Kingsoft New Duba 49.912 19 2.614674165
Windows Defender 55.993 20 0.000000000
• * Avg. PC= Average Power Consumption
• Value of highest Avg. PC=0; Value of lowest Avg. PC=8.333333333
• Other values are based on linear formula

PCSL Security Solution Performance Review ■ 2013 October
© 2011-2014 JIAXING CHENXIANG INFORMATION TECHNOLOGY CO., LTD. All rights reserved. 5
5.1.2 AVERAGE CPU USAGE
Desktop Security Solution CPU Usage: % Ranking Score
F-Secure Internet Security 0.722% 1 8.333333333
Bitdefender Windows 8 Security 2.701% 2 8.072521297
IKARUS anti.virus 7.947% 3 7.381151948
Kaspersky Internet Security 16.194% 4 6.294281377
360 Internet Security 18.911% 5 5.936208460
Webroot Secure Anywhere 20.201% 6 5.766199604
Baidu Antivirus 22.511% 7 5.461765140
Dr.Web Security Space 22.669% 8 5.440942350
avast! Internet Security 23.719% 9 5.302563048
Avira Internet Security Suite 23.791% 10 5.293074182
Tencent PC Manager 24.672% 11 5.176967358
AVG Internet Security 25.519% 12 5.065341388
Rising Antivirus 29.955% 13 4.480721786
Trend Micro Titanium Maximum Security 33.979% 14 3.950399587
G Data Internet Security 34.569% 15 3.872643598
Jiangmin Antivirus 37.423% 16 3.496515477
ESET Smart Security 39.107% 17 3.274581436
Kingsoft New Duba 43.179% 18 2.737933325
Norton Internet Security 51.067% 19 1.698375295
Windows Defender 63.954% 20 0.000000000
• Value of highest CPU usage=0; Value of lowest CPU usage=8.333333333
• Other values are based on linear formula

PCSL Security Solution Performance Review ■ 2013 October
© 2011-2014 JIAXING CHENXIANG INFORMATION TECHNOLOGY CO., LTD. All rights reserved. 6
5.1.3 AVERAGE RAM USAGE
Desktop Security Solution RAM Usage: % Ranking Score
Webroot Secure Anywhere 13.476% 1 8.333333333
Windows Defender 13.992% 2 7.278894883
Tencent PC Manager 14.205% 3 6.843632500
Rising Antivirus 14.687% 4 5.858672552
Bitdefender Windows 8 Security 14.953% 5 5.315105444
Kaspersky Internet Security 15.123% 6 4.967712931
360 Internet Security 15.330% 7 4.544711460
Avira Internet Security Suite 15.463% 8 4.272927906
ESET Smart Security 15.543% 9 4.109449076
IKARUS anti.virus 15.548% 10 4.099231650
Kingsoft New Duba 16.075% 11 3.022314860
Baidu Antivirus 16.126% 12 2.918097106
Jiangmin Antivirus 16.136% 13 2.897662253
Trend Micro Titanium Maximum Security 16.558% 14 2.035311427
AVG Internet Security 16.563% 15 2.025094000
F-Secure Internet Security 16.596% 16 1.957658983
avast! Internet Security 16.771% 17 1.600049044
G Data Internet Security 17.250% 18 0.621219552
Dr.Web Security Space 17.420% 19 0.273827039
Norton Internet Security 17.554% 20 0.000000000
• Value of highest RAM usage=0; Value of lowest RAM usage=8.333333333
• Other values are based on linear formula

PCSL Security Solution Performance Review ■ 2013 October
© 2011-2014 JIAXING CHENXIANG INFORMATION TECHNOLOGY CO., LTD. All rights reserved. 7
5.2 WEB BROWSING AND VIDEO PLAY(15MINS)
5.2.1 AVERAGE POWER CONSUMPTION
Desktop Security Solution Avg. PC: walt* Rank Score
Kingsoft New Duba 44.749 1 8.333333333
Jiangmin Antivirus 45.013 2 8.152916735
Rising Antivirus 45.625 3 7.734678257
Tencent PC Manager 45.778 4 7.630118638
Kaspersky Internet Security 46.216 5 7.330791099
avast! Internet Security 46.364 6 7.229648461
Trend Micro Titanium Maximum Security 46.706 7 6.995926959
Baidu Antivirus 46.942 8 6.834645454
Windows Defender 47.228 9 6.639194139
G Data Internet Security 47.449 10 6.488163578
Webroot Secure Anywhere 47.507 11 6.448526598
Dr.Web Security Space 47.511 12 6.445793013
Avira Internet Security Suite 48.328 13 5.887458313
Norton Internet Security 48.370 14 5.858755672
AVG Internet Security 48.908 15 5.491088513
Bitdefender Windows 8 Security 49.775 16 4.898584003
360 Internet Security 50.233 17 4.585588541
F-Secure Internet Security 51.966 18 3.401262916
IKARUS anti.virus 52.266 19 3.196244054
ESET Smart Security 56.943 20 0.000000000
• * Avg. PC= Average Power Consumption
• Value of highest Avg. PC=0; Value of lowest Avg. PC=8.333333333
• Other values are based on linear formula
• Using IE 10 to visit 5 same links and play a same video using windows media
player

PCSL Security Solution Performance Review ■ 2013 October
© 2011-2014 JIAXING CHENXIANG INFORMATION TECHNOLOGY CO., LTD. All rights reserved. 8
5.2.2 AVERAGE CPU USAGE
Desktop Security Solution CPU Usage: % Ranking Score
Jiangmin Antivirus 5.200% 1 8.333333333
Kingsoft New Duba 5.486% 2 8.270881919
Tencent PC Manager 6.436% 3 8.063438409
avast! Internet Security 7.222% 4 7.891806200
Rising Antivirus 7.244% 5 7.887002245
Baidu Antivirus 7.584% 6 7.812759304
AVG Internet Security 7.609% 7 7.807300265
Bitdefender Windows 8 Security 9.588% 8 7.375162679
Kaspersky Internet Security 9.645% 9 7.362716069
Windows Defender 10.263% 10 7.227768607
360 Internet Security 11.403% 11 6.978836395
Dr.Web Security Space 11.491% 12 6.959620575
F-Secure Internet Security 11.622% 13 6.931015207
Trend Micro Titanium Maximum Security 11.962% 14 6.856772266
G Data Internet Security 12.784% 15 6.677279040
Avira Internet Security Suite 13.180% 16 6.590807851
Webroot Secure Anywhere 14.524% 17 6.297329874
IKARUS anti.virus 14.913% 18 6.212387216
Norton Internet Security 16.356% 19 5.897291443
ESET Smart Security 43.363% 20 0.000000000
• Value of highest CPU usage=0; Value of lowest CPU usage=8.333333333
• Other values are based on linear formula
• Using IE 10 to visit 5 same links and play a same video using windows media
player

PCSL Security Solution Performance Review ■ 2013 October
© 2011-2014 JIAXING CHENXIANG INFORMATION TECHNOLOGY CO., LTD. All rights reserved. 9
5.2.3 AVERAGE RAM USAGE
Desktop Security Solution RAM Usage: % Ranking Score
IKARUS anti.virus 14.913% 1 8.333333333
G Data Internet Security 18.591% 2 5.049639311
Rising Antivirus 19.301% 3 4.415756017
Webroot Secure Anywhere 20.199% 4 3.614027569
Tencent PC Manager 20.415% 5 3.421184201
avast! Internet Security 20.923% 6 2.967645168
Kingsoft New Duba 21.082% 7 2.825691022
ESET Smart Security 21.417% 8 2.526605242
Jiangmin Antivirus 21.447% 9 2.499821441
Baidu Antivirus 21.641% 10 2.326619527
Kaspersky Internet Security 22.286% 11 1.750767802
360 Internet Security 22.343% 12 1.699878580
Avira Internet Security Suite 22.600% 13 1.470430684
Windows Defender 22.780% 14 1.309727877
Norton Internet Security 22.987% 15 1.124919649
AVG Internet Security 23.441% 16 0.719591458
F-Secure Internet Security 23.492% 17 0.674058996
Trend Micro Titanium Maximum Security 23.850% 18 0.354438969
Dr.Web Security Space 24.052% 19 0.174094708
Bitdefender Windows 8 Security 24.247% 20 0.000000000
• Value of highest RAM usage=0; Value of lowest RAM usage=8.333333333
• Other values are based on linear formula
• Using IE 10 to visit 5 same links and play a same video using windows media
player

PCSL Security Solution Performance Review ■ 2013 October
© 2011-2014 JIAXING CHENXIANG INFORMATION TECHNOLOGY CO., LTD. All rights reserved. 10
5.3 FILE COPY(15MINS)
5.3.1 AVERAGE POWER CONSUMPTION
Desktop Security Solution Avg. PC: walt* Rank Score
Kingsoft New Duba 45.102 1 8.333333333
Tencent PC Manager 46.858 2 7.343189661
360 Internet Security 47.166 3 7.169519814
Norton Internet Security 48.356 4 6.498522679
Baidu Antivirus 49.489 5 5.859665742
Rising Antivirus 50.783 6 5.130026840
F-Secure Internet Security 50.882 7 5.074204389
Windows Defender 51.013 8 5.000338318
Avira Internet Security Suite 51.688 9 4.619730699
IKARUS anti.virus 51.887 10 4.507521934
Bitdefender Windows 8 Security 52.444 11 4.193450166
AVG Internet Security 52.842 12 3.969032636
Trend Micro Titanium Maximum Security 53.428 13 3.638608837
Webroot Secure Anywhere 54.123 14 3.246723955
Kaspersky Internet Security 54.490 15 3.039786183
avast! Internet Security 55.173 16 2.654667659
ESET Smart Security 55.290 17 2.588695672
G Data Internet Security 56.106 18 2.128583350
Jiangmin Antivirus 56.458 19 1.930103525
Dr.Web Security Space 59.881 20 0.000000000
• * Avg. PC= Average Power Consumption
• Value of highest Avg. PC=0; Value of lowest Avg. PC=8.333333333
• Other values are based on linear formula
• Copy bulks of verified clean files from disk d to disk c

PCSL Security Solution Performance Review ■ 2013 October
© 2011-2014 JIAXING CHENXIANG INFORMATION TECHNOLOGY CO., LTD. All rights reserved. 11
5.3.2 AVERAGE CPU USAGE
Desktop Security Solution CPU Usage: % Ranking Score
Kingsoft New Duba 15.495% 1 8.333333333
Tencent PC Manager 20.542% 2 7.627407867
360 Internet Security 21.362% 3 7.512714211
Norton Internet Security 27.552% 4 6.646916979
Baidu Antivirus 30.176% 5 6.279897279
Rising Antivirus 37.059% 6 5.317169920
Avira Internet Security Suite 38.115% 7 5.169466870
AVG Internet Security 38.636% 8 5.096594438
Bitdefender Windows 8 Security 39.092% 9 5.032813575
F-Secure Internet Security 39.479% 10 4.978683764
Windows Defender 40.429% 11 4.845806968
Trend Micro Titanium Maximum Security 48.575% 12 3.706423404
Webroot Secure Anywhere 50.068% 13 3.497597028
Jiangmin Antivirus 50.572% 14 3.427102391
ESET Smart Security 51.799% 15 3.255481518
IKARUS anti.virus 52.377% 16 3.174636477
Kaspersky Internet Security 52.443% 17 3.165405036
avast! Internet Security 52.657% 18 3.135472790
G Data Internet Security 55.300% 19 2.765795554
Dr.Web Security Space 75.074% 20 0.000000000
• Value of highest CPU usage=0; Value of lowest CPU usage=8.333333333
• Other values are based on linear formula
• Copy bulks of verified clean files from disk d to disk c

PCSL Security Solution Performance Review ■ 2013 October
© 2011-2014 JIAXING CHENXIANG INFORMATION TECHNOLOGY CO., LTD. All rights reserved. 12
5.3.3 AVERAGE RAM USAGE
Desktop Security Solution RAM Usage: % Ranking Score
Windows Defender 14.880% 1 8.333333333
ESET Smart Security 15.476% 2 7.575410753
Webroot Secure Anywhere 15.637% 3 7.370669922
Kingsoft New Duba 15.714% 4 7.272750394
Rising Antivirus 15.800% 5 7.163385727
Kaspersky Internet Security 16.104% 6 6.776794344
Jiangmin Antivirus 16.345% 7 6.470318938
IKARUS anti.virus 16.882% 8 5.787425607
Tencent PC Manager 17.156% 9 5.438984689
avast! Internet Security 17.411% 10 5.114705733
AVG Internet Security 17.416% 11 5.108347322
F-Secure Internet Security 17.800% 12 4.620021364
Avira Internet Security Suite 18.017% 13 4.344066331
Trend Micro Titanium Maximum Security 18.159% 14 4.163487461
Bitdefender Windows 8 Security 18.673% 15 3.509842820
360 Internet Security 18.714% 16 3.457703851
Dr.Web Security Space 18.819% 17 3.324177222
Norton Internet Security 19.429% 18 2.548451091
Baidu Antivirus 19.791% 19 2.088102142
G Data Internet Security 21.433% 20 0.000000000
• Value of highest RAM usage=0; Value of lowest RAM usage=8.333333333
• Other values are based on linear formula
• Copy bulks of verified clean files from disk d to disk c

PCSL Security Solution Performance Review ■ 2013 October
© 2011-2014 JIAXING CHENXIANG INFORMATION TECHNOLOGY CO., LTD. All rights reserved. 13
5.4 PROGRAM INSTALLATION(15MINS)
5.4.1 AVERAGE POWER CONSUMPTION
Desktop Security Solution Avg. PC: walt* Rank Score
avast! Internet Security 42.658 1 8.333333333
Tencent PC Manager 43.580 2 7.981805981
F-Secure Internet Security 45.634 3 7.198685394
AVG Internet Security 46.435 4 6.893291242
Bitdefender Windows 8 Security 46.711 5 6.788061796
Windows Defender 46.717 6 6.785774199
IKARUS anti.virus 47.181 7 6.608866725
Rising Antivirus 47.382 8 6.532232237
Kingsoft New Duba 47.636 9 6.435390645
Webroot Secure Anywhere 47.823 10 6.364093883
Jiangmin Antivirus 48.067 11 6.271064952
Avira Internet Security Suite 49.777 12 5.619099907
G Data Internet Security 50.585 13 5.311036891
Trend Micro Titanium Maximum Security 51.449 14 4.981622974
ESET Smart Security 52.371 15 4.630095622
360 Internet Security 52.579 16 4.550792271
Baidu Antivirus 53.715 17 4.117673972
Norton Internet Security 54.653 18 3.760046362
Kaspersky Internet Security 55.124 19 3.580470025
Dr.Web Security Space 64.515 20 0.000000000
• * Avg. PC= Average Power Consumption
• Value of highest Avg. PC=0; Value of lowest Avg. PC=8.333333333
• Other values are based on linear formula
• Install 5 regular software and one big pc game during the 15mins, take no action
when finishes all the installation process

PCSL Security Solution Performance Review ■ 2013 October
© 2011-2014 JIAXING CHENXIANG INFORMATION TECHNOLOGY CO., LTD. All rights reserved. 14
5.4.2 AVERAGE CPU USAGE
Desktop Security Solution CPU Usage: % Ranking Score
avast! Internet Security 25.426% 1 8.333333333
Bitdefender Windows 8 Security 25.931% 2 8.268471995
Tencent PC Manager 25.947% 3 8.266416983
F-Secure Internet Security 26.106% 4 8.245995294
IKARUS anti.virus 26.220% 5 8.231353329
AVG Internet Security 27.938% 6 8.010696341
Windows Defender 28.918% 7 7.884826814
Rising Antivirus 30.855% 8 7.636041840
Webroot Secure Anywhere 31.825% 9 7.511456696
Kingsoft New Duba 32.810% 10 7.384944977
Jiangmin Antivirus 33.162% 11 7.339734698
Avira Internet Security Suite 38.390% 12 6.668259302
G Data Internet Security 39.934% 13 6.469950577
Trend Micro Titanium Maximum Security 41.949% 14 6.211147416
ESET Smart Security 43.512% 15 6.010398364
360 Internet Security 44.678% 16 5.860639314
Baidu Antivirus 49.396% 17 5.254667448
Norton Internet Security 51.464% 18 4.989057057
Kaspersky Internet Security 54.987% 19 4.536568951
Dr.Web Security Space 90.308% 20 0.000000000
• Value of highest CPU usage=0; Value of lowest CPU usage=8.333333333
• Other values are based on linear formula
• Install 5 regular software and one big pc game during the 15mins, take no action
when finishes all the installation process

PCSL Security Solution Performance Review ■ 2013 October
© 2011-2014 JIAXING CHENXIANG INFORMATION TECHNOLOGY CO., LTD. All rights reserved. 15
5.4.3 AVERAGE RAM USAGE
Desktop Security Solution RAM Usage: % Ranking Score
Kingsoft New Duba 13.330% 1 8.333333333
Windows Defender 13.843% 2 7.702709347
Webroot Secure Anywhere 13.874% 3 7.664601465
Tencent PC Manager 14.425% 4 6.987264592
Rising Antivirus 14.570% 5 6.809018046
360 Internet Security 14.970% 6 6.317303437
ESET Smart Security 15.111% 7 6.143974037
avast! Internet Security 15.187% 8 6.050548262
Jiangmin Antivirus 15.743% 9 5.367064955
IKARUS anti.virus 15.794% 10 5.304371343
Kaspersky Internet Security 16.381% 11 4.582780154
Dr.Web Security Space 16.393% 12 4.568028716
Baidu Antivirus 16.407% 13 4.550818705
Avira Internet Security Suite 16.524% 14 4.406992182
Bitdefender Windows 8 Security 16.538% 15 4.389782170
F-Secure Internet Security 16.573% 16 4.346757142
AVG Internet Security 16.614% 17 4.296356395
Norton Internet Security 16.945% 18 3.889462556
Trend Micro Titanium Maximum Security 17.362% 19 3.376850076
G Data Internet Security 20.109% 20 0.000000000
• Value of highest RAM usage=0; Value of lowest RAM usage=8.333333333
• Other values are based on linear formula
• Install 5 regular software and one big pc game during the 15mins, take no action
when finishes all the installation process

PCSL Security Solution Performance Review ■ 2013 October
© 2011-2014 JIAXING CHENXIANG INFORMATION TECHNOLOGY CO., LTD. All rights reserved. 16
5.5 OVERALL SCORE
Desktop Security Solution Overall Score
Tencent PC Manager 79.82
Kingsoft New Duba 73.90
Rising Antivirus 73.66
Webroot Secure Anywhere 72.46
IKARUS anti.virus 70.37
Bitdefender Windows 8 Security 65.91
360 Internet Security 64.53
F-Secure Internet Security 64.10
avast! Internet Security 63.75
Windows Defender 63.01
Avira Internet Security Suite 59.54
Kaspersky Internet Security 59.40
Jiangmin Antivirus 59.16
Baidu Antivirus 59.02
AVG Internet Security 57.94
Trend Micro Titanium Maximum Security 51.20
Norton Internet Security 45.88
G Data Internet Security 43.66
ESET Smart Security 42.81
Dr.Web Security Space 32.18
• We use windows defender as a baseline
• Score above 10% higher than windows defender will be marked blue as high
recommendation
• Score between 10% higher than windows defender and 10% lower than windows
defender will be marked green as recommendation

PCSL Security Solution Performance Review ■ 2013 October
© 2011-2014 JIAXING CHENXIANG INFORMATION TECHNOLOGY CO., LTD. All rights reserved. 17
6. TESTER INTRODUCTION
JIAXING CHENXIANG INFORMATION TECHNOLOGY CO., LTD., is an IT product test and
consulting company located in Jiaixing, Zhejiang Province, China. As a professional
tester of desktop security products and also mobility security solutions, we are willing to
provide references to the endpoint users for choosing security solutions. Not only we
test security solutions for different environment and customers, but also we provide test
and consulting reports of other IT products, e.g. battery, mobility devices, computer
power, etc.
7. RIGHTS STATEMENT
除非另有说明,嘉兴市辰翔信息科技有限公司(简称“辰翔科技”,下同)拥有本报告的版权,
未经辰翔科技事先书面授权许可,任何机构或个人无权擅自更改本报告内容或以任何方式以商业
目的而使用本报告(包括但不限于发送、传播、复印、摘编等)。
本报告中所使用的辰翔科技商标、服务标识及标记,除非另有说明,均为辰翔科技的商标、服务
标识及标记,辰翔科技对此拥有版权,任何侵犯辰翔科技版权之行为,均为违法行为,辰翔科技
将对此依法追究侵权人相关法律责任。
Unless otherwise stated, Jiaxing Chenxiang Information Technology Co., Ltd. (hereinafter
referred to as “Chenxiang Information Technology”) owns the copyright of this report.
Without prior written consent of Chenxiang Information Technology,no other unit or
individual shall have the right to alter the contents of this report and use this report for
commercial purposes by any means (including but not limited to transmission,
dissemination, reproduction, excerpt, etc.).
Unless otherwise stated, Chenxiang Information Technology shall be the rightful owner
of the trademarks, service marks of Chenxiang Information Technology used in the
report. Any action of infringing upon the legal rights of Chenxiang Information
Technology is prohibited, Chenxiang Information Technology shall have the right to
pursue the legal liability of the infringer in accordance with the law.
PCSL Security Solution Performance Review ■ 2013 October
© 2011-2014 JIAXING CHENXIANG INFORMATION TECHNOLOGY CO., LTD. All rights reserved. 18
8. DISCLAIMER
辰翔科技在此特别提醒,在使用本公司报告前,请认真阅读、充分理解本声明中各条款,包括免
除或限制辰翔科技责任的免责条款及对用户的权利限制,如果您对本声明中的任何条款表示异
议,可以选择不使用本报告,您使用本报告的行为将被视为对本声明全部内容的认可,并同意接
受本声明全部条款的约束。
1、本报告由辰翔科技向读者提供,所载全部内容仅系提供读者参考之用,并不构成对其选择、
购买、使用产品之建议,也不构成对其选择、购买、使用报告中所涉产品的邀请或保证。辰翔科
技不担保内容的绝对准确性和完整性,读者不应单纯依靠本报告而取代个人的独立判断,辰翔科
技建议读者如有任何疑问,应当咨询国家相关部门并进行独立选择、购买或使用判断。
2、本报告所载内容为辰翔科技在报告发表日当日对有关产品性状的判断,在其它不同日期辰翔
科技可发出与本报告内容不一致或有不同结论的报告,但辰翔科技无义务或责任为此将原报告涉
及内容及时更新并由此通知读者,在此情形下辰翔科技不对读者因使用本报告所产生的损失负任
何责任。
3、 本报告可能附带其它网站的地址或超级链接,目的纯粹是为了读者使用方便,所链接网站的
内容不构成本报告的任何部分,读者需自行承担浏览该类网站的风险、费用或者损失。同时辰翔
科技不对此类网站的内容(包括但不限于广告、产品或其他资料)的真实性、完整性、准确性及
合法性负责或保证,读者使用或依赖任何此类网站或经由此类网站获得的任何内容、商品或服务
所产生的任何损害或损失,辰翔科技不承担任何直接或间接法律责任。
4、辰翔科技可能与生产本报告涉及产品的公司间已存在或将存在业务关系,但无需事先或在将
来建立业务关系后通知其他读者。
5、读者接收本报告并不视为和辰翔科技建立业务关系,辰翔科技无需因此而对其承担类似客户
关系情形下的任何法律责任。
6、所有辰翔科技报告测试对象之产品样品,系辰翔科技于正规合法销售渠道购买之产品,故本
报告内容仅适合于从正规合法渠道购买之产品,而不适于从其他渠道所得之产品,读者使用非正
规合法销售渠道产品所产生的任何风险或损失,与辰翔科技无关,在此情形下辰翔科技概不承担
任何法律责任。
7、本报告可能会涉及公司或个人所有的商标或其相关照片、图案,若任何单位或个人认为涉嫌
侵犯其合法权益,可及时与辰翔科技联系,以便辰翔科技迅速作出处理。
对上述声明的解释、修改及更新权属辰翔科技所有。

PCSL Security Solution Performance Review ■ 2013 October
© 2011-2014 JIAXING CHENXIANG INFORMATION TECHNOLOGY CO., LTD. All rights reserved. 19
Notice that before using the report issued by Jiaxing Chenxiang Information
Technology Co. Ltd(hereinafter referred to as“Chenxiang Information Technology”),
please carefully read and fully understand the terms and conditions of this disclaimer
(hereinafter referred to as“Disclaimer ”), including the clauses of exclusion or
restriction of the liabilities of Chenxiang Information Technology and the limitation the
rights of users. If you have any objection to the terms and conditions of this Disclaimer,
you have the right not to use this report, the act of using this report will be regarded as
an acceptance and the recognition of the terms and conditions of this Disclaimer, so by
using this report, you agree to the following terms and conditions:
1、The report is provided by Chenxiang Information Technology, all the contents
contained herein are for reference purpose only, but will not be regarded as the
suggestion, invitation or warranty for readers to choose, purchase or use the products
mentioned herein. Chenxiang Information Technology will not guarantee the absolute
accuracy and completeness of the contents of the report, you should not rely solely on
this report or substitute the viewpoints of the report for your independent judgment. If
you have any queries, please consult the relevant departments of the State and then
choose, purchase or use products by your independent judgment.
2、The contents contained herein is the judgment made by Chenxiang Information
Technology to the product characteristics as of the date of the report published, in the
future Chenxiang Information Technology will have the right to issue the new reports
which contain different contents or draw different conclusions, but Chenxiang
Information Technology has no obligation or responsibility to update the original report
or inform readers of the update of it, in this case, Chenxiang Information Technology
will bear no responsibility for readers’ loss of using the original report .
3、The report may contain links to other websites, which are provided solely for
readers’ convenience to use, the contents of the linked websites are not any part of
this report. Readers shall assume the risks and losses or bear the costs when visiting
such websites, Chenxiang Information Technology will not guarantee the authenticity,
completeness , accuracy and legitimacy of the contents of such websites (including but
not limited to advertising, products or other information). Chenxiang Information
Technology does not accept any liability (direct or indirect) for readers’ damages or
losses arising from their clicking on or viewing such websites to obtain some
information, products or service.
PCSL Security Solution Performance Review ■ 2013 October
© 2011-2014 JIAXING CHENXIANG INFORMATION TECHNOLOGY CO., LTD. All rights reserved. 20
4、Chenxiang Information Technology may have or will have a business relationship
with the companies which produce the products mentioned in this report, but has no
obligation to notify readers about it, no matter there has already been or there will be
such business relationship in the future.
5、The act of readers’receiving this report are not regarded as the establishment of the
business relationship between readers and Chenxiang Information Technology, so there
is no customer relationship existing, Chenxiang Information Technology does not accept
any legal liability as the readers’ customer .
6、The products which are used to be tested as the samples by Chenxiang Information
Technology are bought through official way and legal means, so the report is proper for
products bought through official way and legal means, not for products bought through
unofficial way and illegal means. Therefore it’s the users buying such products who will
be responsible for any risk or loss arising therefrom. Chenxiang Information Technology
will not have or accept any liability whatsoever for any such risk or loss.
7、Some trademarks, photos or patterns owned by units or individuals will probably be
used in this report, if you think your legal right and interests are infringed, please
contact Chenxiang Information Technology promptly, Chenxiang Information
Technology will handle the matter as quickly as possible.
Chenxiang Information Technology reserves the rights to interpret, modify and update
the Disclaimer.