PCP & Systemtappcp.io/papers/fsoss-2013.pdf · PCP & Systemtap An Intro to ... top/iostat/vmstat/ps...
51
PCP & Systemtap An Intro to Performance Analysis Across Your Entire Network Jonathan Lebon Lukas Berk Red Hat Oct 25, 2013
Transcript of PCP & Systemtappcp.io/papers/fsoss-2013.pdf · PCP & Systemtap An Intro to ... top/iostat/vmstat/ps...

PCP & SystemtapAn Intro to Performance Analysis
Across Your Entire Network
Jonathan LebonLukas BerkRed HatOct 25, 2013
PCP & Systemtap | FSOSS 20132
In Today's Talk
1. Introduction
2. Performance Co-Pilot
3. Demo
4. (Applause)
5. Systemtap
6. Demo
7. (More Applause)
8. Questions

PCP & Systemtap | FSOSS 20133
Six Stages of Debugging
1. That can't happen
2. That can't doesn't happen on my machine
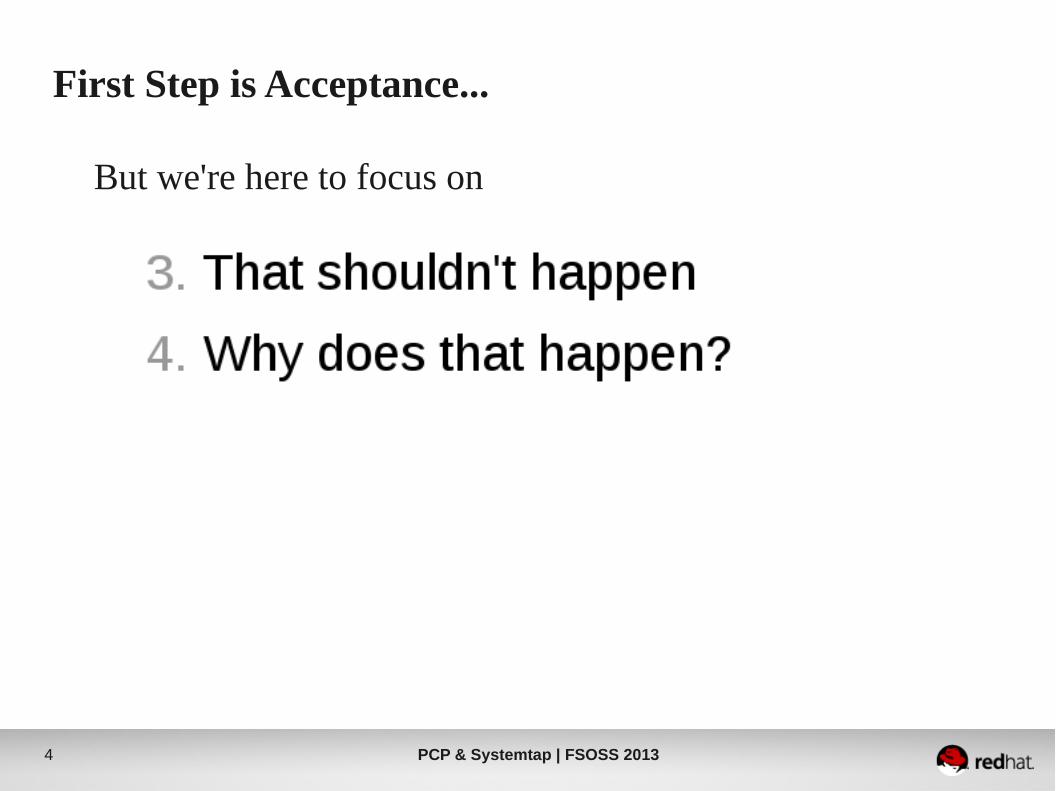
3. That doesn't shouldn't happen
4. Why does that happen?
5. Oh, I see.
6. How did that ever work?
7. Who wrote that?!
8. Oh... I wrote that.
Credit: http://web.archive.org/web/20051027173148/http://www.68k.org/~jrc/old-blog/archives/000198.html
(With Two Bonus)
PCP & Systemtap | FSOSS 20134
First Step is Acceptance...
But we're here to focus on
PCP & Systemtap | FSOSS 20135
In Other Words
Our main objectives are:
1. Early detection of a (potential) problem
2. Rapidly drill down & pinpoint issue in specific program
PCP & Systemtap | FSOSS 20136
Analyzing Performance
How is this typically/historically done?● rsyslog/syslog-ng/journald● top/iostat/vmstat/ps● Mixture of scripting languages (bash/perl/python)● Specific tools vary per platform● Proper analysis requires more context
PCP & Systemtap | FSOSS 20137
Analyzing Performance
Introducing:
PCP & Systemtap | FSOSS 20138
Performance Co-Pilot
Points of interest● Unix-like component design● Complements existing system functionality● Cross platform● Ubiquitous unit measurement● Extremely extensible● Open Source!
PCP & Systemtap | FSOSS 20139
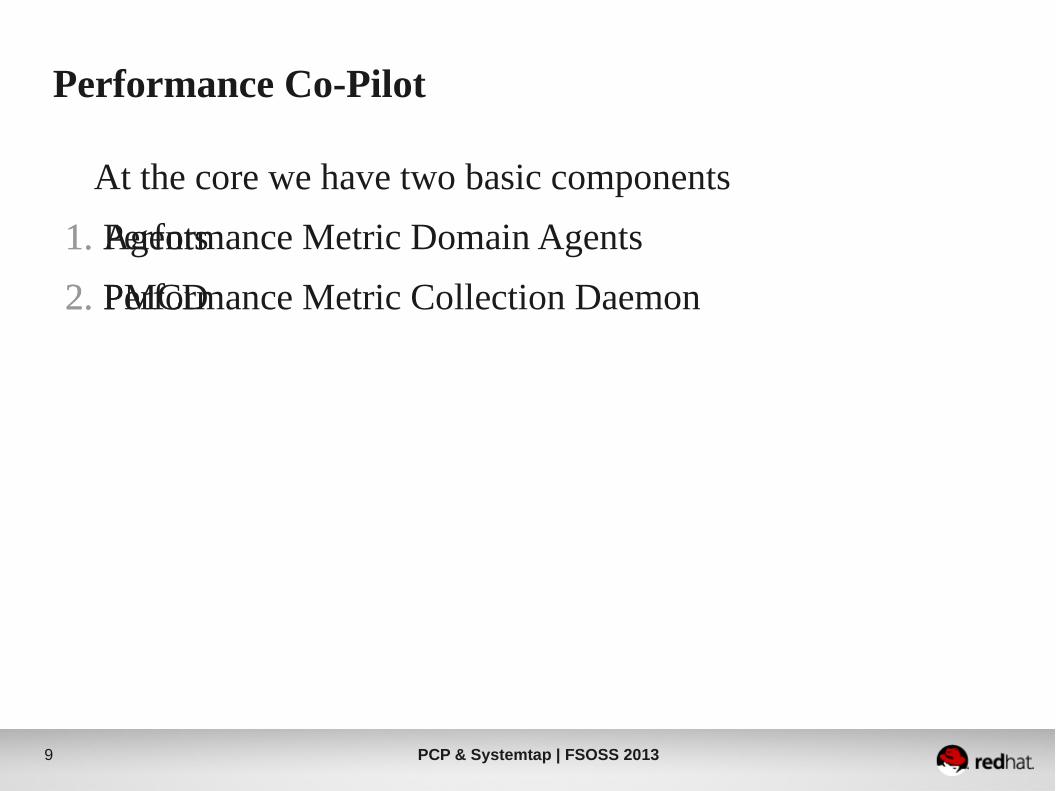
Performance Co-Pilot
At the core we have two basic components
1. Performance Metric Domain Agents
2. Performance Metric Collection Daemon
1. Agents
2. PMCD
PCP & Systemtap | FSOSS 201310
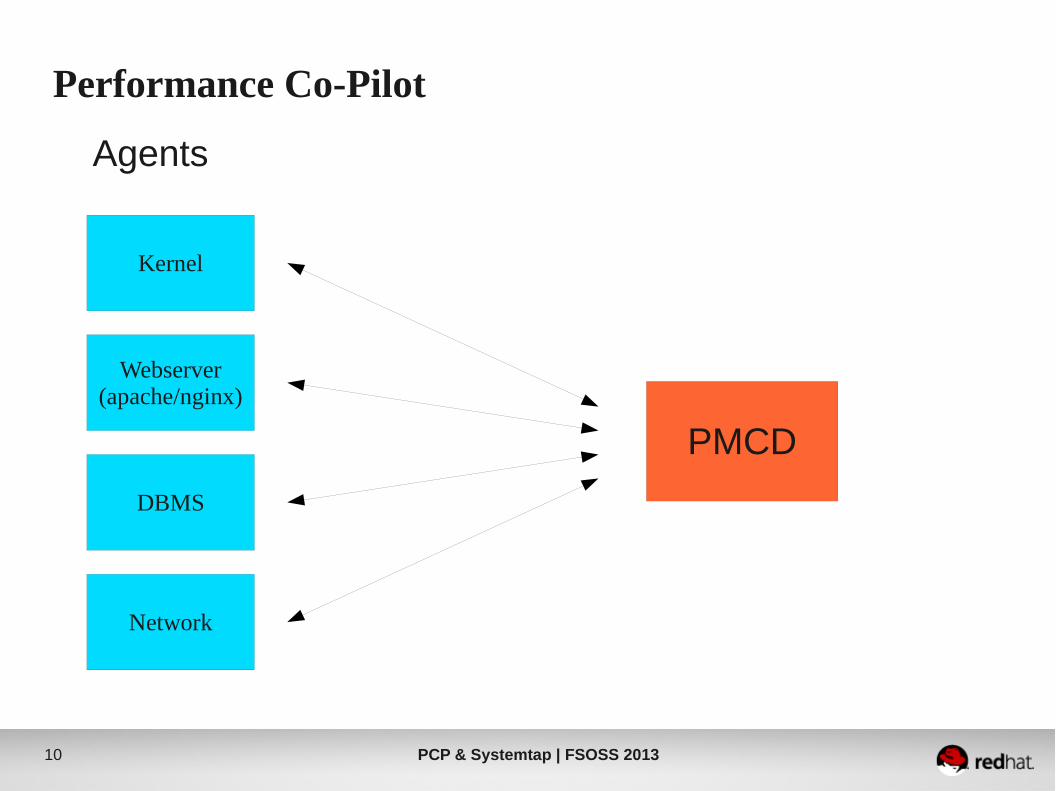
Performance Co-Pilot
Webserver(apache/nginx)
DBMS
Network
Kernel
Agents
PMCD
PCP & Systemtap | FSOSS 201311
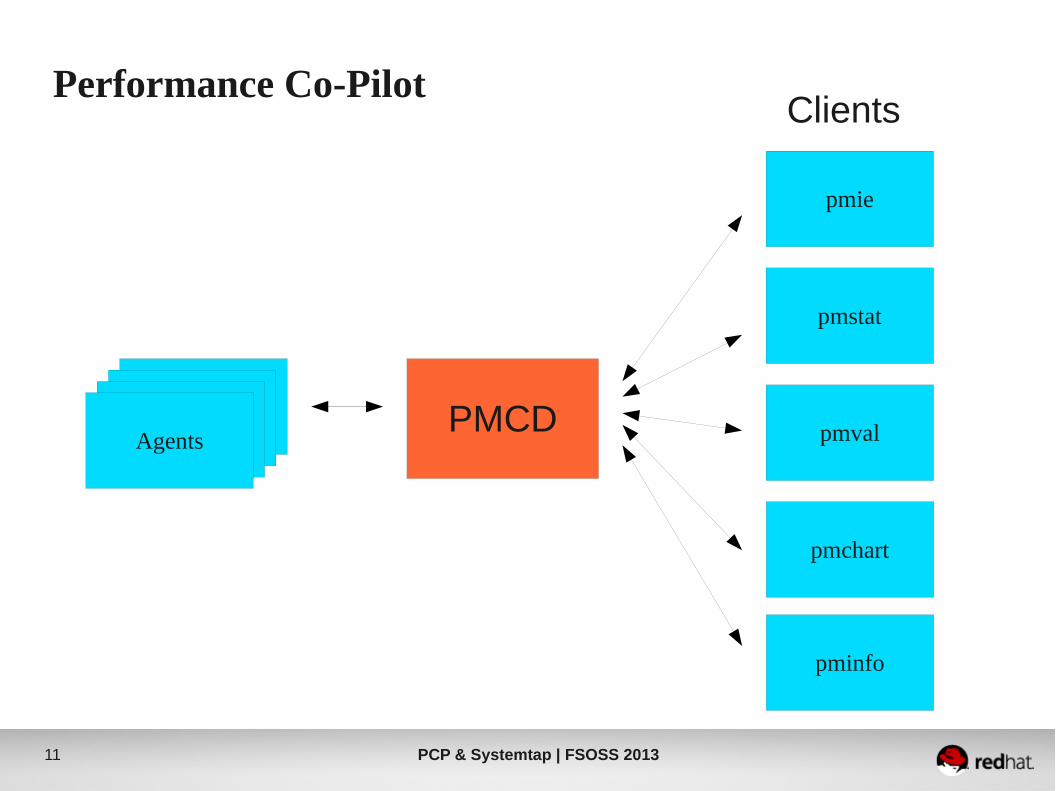
Performance Co-Pilot
AgentsPMCD
pmie
pmstat
pmval
pminfo
Clients
pmchart
PCP & Systemtap | FSOSS 201312
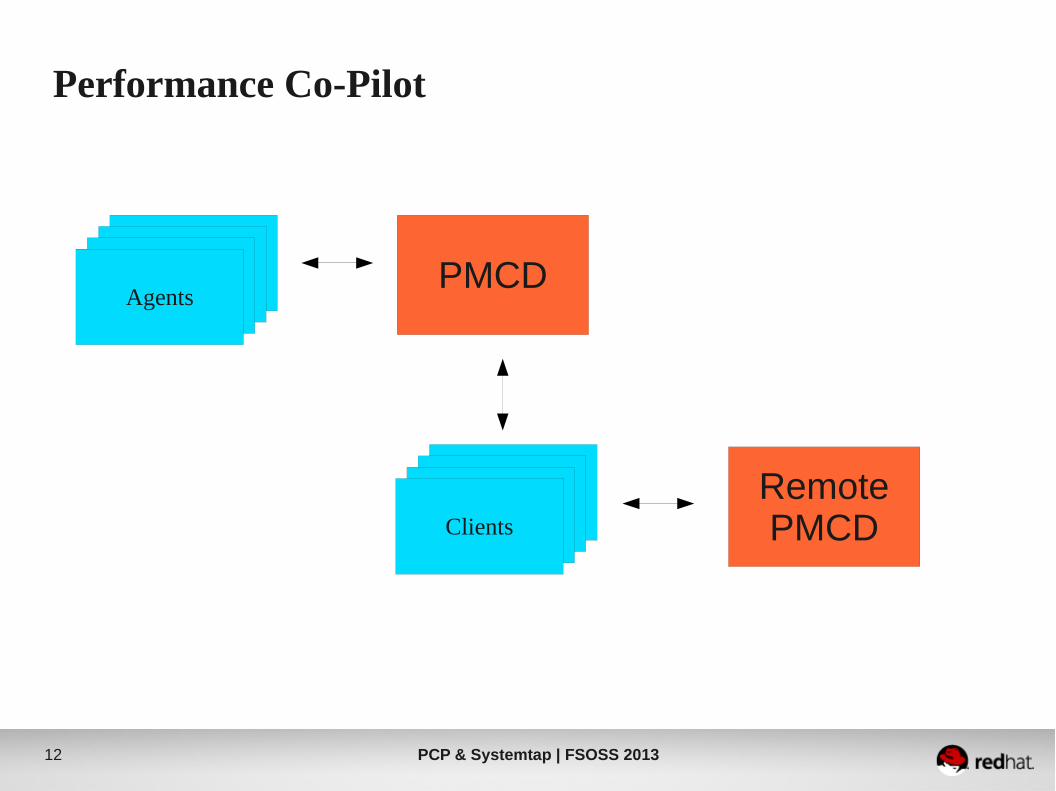
Performance Co-Pilot
AgentsPMCD
Clients
RemotePMCD
PCP & Systemtap | FSOSS 201313
Performance Co-Pilot
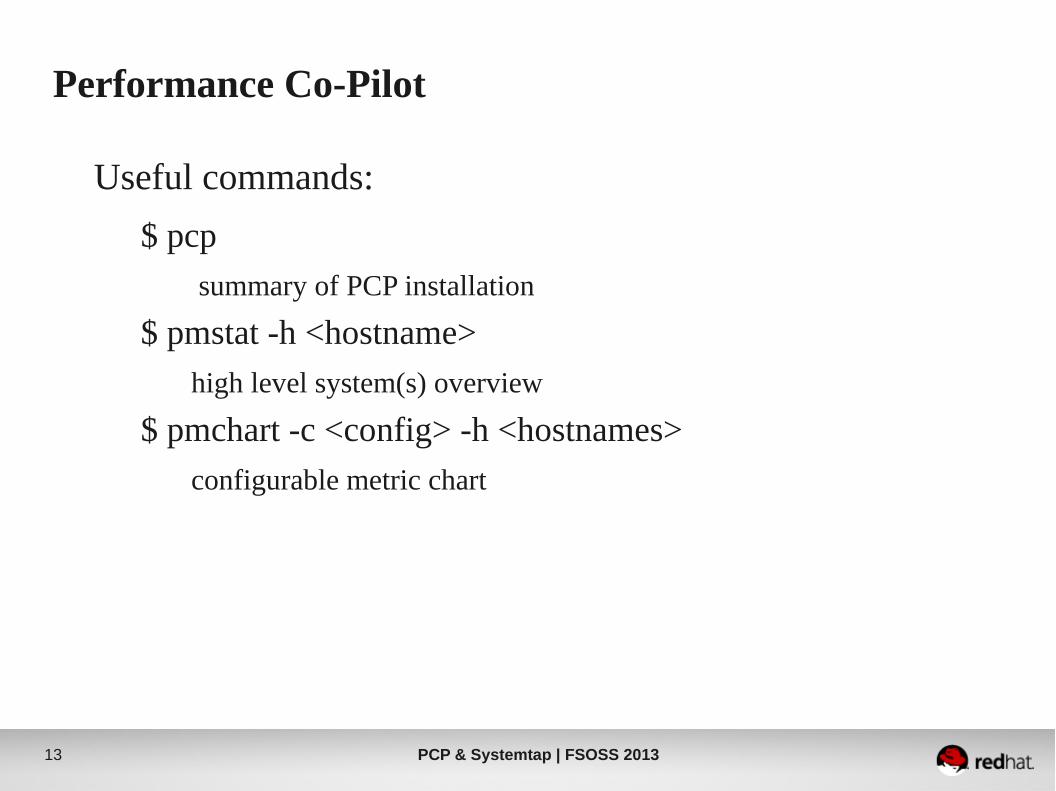
Useful commands:
$ pcp
summary of PCP installation
$ pmstat -h <hostname>
high level system(s) overview
$ pmchart -c <config> -h <hostnames>
configurable metric chart
PCP & Systemtap | FSOSS 201314
Performance Co-Pilot
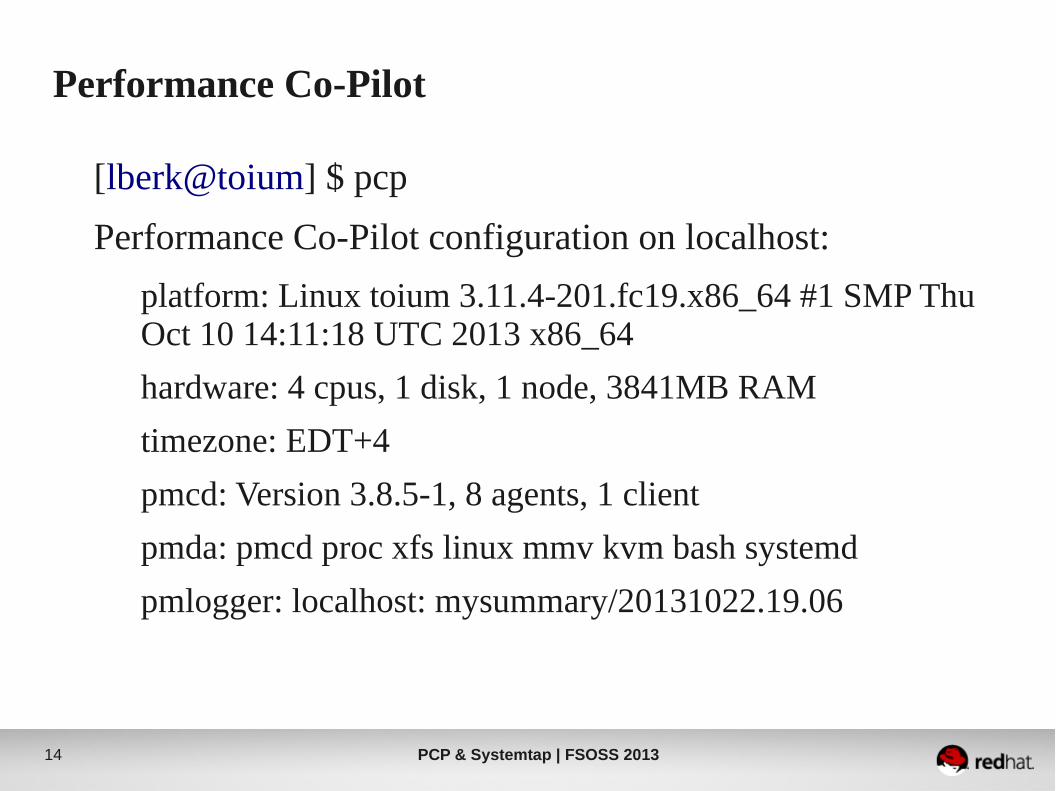
[lberk@toium] $ pcp
Performance Co-Pilot configuration on localhost:
platform: Linux toium 3.11.4-201.fc19.x86_64 #1 SMP Thu Oct 10 14:11:18 UTC 2013 x86_64
hardware: 4 cpus, 1 disk, 1 node, 3841MB RAM
timezone: EDT+4
pmcd: Version 3.8.5-1, 8 agents, 1 client
pmda: pmcd proc xfs linux mmv kvm bash systemd
pmlogger: localhost: mysummary/20131022.19.06
PCP & Systemtap | FSOSS 201315
Performance Co-Pilot
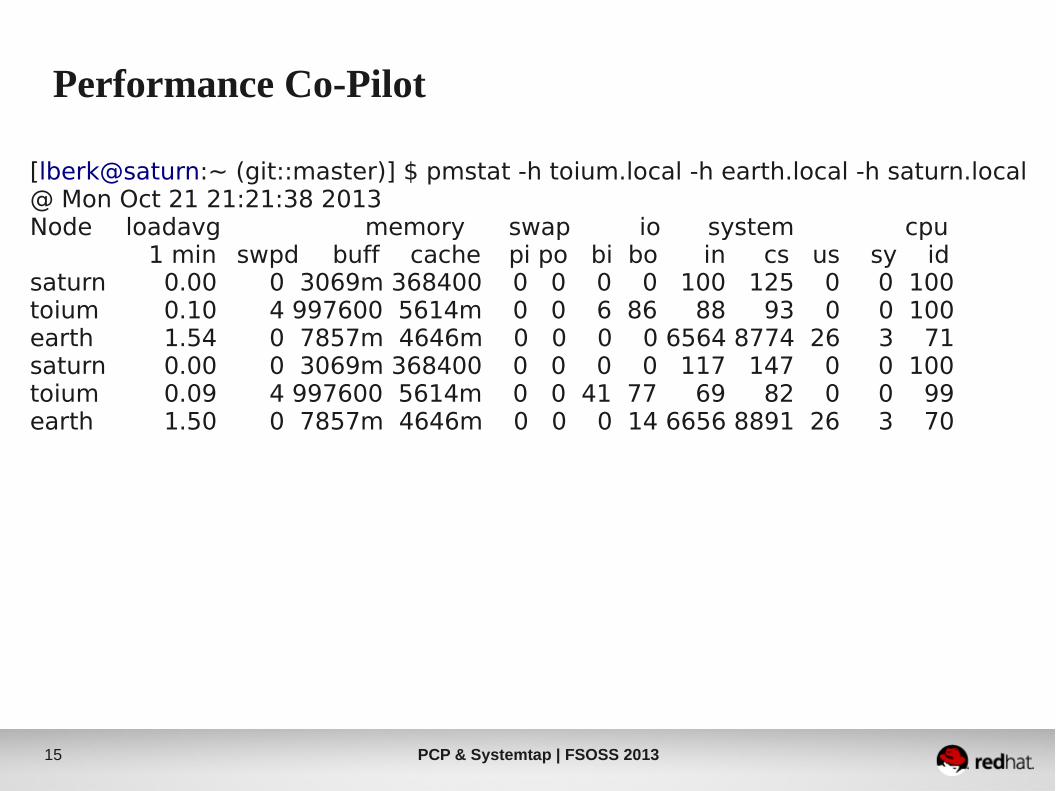
[lberk@saturn:~ (git::master)] $ pmstat -h toium.local -h earth.local -h saturn.local@ Mon Oct 21 21:21:38 2013Node loadavg memory swap io system cpu
1 min swpd buff cache pi po bi bo in cs us sy idsaturn 0.00 0 3069m 368400 0 0 0 0 100 125 0 0 100toium 0.10 4 997600 5614m 0 0 6 86 88 93 0 0 100earth 1.54 0 7857m 4646m 0 0 0 0 6564 8774 26 3 71saturn 0.00 0 3069m 368400 0 0 0 0 117 147 0 0 100toium 0.09 4 997600 5614m 0 0 41 77 69 82 0 0 99earth 1.50 0 7857m 4646m 0 0 0 14 6656 8891 26 3 70
PCP & Systemtap | FSOSS 201316
Performance Co-Pilot
PCP & Systemtap | FSOSS 201317
Performance Co-Pilot
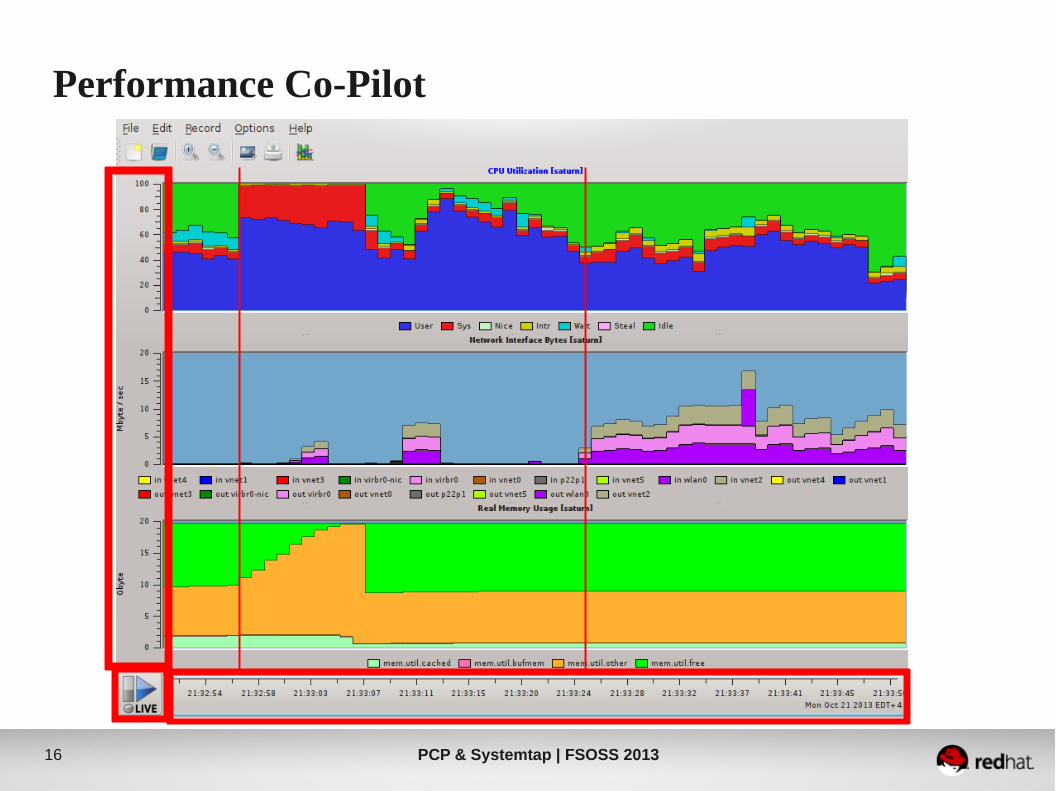
Great systems overview, but we need malleable, configurable metric tracking.
We have the technology!

PCP & Systemtap | FSOSS 201318
Performance Co-Pilot
Performance Metrics Name Spaces● Subsystem based hierarchical naming scheme
network .tcp .rcvpack
PCP & Systemtap | FSOSS 201319
Performance Co-Pilot
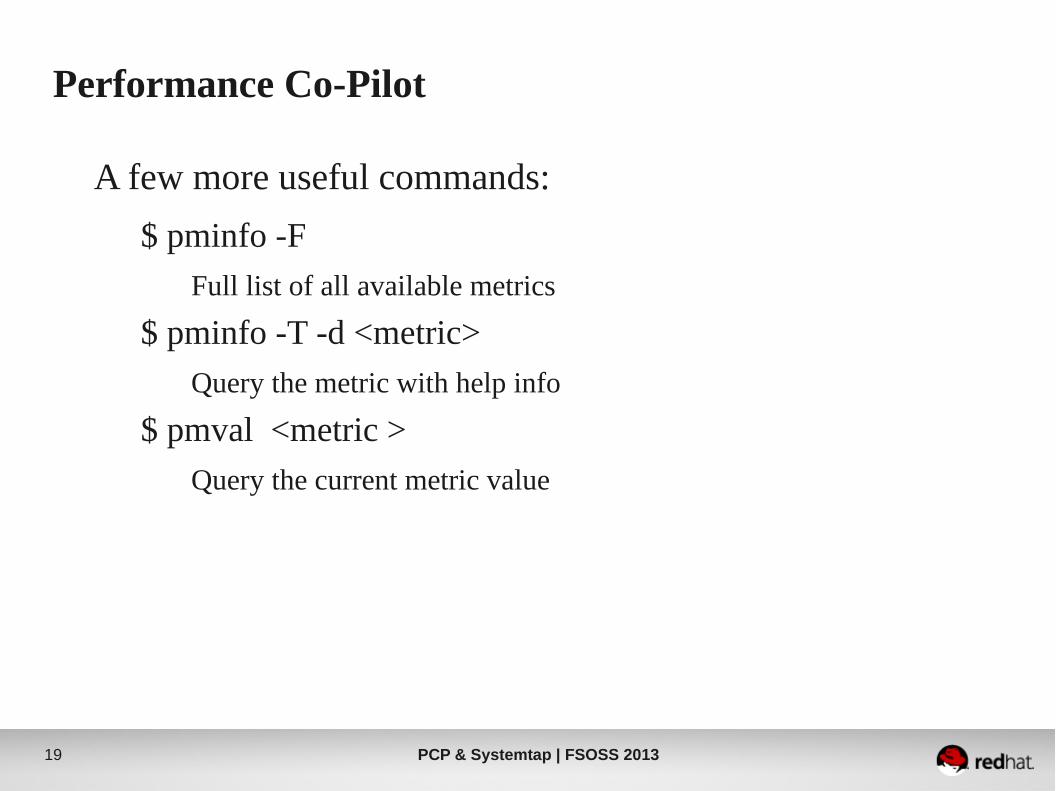
A few more useful commands:
$ pminfo -F
Full list of all available metrics
$ pminfo -T -d <metric>
Query the metric with help info
$ pmval <metric >
Query the current metric value
PCP & Systemtap | FSOSS 201320
Performance Co-Pilot
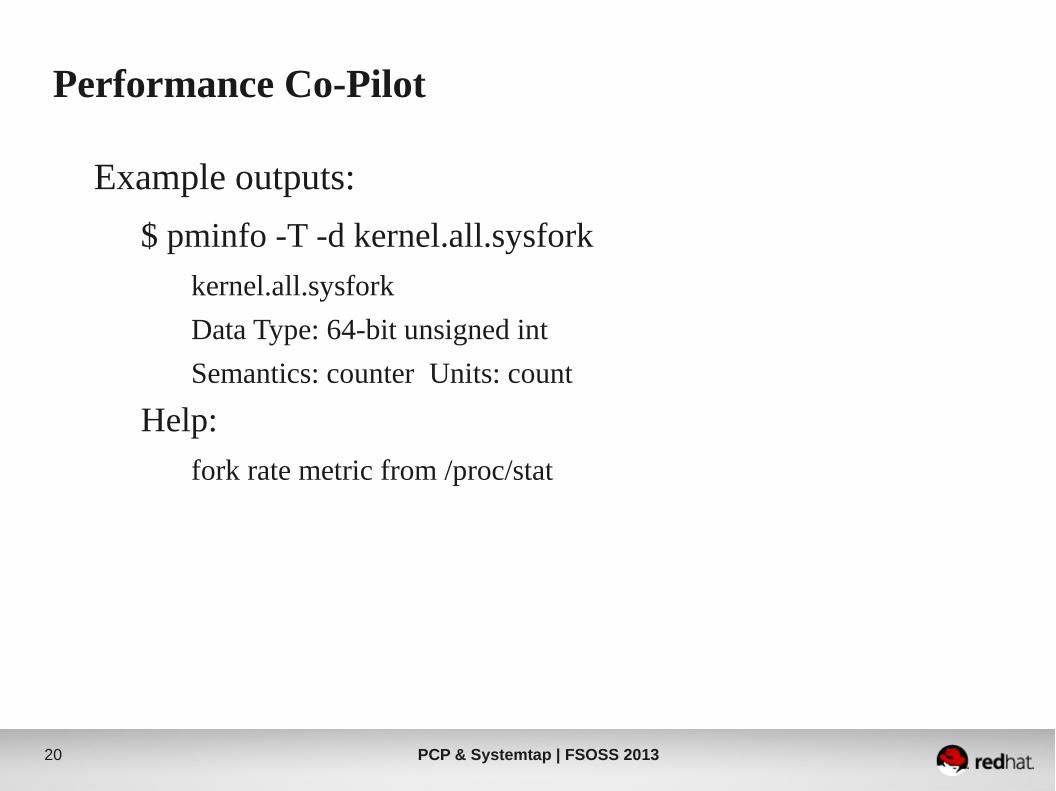
Example outputs:
$ pminfo -T -d kernel.all.sysfork
kernel.all.sysfork
Data Type: 64-bit unsigned int
Semantics: counter Units: count
Help:
fork rate metric from /proc/stat

PCP & Systemtap | FSOSS 201321
Performance Co-Pilot
Example outputs:
$ pmval disk.all.write
metric: disk.all.write
host: localhost
semantics: cumulative counter (converting to rate)
units: count (converting to count / sec)
samples: all
0.0
19.96
95.67
101.9

PCP & Systemtap | FSOSS 201322
Performance Co-Pilot
AgentsPMCD
Clients
RemotePMCD
pmieevents
pmlogger
Log Archive

PCP & Systemtap | FSOSS 201323
Performance Co-Pilot
Performance Metrics Inference Engine● Allow you to form metrics-based expressions for evaluation● Ratios, counts, aggregates, conditionals● Raise alarms, logging entries, shell commands● Run on live data or logs● Run rules across data from multiple hosts

PCP & Systemtap | FSOSS 201324
Performance Co-Pilot
Possible expressions
( disk.all.write / disk.all.total) * 100;
Percentage of disk operations that are writes
disk.dev.total > 10 && disk.dev.write > disk.dev.read;
If total disk operations are greater than ten, and
there are more disk writes than reads
PCP & Systemtap | FSOSS 201325
Performance Co-Pilot
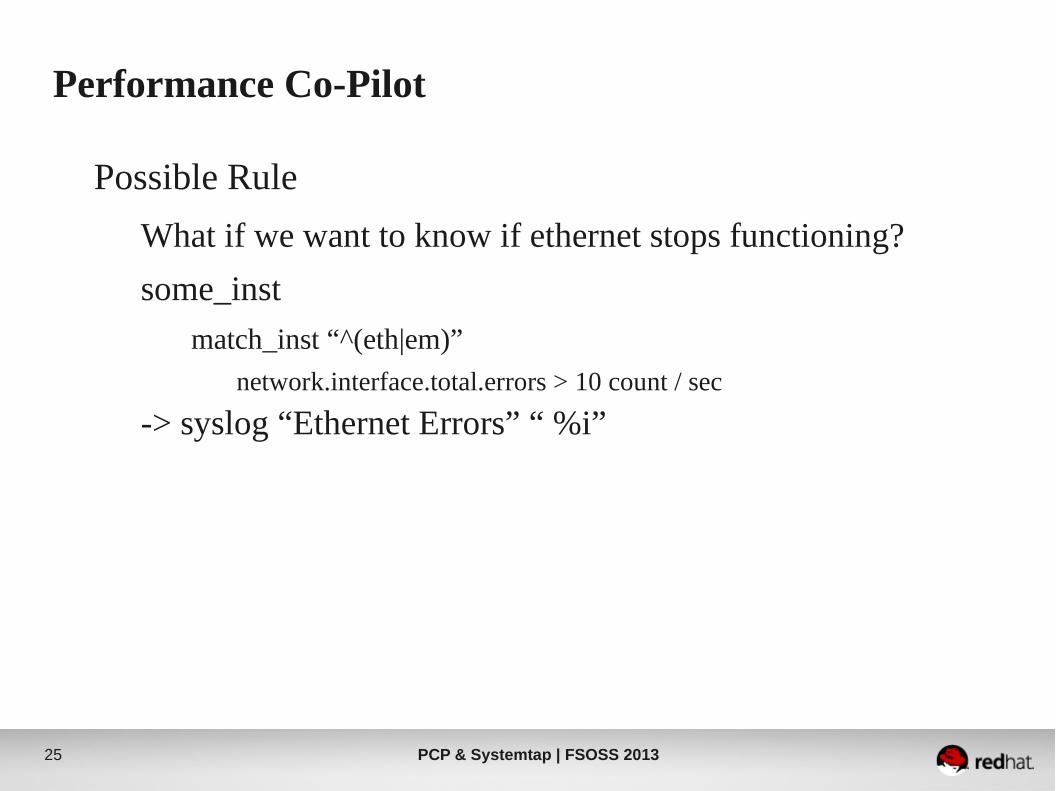
Possible Rule
What if we want to know if ethernet stops functioning?
some_inst
match_inst “^(eth|em)”
network.interface.total.errors > 10 count / sec
-> syslog “Ethernet Errors” “ %i”
PCP & Systemtap | FSOSS 201326
Performance Co-Pilot
Demo!
PCP & Systemtap | FSOSS 201327
Performance Co-Pilot
“If it is important for monitoring systemperformance, and you can measure it, you can easilyintegrate it into the PCP framework.”
- someone famouspcp user guide
Guiding principle on extensibility:

PCP & Systemtap | FSOSS 201328
Performance Co-Pilot
Several ways to extend PCP to your advantage● Write your own agent● Write your own gui/cli client (using pmapi)● Directly adding sample/tracing instrumentation to application
(using pcp library functionality)
PCP & Systemtap | FSOSS 201329
Questions?

PCP & Systemtap | FSOSS 201330
Performance Co-Pilot
At this point we've hopefully:● Detected the (potential) problem● Identified the possible culprit(s)● How do we know what's causing the issue?

PCP & Systemtap | FSOSS 201331
PCP & Systemtap | FSOSS 201332
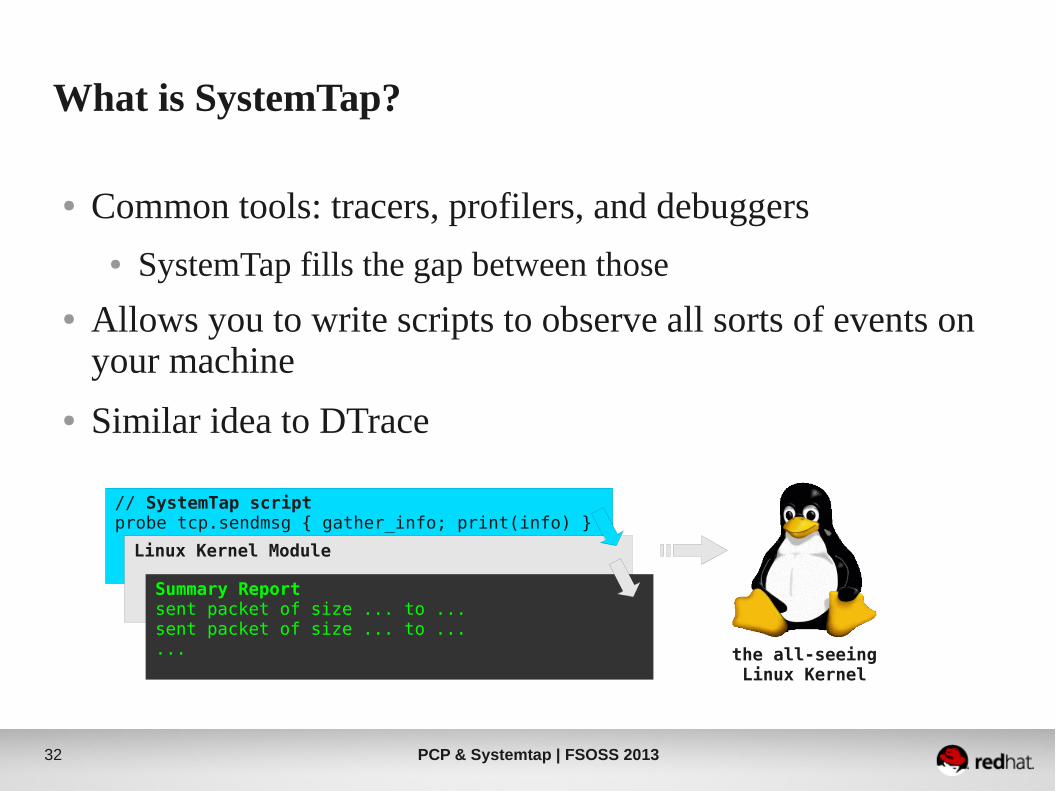
What is SystemTap?
● Common tools: tracers, profilers, and debuggers● SystemTap fills the gap between those
● Allows you to write scripts to observe all sorts of events on your machine
● Similar idea to DTrace
// SystemTap scriptprobe tcp.sendmsg { gather_info; print(info) }
Linux Kernel Module
Summary Reportsent packet of size ... to ...sent packet of size ... to ...... the all-seeing
Linux Kernel

PCP & Systemtap | FSOSS 201333
Quick Introduction
probe begin {print("Hello, World!\n")
}
● Scripts are run at probe points
● Example: Hello World
● Example: detect when ls is started
probe <trigger> {<handler>
}
probe process(“ls”).begin {print("ls was started!\n”)
}

PCP & Systemtap | FSOSS 201334
Probe Point Types
SystemTap supports many types of probe points
● Kernel/process probes on statements/functions
● Java method probes
probe kernel.statement(“sys_read@fs/read_write.c:501”)
probe process(“/usr/bin/ls”).function(“main”)
probe java(PID).class(“CLASSNAME”).method(“PATTERN”)
PCP & Systemtap | FSOSS 201335
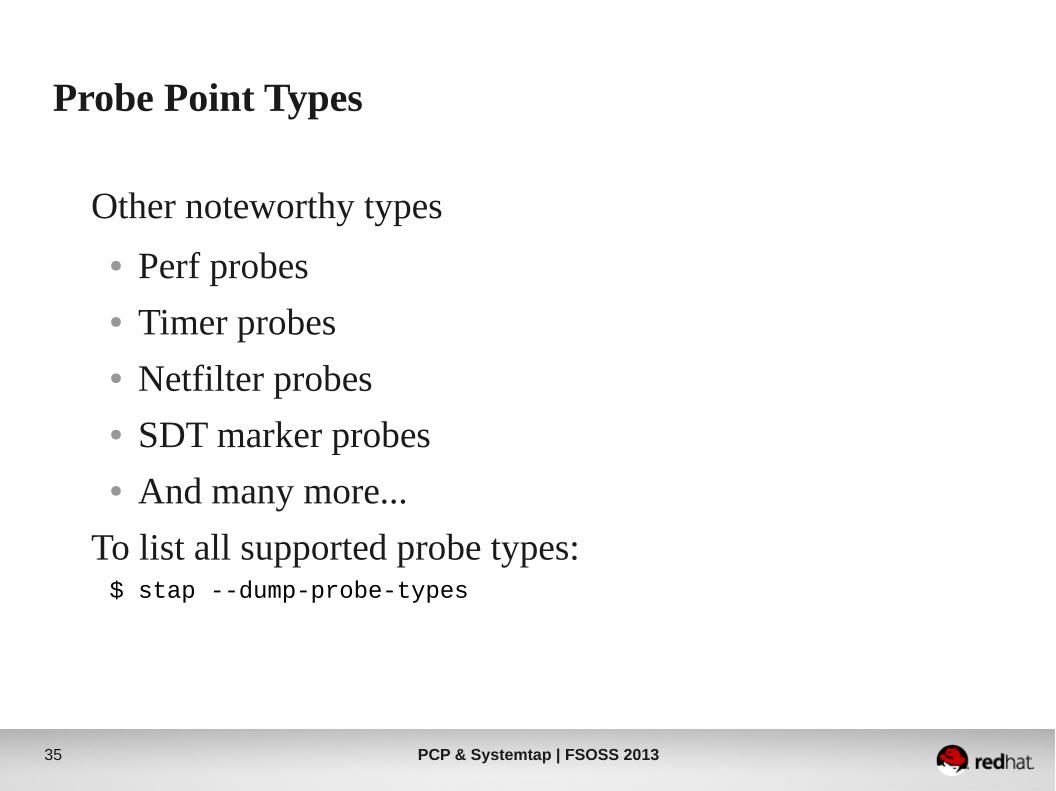
Probe Point Types
Other noteworthy types
● Perf probes● Timer probes● Netfilter probes● SDT marker probes● And many more...
To list all supported probe types:$ stap --dump-probe-types
PCP & Systemtap | FSOSS 201336
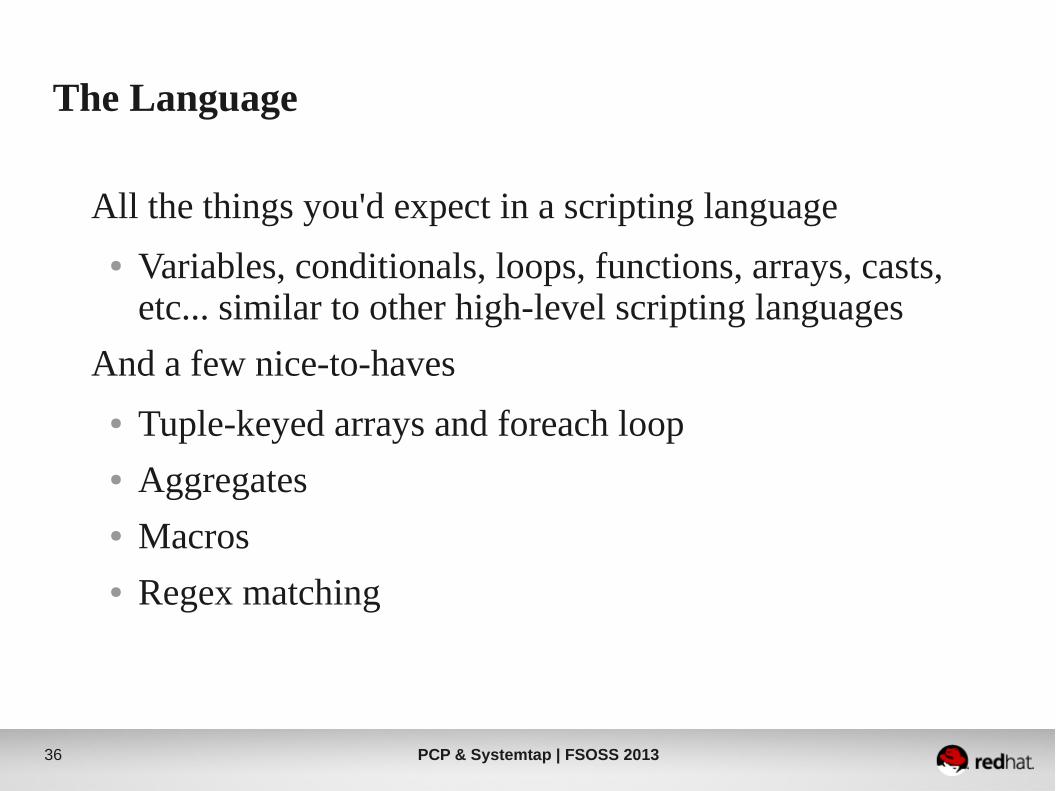
The Language
All the things you'd expect in a scripting language
● Variables, conditionals, loops, functions, arrays, casts, etc... similar to other high-level scripting languages
And a few nice-to-haves
● Tuple-keyed arrays and foreach loop● Aggregates● Macros● Regex matching

PCP & Systemtap | FSOSS 201337
Accessing Variables
Process/kernel probes can access context variables
We can use the -L option to find out what's available:
Also useful to find functions:
$ stap -L 'kernel.function(“sys_write”)'
kernel.function("SyS_write@fs/read_write.c:516") $fd:long int $buf:long int $count:long int $ret:long int
$ stap -L 'process(“ls”).function(“*”)'
probe kernel.function(“sys_write”)

PCP & Systemtap | FSOSS 201338
Tapsets – The Probe Library
Tapsets are libraries of high-level alias probes to help you write your scripts
They also contain helper functions
And helper variables
probe syscall.write {printf(“write() was called with data %s\n”,
user_string_n($buf, $count))}
probe syscall.write {printf(“write() was called with args %s\n”, argstr)
}
probe syscall.write --> probe kernel.function(“sys_write”)
PCP & Systemtap | FSOSS 201339
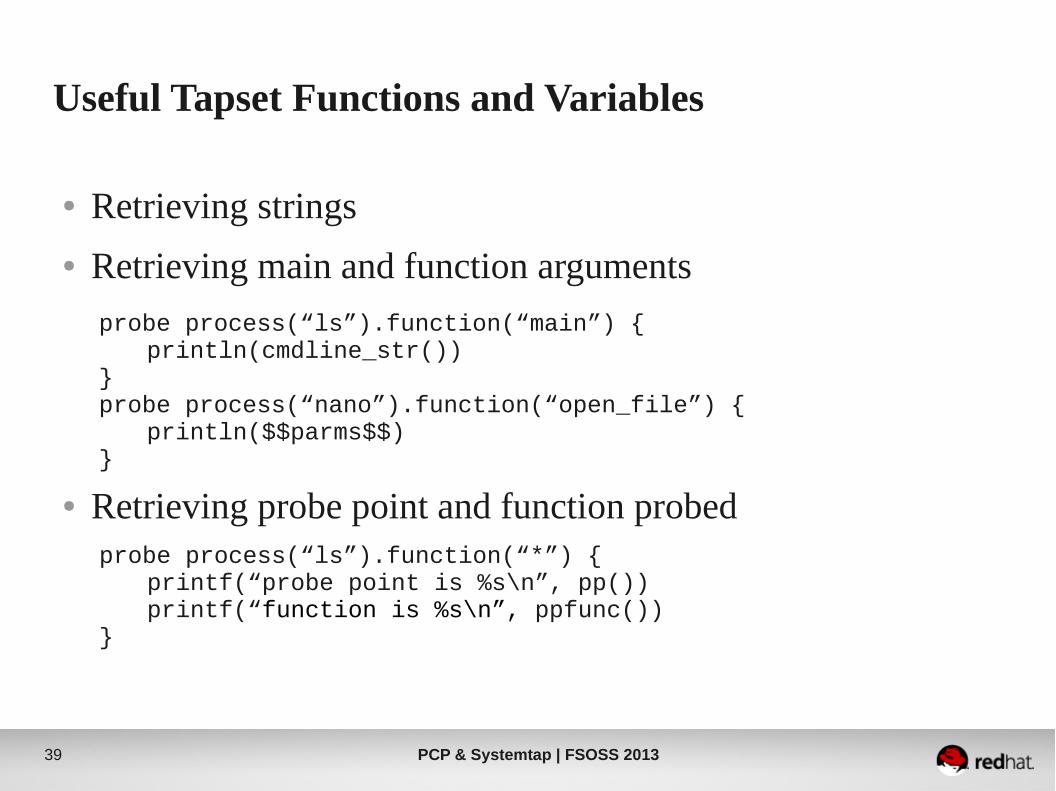
Useful Tapset Functions and Variables
● Retrieving strings
● Retrieving main and function arguments
● Retrieving probe point and function probed
probe process(“ls”).function(“main”) {println(cmdline_str())
}probe process(“nano”).function(“open_file”) {
println($$parms$$)}
probe process(“ls”).function(“*”) {printf(“probe point is %s\n”, pp())printf(“function is %s\n”, ppfunc())
}

PCP & Systemtap | FSOSS 201340
Useful Tapset Functions and Variables
● Issue a system command
● Filtering by PID using stap -x
probe process(“ls”).function(“main”) {system(“echo main started!”)
}
probe syscall.write {if (pid() == target())
printf(“process called write() with %s\n”, user_string_n($buf, $count))}

PCP & Systemtap | FSOSS 201341
And now for some fun!
SystemTap examples
PCP & Systemtap | FSOSS 201342
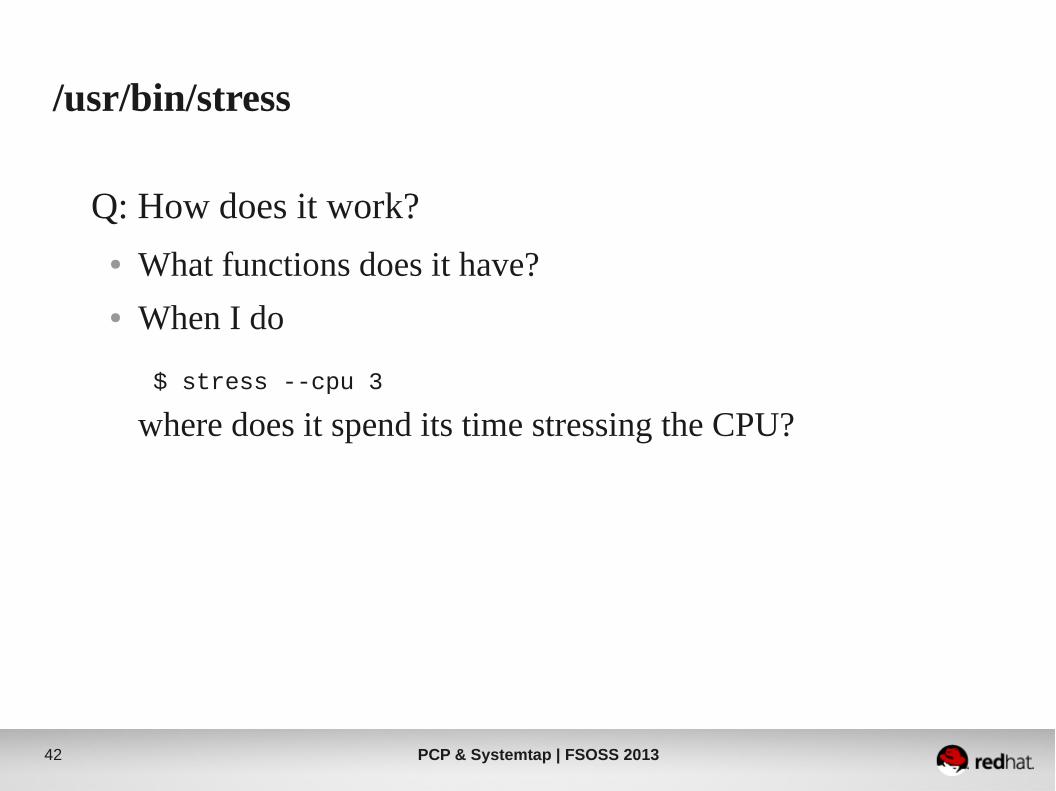
/usr/bin/stress
Q: How does it work?● What functions does it have?● When I do
where does it spend its time stressing the CPU?$ stress --cpu 3
PCP & Systemtap | FSOSS 201343
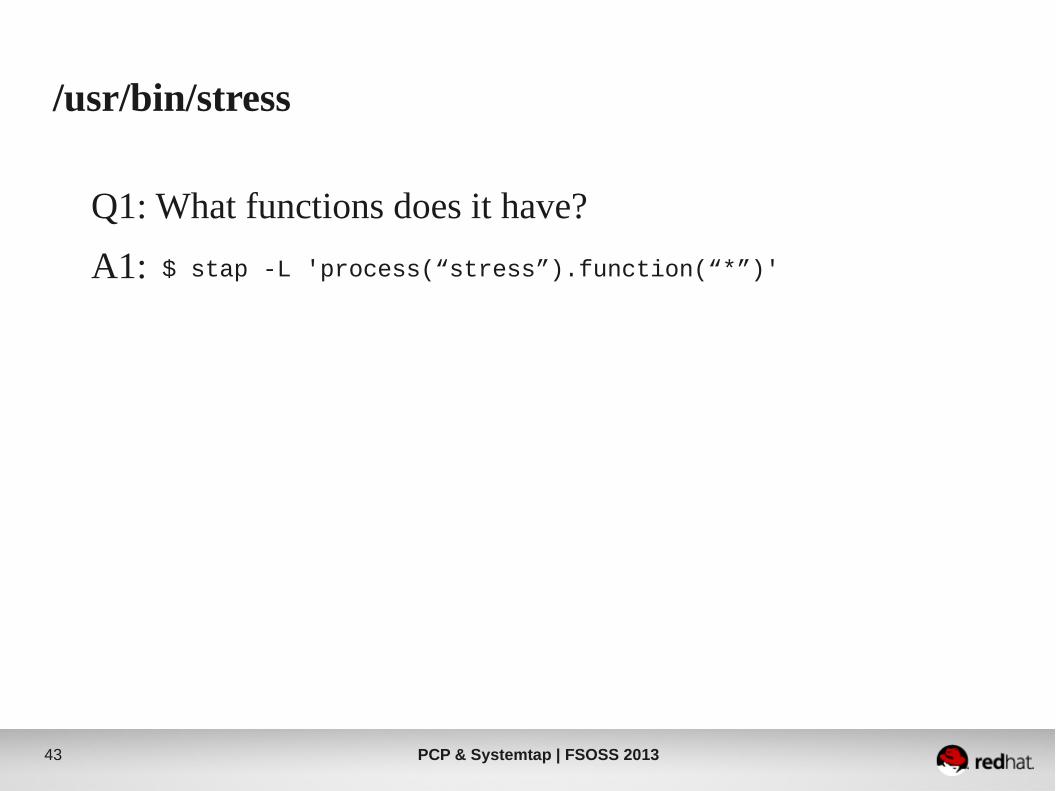
/usr/bin/stress
Q1: What functions does it have?
A1: $ stap -L 'process(“stress”).function(“*”)'
PCP & Systemtap | FSOSS 201344
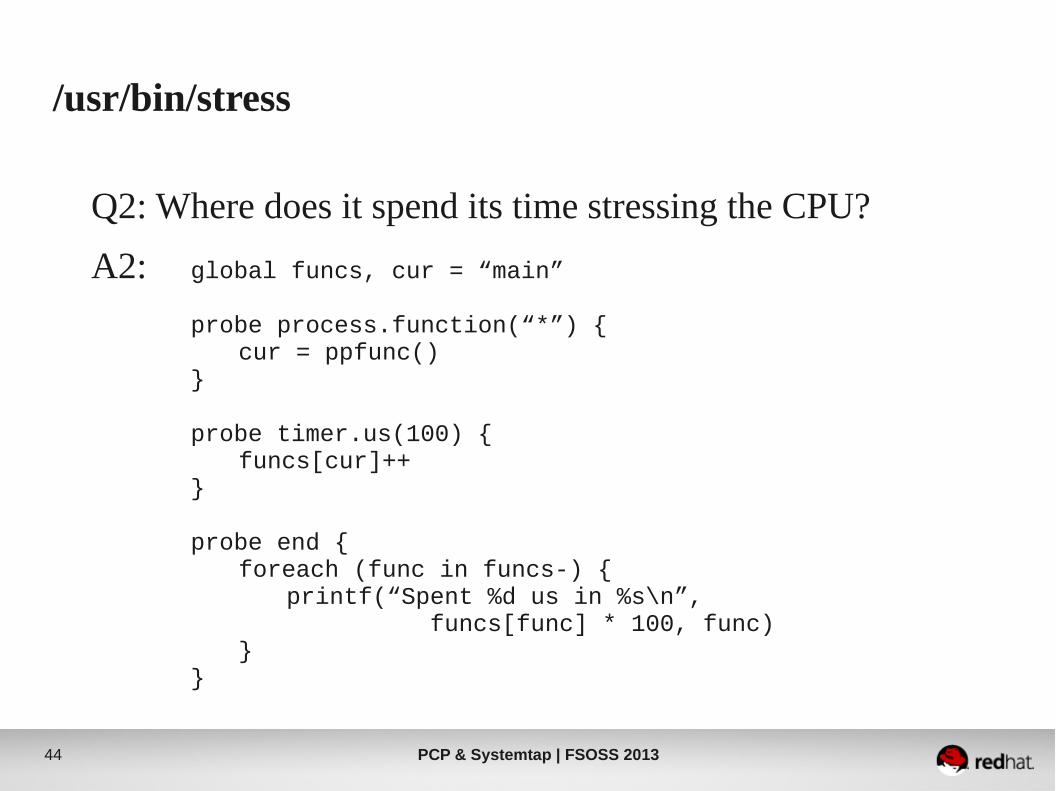
/usr/bin/stress
Q2: Where does it spend its time stressing the CPU?
A2: global funcs, cur = “main”
probe process.function(“*”) {cur = ppfunc()
}
probe timer.us(100) {funcs[cur]++
}
probe end {foreach (func in funcs-) {
printf(“Spent %d us in %s\n”,funcs[func] * 100, func)
}}

PCP & Systemtap | FSOSS 201345
/home/jlebon/my_app
01. #include <stdlib.h>02. #include <limits.h>03. 04. short next_number() {05. static short counter = 0;06. return counter++;07. }08. 09. void main(void)10. {11. int i, state;12. for (i = 0; i < INT_MAX; i++) {13. state = next_number();14. }15. }
called INT_MAX times
returns a short, i.e.counter (SHRT_MIN, SHRT_MAX)∈
OK if on a system where sizeof(short) == sizeof(int)Otherwise, state will wrap around before its time!negative state = black hole created at CERN
fordemo
14. if (state < 0)15. system(“echo `date +%s.%N` invalid state”);16. }17. }

PCP & Systemtap | FSOSS 201346
/home/jlebon/my_app
● Can't fix and recompile!
Q: How can we make sure that we never end up in an invalid (negative) state?
A: Perfect job for SystemTap!
PCP & Systemtap | FSOSS 201347
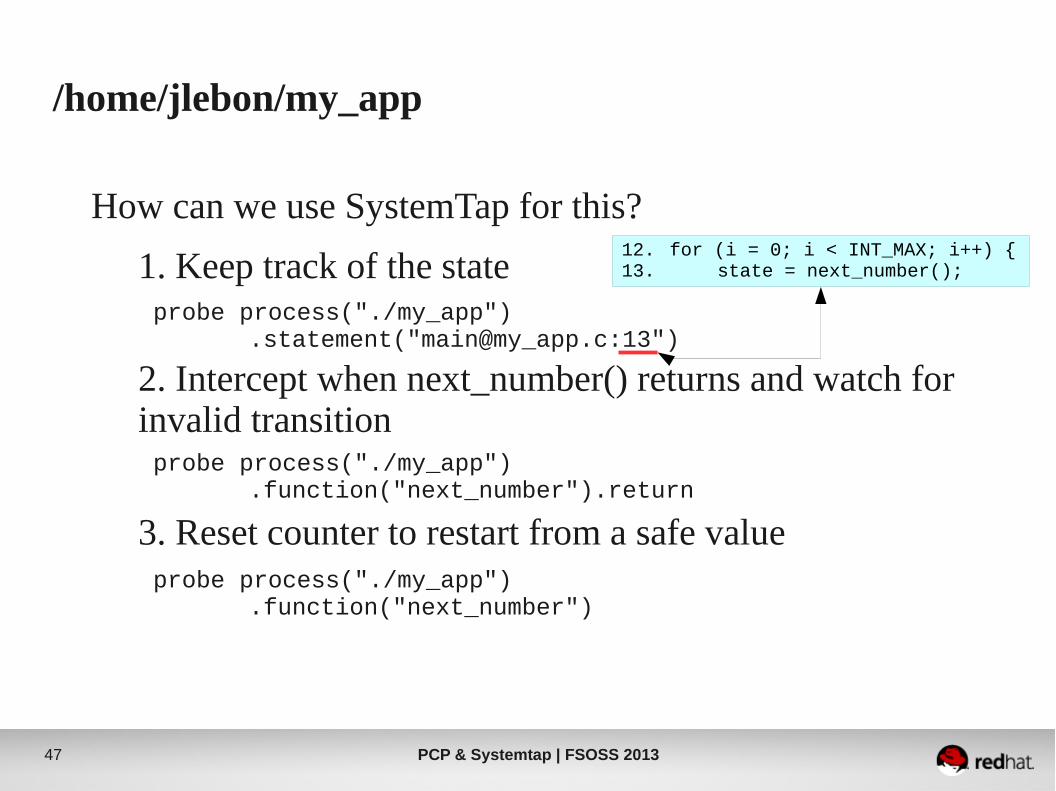
/home/jlebon/my_app
How can we use SystemTap for this?
1. Keep track of the state
2. Intercept when next_number() returns and watch for invalid transition
3. Reset counter to restart from a safe value
probe process("./my_app").statement("main@my_app.c:13")
probe process("./my_app").function("next_number").return
probe process("./my_app").function("next_number")
12. for (i = 0; i < INT_MAX; i++) {13. state = next_number();

PCP & Systemtap | FSOSS 201348
/home/jlebon/my_app
global state, reset_counter
probe process("./my_app").statement("main@my_app.c:13") { state = $state}
probe process("./my_app").function("next_number").return { if ($return < 0) { printf("Invalid state detected!\n") printf("About to go from %d to %d!\n", state, $return) printf("Resetting state to 0 and deploying LHC airbags!\n") $return = 0 reset_counter = 1 }}
probe process("./my_app").function("next_number") { if (reset_counter) { $counter = 0 reset_counter = 0 }}

PCP & Systemtap | FSOSS 201349
Questions?

PCP & Systemtap | FSOSS 201350
Get Involved!
IRC: irc.freenode.net
#pcp
#systemtap
Web:
http://oss.sgi.com/projects/pcp/
http://sourceware.org/systemtap
Email:
PCP & Systemtap | FSOSS 201351
Get Involved!
IRC: irc.freenode.net
#pcp
#systemtap
Web:
http://oss.sgi.com/projects/pcp/
http://sourceware.org/systemtap
Email: