PCD Impact Assessment on Food Security in Tanzania
82
PCD Impact Assessment on Food Security in Tanzania Assessing Linkages between OECD Policies and Tanzania’s Agro-Food Systems and Food Security Conditions Workshop 2, Dar Es Salaam, 27/11/2014 With support from the Ministry for Foreign Affairs of Finland Page 1 ECDPM
-
Upload
european-centre-for-development-policy-management-ecdpm -
Category
Presentations & Public Speaking
-
view
30 -
download
0
Transcript of PCD Impact Assessment on Food Security in Tanzania

PCD Impact Assessment on Food Security in Tanzania
Assessing Linkages between OECD Policies and Tanzania’s Agro-Food Systems and Food Security
Conditions
Workshop 2, Dar Es Salaam, 27/11/2014
With support from the Ministry for Foreign Affairs of Finland Page 1ECDPM
INTRODUCTION AND REMINDER
Page 2ECDPM
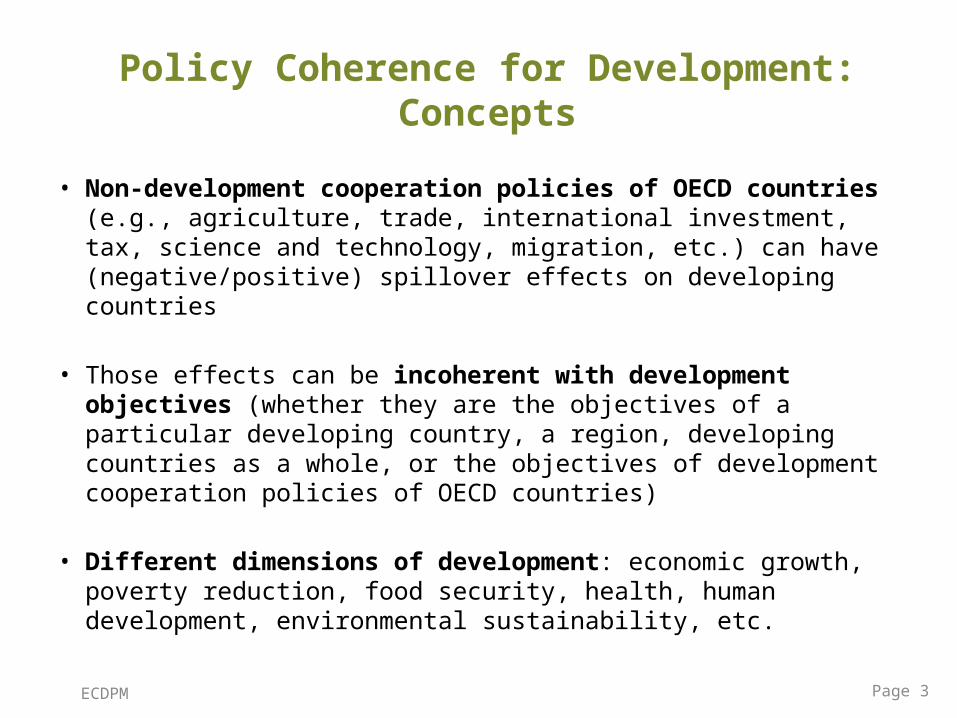
Policy Coherence for Development: Concepts
• Non-development cooperation policies of OECD countries (e.g., agriculture, trade, international investment, tax, science and technology, migration, etc.) can have (negative/positive) spillover effects on developing countries
• Those effects can be incoherent with development objectives (whether they are the objectives of a particular developing country, a region, developing countries as a whole, or the objectives of development cooperation policies of OECD countries)
• Different dimensions of development: economic growth, poverty reduction, food security, health, human development, environmental sustainability, etc.
Page 3ECDPM

OECD Member States Map
Source: Wikimedia CommonsPage 4ECDPM

Policy Coherence for Development: Concepts
• European Union: ‘The EU seeks to minimise contradictions and to build synergies between policies other than development cooperation that have an impact on developing countries, for the benefit of overseas development’
• OECD: ‘The pursuit of development objectives through the systematic promotion of mutually reinforcing policy actions on the part of both OECD and development countries’
• Two implications: “Do not harm”; “do good”– Ensure that all policies are “development-friendly”– Promote synergies among policies with regards to development
objectives
Page 5ECDPM

PCD Concept—Case of Food Security
Source: OECDPage 6ECDPM

PCD as a Policy and Institutional Mechanism
Source: OECD
Page 7ECDPM

PCD Impact Assessment Approaches
Ex ante Ex post
OECD-Policy-based
Country-/region-based X
Page 8ECDPM

Our PCD Impact Assessment Approach
• Developing a methodology for ex post, country-level PCD assessments with a focus on food security
• Involving local and OECD stakeholders (participatory approach)
• Supporting OECD Development Assistance Committee in improving PCD, fostering policy change and addressing trade-offs between domestic and international goals based on evidence
• Supporting developing country actors (governments, private sector and civil society) in understanding OECD policies’ impacts on their countries, advocating for improved PCD and formulating policy responses
Page 9ECDPM
Food Security Analysis Framework
• Food availability• Access to food• Food utilization• Stability
Page 10ECDPM

Page 11ECDPM

OECD-Tanzania Linkages
Commodity Tanzania’s net trade balance Primary linkage Secondary
linkageFood security factor(s)
Grains and riceSmall exporter/importer
Int’l markets Foreign direct investment
Availability and access (pr. & inc.)
Dairy products Importer Int’l markets - Availability and access (pr. & inc.)
Sugar Importer Int’l markets OECD Market access
Access (inc.) and utilization*
Coffee, tea, and tobacco Exporter OECD Market
access - Access (inc.)
Cotton Exporter Int’l markets OECD Market access Access (inc.)
Horticultural crops Exporter OECD Market
access - Access (inc.)
Fisheries Exporter OECD Market access - Access (inc.)
* Local development Page 12ECDPM

OECD-Tanzania Linkages
• Investigating changes in OECD policies and market outcomes over an adequate period of time and identifying negative/positive spillover effects
• Taking into account contextual changes (e.g., domestic/regional market and policy changes, global market and policy changes, etc.)
Page 13ECDPM

Objectives of Workshop 2
1. Providing an overview of OECD agricultural and trade policies and their spillover effects on international markets and domestic markets in developing/emerging countries and Sub-Saharan Africa
2. Assessing the impacts of OECD agricultural and trade policies in specific agro-food sub-sectors in Tanzania
3. Assessing the implications of OECD countries’ agro-food market regulations and private standards on Tanzanian exporters’ access to OECD markets
4. Assessing the influence of OECD policies on foreign direct investment and international businesses’ practices in Tanzania’s agricultural and food sectors
5. Soliciting views of stakeholders on ways and extent to which OECD policies affect the agro-food system and food security in Tanzania
6. Discussing methodological aspects
Page 14ECDPM

Q&A
• According to you, what does Policy Coherence for Development mean for Tanzania?
Page 15ECDPM

MODULE 3 PART 1
OECD domestic agricultural policies and spillover effects on Tanzania through international marketsOverview of OECD domestic agricultural
policies and spillover effects on international markets
Page 16ECDPM

Objectives
1/ Have a common understanding of the global context in which Tanzania operates
Þ Reality check on the recent evolutions globally and in Tanzania
2/ Present assumptions on theoretical impact pathways through international prices and evidence of their relevance in the litterature
Page 17ECDPM

Methodology
• So far desk-based research– Official data (OECD etc.)– Academic literarure and « grey » literature (reports)
• Limitations:– Limited up to date data– Publications on very specific commodities or
dimensions (2008 crisis)
=>Risk of using specific cases as general lessons
=> Your feedbacks are key
Page 18ECDPM
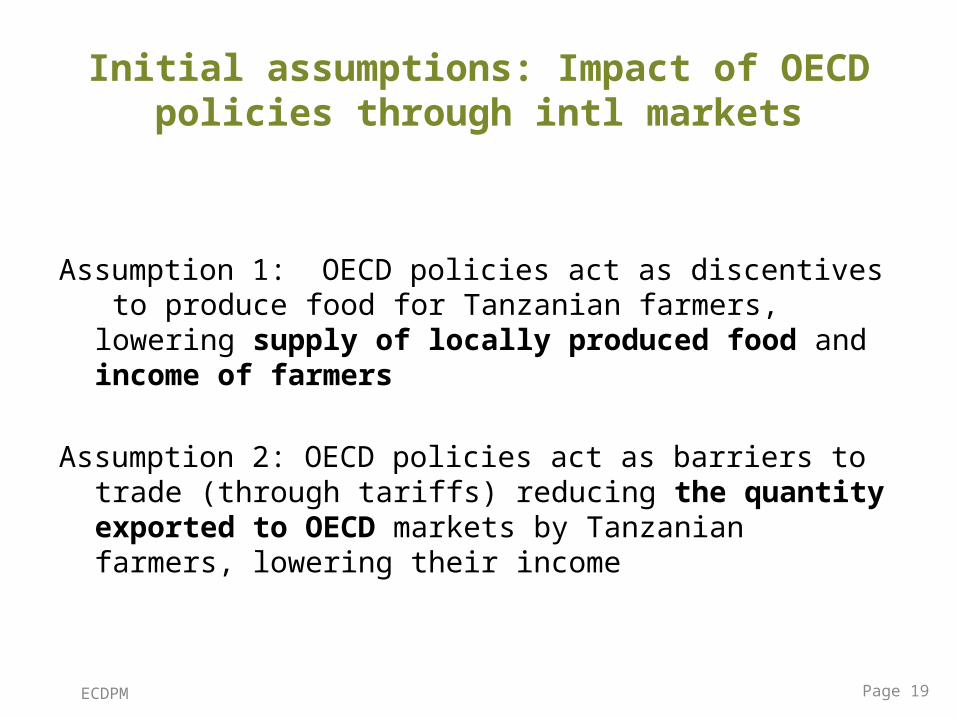
Initial assumptions: Impact of OECD policies through intl markets
Assumption 1: OECD policies act as discentives to produce food for Tanzanian farmers, lowering supply of locally produced food and income of farmers
Assumption 2: OECD policies act as barriers to trade (through tariffs) reducing the quantity exported to OECD markets by Tanzanian farmers, lowering their income
Page 19ECDPM

Assumption 1: discentives to supply of locally produced food
Channel 1:
=> depress price levels for Tanzanian farmers Through competition from low cost imports
Page 20ECDPM

Assumption 1: discentives to supply of locally produced food
Support policies and exports subsidies : increase supply on intl markets Þ depress intl pricesÞ Lower intl prices transmit to local pricesÞDepress farmers gates prices of import competing commodities
Farmers incomeNet food buyers
Page 21ECDPM

Assumption 1: discentives to supply of locally produced food
Channel 2:
=> increase price volatility which act as a discentive for farmers to invest in ag production
Page 22ECDPM

Assumption 1: discentives to supply of locally produced food
Temporary subsidized exports
Þ increase volatility of intl pricesÞ More volatile intl prices transmit to local prices
Þ Increase volatiliy of farmers gates prices of import competing commodities
Farmers incomeNet food buyers
Page 23ECDPM
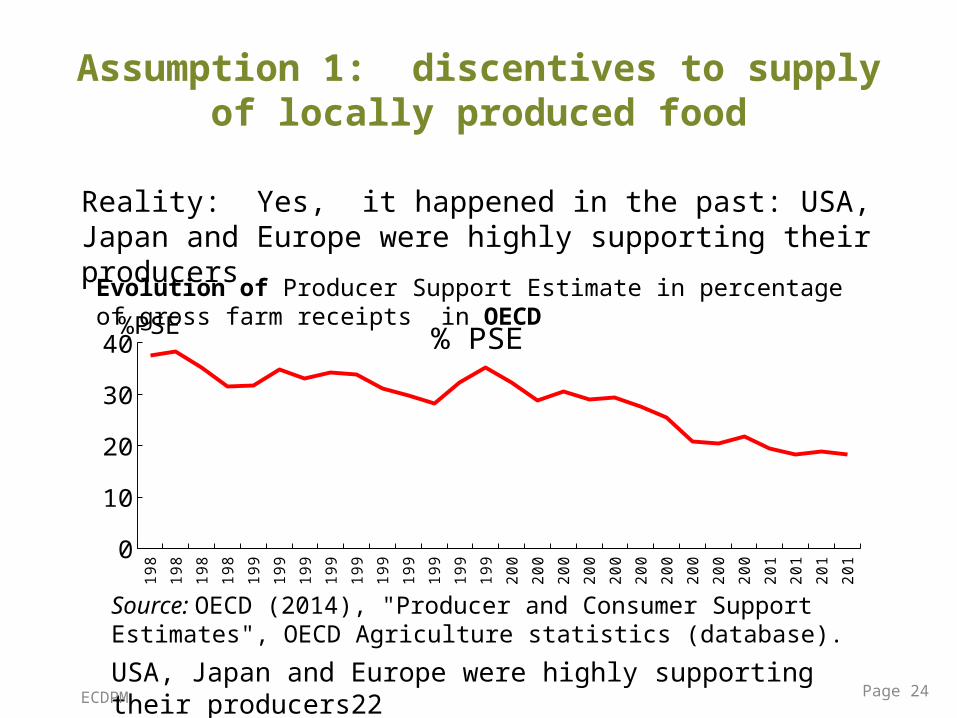
Assumption 1: discentives to supply of locally produced food
Reality: Yes, it happened in the past: USA, Japan and Europe were highly supporting their producers
19
8
19
8
19
8
19
8
19
9
19
9
19
9
19
9
19
9
19
9
19
9
19
9
19
9
19
9
20
0
20
0
20
0
20
0
20
0
20
0
20
0
20
0
20
0
20
0
20
1
20
1
20
1
20
1 0
10
20
30
40 % PSE %PSEEvolution of Producer Support Estimate in percentage of gross farm receipts in OECD
Source: OECD (2014), "Producer and Consumer Support Estimates", OECD Agriculture statistics (database).
USA, Japan and Europe were highly supporting their producers22
Page 24ECDPM

Assumption 1: discentives to supply of locally produced food
Reality: Yes, it happened in the past=> Those countries are considered to have contributed to the decrease in international price of grains, milk, butter, sugar, cotton
Page 25ECDPM

Assumption 1: discentives to supply of locally produced food
Yes, but
- has since become self sufficient in maize and rice
- local prices in Tanzania have been shown to be higher than intl markets prices more volatile
Þ Availability and accessibility problems of grains in Tanzania are due DOMESTIC factors and inefficiencies
lack of market integration within Tanzania and price transmission with intl
Globally
Tanzania
- Since then reduction of supports by OECD, increase in non OECD emerging economies (China, India)
- Since 2000s increase in international prices (3 spikes,:2008, 2010, 2011)
Page 26ECDPM

Assumption 1: discentives to supply of locally produced food
Yes, but
REALITY CHECK: Regarding international prices of grains, no case to accuse OECD policies of incoherence nowadays
ÞCoton USA ?
Page 27ECDPM

Assumption 2: Reduced market access for exporters
Channel 1 Barriers to entrance in the OECD markets - tariffs - non tariff measures
Page 28ECDPM

Assumption 2: Reduced market access for exporters
Tariffs
Þ decrease OECD demand of Tanzanian goods
Þ decrease income of export producing farmers
Farmers income
Page 29ECDPM

Assumption 2: Reduced market access for exporters
Channel 2 Increase of tariff with stage of processing in the value
chain (« tariff escalation ») => Disencentives to transform products locally and
capture higher share of value addition
Page 30ECDPM

Assumption 2: Reduced market access for exporters
Tariff escalation
Þ decrease OECD demand of Tanzanian processed ag productsÞ decrease income of export producing farmersÞDecrease employment creation in agroindustreis
Farmers incomeEmployment creation
Page 31ECDPM
Assumption 2: Reduced market access for exporters
Yes, historically agricultural products more protected than other types of products
But Tanzania has benefitted from preferences :
- Historically from the EU as an ACP country (Lomé, Cotonou etc.)-Since 2000s from preferential agreements from other OECD countries as a LDC (EBA from EU, AGOA from USA etc.)
-=> Many preferential agreements: question is what is also provided to competitors ?-=> Example of sugar. Page 32ECDPM

IMPACTS OF OECD POLICIES ON TANZANIA’S SECTOR
CASE OF SUGAR
Page 33ECDPM
Tanzanian Sugar Sector
• A major agro-food sector• Tanzania, a net importer of sugar• Four large sugar factories, some new projects
underway• Low sugar cane yields relatively to Southern
African producers and other Eastern African producers (lack of irrigation, low-performance varieties, low fertiliser use and other production and marketing factors)
• Privatization and efforts to rehabilitate the sector in the 1990s led to productivity enhancement and production increase
Page 34ECDPM

Sugar Production and Trade in Tanzania
Left axis, sugar cane production in tonnes; right axis, sugar production and trade in tonnes
Page 35ECDPM
Sugar Trade
• Tanzania exports sugar mostly to the EU under the EBA regime (10,000 tonnes, but export licenses are difficult to obtain reportedly)
• Import duties and quotas (licenses)• Large volumes of sugar imported illegally• Sugar factories have experience difficulty competing
with cheap sugar imports, notably sugar from Latin America, Southern Africa, and some Asian exporters
• Import surges/dumping cases in the late 1990s and early 2000s, incl. sugar from the EU among other origins
• Need to strengthen capacity to implement countervailing duties and other safeguard measures
Page 36ECDPM

Sugar Production and Trade in Tanzania
Left axis, sugar cane production in tonnes; right axis, sugar production and trade in tonnes
Page 37ECDPM

International Sugar Markets
• 2/3 of world sugar production from Brazil, Australia, Cuba and Thailand
• Other big producers: India, EU, and South Africa• Net exporting regions: Americas, Oceania• Net importing regions: Asia, Europe, Africa• Largest exporters: Brazil, EU, Australia, Cuba and Thailand• Largest importers: Russia, EU, and Japan• Concentrated sector; e.g., EU imports done by a few multi-
national companies• About ⅓ of world sugar production is trade internationally• Most of international trade in sugar is done under trade
agreements; residual trade thru spot markets; as a result (in addition to the fact that sugar cane is a perennial crop), this market is very volatile
Page 38ECDPM
International Sugar Markets
• Decline in international prices in the 1990s (rise of Brazil as a producer and an exporter), rise in prices in the 2000s; EU and US became net exporters after having been net importers (e.g., in the 1970s)
Page 39ECDPM

Sugar Production in OECD Group
19
86
19
87
19
88
19
89
19
90
19
91
19
92
19
93
19
94
19
95
19
96
19
97
19
98
19
99
20
00
20
01
20
02
20
03
20
04
20
05
20
06
20
07
20
08
20
09
20
10
20
11
20
12
0
2
4
6
8
10
12
0%
10%
20%
30%
40%
50%
60%
70%
80%
EU productions (LA) US productions (LA) Other OECD (LA)
US share (RA) EU share (RA) All OECD share (RA)
Pro
du
ctio
ns
(to
ns
)
Sh
are
in w
orl
d p
rod
uc
tion
s (
%)
Page 40ECDPM

Sugar Exports of OECD Group
19
86
19
87
19
88
19
89
19
90
19
91
19
92
19
93
19
94
19
95
19
96
19
97
19
98
19
99
20
00
20
01
20
02
20
03
20
04
20
05
20
06
20
07
20
08
20
09
20
10
20
11
0
2
4
6
8
10
12
0%
5%
10%
15%
20%
25%
30%
35%
40%
45%
EU exports (LA) US exports (LA) Other OECD exports (LA)
US share (RA) EU share (RA) All OECD share (RA)
Ex
po
rts
(to
ns
)
Sh
are
in w
orl
d e
xp
ort
s (
%)
Page 41ECDPM

Sugar Imports of OECD Group
19
86
19
87
19
88
19
89
19
90
19
91
19
92
19
93
19
94
19
95
19
96
19
97
19
98
19
99
20
00
20
01
20
02
20
03
20
04
20
05
20
06
20
07
20
08
20
09
20
10
20
11
0
2
4
6
8
10
12
0%
5%
10%
15%
20%
25%
30%
35%
40%
45%
50%
EU imports (LA) US imports (LA) Other OECD imports (LA) US share (RA) EU share (RA)
All OECD share (RA)
Pro
du
ctio
ns
(to
ns
)
Sh
are
in w
orl
d im
po
rts
(%
)
Page 42ECDPM

International Sugar Markets
• Sugar trade regimes– EU’s preferential tariff and quota trade regimes:
• EU Special Preferential Sugar (SPS) arrangements, bilateral agreements with ACP countries, annual TRQ for raw cane sugar
• Sugar protocol of the EU-ACP Cotonou Partnership Agreement, TRQ with guaranteed prices
– US’ preferential tariff and quota regime (Puerto Rico, Philippines and other countries with whom the US has special trade relations—not for EA countries and excl. other low-cost producers)
– Commonwealth Sugar Agreement: TRQ for exports to UK until Lomé Agreement Sugar Protocol
• Other international agreements for sugar, incl. bilateral agreements (e.g., Cuba-Russia Sugar Agreement)
• WTO MFN regime (residual spot market)Page 43ECDPM

EU Sugar Policy
• Major reform of the sugar sector started in 2006– Cut in subsidies to farmers; cut in the target price of
white sugar; farmers compensated by decoupled payment for a 4-year period, additional to the single farm payment; abolition of the intervention price
– Closure of obsolete sugar mills– Losses for countries with preferential access to EU
market– Full liberalization of imports from LDCs in 2009 (duty-
free access to EU sugar market for 48 LDCs in 2009 under the EBA agreement signed in 2001)
• Elimination of production quotas after 2015; production will increase, prices will go down
Page 44ECDPM
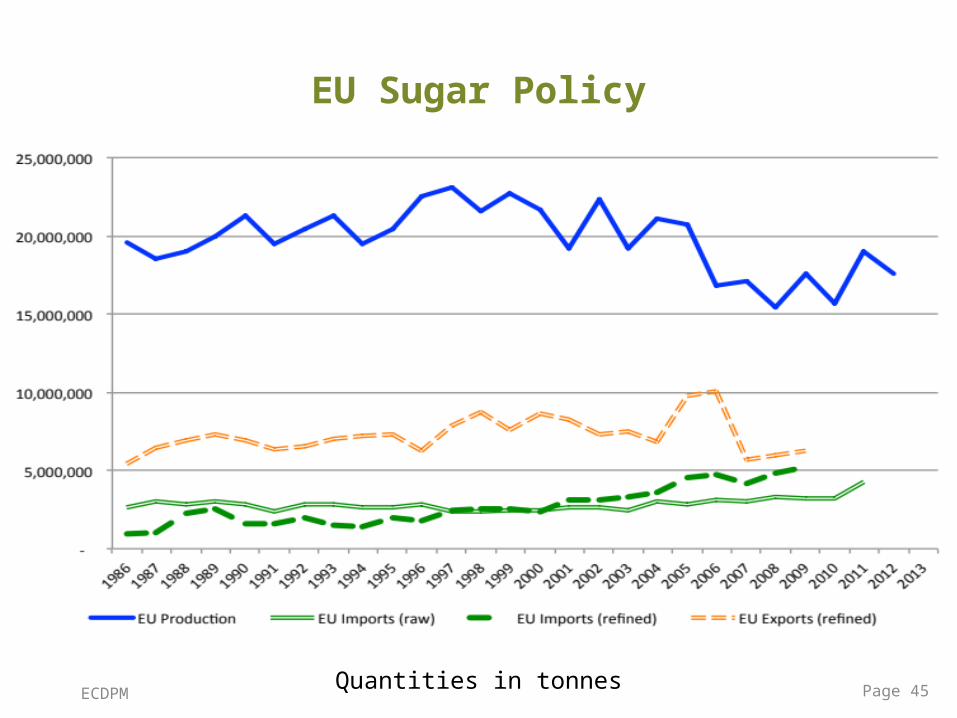
EU Sugar Policy
Quantities in tonnes Page 45ECDPM

Support to the Sugar Sector in OECD Group
19
86
19
87
19
88
19
89
19
90
19
91
19
92
19
93
19
94
19
95
19
96
19
97
19
98
19
99
20
00
20
01
20
02
20
03
20
04
20
05
20
06
20
07
20
08
20
09
20
10
20
11
20
12
20
13
0
1000
2000
3000
4000
5000
6000
7000
8000
9000
0
10
20
30
40
50
60
70
80
SCT OECD (value LA) SCT EU (value LA) SCT US (value LA) SCT OECD (% RA) SCT EU (% RA) SCT US (% RA)
Page 46ECDPM
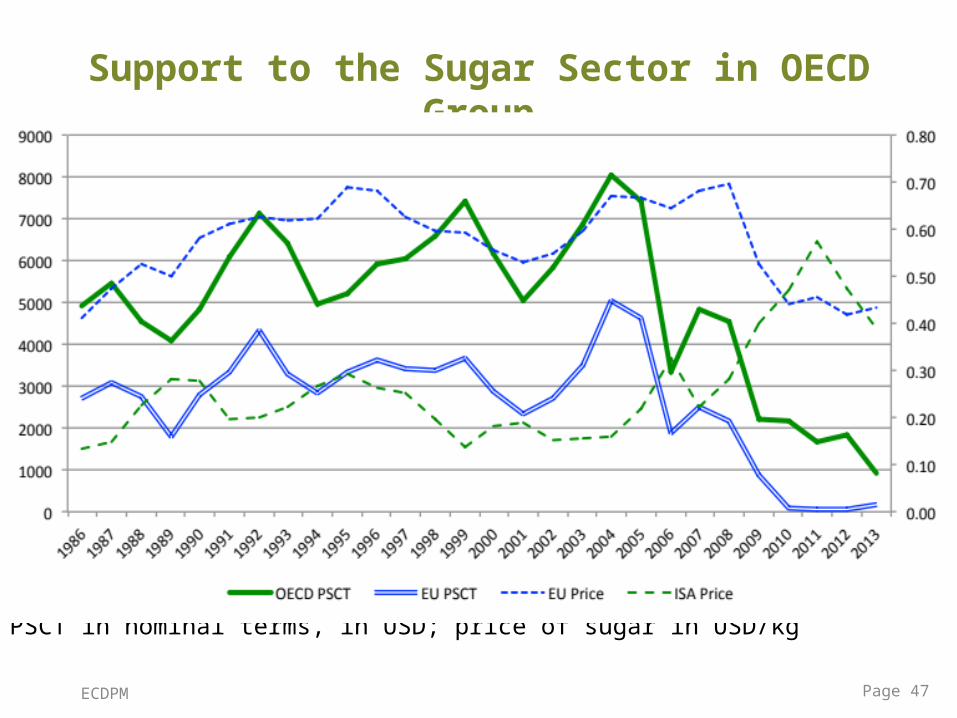
Support to the Sugar Sector in OECD Group
PSCT in nominal terms, in USD; price of sugar in USD/kg
Page 47ECDPM

Support to the Sugar Sector in OECD Group
19
86
19
87
19
88
19
89
19
90
19
91
19
92
19
93
19
94
19
95
19
96
19
97
19
98
19
99
20
00
20
01
20
02
20
03
20
04
20
05
20
06
20
07
20
08
20
09
20
10
20
11
20
12
20
13
0
10
20
30
40
50
60
70
80
0
100
200
300
400
500
600
700
800
900
SCT EU (% RA) SCT US (% RA) SCT OECD (% RA) EU price ($/ton LA) US price ($/ton LA)
World price ($/ton LA)
SC
T (
%)
Pri
ce
($
/to
n)
Page 48ECDPM

Sugar Markets in Africa
• Southern African producers more cost-competitive than Eastern and Central Africa producers– Malawi, Mauritius, Sudan, Zambia, Zimbabwe, South
Africa: low-cost sugar producers (SADC more competitive than EAC in general, production costs relatively high in Eastern Africa)
– Kenya, Swaziland, and Tanzania: higher-cost producers (indebted sugar companies in Kenya and Tanzania in early 2000s, late payments to farmers)
• Regional market protection in the EAC customs union; tariff protection; sensitive industry
• In the late 1990s, near collapse of the industry in the region (period of low prices, consumer prices at or below sugar production costs); after that, development of safeguard measures; due to lack of policy planning and administrative capacities, the regional industry is still affected by cases of dumping (as of 2006); low-cost imports from Brazil, Southern Africa and Australia
Page 49ECDPM

EU Development Assistance for the Sugar Sector
• Sugar Protocol Accompanying Measures introduced as part of the 2006 reform; assistance package for ACP countries; 40m euros
• ACP Sugar Research and Innovation Programme, to fund research to enhance sugar productivity, diversify uses of sugar cane (biofuels, bio-fertilisers, bio-polymers, etc.) and generally ensure that the sugar industry remains viable; about 20m US$, mostly from EU, also from Australia, US and ACP countries
Page 50ECDPM

Q&A
Page 51ECDPM

MODULE 3 PART 2
OECD non-tariff measures and private standards
Overview of OECD standards and implications for market access for Tanzania’s exports and food security conditions
Page 52ECDPM

ECDPM Page 53
Non-Tariff Measures in OECD and other countries
UNCTAD, 2010
“policy measures, other than ordinary customs tariffs, that can potentially have an economic effect on international trade in goods, changing quantities traded, or prices or both”
Non-Tariff Measures are :
• Most NTMs are governed by WTO laws and closely monitored• Members are ‘required’ to notify new and revised measure to
the WTO• TBT and SPS measures are by far the most important

ECDPM Page 54
Examples of NTMs measures in OECD countries
SPS TBT• Microbiological
standard
• Pesticide residue limits
• Contaminants in foodstuffs standards
• Veterinary drug residue limits
• Restrictions on antibiotic use in aquaculture
• Fumigation requirements
• Factory hygiene
• Quality attributes (size, shape, design, freshness, quality )
• Labeling requirements
• Packaging standards
• Traceability requirements for food and animal
• Health certificates
• Pest risk analysis requirements
• Import licensing and quota
• price control
• Bans/Restriction in Illegal Fishing
• Rule of Origin for manufactured products
Source: EU Helpdesk, 2014 and various other sources
Other NTMs

ECDPM Page 55
Increasing use of SPS and TBT19
95
1996
1997
1998
1999
2000
2001
2002
2003
2004
2005
2006
2007
2008
2009
2010
2011
2012
2013
2014
0
2000
4000
6000
8000
10000
12000
EU (28) US Other OECD BRICS Other Countries
Figure 2: Cumulative number of SPS Notifications to the WTO
1995
1996
1997
1998
1999
2000
2001
2002
2003
2004
2005
2006
2007
2008
2009
2010
2011
2012
2013
2014
0
1000
2000
3000
4000
5000
6000
7000
8000
EU (28) US Other OECD BRICS Other Countries
Source: SPS and TBT notifications from the WTO Available at http://spsims.wto.org/web/pages/search/notification/regular/Search.aspx and at http://tbtims.wto.org/web/pages/search/notification/BasicSearch.aspx
Figure 3: Cumulative number of TBT Notifications to the WTO
• As of August 31st, 2014, a total of 10,945 SPS measures and 7,158 TBT measures has been notified to the WTO
• Reflect the increase in exports • But poses the question policy substitution in a context of
decreasing tariffs

ECDPM Page 56
Non-Tariff Measures by sectors
Table 1: Number of NTMs by economic sectors (all countries)
Source: Adapted from Gourdon and Nicita (2012)
• Food and agricultural products are the most affected
• Important implication of food security

ECDPM Page 57
Working definition proposed by China and New Zeeland to WTO
“are written requirements or set of written requirements of a non-governmental entity which are related to food safety, animal or plant life or health and for common and repeated use”
Private Voluntary Standards are :
Rising role of Private Voluntary Standards

ECDPM Page 58
Too many PVS ?
Source: Standardmap, ITC
More than 400 (UNCTAD and EU estimates)

ECDPM Page 59
Rising role of Private Voluntary Standards…
• Despite their voluntary nature, PVSs are ‘de facto’ mandatory for to access developed countries markets (Henson and Northen, 1998).
• PVSs versus Public Standards?• PVSs are used by retailers to establish and maintain
reputations, minimise monitoring and inspection costs due to public standards
• PVSs are more complex and stringent and are not necessarily being based on scientific evidences (Henson and Humphrey 2009).
• PVSs cover number of dimension (social, environment, equity, organic production, etc.) not covered by public standards

Increase regulation and standard
Þ Restrict OECD market access
Þ decrease income of export producing farmers
ÞDecrease employment creation in agroindustreis
Farmers incomeEmployment creation
Causal chain of the impact of standards on food security…
ECDPM Page 60

ECDPM Page 61
NTM for Traditional exports crops : Coffee, tea, tobacco and cotton
Coffee and tea• Microbiological
standard• Pesticide residue
limits• Quality attributes • Labelling and
Packaging standards
Tobacco• Prohibition of certain types of tobacco
• Restriction of certain substances (nicotine limit) in cigarette
• Labeling requirements
• Packaging standards
Cotton
• Pesticide residue limits in textile products
• Contaminants in feedstuffs
• Quality attributes
Several private standards, mostly social, sustainability and environmental : Fair Trade, Rainforest Alliance, UTZ certified, Ethical Trading Initiative
• Mostly exported raw will little or no value addition• Regulated sectors by commodity boards
Public sta
nd
ard
sPriv
ate
s sta
ndard
s

ECDPM Page 62
Example of Coffee
19
97
19
98
19
99
20
00
20
01
20
02
20
03
20
04
20
05
20
06
20
07
20
08
20
09
20
10
20
11
20
12
20
13
0%
20%
40%
60%
80%
100%
0
50
100
150
200
Export to OECD (LA) Export to EU (LA) Export to US (LA)Share to OECD (RA) Share to EU (RA) Share to US (RA)
Sh
are
(%
)E
xpo
rts
($U
S m
illio
n)
19
96
19
97
19
98
19
99
20
00
20
01
20
02
20
03
20
04
20
05
20
06
20
07
20
08
20
09
20
10
20
11
20
12
20
13
0.0%
0.2%
0.4%
0.6%
0.8%
1.0%
1.2%
Total value and share of Tanzania export of coffee to OECD
Share of Tanzania in OECD total coffee import
Note : RA=Rigth Axis, LA = Left AxisSource : UNCOMTRADE 2014

ECDPM Page 63
Traditional exports crops access to OECD
• Standards are realities in traditional export crops• But, they are not major barrier to access OECD market
• Other factors are major constraints to the development of these sectors
• Domestics policies• Low value addition (but why?)• Lack infrastructures and low productivity
• Instead private certification offer the opportunity :• to expand trade and access niche markets (coffee and
tea) • earn ‘decent’ prices (fair trade)
• In the medium term, private standards could become majors challenges (carbon footprint, etc.)

ECDPM Page 64
NTM and Non-traditional exports crops Fish and horticulture
Fish• EU bans on lake
victoria fish• Microbiological
standards• Pesticide residue
limits• Quality attributes • Packaging
standards
Flower
• Plant material quarantine
• Phytosanitary certification
• Pest risk analysis• Fumigation
requirements
Fruit, vegetable and spices• Pesticide residue
limits• Contaminants in
foodstuffs• Quality attributes• Labeling
requirements• Packaging standards
Several private standards, food safety, social, sustainability and environmental : GlobalGap, BRC, Fair Trade
• Emerging sectors with large potential (horticulture)
• Important for export diversification
• Regulated sectors by boards and GoT
Public sta
nd
ard
sPriv
ate
s sta
ndard
s

ECDPM Page 65
Example of FishFigure 18: Total value and share of Tanzania export of fish to OECD Figure 19: Share of Tanzania in OECD total fish import
Note : RA=Rigth Axis, LA = Left AxisSource : UNCOMTRADE 2014
19
97
19
98
19
99
20
00
20
01
20
02
20
03
20
04
20
05
20
06
20
07
20
08
20
09
20
10
20
11
20
12
20
13
0%20%40%60%80%100%
0
50
100
150
200
Export to OECD (LA) Export to EU (LA) Export to US (LA)Share to OECD (RA) Share to EU (RA) Share to US (RA)
Sh
are
(%
)
Exp
orts
($U
S m
il-lio
n)
19
96
19
97
19
98
19
99
20
00
20
01
20
02
20
03
20
04
20
05
20
06
20
07
20
08
20
09
20
10
20
11
20
12
20
13
0.0%
0.1%
0.2%
0.3%
0.4% Share of Tanzania in OECD total fish import
Total value and share of Tanzania export of fish to OECD

ECDPM Page 66
Note : RA=Rigth Axis, LA = Left AxisSource : UNCOMTRADE 2014
1997
1998
1999
2000
2001
2002
2003
2004
2005
2006
2007
2008
2009
2010
2011
2012
2013
0%
20%
40%
60%
80%
100%
0
5
10
15
Export to OECD (LA) Export to EU (LA) Export to US (LA)Share to OECD (RA) Share to EU (RA) Share to US (RA)
Sh
are
(%
)E
xpo
rts
($U
S m
illio
n)
19
96
19
97
19
98
19
99
20
00
20
01
20
02
20
03
20
04
20
05
20
06
20
07
20
08
20
09
20
10
20
11
20
12
20
13
0.0%
0.1%
0.1%
Total value and share of Tanzania export of vegetables to OECD
Share of Tanzania in OECD total vegetables import
Example of Vegetables

ECDPM Page 67
• Non-traditional sectors face high public and private standards
• They are major barriers to market access, especially by small producers and exporters
• Limit the (rapid?) expansion of these sectors (horticulture)
• Other factors are also constraints to the development of these sectors
• Domestics policies (slow but increasing support to these sectors-horticulture)
• Lack infrastructures (cold storage, high transport cost, etc.) and low productivity
• Certification offers access to OECD market but requires high cost
• Small farmers are locked out of export market
Non-traditional exports crops access to OECD
Summary

ECDPM Page 68
Technical assistances to Developing countries
The SPS agreement mentions, “members shall take account of the special needs of developing country Members, and in particular of the least-developed country Members” (Article 10.1).
Example of initiative
• WTO/FAO Standards and Trade Development Facility• Support to Horticulture Development Council of
Tanzania • EU /COLEACP Pesticide Initiative Program (PIP)
• 11 producing/exporting companies/farmers’ groups supported in Tanzania
• Many programs/project from other partners
These supports are essential to ensure the compliance of smallholldersBut what about the million of non-beneficiary smallholders?

Q&A

MODULE 3 PART 3
Foreign direct investment and land acquisition
Overview of FDI and implication for food security in Tanzania
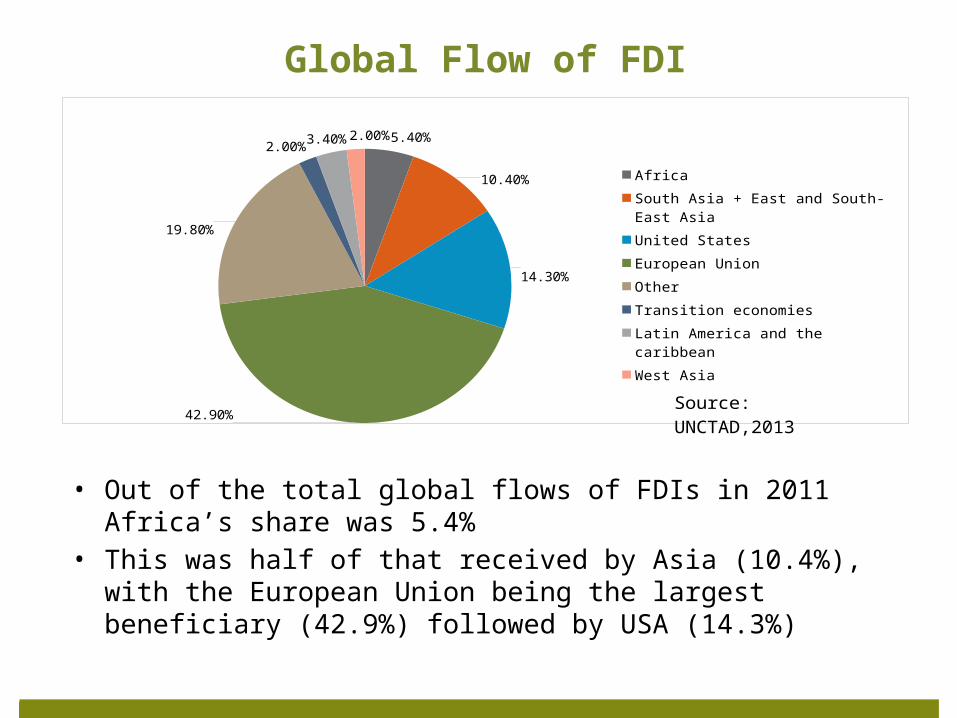
• Out of the total global flows of FDIs in 2011 Africa’s share was 5.4%• This was half of that received by Asia (10.4%), with the European
Union being the largest beneficiary (42.9%) followed by USA (14.3%)
Global Flow of FDI
5.40%10.40%
14.30%
42.90%
19.80%
2.00% 3.40% 2.00%
Africa
South Asia + East and South-East Asia
United States
European Union
Other
Transition economies
Latin America and the caribbean
West Asia
Source: UNCTAD,2013

• financial and banking services (16.8%) taking the lead, • real estate development (15.4%), • primary mining (10.1%) • electricity, gas and water (8.8%), and • motor vehicle assembly (8.7%)
Globally, Agriculture is among the least sectors attracting FDI
Other Services; 26.8
Finance; 16.8
Real Estate; 15.4
Construction; 2.6
Electricty,Gas+water; 8.8
Primary Mining; 10.1
Coke&Petroleum; 4.7
M-Vehicles; 8.7Manufacturing (others); 6.2
FDI, % by Sector/Industry
Source: UNCTAD,2013

• Generally, the pace of land acquisition globally has been increasing• After an inventory of the media reports on GRAIN blog (farmlandgrab.org),
the World Bank (Deininger et al. 2011) reports that between 2008-2009 there have been land acquisitions for 56.6 million hectares worldwide
Global Pace of Land Acquisition
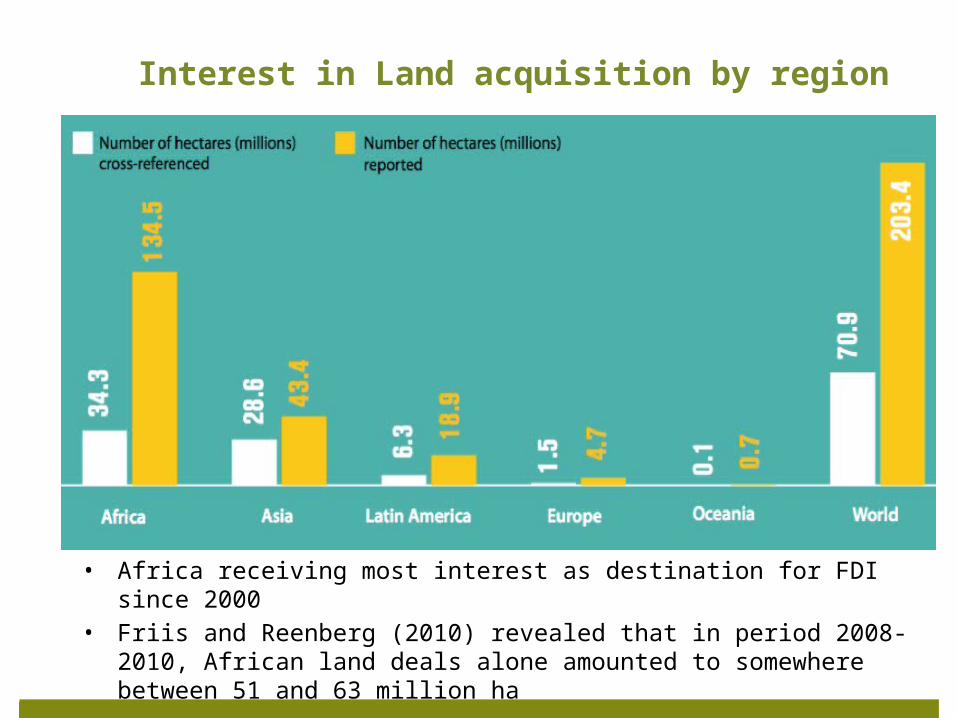
• Africa receiving most interest as destination for FDI since 2000• Friis and Reenberg (2010) revealed that in period 2008-2010,
African land deals alone amounted to somewhere between 51 and 63 million ha
Interest in Land acquisition by region

• Structural reforms and investment promotion facilities and strategies contributed increase in FDI inflow in last decade
• Mining & quarrying, manufacturing, wholesale & retail, accommodation share the largest share while agriculture sector attracted 4 percent of FDI stock
• Despite low FDI stock in agriculture sector, Land acquisition has been associated with agriculture FDI in the recent years for production of biofuel crops
Mining&Quarrying28%
Manufacturing21%
Wholesale,Retail Trade.
Catering&Accommodation Services
15%Agriculture, Hunting & Forestry
4%
Finance Insurance, Retail
Estate&Business Services
12%
Construction5%
Transport, Storage& Communication
7%
Others1%
Community, Social & Personal Services
0%
Electricity, Gas & Water6%
FDI inflow in Tanzania
2003 2004 2005 2006 2007 2008 2009 2010 2011 2012 2013 -
200,000,000
400,000,000
600,000,000
800,000,000
1,000,000,000
1,200,000,000
1,400,000,000
1,600,000,000
1,800,000,000
2,000,000,000
0
1
2
3
4
5
6
7
8
9
Inflow FDI inflow/GDP
FDI i
nflow
(USD
)
FD
I/G
DP
(%)

• Weak regulatory enforcement in land ownership and resource poor small holder farmers are at risk of losing livelihoods and food production land due to random sale of their land assets
• More than 4 million hectares of land are in the hand of large investors
• Local medium and small investors in agricultural land is rising but few land is optimally used
Land acquisitions
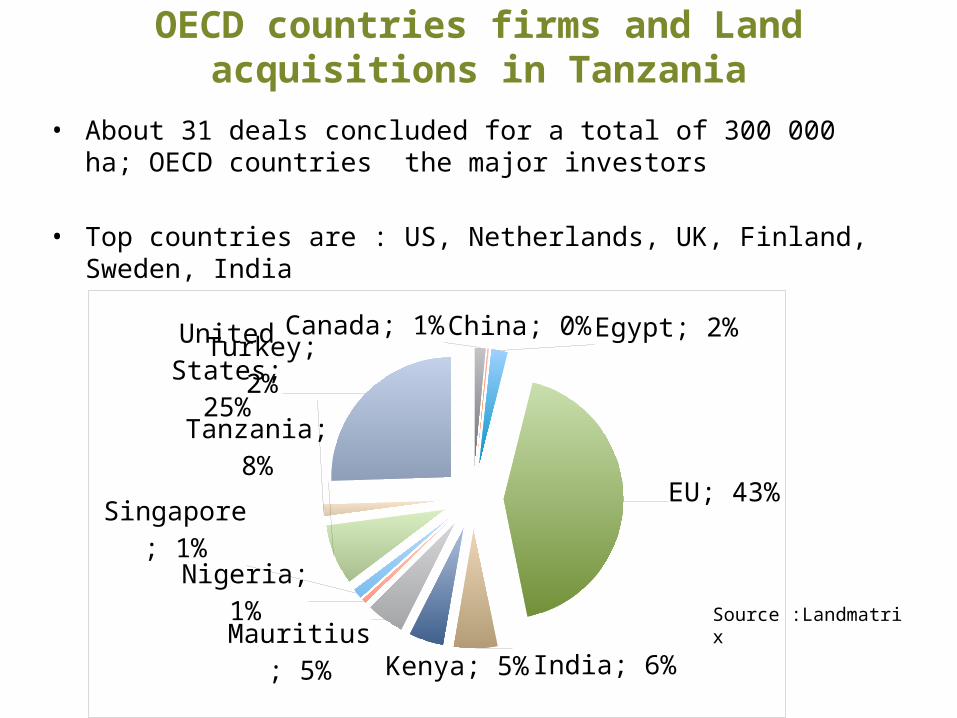
• About 31 deals concluded for a total of 300 000 ha; OECD countries the major investors
• Top countries are : US, Netherlands, UK, Finland, Sweden, India
OECD countries firms and Land acquisitions in Tanzania
Canada; 1% China; 0% Egypt; 2%
EU; 43%
India; 6%Kenya; 5%Mauritius;
5%
Nigeria; 1%
Singa-pore; 1%
Tanzania; 8%
Turkey; 2%
United States;
25%
Source :Landmatrix

What is produced?
Biofuels, 56%
Food crops, 24%
Other, 20%
• Food crops : Maize, Rice, Barley, horticulture• Biofuel : Jatropha, Oil palm, Sugar cane• Other : Carbon sequestration
Source :Landmatrix

What are links with OECD policies
• EU and US biofuel policies?
• Implication of land acquisition for local economy and food security?
• OECD/EU code for responsible investment in Agricultures

What are the impacts to:
• Livelihoods of local communities
• Food security
• Agriculture production

Q&A
ECDPM Page 81

Thank youwww.ecdpm.org
www.slideshare.net/ecdpm
Page 82