PAYS Team - EPISCenterepiscenter.psu.edu/sites/default/files/outreach/PAYS-Webinar-Five... · Crime...
40
-
Upload
trankhuong -
Category
Documents
-
view
216 -
download
0
Transcript of PAYS Team - EPISCenterepiscenter.psu.edu/sites/default/files/outreach/PAYS-Webinar-Five... · Crime...

PAYS Team
Sebrina DoyleResearch Assistant
EPISCenter
Sandy HinkleCommunities That
Care Consultant
EPISCenter
Geoff KolchinProgram Analyst
PA Commission on
Crime and Delinquency
Phyllis LawCommunities That
Care Consultant
EPISCenter
Tania LuciowCommunications Manager
EPISCenter

Upcoming PAYS Webinar Schedule
• October 31st PAYS for Grant Writing #1: Needs Assessments
• November 7th PAYS for Grant Writing #2: Program Selection
• December 5th PAYS Q&A

Topics Covered Today
• 11-11:30 am
PAYS State Report Review: Understanding the State Sample : Bach Harrison Norm
State Report Overview: Risk & Protective Factors Above and Below the Bach Harrison Norm : Other Great Findings
Moving Forward: Areas to focus on in the future
• 11:30-12:00 pm
Questions and Answers
o Submit questions via the ‘Q & A’ pod in Adobe Connect

PAYS State Report Review

PAYS
State
Report
www.PAYS.pa.gov

How a State Wide Sample is
Determined• How are school districts selected
• What do we look for in a sample group
• Incentives for participation
• Of the 264 school – grade combinations selected for the sample frame this year:
167 participated for the State Sample = over 64%
7

Demographics of 2013 State Sample
8
26%
30%
23%
20%6th Grade
8th Grade
10th Grade
12th Grade
2013 PAYS State Sample Participants, by Grade
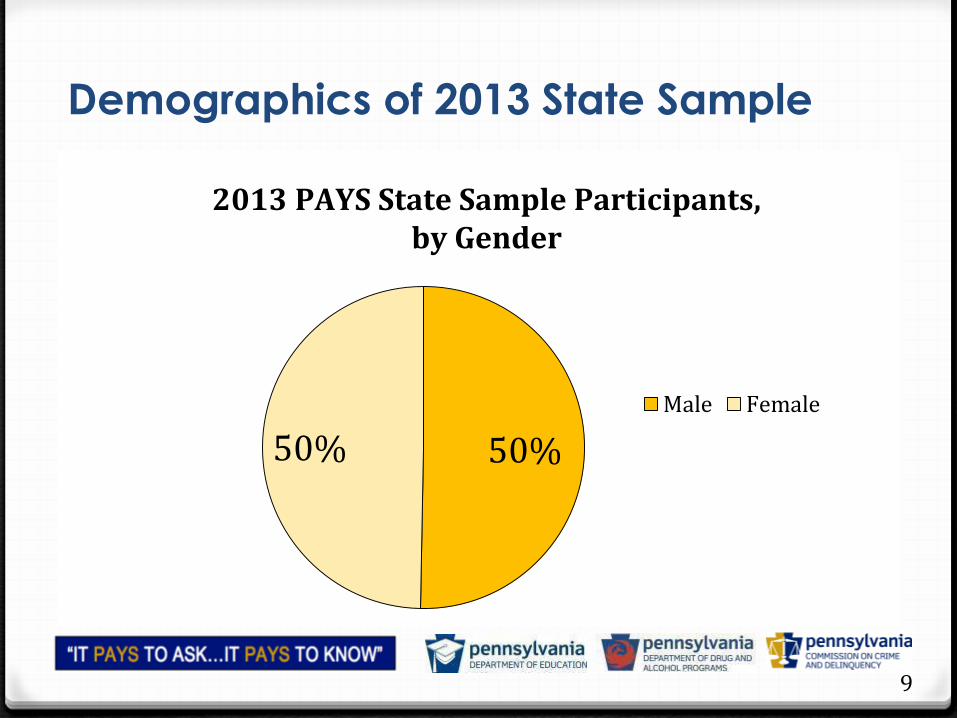
Demographics of 2013 State Sample
9
50%50%
Male Female
2013 PAYS State Sample Participants,by Gender

Demographics of 2013 State Sample
10
6.20%
3.30%2.80%
0.60%
76.80%
10.30%African American
Asian
Hispanic
American Indian
White
Multi-racial
2013 PAYS State Sample Participants, by Race/Ethnicity(Note: Final data presented in this report was weighted)

Comparing to the Bach Harrison (BH)
Norm & How do I use it?
11
Arizona
Florida
Iowa
Louisiana
Montana
Nebraska
New York
Oklahoma
Pennsylvania
Utah
Washington
• A combined database from 11 statewide surveys administered during 2010 and 2011
• The resulting database contained 656,987 participants in grades 6, 8, 10, and 12

12
Example:

State Report Overview
Risk & Protective Factors Above and Below the Bach Harrison Norm :
Other Great Findings
13

Good News!
• PA has HIGHER Protective Factors than BH Norm:
Family Attachment (66.8 to 56.9)
Family Opportunities for Pro. Soc. Inv. (64.9-56.4)
Family Rewards for Pro. Soc. Inv. (55.1-53.2)
School Opportunities for Pro. Soc. Inv. (55.1-53.2)
School Rewards for Pro. Soc. Inv. (56.6-52.5)
Peer and Individual Belief in Moral Order(60.9-53.6)
14

More Good News!
• PA has much LOWER Risk Factors than the BH Norm:
Perceived Availability of Drugs (31.7 - 44.8)
Perceived Availability of Handguns (29.0 – 40.7)
Family History of Anti Social Behavior (36.2 – 46.7)
Rebelliousness (27.6 – 37.8)
Sensation Seeking (32.3 – 44.2)
Friends Use of Drugs (28.9 – 41.7)
Interaction with Anti Social Peers (25.8 – 42.6)
15
0
10
20
30
40
50
60
70
80
90
100
State2009
State2011
State2013
MTF2013
State2009
State2011
State2013
MTF2013
State2009
State2011
State2013
MTF2013
Alcohol (Lifetime Use) Alcohol (30-Day Use) Binge drinking
6th
8th
10th
12th
All
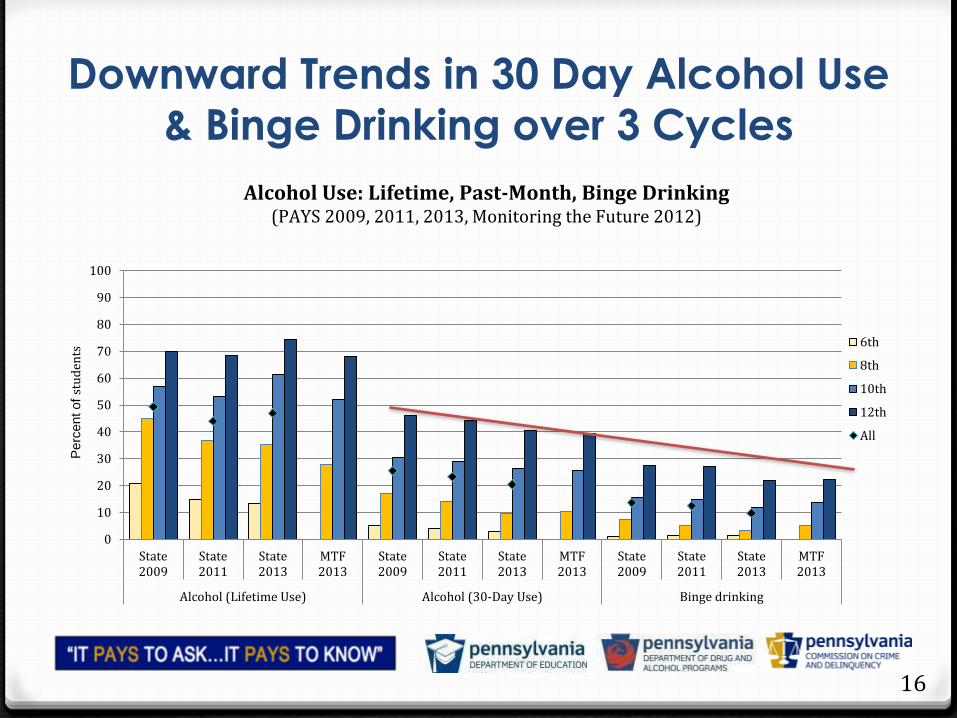
Alcohol Use: Lifetime, Past-Month, Binge Drinking(PAYS 2009, 2011, 2013, Monitoring the Future 2012)
Perc
ent of
stu
den
tsDownward Trends in 30 Day Alcohol Use
& Binge Drinking over 3 Cycles
16
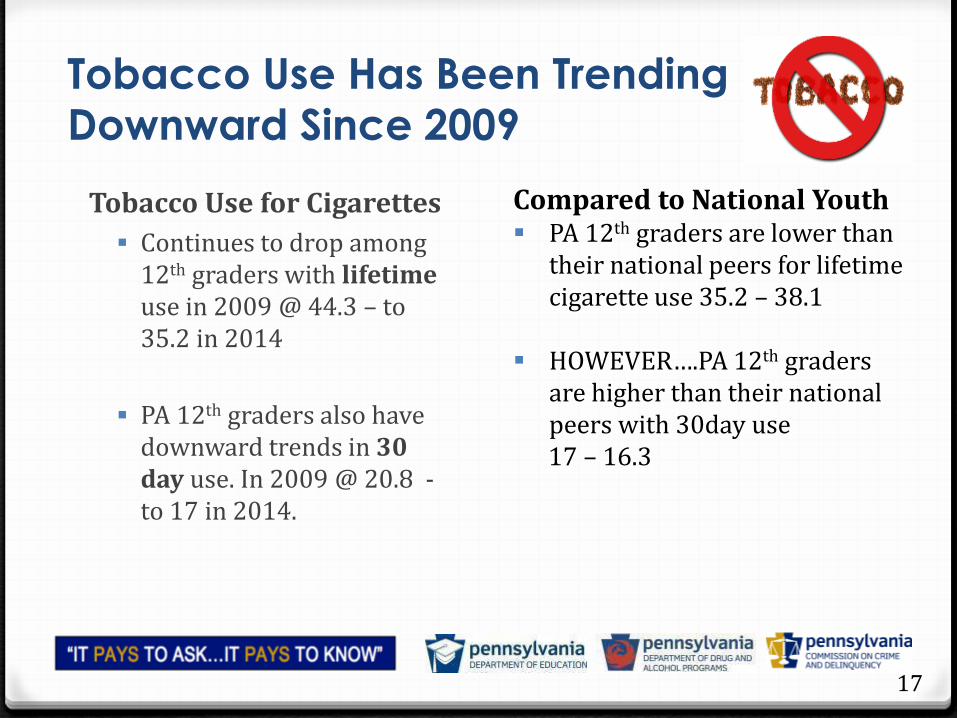
Tobacco Use Has Been Trending
Downward Since 2009
17
Tobacco Use for Cigarettes
Continues to drop among 12th graders with lifetime use in 2009 @ 44.3 – to 35.2 in 2014
PA 12th graders also have downward trends in 30 day use. In 2009 @ 20.8 -to 17 in 2014.
Compared to National Youth PA 12th graders are lower than
their national peers for lifetime cigarette use 35.2 – 38.1
HOWEVER….PA 12th graders are higher than their national peers with 30day use 17 – 16.3

Marijuana Use
18
0
10
20
30
40
50
60
70
80
90
100
State2009
State2011
State2013
MTF2013
State2009
State2011
State2013
MTF2013
Marijuana (Lifetime Use) Marijuana (30-Day Use)
6th
8th
10th
12th
All
Marijuana Use: Lifetime, Past-Month(PAYS 2009, 2011, 2013, Monitoring the Future 2012)
Per
cen
t o
f st
ud
ents

Community Domain: Perceived
Availability of Drugs
19
0
10
20
30
40
50
60
70
80
90
100
State2009
State2011
State2013
BHNorm
State2009
State2011
State2013
BHNorm
State2009
State2011
State2013
BHNorm
State2009
State2011
State2013
BHNorm
6th 8th 10th 12th
Pe
rce
nt
of
Stu
de
nts
at
Ris
k
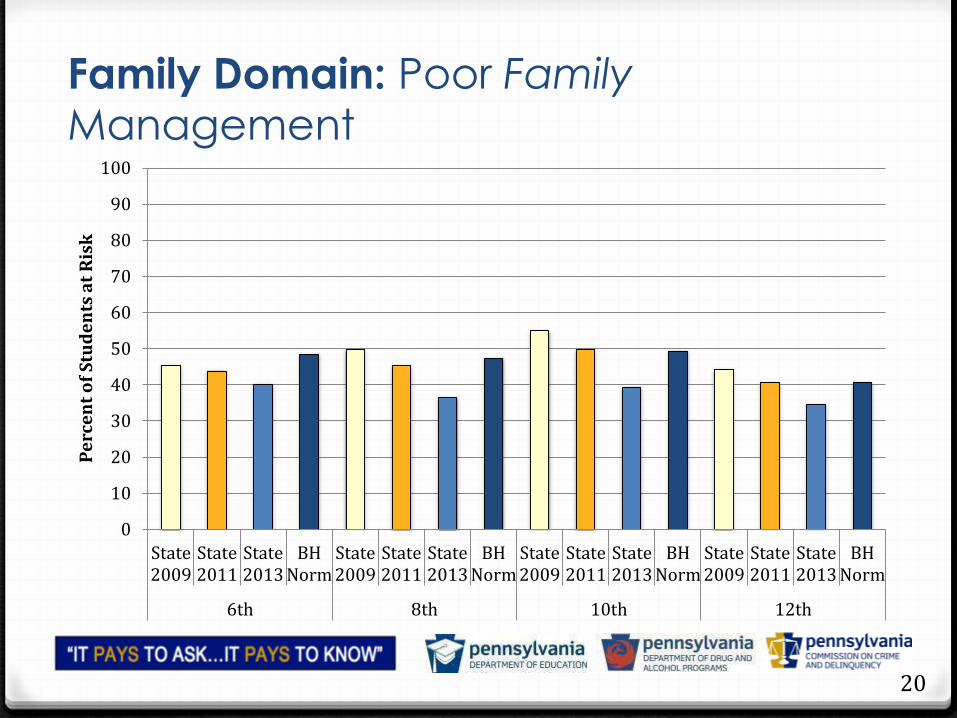
Family Domain: Poor Family
Management
20
0
10
20
30
40
50
60
70
80
90
100
State2009
State2011
State2013
BHNorm
State2009
State2011
State2013
BHNorm
State2009
State2011
State2013
BHNorm
State2009
State2011
State2013
BHNorm
6th 8th 10th 12th
Pe
rce
nt
of
Stu
de
nts
at
Ris
k
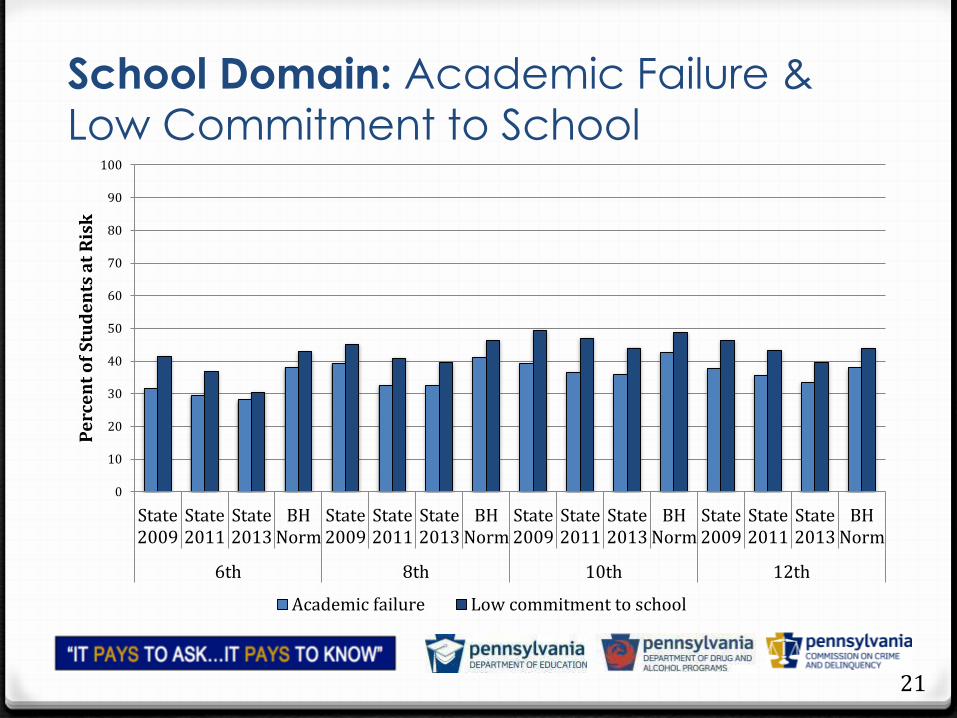
School Domain: Academic Failure &
Low Commitment to School
21
0
10
20
30
40
50
60
70
80
90
100
State2009
State2011
State2013
BHNorm
State2009
State2011
State2013
BHNorm
State2009
State2011
State2013
BHNorm
State2009
State2011
State2013
BHNorm
6th 8th 10th 12th
Pe
rce
nt
of
Stu
de
nts
at
Ris
k
Academic failure Low commitment to school
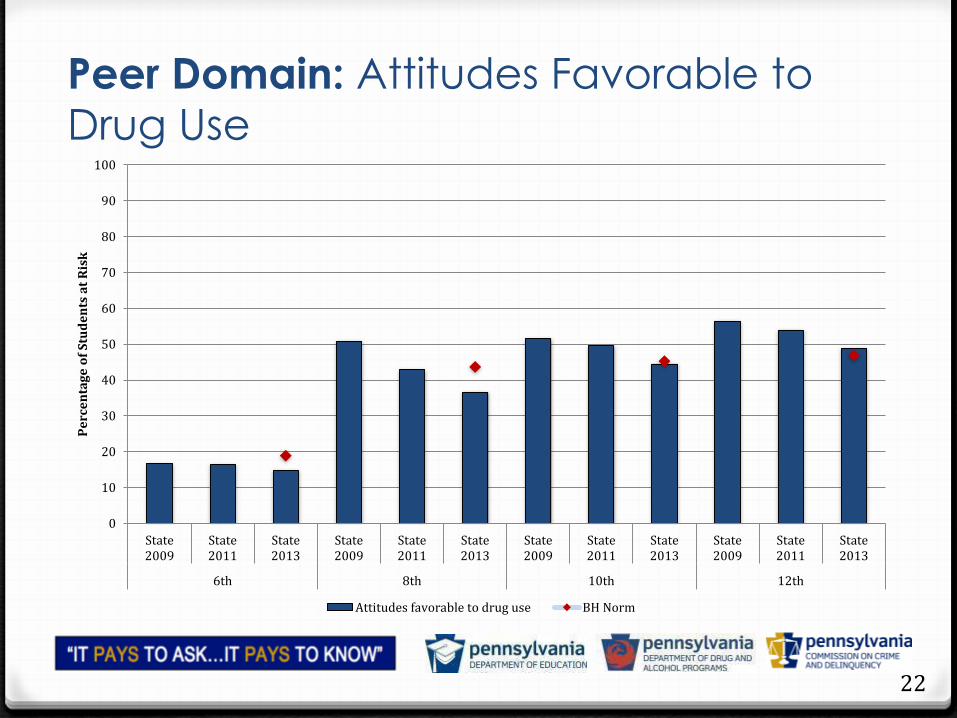
Peer Domain: Attitudes Favorable to
Drug Use
22
0
10
20
30
40
50
60
70
80
90
100
State2009
State2011
State2013
State2009
State2011
State2013
State2009
State2011
State2013
State2009
State2011
State2013
6th 8th 10th 12th
Pe
rce
nta
ge
of
Stu
de
nts
at
Ris
k
Attitudes favorable to drug use BH Norm
Moving Forward
Areas to focus on in the future
23

Exceeding the BH National Norm
• PA is HIGHER than the BH norm in the following two Risk Factors areas:
• Parental Attitudes Favorable to Drug Use (30.2 – 29.8
• Parental Attitudes Favorable to Antisocial Behaviors (40.0 –34.1)
24

Moving Forward: Risk Factor 3 Year
Trends Higher Than BH Norm
25
0
10
20
30
40
50
60
70
80
90
100
State2009
State2011
State2013
BHNorm
State2009
State2011
State2013
BHNorm
State2009
State2011
State2013
BHNorm
State2009
State2011
State2013
BHNorm
6th 8th 10th 12th
Parental attitudes favorable to drug use Parental attitudes favorable to antisocial behavior Depressive symptoms
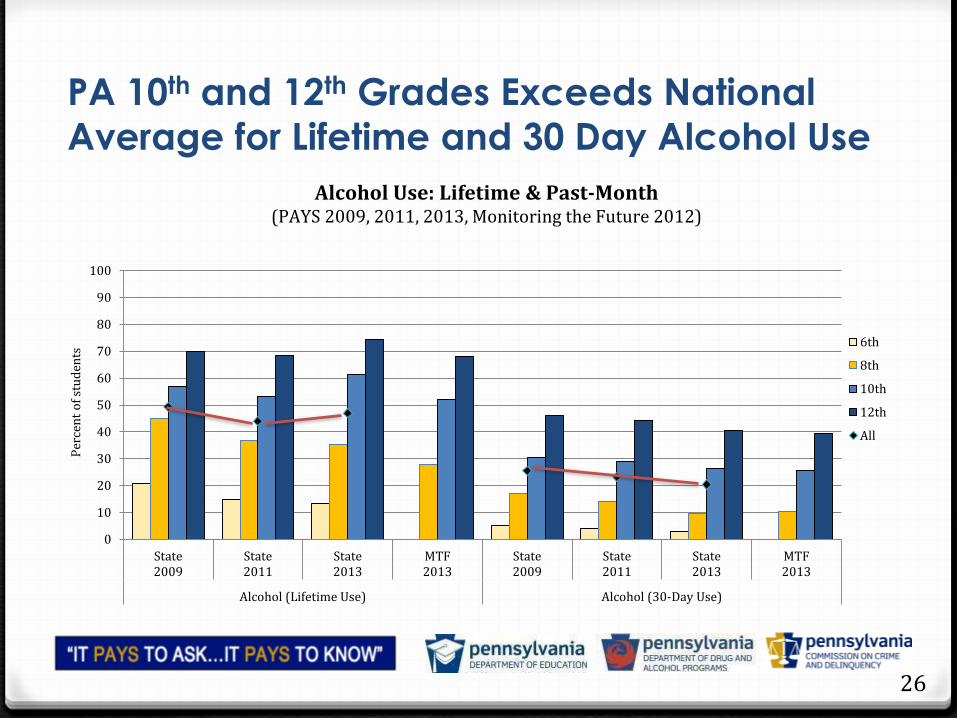
0
10
20
30
40
50
60
70
80
90
100
State2009
State2011
State2013
MTF2013
State2009
State2011
State2013
MTF2013
Alcohol (Lifetime Use) Alcohol (30-Day Use)
6th
8th
10th
12th
All
Alcohol Use: Lifetime & Past-Month(PAYS 2009, 2011, 2013, Monitoring the Future 2012)
Per
cen
t o
f st
ud
ents
PA 10th and 12th Grades Exceeds National
Average for Lifetime and 30 Day Alcohol Use
26

Prescription Drug Use Increases w/ Age
0
10
20
30
40
50
60
70
80
90
100
State2009
State2011
State2013
MTF2013
State2009
State2011
State2013
MTF2013
State2009
State2011
State2013
MTF2013
State2009
State2011
State2013
MTF2013
PEDs & Steroids Narcotic prescription drugs Prescription tranquilizers Prescription stimulants
6th
8th
10th
12th
All
Prescription Drug Use: Lifetime(PAYS 2009, 2011, 2013, Monitoring the Future 2012)
Per
cen
t o
f st
ud
ents

Aggressive Behaviors:
More Prominent in 6th and 8th Grades
28
0
10
20
30
40
50
60
70
80
90
100
Bullied at school (% answering "YES!" or "yes")
6th
8th
10th
12th
All
Bullying and Internet Safety:(PAYS 2009, 2011, 2013)
Pe
rce
nt
of
stu
de
nts

Aggressive Behaviors: More Prominent in 6th and 8th Grades
29
0
10
20
30
40
50
60
70
80
90
100
State2009
State2011
State2013
Threatened at school
6th
8th
10th
12th
All
Violence and Drugs on School Property:(PAYS 2009, 2011, 2013)
Pe
rce
nt
of
stu
de
nts

Risk Taking Behaviors
30
0
10
20
30
40
50
60
70
80
90
100
State2009
State2011
State2013
State2009
State2011
State2013
State2009
State2011
State2013
State2009
State2011
State2013
Texted while driving Passenger with textingdriver
Driving after alcohol Driving after marijuana
6th
8th
10th
12th
All
Dangerous Driving Behavior:(PAYS 2009, 2011, 2013)
Pe
rce
nt
of
stu
de
nts
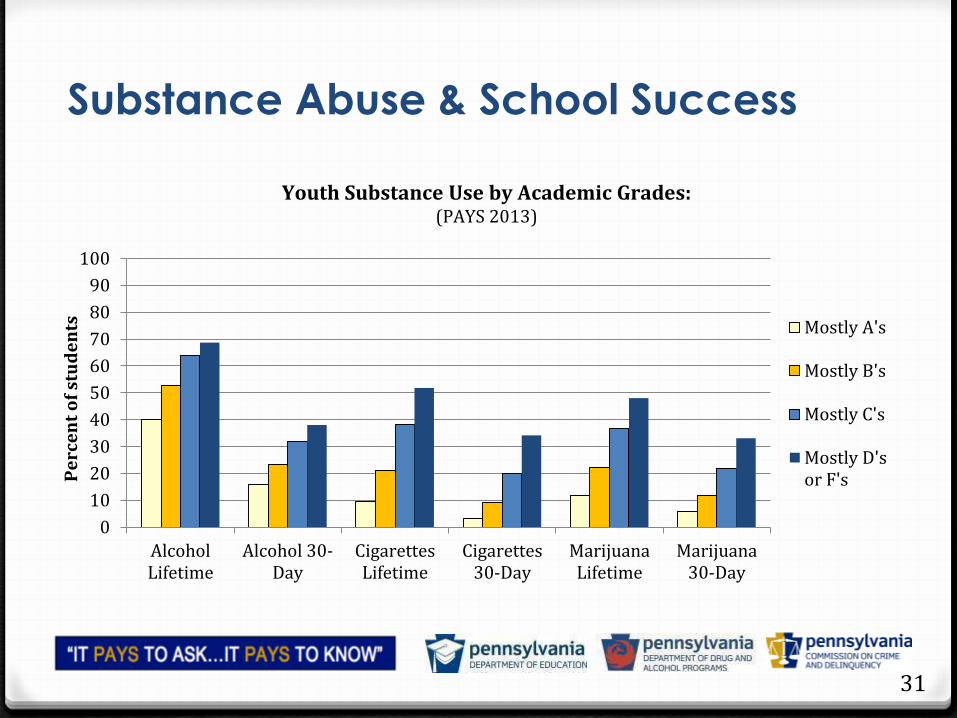
Substance Abuse & School Success
31
0
10
20
30
40
50
60
70
80
90
100
AlcoholLifetime
Alcohol 30-Day
CigarettesLifetime
Cigarettes30-Day
MarijuanaLifetime
Marijuana30-Day
Mostly A's
Mostly B's
Mostly C's
Mostly D'sor F's
Youth Substance Use by Academic Grades:(PAYS 2013)
Pe
rce
nt
of
stu
de
nts

Depression
32
0
10
20
30
40
50
60
70
80
90
100
State2009
State2011
State2013
State2009
State2011
State2013
State2009
State2011
State2013
State2009
State2011
State2013
Felt depressed or sad MOSTdays in the past 12 months
Sometimes I think that life isnot worth it
At times I think I am no good atall
All in all, I am inclined to thinkthat I am a failure
6th
8th
10th
12th
All
Symptoms of Depression:(PAYS 2009, 2011, 2013)
Pe
rce
nt
of
stu
de
nts
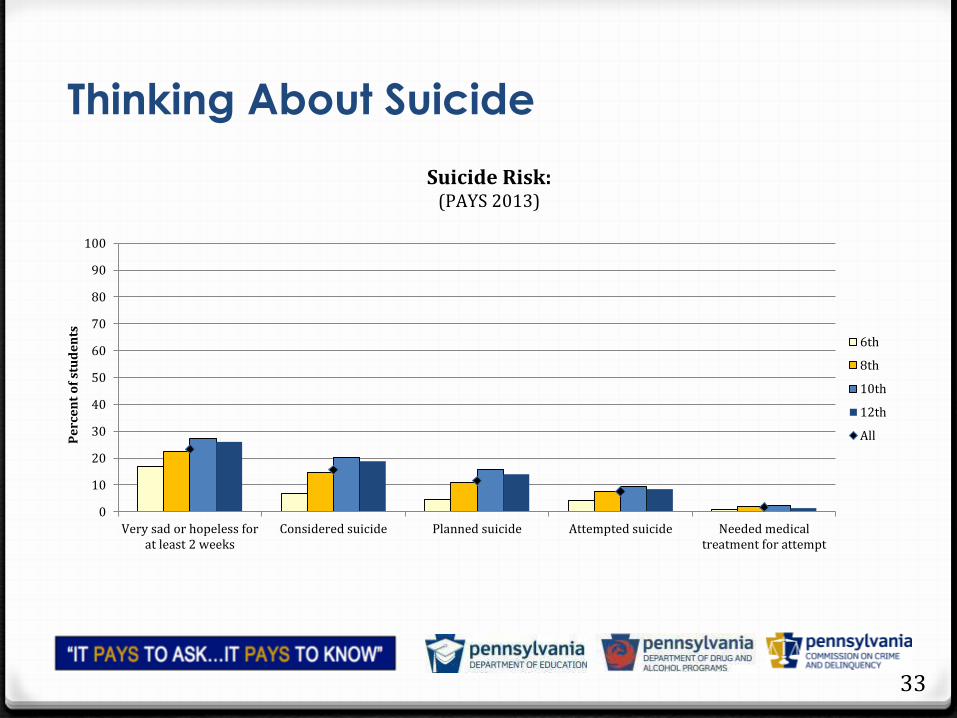
Thinking About Suicide
33
0
10
20
30
40
50
60
70
80
90
100
Very sad or hopeless forat least 2 weeks
Considered suicide Planned suicide Attempted suicide Needed medicaltreatment for attempt
6th
8th
10th
12th
All
Suicide Risk:(PAYS 2013)
Pe
rce
nt
of
stu
de
nts

Depression Linked to Higher Substance
Use
34
0
10
20
30
40
50
60
70
80
90
100
Alcohol Lifetime Alcohol 30-Day Cigarettes Lifetime Cigarettes 30-Day Marijuana Lifetime Marijuana 30-Day
No/Low Depressive Symptoms Moderate Depressive Symptoms High Depressive Symptoms
Youth Substance Use by Depressive Symptoms(PAYS 2013)
Pe
rce
nt
of
stu
de
nts

Parents Play a VERY Important Role in
Substance Use
35
0
10
20
30
40
50
60
70
80
90
100
Used Alcohol in Lifetime Used Alcohol in Past Month
Pe
rce
nt
of
stu
de
nts
Youth Alcohol Use by Perceived Parental Rules: (PAYS 2013)
Students who reported use within the substance category in relation to responding to the statement, "My family has clear rules about alcohol and drug use."
NO! or no
YES or Yes
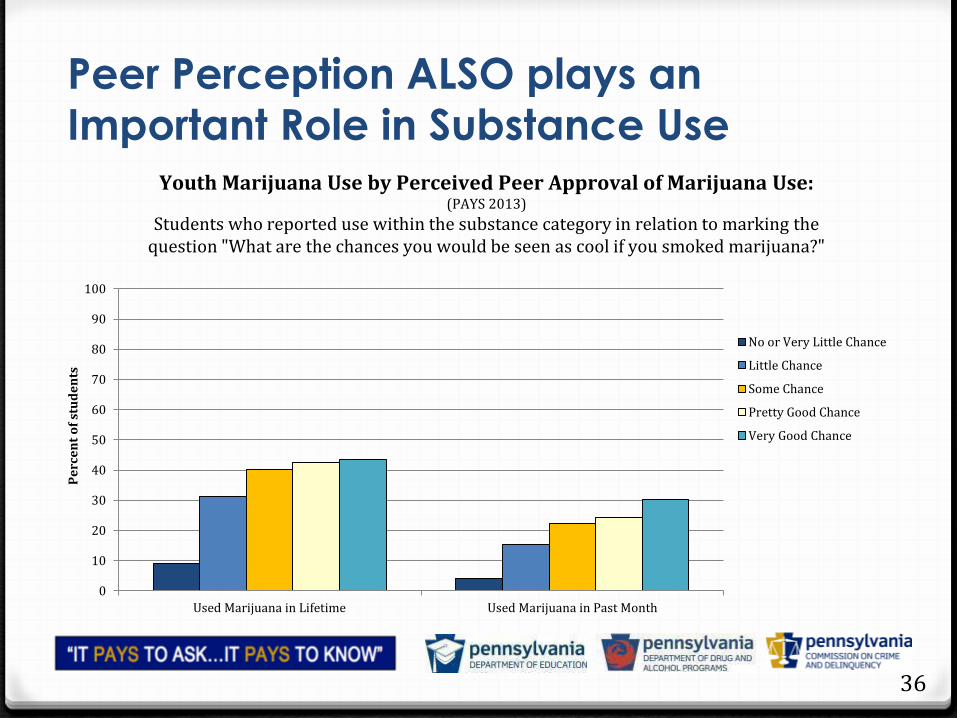
Peer Perception ALSO plays an
Important Role in Substance Use
36
0
10
20
30
40
50
60
70
80
90
100
Used Marijuana in Lifetime Used Marijuana in Past Month
No or Very Little Chance
Little Chance
Some Chance
Pretty Good Chance
Very Good Chance
Youth Marijuana Use by Perceived Peer Approval of Marijuana Use:(PAYS 2013)
Students who reported use within the substance category in relation to marking the question "What are the chances you would be seen as cool if you smoked marijuana?"
Pe
rce
nt
of
stu
de
nts

In Conclusion
• Prevention efforts - focusing on Risk and Protective Factors - across the state are making a difference
• Important issues to address in the future:
underage drinking and other drug use,
bullying,
peer violence,
depression and
anxiety among our youth.
• Continued need for unified collaboration across schools, agencies, and community coalitions
37

Let’s Answer
Your Questions

Upcoming PAYS Webinar Schedule
• October 31st PAYS for Grant Writing #1: Needs Assessments
• November 7th PAYS for Grant Writing #2: Program Selection
• December 5th PAYS Q&A

Thank you!• Next webinar:
• October 31st PAYS for Grant Writing #1: Needs Assessments
• Don’t forget to complete the evaluation of this webinar (available in “web links” pod)