Paying Health Care Providers for Performance: Evidence from Rwanda Paul Gertler UC Berkeley January...
46
Paying Health Care Providers for Performance: Evidence from Rwanda Paul Gertler UC Berkeley January 2009
-
Upload
philomena-butler -
Category
Documents
-
view
215 -
download
0
Transcript of Paying Health Care Providers for Performance: Evidence from Rwanda Paul Gertler UC Berkeley January...

Paying Health Care Providers for Performance: Evidence from Rwanda
Paul Gertler UC Berkeley
January 2009

Research Team Collaboration
Agnes Binagwaho, Rwanda Rwanda MOH Paulin Basinga, National University of Rwanda Jeanine Condo, National University of Rwanda Damien de Walque, World Bank Paul Gertler, UC Berkeley Agnes Soucat, World Bank Jennifer Sturdy, World Bank Christel Vermeersch, World Bank

Overview Background/Motivation Rwanda Program Description Evaluation Design and Methodology Baseline Descriptive Statistics Impact of PBF Next Steps

Context: Developing World Africa
Very poor health status Weak health care systems Brain drain – doctors & nurses leaving Massive AID could be wasted
World Wide (WDR 2004) Low Quality of Care Training/technology have had small effect on Quality Provider absenteeism high & effort low
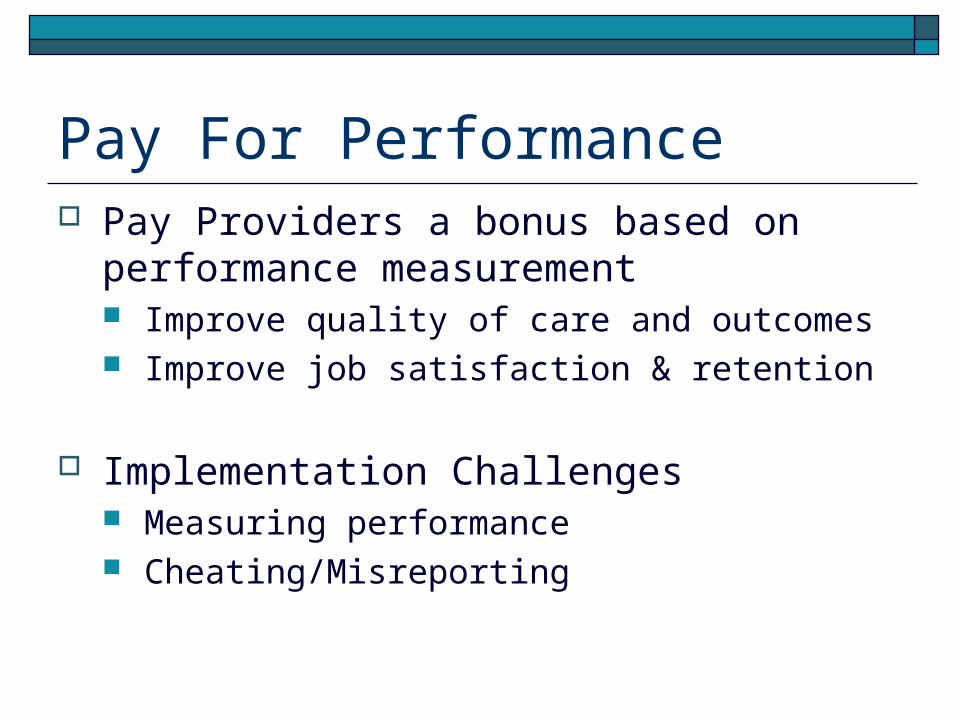
Pay For Performance Pay Providers a bonus based on
performance measurement Improve quality of care and outcomes Improve job satisfaction & retention
Implementation Challenges Measuring performance Cheating/Misreporting

Rwanda: Central African Country 9 million people Genocide in early 1990s GNP per capita: 250 US$ Weak Health Care Infrastructure
36 Hospitals, 369 health centers Doctors: 1/50,000 inhabitants Nurses: 1/3,900 inhabitants; 17% of nurses in rural areas
Poor health status, but getting better
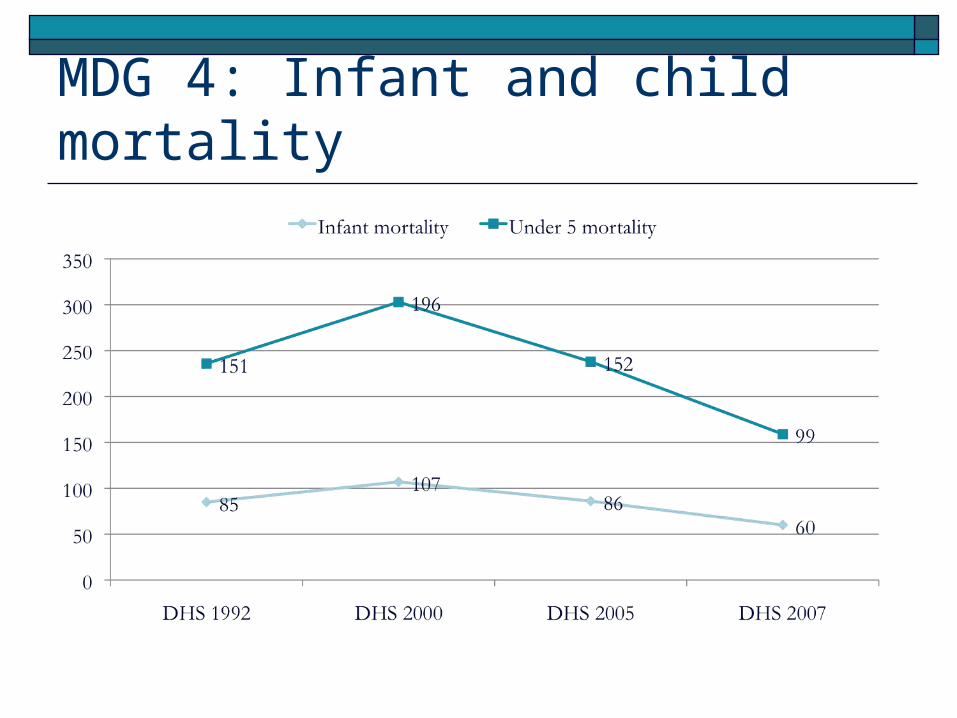
MDG 4: Infant and child mortality

Performance-based Financing (PBF) Local Initiative Objectives
Increase quantity & quality of health services provided Increase health worker motivation
Financial incentives to providers to see more patients and provide higher quality of care Increased resources Financial incentives
Operates through contracts between Government Health facilities providing services

Quarterly Payment to Facility i in period t
Pj = payment per unit of each PBF service j
Uijt = number of patients using service j in facility i in period t
Qit = facility i’s quality in period t


PBF Facility Quality Score
Where Skit = facility i’s Quality index of Service k
Indicator types: Structural: Availability of medical equipment/drugs
needed to deliver adequate medical care Process: Clinical content of care (CPGs)
€
1≥ Sikt ≥ 0

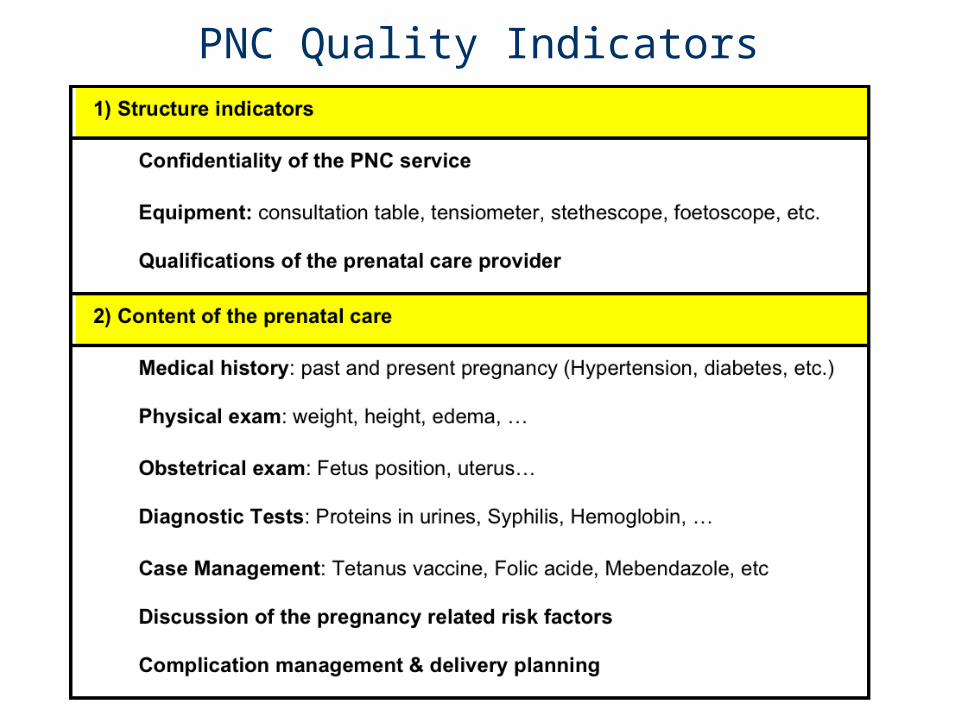
PNC Quality Indicators

Monitoring Facility Reporting District Comite de Pilotage
Approves quarterly payment Based on facility reports & independent audits
Random utilization audit (once quarterly) One focal point per administrative district
Random quality audits (once quarterly) District supervisors based in District Hospital
Interview random sample of patients Identify phantom patients MSH study – less than 3-5% phantom patients
Evaluation Questions: Did PBF…
Increase the quantity of contracted health services delivered?
Improve the quality of contracted health services provided?
Improve child health status?
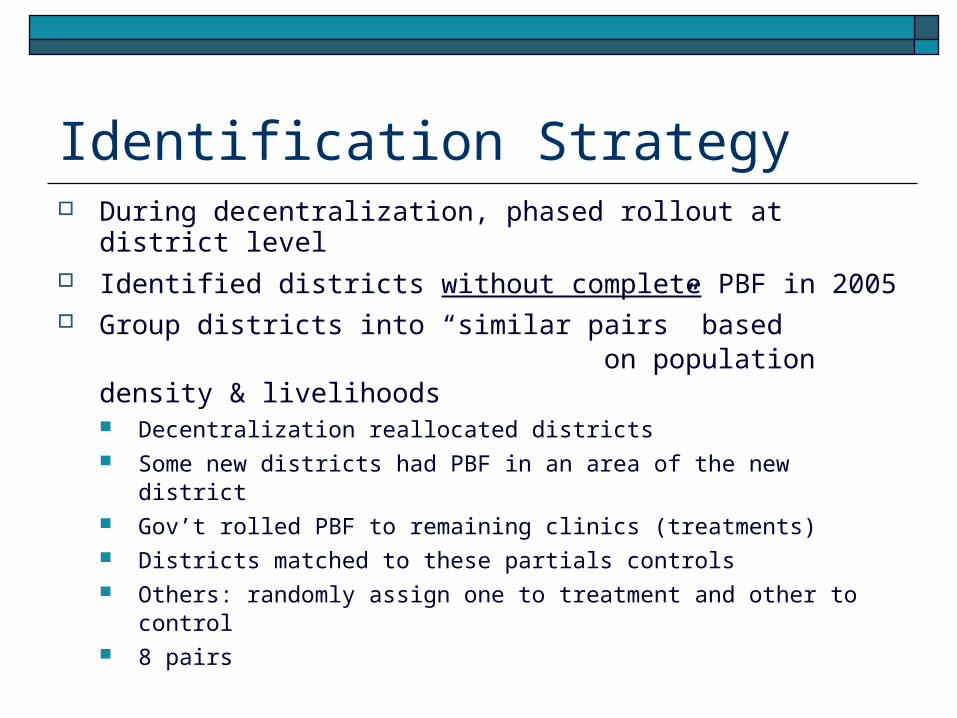
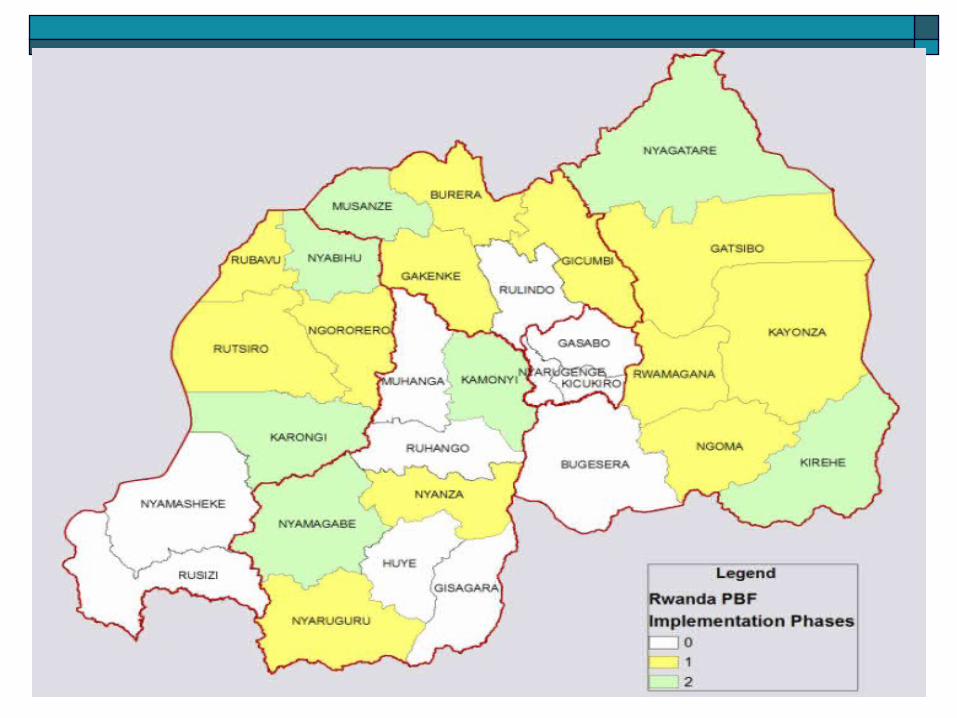
Identification Strategy During decentralization, phased rollout at district level Identified districts without complete PBF in 2005 Group districts into “similar pairs” based
on population density & livelihoods Decentralization reallocated districts Some new districts had PBF in an area of the new district Gov’t rolled PBF to remaining clinics (treatments) Districts matched to these partials controls Others: randomly assign one to treatment and other to control 8 pairs

Isolating the incentive effect PBF
Performance incentives Additional resources
Compensate control facilities with equal resources Average of what treatments receive Not linked to performance Money allocated by the health center management
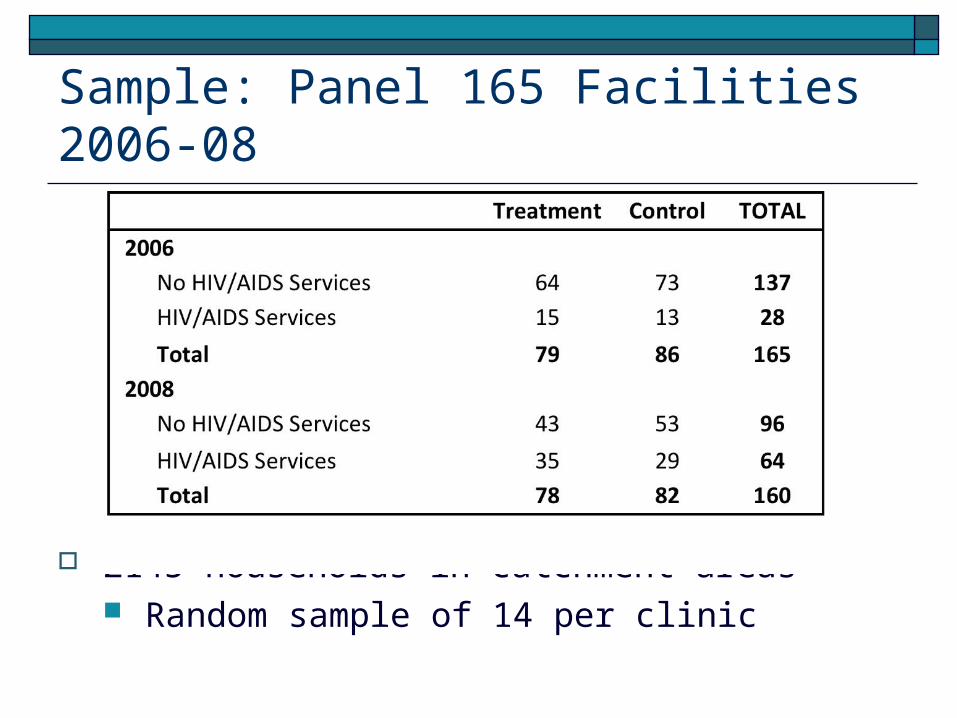
Sample: Panel 165 Facilities 2006-08
2145 households in catchment areas Random sample of 14 per clinic

Health Facility Data Financials, Human resources, Equipment, Meds Provider interview for competency (vignette) 8-10 patient exit Interviews for prenatal process quality HIMS - utilization
General Health Household survey Utilization & Health outcomes HIV testing, sexual behavior
HIV+ Positive Household Survey HIV testing, sexual behavior ART, CD4, adherance
Survey Content

Did we isolate incentives effect? Did we balance T/C groups at baseline? Is PBF associated with increases in
Maternal utilization: Facility Delivery, Prenatal Care Child utilization: Preventive care, immunization Process quality of prenatal care Provider prenatal care competency Child health: height, weight, anemia, morbidity
Did HIV PBF had spillover effects? Did HIV PBF improve access & outcomes? Did HIV PBF affect earnings & risk behavior?
Research Outline

23

Log Expenditures
Randomization balanced baseline Follow-up balanced, so difference in follow-up
outcomes due to incentives not resources
Year Treatment Control Difference P-Value15.812 15.612 0.200(1.042) (1.007) 0.241
16.906 16.989 -0.083(0.71) (1.08) (0.14)
2006 0.418
2008 0.568

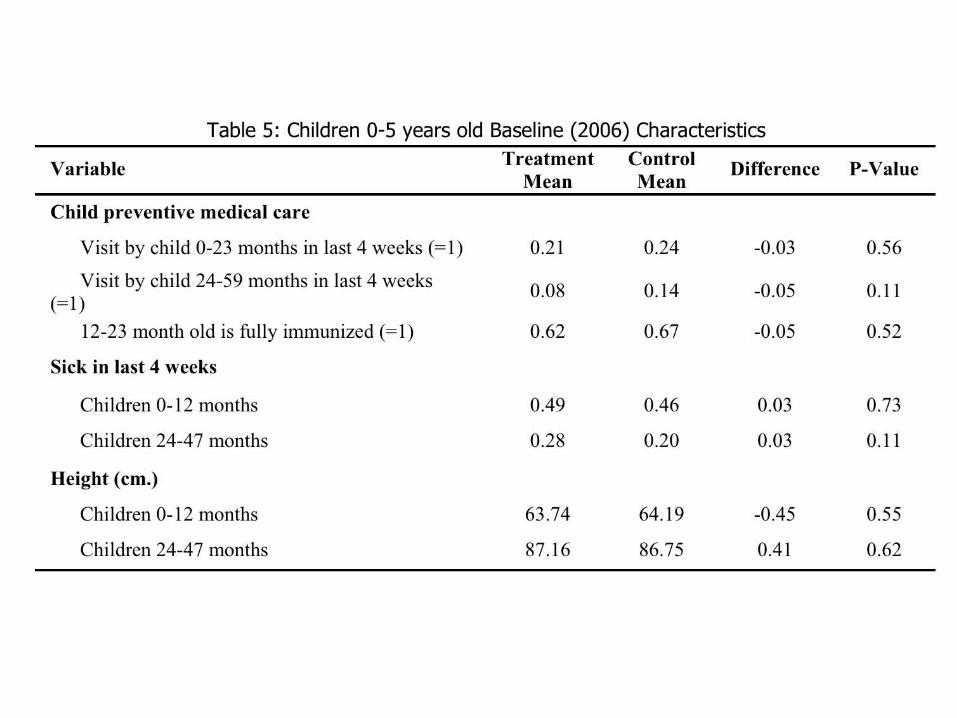
Baseline Balance Utilization (PBF) Structural Quality
Availability of staff, equipment & drugs needed to deliver care (PBF)
Little room to improve Process Quality
Competency (Vignettes) Process Quality (Patient exit survey)

Baseline Expenditures & Staffing


Impact of PBF: Statistical methods Have balance at baseline on all key outcomes Use difference in differences analysis
Not a pure randomized experiment Clustered at district-year level Facility Fixed Effects Year dummy Controls: age, parity, education, household
size, health insurance, land, value of assets


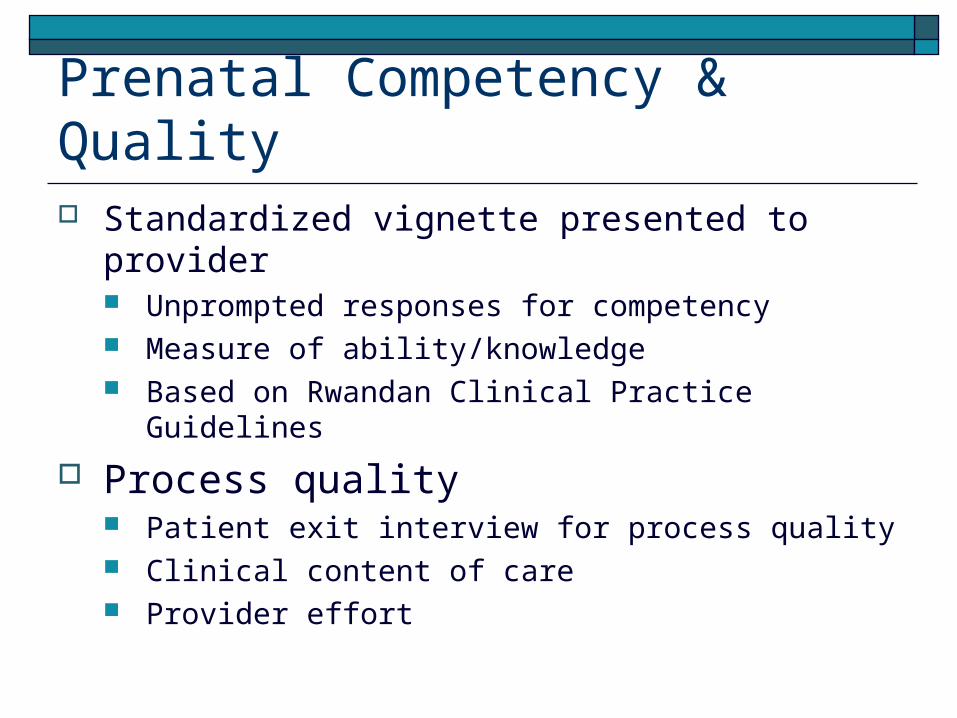
Prenatal Competency & Quality Standardized vignette presented to provider
Unprompted responses for competency Measure of ability/knowledge Based on Rwandan Clinical Practice Guidelines
Process quality Patient exit interview for process quality Clinical content of care Provider effort
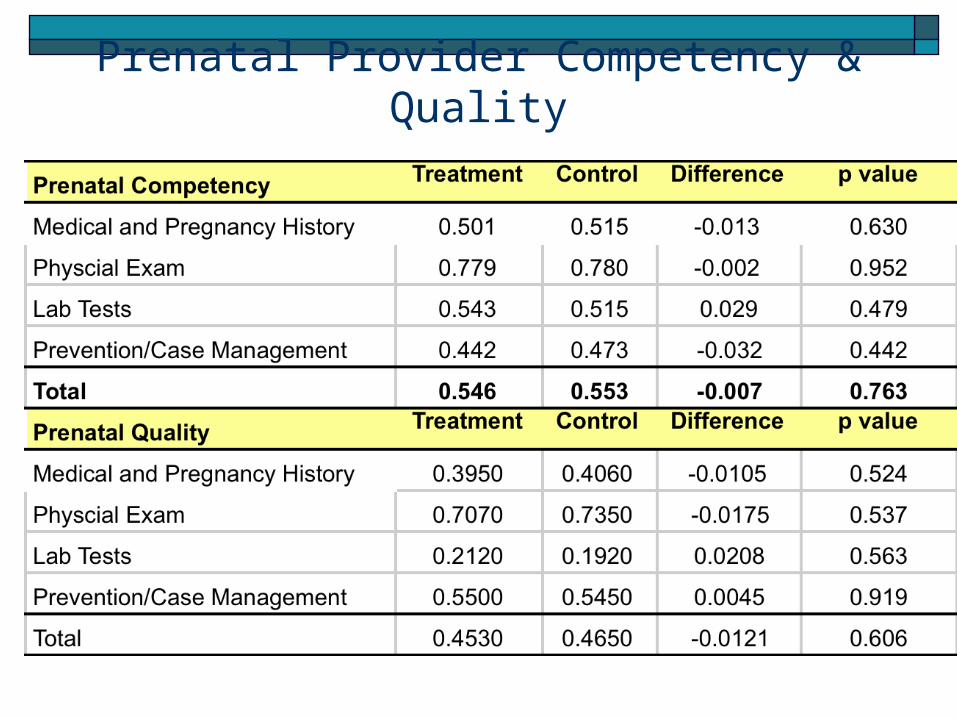
Prenatal Provider Competency & Quality

Baseline Prenatal Provider Competency & Quality

Quality Conceptual Framework
What They Know (Ability/Technology)
What They Do: (Quality)
Production Possibility Frontier

Goal: Use Pay for Performance to Close Productivity Gap
Ability/Technology
What They Do
PPF
Productivity Gap Conditional on Ability
Actual Performance
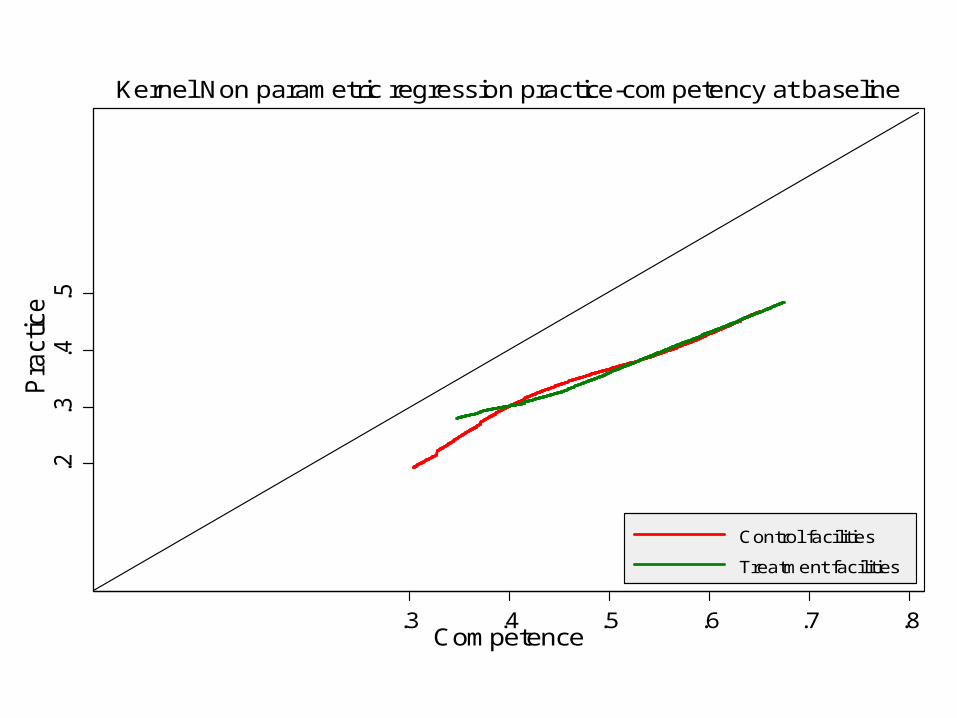
.2.3
.4.5
Pra
ctic
e
.3 .4 .5 .6 .7 .8Competence
Control facilities
Treatment facilities
Kernel Non parametric regression practice-competency at baseline

.2.3
.4.5
Pra
ctice
.3 .4 .5 .6 .7Competence
Control facilities
Treatment facilities
Kernel Non parametric regression practice-competency at follow up

Impact of PBF on Prenatal Care Quality
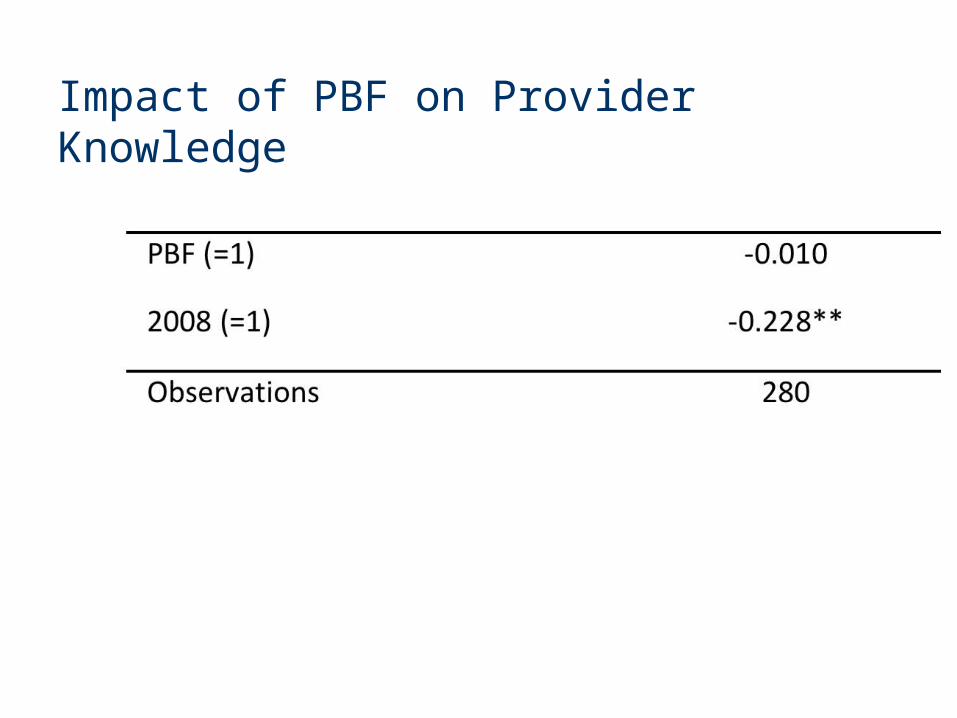
Impact of PBF on Provider Knowledge


Spillover Effects of HIV/AIDS PBF on Child Preventive Care

Impact of PBF on Child Health (z-scores)

Results Summary Balanced at baseline Expenditures same, so isolate incentives Impact on utilization
Delivery & Child prevention, but not prenatal Impact on prenatal quality
Bigger for better doctors Reduced child morbidity & Taller children HIV/AIDS Spillover effects

Policy