Pay Inequality in Turkey in the Neo-Liberal Era: 1980-2001
41
Pay Inequality in Turkey in the Neo-Liberal Era: 1980-2001 Adem Y. Elveren Department of Economics The University of Utah [email protected] James K. Galbraith Lyndon B. Johnson School of Public Affairs The University of Texas at Austin [email protected] University of Texas Inequality Project Working Paper No. 49 April 21, 2008 Abstract This paper examines pay inequality in Turkish manufacturing annually from 1980 to 2001. Using the between-group component of Theil’s T statistic, we decompose the evolution of inequality by geographic region, province, sub-sector and by East-West distinction both for private and public sectors. The decompositions show that while inequality remains approximately the same between regions, it increases in the late 1980s in the private sector between provinces, between East and West, and as well as between manufacturing sub-sectors.
Transcript of Pay Inequality in Turkey in the Neo-Liberal Era: 1980-2001

Pay Inequality in Turkey in the Neo-Liberal Era: 1980-2001
Adem Y. Elveren
Department of Economics
The University of Utah
James K. Galbraith
Lyndon B. Johnson School of Public Affairs
The University of Texas at Austin
University of Texas Inequality Project
Working Paper No. 49
April 21, 2008
Abstract
This paper examines pay inequality in Turkish manufacturing annually from 1980
to 2001. Using the between-group component of Theil’s T statistic, we decompose the
evolution of inequality by geographic region, province, sub-sector and by East-West
distinction both for private and public sectors. The decompositions show that while
inequality remains approximately the same between regions, it increases in the late 1980s
in the private sector between provinces, between East and West, and as well as between
manufacturing sub-sectors.

2
1. Introduction
This paper analyzes pay inequality in the manufacturing sector of Turkey between
1980 and 2001. By doing so, we attempt to sketch a general picture of Turkish income
distribution, for the dispersion of manufacturing pay has been shown to be a broadly
effective instrument for the movements of inequality writ large. The Turkish economy
can be associated with a persistently unequal income distribution and a true dichotomy
between the wealthier West and the poorer East. With the adoption of the neo-liberal
model in 1980, inequality rose substantially, particularly in the 1990s.
In international comparisons of income distribution, Turkey generally has a high
value when compared with other upper-middle income countries (World Bank 2000;
Gürsel et. al 2000). While inequality appears to have declined through the 1970’s, by the
1980’s this was no longer the case; by the 1990’s inequality had worsened. Cited causes
for this deterioration (WB 2000) include the negative trend of real wages, a change in tax
policies benefiting the rich, a failure of redistributive tax policy, high real interest rates,
unequal education (Köse and Güven, 2007; Duygan and Guner, 2006), and excessive
migration to urban areas due to both economic and political pressure.
This study makes two contributions to the literature on economic inequality in
Turkey. First, rather than dealing with micro-level data for a very limited number of
years, we focus on pay in the manufacturing sector so as to develop annual measures
between 1980 and 2001. Second, we exploit the decomposition properties of Theil’s T
statistic to provide a detailed picture of the evolution of pay inequality in the
manufacturing sector by sub-sectors, geographical regions, provinces, and the East-West
divide.
3
Following this section we present our methodology and data. The third section
provides a brief history of the Turkish economy. In section four, we review the literature
on income inequality in Turkey. A detailed analysis of payment inequality is provided in
section five. Finally, we summarize our findings in the conclusion.
2. Methodology and Data
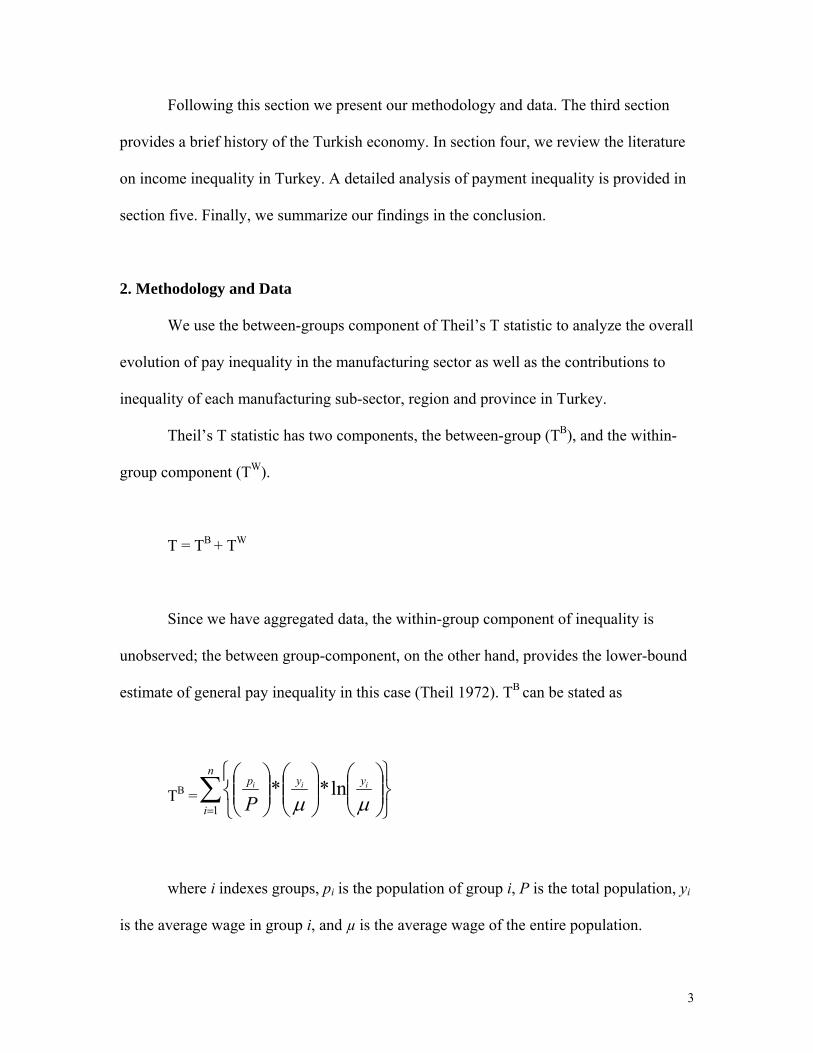
We use the between-groups component of Theil’s T statistic to analyze the overall
evolution of pay inequality in the manufacturing sector as well as the contributions to
inequality of each manufacturing sub-sector, region and province in Turkey.
Theil’s T statistic has two components, the between-group (TB), and the within-
group component (TW).
T = TB + TW
Since we have aggregated data, the within-group component of inequality is
unobserved; the between group-component, on the other hand, provides the lower-bound
estimate of general pay inequality in this case (Theil 1972). TB can be stated as
TB =∑= ⎭
⎬⎫
⎩⎨⎧
⎟⎟⎠
⎞⎜⎜⎝
⎛⎟⎟⎠
⎞⎜⎜⎝
⎛⎟⎟⎠
⎞⎜⎜⎝
⎛n
i
yyp iii
P1
ln**µµ
where i indexes groups, pi is the population of group i, P is the total population, yi
is the average wage in group i, and µ is the average wage of the entire population.

4
This measure provides a robust indicator of the trend of overall inequality and
demonstrates the evolution of the contribution to inequality of various groups for whom
data on average income and population weights are available (manufacturing sub-sectors,
regions, and provinces in this case).
We use the Annual Manufacturing Industry Statistics (AMIS) provided by the
Turkish Statistical Institute. The data is provided at a two-digit level and is disaggregated
according to provinces. It covers establishments that have more than 10 employees. In
order to prevent an arbitrary increase in the Theil’s T statistic due to an increase in the
number of provinces throughout the period (i.e. currently there are 81 provinces), we
recalculated the data based on 67 provinces. We also analyzed seven geographical
regions (namely Marmara, Aegean, Mediterranean, Central Anatolia, Black Sea,
Southeast Anatolia, and Eastern Anatolia), and the East-West distinction, so as to clarify
the geographic duality of the Turkish economy.
We made all calculations separately for the private sector, the public sector and
for both sectors together. All results are provided in the Appendix. Nominal values are
deflated according to the consumer price index, which does not affect the inequality
calculations but may be useful for some other purposes.
3. The Evolution of the Turkish Economy
The Turkish economy can be analyzed in two main periods. Before 1980 the
country adopted economic liberalism, étatism, and import substitution industrialization
policies, in that order. The post-1980 period is associated with an export-led regime in
conjunction with the emerging dominance of the neoliberal paradigm.

5
The economic policy implemented immediately after Turkey became a republic
was based on liberal principles, which emphasized the role of the private sector, with
agrarian production at its center. Self-sufficiency was the economic philosophy during
this early period (around 1920). Turkey, however, did not have the proper environment to
succeed with such a development policy. Several problems existed at this time, including
a shortage of national capital, underdeveloped financial institutions, inadequate policies
for introducing foreign capital, as well as a shortage of entrepreneurs and an
underdeveloped infrastructure (Öniş 1999a:457). The economic liberalism of the new
state did not last long, as the deteriorating world economic conditions at the end of the
1920s pushed the regime to revise its economic policy and to adopt rigid state-led
industrialization (étatism). The government established State Economic Enterprises
(SEEs) for industries needing large amounts of capital. SEEs were the focal point of
planned industrialization.
From the early 1960s to 1980, Turkey followed a strategy of industrialization
through import substitution policies, coupled with intensive government intervention
under the Development Plans (Aktan, 1997; Okyar, 1965, 1979; Hershlag, 1968; Keyder,
1987). However, the sub-period of 1960-1980 is distinguishable from the beginning of
étatism by the introduction of Five-Year Development Plans after 1963. The import-
substitution strategy of the 1960s and 1970s generated an economy highly dependent on
imports and foreign borrowing but with limited capacity to export (Öniş and Webb,
1999:325). Consequently, following a period of rapid economic growth and structural
transformation, the economy experienced severe disequilibria towards the end of that
period.

6
With the military coup of 1980 in Turkey came the onset of neo-liberal economic
policies. The military, by repressing the voice of civil society, was able to push through a
neo-liberal agenda without any resistance. The civilian successor of the military
government, which was elected in 1983, followed the same neoliberal model, as was
made evident by the government’s complete commitment to the IMF and World Bank’s
policies. The creation of a “peaceful” environment through anti-labor legislation and the
1982 constitution benefited corporations rather than labor by shutting down the country’s
largest labor union. As a result of such conditions, the main characteristic of the post-
1980 period in Turkey (i.e. the export-led regime) was massive shrinkage in real wages.
A stabilization program with the IMF was implemented to deal with a severe
balance of payment crisis in January 1980. The crisis, according to the consensus view,
reflects the limits of development policies that are based on import substitution and was
also a result of some strategic policy errors. The package consisted not only of internal
but also of external liberalization recommendations. In essence, the policy package put
into effect in 1980 and reinforced in the following years was more than just a
stabilization and adjustment package; it also marked a shift in development strategy from
inward to outward orientation. Removing price controls and subsidies, reducing the role
of the public sector in commerce, emphasizing growth in the private sector, stimulating
private investments and savings, liberalizing foreign trade, reducing tariffs, easing capital
transfer exchange controls, privatizing the Central Bank and reforming the taxation
system were elements of the new economic philosophy in this era.
The reform process started with liberalization of the foreign trade regime and the
financial sector and culminated in the liberalization of the capital account during the

7
latter half of 1989. This last action changed the whole pattern of the policy-making
environment radically. More specifically, Turkey liberalized its foreign trade regime,
removed price ceilings on goods and services and other “distortions” in product markets,
and deregulated the financial sector. The initial outcome of the reform process was
promising and was accepted as an impressive development by the domestic authorities
and international financial institutions (Ekinci, 1990; Akyüz and Boratav, 2003).
Despite these movements toward a more open market, the degree of privatization
remained limited. Toward the end of the decade, the export-led regime -- powered by
suppressed wages, depreciation of domestic currency, and extremely generous export
subsidies -- reached its economic and political limits (Boratav and Yeldan 2006). Public
sector deficits and inflation had come back with full force. The policy response was to
liberalize fully the capital account in 1989. While macroeconomic instability and political
uncertainty prevailed, the decision to liberalize capital accounts was ill-timed (Rodrik,
1990; Cizre and Yeldan, 2002; Alper and Öniş, 2002).
After the capital account liberalization, disinflationary efforts --based on monetary
tightening and real appreciation -- became much more pronounced. However, the
government did not take corresponding measures on the fiscal side. As a result of the
unsustainable nature of fiscal policy and the external deficit, the economy witnessed a
major crisis in early 1994. In response, the government launched a broad stabilization and
reform program focusing on fiscal adjustments. It also provided for a range of public
sector reforms, notably divestiture of the state-owned enterprises. With the EU Customs
Union Agreement in 1995 the import liberalization that started in 1984 was carried up to
a higher stage (Elveren and Kar 2008).
8
In July 1998, under the guidance of the IMF, the Turkish government started to
implement another disinflation program, which achieved some improvements regarding
the inflation rate and fiscal imbalances. However, the program could not relieve the
pressures on interest rates. The fiscal balance of the public sector was further harmed by
the Russian crisis in 1998, the general election in April 1999 and by two devastating
earthquakes in August and October in 1999. In particular, the area affected by the
earthquakes was the country’s industrial heartland and the immediate and adjacent
provinces (including Istanbul), accounting for around one-third of Turkey’s overall
output. It was assessed that their initial effects would have a severe negative impact on
GDP during the short term, but that recovery and reconstruction would probably result in
stronger growth in 2000.
In December 1999, the government started to implement an ambitious
stabilization program, aimed at achieving single-digit inflation by 2002, supported by an
IMF stand-by agreement. Central to the program had been firm monetary and exchange
rate policies, set so as to provide a nominal anchor for reducing inflation expectations;
also sounder public finance aimed at eliminating the principal source of inflation
pressures, and wide-ranging structural reforms designed to liberalize and modernize the
economy (OECD 2001). The program produced significant progress in 2000, but a severe
banking crisis blew up in late November, accompanied by massive capital outflows.
Furthermore, in early 2001, the second wave of the banking crisis deepened and caused
the collapse of the three-year exchange rate-based stabilization program only 14 months
after it had been launched (Akyüz and Boratav 2003; Cizre and Yeldan 2002).

9
A new program was presented in May 2001 and was further elaborated and
redefined during the course of the year and into 2002. This was also supported by the
IMF with a commitment of new funding in autumn 2001, followed by a substantial
disbursement in February 2002. The new program represents a deeper attempt than
previous ones to address the fundamental weaknesses in the economy. In particular, the
program encompasses key structural reforms that aim at including a strong focus on
public sector reform, building a sound banking system and liberalizing markets for
private sector-led growth (OECD 2003). After November 2002, the newly elected single-
party government maintained the same program. Although the economic program seems
to have made some progress in recent years in strengthening public finance, lowering
inflation, and reviving growth, it has been severely criticized on several grounds (Yeldan,
2004).
In 2004 period the government made another standby agreement with IMF. With
this agreement the government – taking advantage of its single-party status and
unprecented support in the international arena- started to implement the boldest neo-
liberal agenda in the history of the Turkish economy. A high growth rate (see Figure 1)
and lower inflation (below 10% in the last three years) are two indicators of success for
this period. However, growth came by means of the inflow of hot money and with
increasing unemployment (i.e. over 10%). Simply stated, it was jobless growth (Pamukcu
and Yeldan 2005), and there is no reason to be confident that it will be sustained, any
better than growth based on speculative financial inflows ever can be.

10
Figure 1: Growth Rate: 1970-2007
-10.0-8.0-6.0-4.0-2.00.02.04.06.08.0
10.012.0
1970
1972
1974
1976
1978
1980
1982
1984
1986
1988
1990
1992
1994
1996
1998
2000
2002
2004
2006
Source: The Turkish Statistical Institute, www.tuik.gov.tr.
4. Income/Payment Inequality: A Brief Review
Table 1 shows the Gini coefficient for Turkey, calculated from survey data for the
years available. The table appears to show that while inequality declined through the
1970s, it increased in the 1980s, and particularly from 1987 to 1994. For the same period,
Gürsel et. al (2000) found that the Theil Index increased from 0.430 to 0.506. However,
while the general contours of changes appear reasonably well-accepted, the data coverage
is extremely sparse, and differences in sources suggest that numbers from the earlier
period may not be strictly comparable to numbers from the later one.

11
Table 1: The Gini Coefficient for Turkey
Percentage of Households
1963 (SPO)
1968 (Bulutay
et. al 1971)
1973 (SPO)
1973/4 Rural (TSI)
1978/9 Urban (TSI)
1986 (TSI)
1987 (TSI)
1994 (TSI)
First 20 4.5 3 3.5 3.5 6.3 3.9 5.2 4.9 Second 20 8.5 7 8.0 11.5 12.0 8.4 9.6 8.6 Third 20 11.5 10 12.5 14.4 13.0 12.6 14.1 12.6 Fourth 20 18.5 20 19.5 18.7 21.0 19.2 21.1 19.0 Fifth 20 57.0 60 56.5 52.2 47.0 55.9 49.9 54.9 Gini Coefficient 0.55 0.56 0.51 0.47 0.40 NA 0.43 0.49
Source: Adopted from Yeldan (2000), SPO: State Planning Organization, TSI: Turkish
Statistical Institute (i.e. Turkstat)
Persistent income inequality between urban and rural and geographical regions of
Turkey has been studied extensively. Main findings of this literature (using different
surveys for different years) yield some not-unexpected facts about income inequality in
Turkey in comparison with other developing countries. These are summarized in Table
2)1. Köse and Bahçe (2007) provide an excellent discussion of the “poverty of literature
on poverty” in Turkey. After analyzing the Household Budget Surveys, they argue that a
poverty/income distribution study that ignores the concept of “social class” does not
present the core issue, which is the distribution of poverty within and between these
classes, or identifiable groups in Turkish society.
1 Also, Tansel and Güngör (1997) state that there is a convergence across 67 provinces between
1975 and 1990, in terms of income per labor force, whereas Filiztekin (1998) concludes that there is a
divergence across provinces in terms of income per capita in the same period (cited in Temel et al (1999).
Erlat (2005) using the unit root tests with panel data shows that except for provinces in East and
Southeastern regions, other provinces converge in terms of GDP per capita (cited in Kirdar and Saracoglu
2006). Ozmucur (1986) and Temel and Associates (1999) show a deteriorating functional distribution of
domestic factor income in the post-1980 period in that agricultural and wage incomes and salary have
reduced persistently (cited in Yeldan 2000). Atalik (1990) shows that for functional regions the coefficient
of regional income variation raised from 0.32 in 1975 to 0.43 in 1985 (cited in Gezici and Hewings 2003).

Table 2: Literature on Payment/Income Inequality in Turkey
Study Period Data Method Findings
Temel et al (1999) 1975-1990
Gross Provincial Product Data Data Source: Özötün 1980, 1988 and TURKSTAT
Markov Chain model Polarization among provinces
Selim and Küçükçiftçi (1999) 1994 1994 Household Income
Distribution Survey Gini coefficient
Increasing inequality between 19 provinces in study. While Zonguldak has the least unequal distribution of income distribution Istanbul and Adana have the most unequal distribution.
Gürsel et. al (2000) 1987 and 1994
1987 and 1994 Household Income and Consumption Surveys
Gini coefficient and several other indices
Theil index rose from 0.43 in 1987 to 0.506 in 1994 and squared coefficient variation rise from 1.87 to 6.29 in the same period. Gini coefficient and mean log deviation, however, declined from 0.46 to 0.45 and from 0.372 to 0.358, respectively in the same period.
World Bank (2000) 1987 and 1994
1987 and 1994 Household Income and Consumption Surveys
Gini coefficient and several other indices
Inequality between regions between 1987 and 1994 increased Gini coefficient for household money income rose from 0.411 in 1987 to 0.453 in 1994. Gini coefficient for total income remained same Theil index for total income rose from 0.44 to 0.49
Silber and Ozmucur (2000) 1994 1994 Household Income
Distribution Survey Gini coefficient
In 1987 Gini coefficient is 0.44 and 0.33 for urban and rural areas, respectively; for 1994 they are 0.58 and 0.46, respectively. In terms of contributions to overall inequality, in rural areas the main contribution is from the within- categories component while in urban areas it is from the between-categories component.
Source: Authors’ Review

13
Table 2: Literature on Payment/Income Inequality in Turkey-Cont.
Study Period Data Method Findings
Erk et al. (2000) 1979-1997 Özötün (1988) TURKSTAT
β-convergence σ-convergence
Except for the Marmara region, all regions are converging as well as provinces of the Southeastern Anatolian Project.
Altinbas et al (2002) 1987-1998 GDP per capita by provinces, TURKSTAT
β-convergence σ-convergence
No convergence among provinces under the “Priority Regions in Development” program. Declining discrepancy among other provinces.
Gezici and Hewings (2003) 1980-1997
GDP per capita by provinces. Data source: Istanbul Chamber of Industry and TURKSTAT
Theil index
Numbers refer Theil Index at 1980 and 1997, respectively . Provincial level: Especially after 1986 inequality declines (0.116 – 0.109) Functional and geographical regions levels: Inequality slightly decreasing within regions (0.40 – 0.27, 0.45 – 0.34 respectively), increasing between regions (0.60 – 0.73, 0.55 – 0.66, respectively).
Ozcan and Ozcan (2003) 2001 TURKSTAT
Gini coefficient and Standard income distribution methods
Improvement in distribution of income from 1994 to 2001.
Gezici and Hewings (2004) 1980-1997
GDP per capita by provinces. Data source: Istanbul Chamber of Industry and TURKSTAT
β-convergence σ-convergence
No convergence. East-West dualism.
Karaca (2004) 1975-2000 Gross Provincial Product. Data source: Özötün 1980, 1988 and TURKSTAT
β-convergence σ-convergence No convergence among provinces.
Source: Authors’ Review

14
Table 2: Literature on Payment/Income Inequality in Turkey-Cont.
Study Period Data Method Findings
Memis (2005) 1980-2000 The annual Manufacturing Industry Statistics by TURKSTAT
Clustering Analysis
Wage patterns experienced a substantial change with the year 1988. After 1988, the high-wage cluster increases while the lowest and the low-wage clusters decrease.
Baslevent and Dayioglu (2005a)
1994 and 2003
1994 Household Income Distribution Survey, TURKSTAT 2003 Household Budget Survey, TURKSTAT
Gini coefficient The squared coefficient of variation
The Gini coefficient dropped from 0.54 in 1994 to 0.44 in 2003.
Aldan and Gaygisiz (2006) 1987-2001 Provincial GDP by
TURKSTAT
β-convergence Markov Chain model
No convergence among provinces.
Yıldırım and Öcal (2006) 1987-2001 GDP per capita by
provinces, TURKSTAT Theil index Interregional inequalities decline. Theil index increases in economic expansion and declines in recession.
Kirdar and Saracoglu (2006) 1975-2000
GDP per capita by provinces. Data source: Özötün 1980, 1988 and TURKSTAT
Nonlinear least squares estimation and instrumental variables method
Conditional convergence. No convergence by provinces and regions.
Sari and Guven (2007) 1979-1998
GDP per capita by provinces. Data source: Istanbul Chamber of Industry and TURKSTAT
Generalized entropy inequality measure and the Theil index
Consistent increase in inequality. Priority Regions in Development program has no improving effect on inequality.
Guven (2007) 1979-2000
GDP per capita by provinces. Data Source: Istanbul Chamber of Industry and TURKSTAT
Generalized entropy inequality. Gini and Theil indices
Consistent increase in inequality. Priority Regions in Development program has no improving effect on inequality.
Source: Authors’ Review

It is a persistent fact that the income inequality is significantly higher in urban
areas (Silber and Özmucur 2000, WB 2000, Gürsel et. al 2000). In addition, according
the World Bank (2000), the rural-urban distinction explains more than 10 percent of total
inequality in Turkey. Silber and Özmucur (2000) state that while rural areas contribute to
the overall inequality mainly through “the within-groups” component, in urban areas the
main component of inequality is that measured “between-groups”. They also stated that
the main source of inequality in rural areas is the earnings from primary jobs. In urban
areas, however, the effect of income from other sources has considerable impact.
The research also shows that the most unequally distributed income is non-wage
income that is mostly earned by the top quintile and the biggest source of income
inequality is the interest component (Gürsel et. al 2000, Başlevent and Dayıoğlu 2005a).
Surprisingly, some comprehensive studies have shown that transfer incomes have
had a deteriorating effect on income inequality (WB 2000 and Gürsel et. al 2000). Gürsel
et. al (2000) note that “the narrows limits of social groups affected by the welfare state in
Turkey, the absence of many social transfer mechanisms and intervention in market
prices instead of direct transfers as a way of subsidy policies are reasons why transfers do
not produce their expected results” (pp. 18). They conclude that the decreasing negative
effect in 1994 compared with 1987 (two base years covered in the study) implies that
increasing transfer payments has a decreasing effect on income inequality (Gürsel et. al
2000, pp.18). They also state that “agricultural support policies are in favor of relatively
rich farmers producing in big scales, rather than poor ones having limited opportunities”
(WB 2000).

16
Dayıoğlu and Başlevent (2006) and Başlevent and Dayıoğlu (2005b), on the
other hand, show that ownership of squatter houses among relatively poor families has an
equalizing effect on income inequality, not just for a given province or in major cities but
in all regions.
The Turkish economy has a remarkable dual structure. While the relatively more
industrialized West has a higher income per capita, the East is mainly involved in
agrarian production and has poor standards of living and development indicators. When
one considers that the East is where the Kurdish people mainly live, this difference
becomes more significant in terms of high migration into urban areas due to political and
economic pressures, which in turn creates high unemployment and contributes to
inequality. Indeed, regional factors explain 11 percent of inequality overall (WB 2000).
This substantial regional discrepancy is a persistent problem in the Turkish
economy. Several studies that address this issue have shown that there has been no
convergence between the regions in Turkey (Şenesen 2003, Doğruel and Doğruel 2003),
and East and West (Gezici and Hewings 2004).
Gezici and Hewings (2003), using the provincial GDP time series, have shown
that while at the province level inequality is increasing after 1992 at the geographic
regional level there is persistent inequality. In a comparison of coastal and interior
provinces there is increasing inequality in favor of the former. In terms of “within”
inequality, it is declining in the former while there is slightly increasing inequality among
interior provinces (Gezici and Hewings 2003).
To reduce this regional gap has been one of the main interests of policy makers
for decades. Regional development projects and “Priority Regions in Development”, a

17
program for less developed regions, has been implemented to reduce this income gap.
However, it has shown that these programs have not been effective (Aldan and Gaygisiz
2006, Gezici and Hewings 2004, Sari and Guven 2007).
Starting from the fact that wages are a major component of wealth for majority of
society, it therefore follows that trend in wages reflect the change in income inequality
across the whole population. By using Theil’s T statistic, this study contributes to the
literature by examining inequality in payment of wages in the manufacturing sector and
analyzes the contribution to inequality by region, by the East-West divide, by province
and more importantly, by sub-sectors of the manufacturing sector.
5. Pay Inequality in the Manufacturing Sector
Contrary to the conventional wisdom, the openness of the 1980s did not lead to
increased economic competition in Turkish manufacturing (Boratav and Yeldan 2006).
While real wages increased in the 1970s, there was a trend of decline in the export-led
regime era in post-1980 (Erdil 1996, Voyvoda and Yeldan 2001). The ownership
differentials among different sectors between private and public sectors is a major factor
in wage differentials (Bayazıtoğlu and Ercan 2001, Ozmucur 2006, and also see
Kızılırmak 2003). Memis (2007), in a comprehensive study, analyzed the determinants of
inter- and intraclass income distribution in the manufacturing sector at the sub-sector
level between 1970 and 2000, and confirmed an increase in inequality for the same
period.
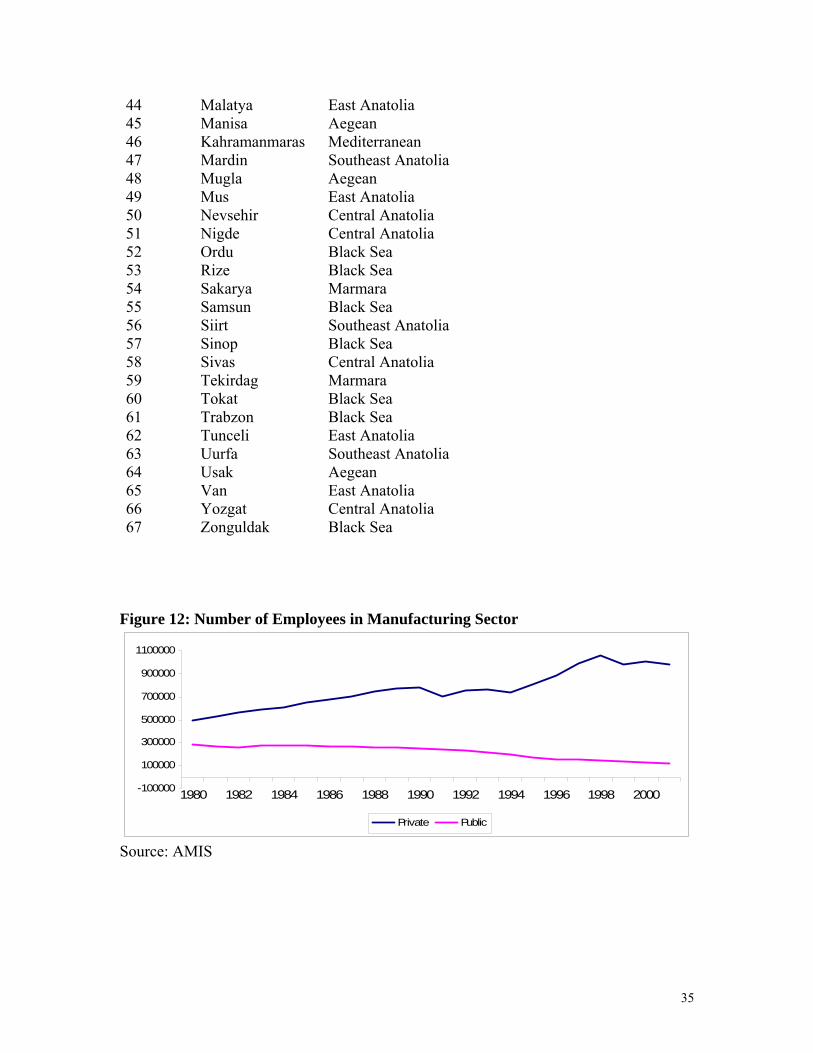
Figure 2 and Figure 3 show the change in real average payment in the
manufacturing sector and the share of private and public sectors, respectively. These two
figures together show the limited positive impact of an increase in average pay in the

18
public sector, since the share of that sector is shrinking substantially. Of course, what are
more important in terms of inequality are sectoral and regional/provincial discrepancies
in wage levels. These will be demonstrated below.
Figure 2: Percentage Change in Real Average Payment in Manufacturing Sector
-40
-20
0
20
40
60
80
100
120
1980 1982 1984 1986 1988 1990 1992 1994 1996 1998 2000
Total Public Private
Source: Authors’ calculation based on AMIS
Figure 3: Share of Private and Public Sectors in the Manufacturing Sector
0
20
40
60
80
100
120
1980 1982 1984 1986 1988 1990 1992 1994 1996 1998 2000
Private Public
Source: Authors’ calculation based on AMIS
19
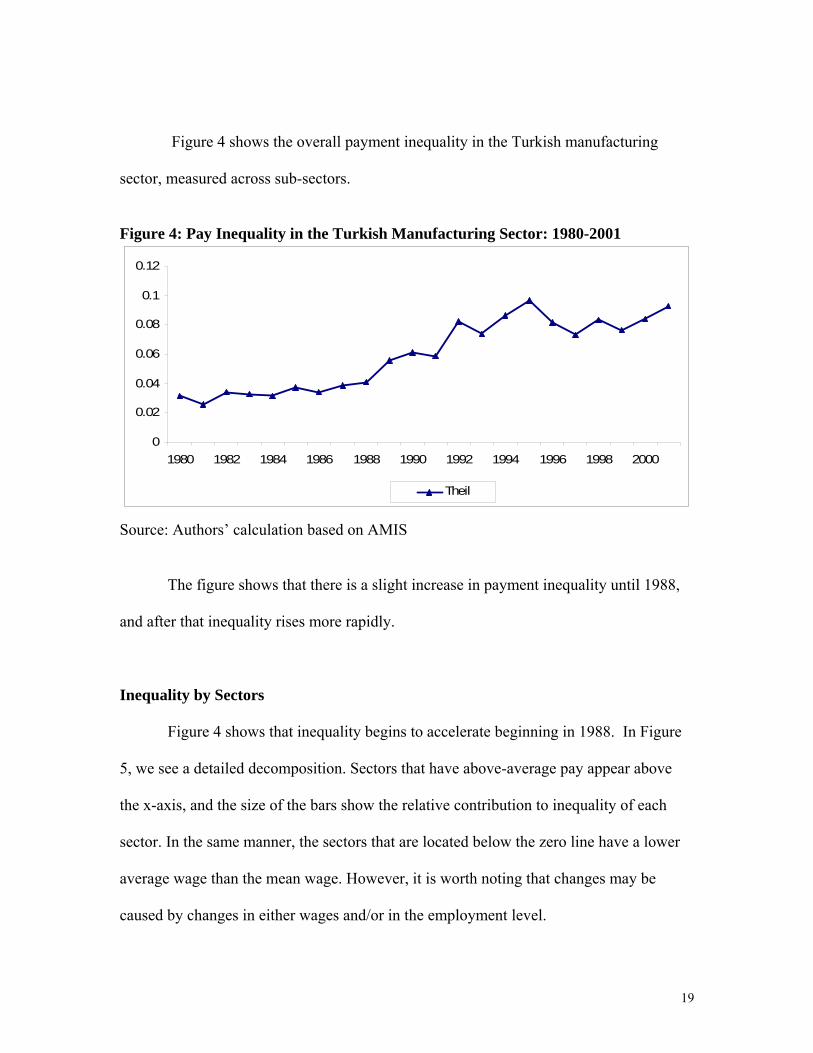
Figure 4 shows the overall payment inequality in the Turkish manufacturing
sector, measured across sub-sectors.
Figure 4: Pay Inequality in the Turkish Manufacturing Sector: 1980-2001
0
0.02
0.04
0.06
0.08
0.1
0.12
1980 1982 1984 1986 1988 1990 1992 1994 1996 1998 2000
Theil
Source: Authors’ calculation based on AMIS
The figure shows that there is a slight increase in payment inequality until 1988,
and after that inequality rises more rapidly.
Inequality by Sectors
Figure 4 shows that inequality begins to accelerate beginning in 1988. In Figure
5, we see a detailed decomposition. Sectors that have above-average pay appear above
the x-axis, and the size of the bars show the relative contribution to inequality of each
sector. In the same manner, the sectors that are located below the zero line have a lower
average wage than the mean wage. However, it is worth noting that changes may be
caused by changes in either wages and/or in the employment level.

20
Accordingly, while sectors of chemicals, machinery and equipment, glass and
pottery, metals, and paper are “winners”, the sectors of wood, food, and particularly
textiles suffer from lower wages compared with the manufacturing sector entirely.
Although the gender gap is not the focus point of this study, it is worth noting that food
and textiles are two sectors where women are over-represented (Elveren and Hsu 2007).
Thus an increasing contribution of the textile sector can be caused either by a decline in
wage level and/or an increase in the size of the sector. Considering existing literature on
wage levels in the textile sector in Turkey, we argue that this confirms the fact that the
wage level in the textile sector, one of the major export sectors in the Turkish economy,
has been pushed down, in relative terms, in the ELR period.
Figure 5: Pay Inequality by Manufacturing Sub-sectors (Region-Private Sector)
-0.15
-0.1
-0.05
0
0.05
0.1
0.15
0.2
1980 1982 1984 1986 1988 1990 1992 1994 1996 1998 2000
Chemicals Machinery and EquipmentMetals Glass and PotteryPaper and Publishing OtherFood WoodTextiles Theil
Source: Authors’ calculation based on AMIS

21
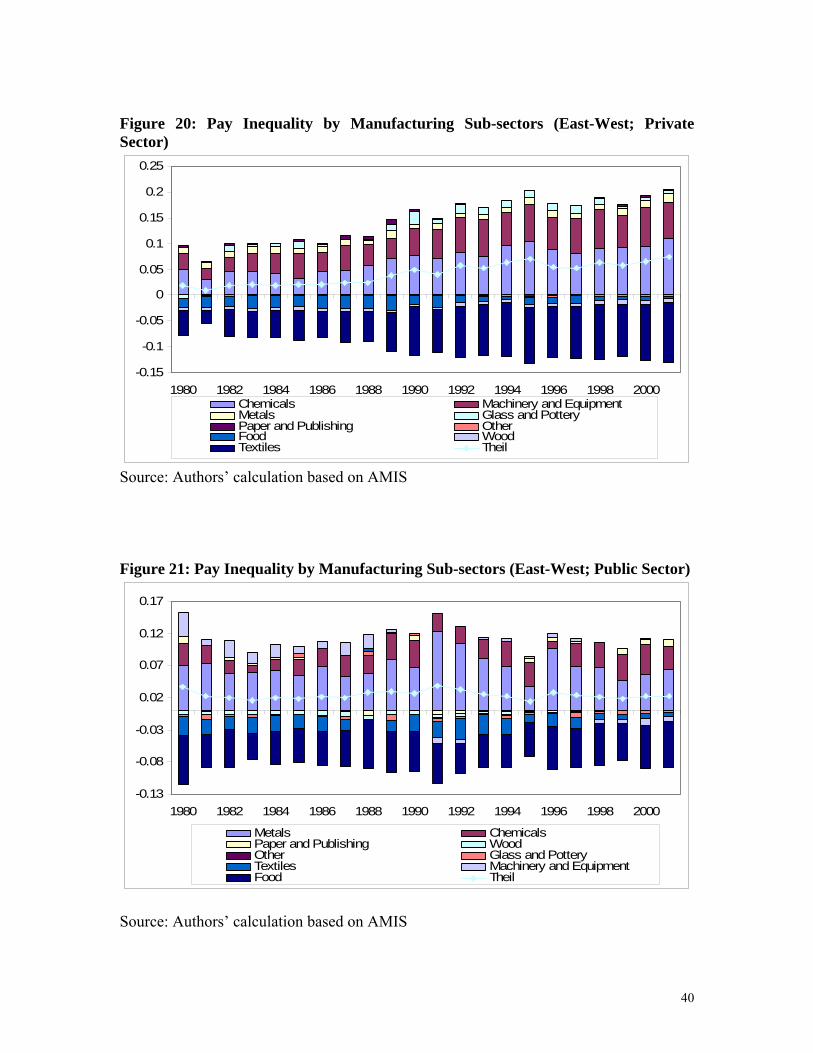
The same pattern of inequality is observed at the provincial level and at the East-
West levels (see Figure 17 and Figure 20 in Appendix).
For the public sector, however, there are two crucial aspects that need to be
emphasized (see Figure 6). First, as expected, there was not an increase in inequality; this
is the opposite of what was observed in private sector. Second, we observe that the metals
and chemicals are the major contributors to inequality inside the public sector.
Figure 6: Pay Inequality in Manufacturing Sub-sectors (Public Sector)
-0.13
-0.08
-0.03
0.02
0.07
0.12
0.17
1980 1982 1984 1986 1988 1990 1992 1994 1996 1998 2000
Metals ChemicalsPaper and Publishing WoodOther Glass and PotteryTextiles Machinery and EquipmentFood Theil
Source: Authors’ calculation based on AMIS
Inequality by Provinces
Figure 7 shows inequality by 67 provinces. Overall, inequality increases from
1987 to 1995, then it declines in 2001 to levels also seen in 1991. The major part of
inequality is caused by developed cities that have a substantial share of manufacturing
and are located in the most developed area of the country. The biggest contribution is
made by Kocaeli, Adana, Kirklareli, Ankara, Sakarya, Mersin, Bilecik, Balikesir, and

22
Zonguldak, who have above mean wage levels, and by other developed provinces such as
Denizli, Gaziantep, Kayseri, Konya, Izmir, and Bursa, who have lower wages than
average.
Figure 7: Pay Inequality by Provinces (Private Sector)
-0.09
-0.04
0.01
0.06
0.11
1980 1982 1984 1986 1988 1990 1992 1994 1996 1998 2000Kocaeli Adana Kirklareli Ankara Sakarya Mersin BilecikBalikesir Zonguldak Eskisehir Istanbul Bolu Amasya YozgatSinop Van Erzincan Kirsehir Elazig Adiyaman MardinErzurum Rize Diyarbakir Manisa Cankiri Nevsehir SivasUrfa Mugla Nigde Tokat Canakkale Giresun BurdurEdirne Trabzon Afyon Ordu Isparta Samsun HatayAntalya Aydin Kutahya Corum Tekirdag Usak MalatyaMaras Bursa Izmir Konya Kayseri Gaziantep DenizliTheil
Source: Authors’ calculation based on AMIS

23
As shown in Figure 8, in the public sector, the major contributor to inequality is
Zonguldak, where mining is the major sector, followed by Izmir, Hatay, Burdur, Mersin,
and Ankara. For the negative side, Rize is the biggest contributor to inequality, followed
by Trabzon, Istanbul, and Eskisehir.

24
Figure 8: Pay Inequality by Provinces (Public Sector)
-0.1
-0.05
0
0.05
0.1
0.15
1980 1982 1984 1986 1988 1990 1992 1994 1996 1998 2000
Zonguldak Izmir Hatay Burdur MersinAnkara Kocaeli Siirt Adana ElazigErzurum Antalya Kutahya Sinop TunceliAmasya Edirne Denizli Adiyaman MuglaOrdu Mus Urfa Canakkale BingolGumushane Isparta Hakkari Cankiri MardinBolu Giresun Bilecik Kirsehir YozgatMaras Gaziantep Kirklareli Kayseri TekirdagBitlis Kastamonu Corum Kars AgriManisa Nevsehir Nigde Sivas AydinMalatya Diyarbekir Usak Van ArtvinErzincan Bursa Afyon Sakarya SamsunBalikesir Konya Tokat Eskisehir IstanbulTrabzon Rize Theil
Source: Authors’ calculation based on AMIS

25
Inequality by Geographic Regions
Figure 9 shows inequality by seven major geographic regions for the period
between 1980 and 2001. What is clearly observed is that inequality remains almost the
same throughout the period. The Marmara region, the most developed area of the country
which involves big cities such as Istanbul, Bursa, Kocaeli, and Sakarya, is the main
component in this picture of inequality. Another key observation is the fact that the size
of the Southeast Anatolia region increased in the second decade. This is partly due to the
fast-growing province of Gaziantep.
Figure 9: Pay Inequality by Regions (Private Sector)
-0.07
-0.05
-0.03
-0.01
0.01
0.03
0.05
0.07
0.09
1980 1982 1984 1986 1988 1990 1992 1994 1996 1998 2000
Marmara Mediterranean Eastern Anatolia Black SeaCentral Anatolia Southeast Anatolia Aegean Theil
Source: Authors’ calculation based on AMIS

26
Inequality across the East-West Divide
The dual structure of the Turkish economy is a persistent problem. While the
West relatively consists of more developed areas, the Eastern part is where mostly
Kurdish citizens live and consists of the least developed provinces in the country. We
believe this distinction is of importance since excessive migration to urban areas forced
by both economic and political pressures, is an important aspect of income inequality.
We define the “East” as those provinces whose majority of population call themselves
Kurdish and thus we have categorized them accordingly. The rest of the country is
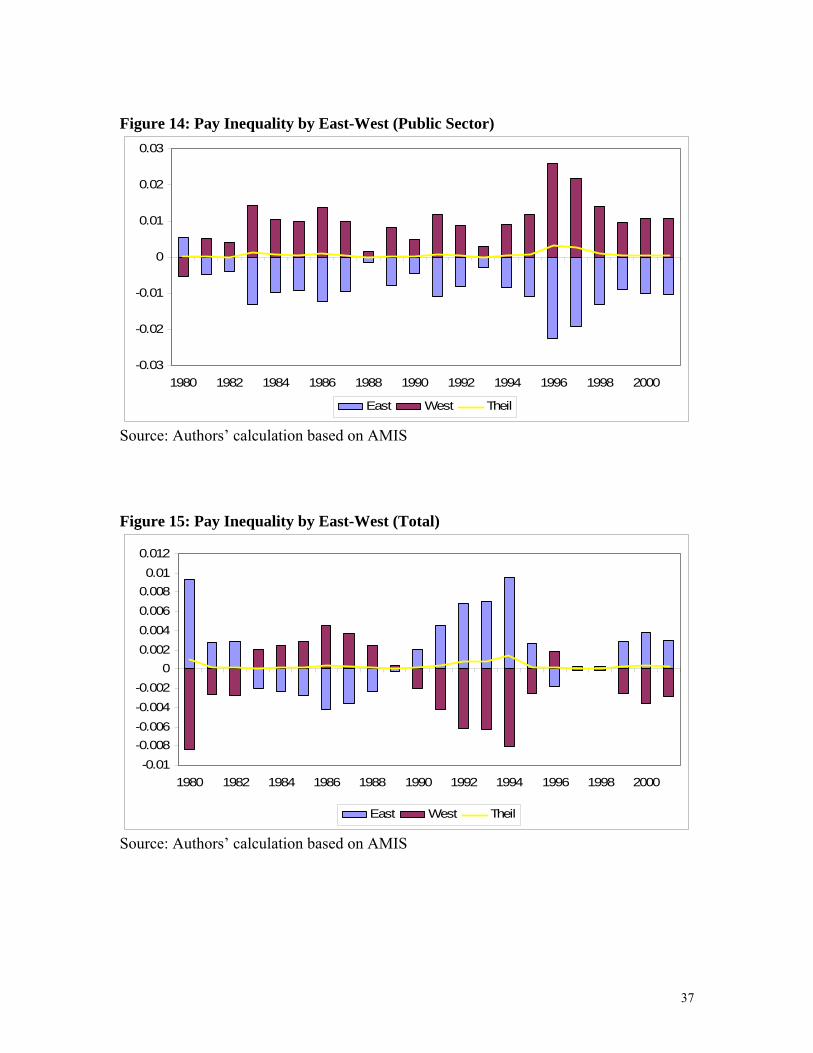
categorized as “West.” Figure 10 demonstrates inequality according to this East-West
distinction. What we observe is that inequality increases in the second decade. However,
no similar increase in inequality occurs within the public sector during this period (see
Figure 14 in Appendix).
Figure 10: Pay Inequality by East-West (Private Sector)
-0.004
-0.003
-0.002
-0.001
0
0.001
0.002
0.003
0.004
0.005
1980 1982 1984 1986 1988 1990 1992 1994 1996 1998 2000
East West Theil
Source: Authors’ calculation based on AMIS

27
6. Conclusion
We have investigated pay inequality in the Turkish manufacturing sector between
1980 and 2001. By doing so, we contribute some useful new information on the overall
trend of income distribution in the economy; since wages are a major component of
income and manufacturing is a major part of all economic activity, we expect trends
broadly similar to those we can observe directly from these data to hold throughout the
entire economy. Our findings showed that overall inequality in pay in Turkey in the post-
1980 era, under the neo-liberal model, has deteriorated particularly beginning in the late
1980s. Even though the public sector has displayed unchanged inequality throughout the
period at both the provincial and regional levels, the shrinking share of the public sector
downplays any positive effect that stability may have.
In the context of provinces, we observed the same trend of deepening inequality,
which increases sharply between 1987 and 1995 and then declines slightly to its 1991
level in 2001. However, we also showed that inequality between the broader geographical
regions remains almost the same in the study period. This confirms the main findings in
the literature that there is no convergence between regions. Also, we showed that the dual
structure in the Turkish economy, namely between an impoverished East and affluent
West, has been perpetuated during the years of neoliberalism in Turkey.

28
References
Aktan C.C. (1997), ‘Turkey: From Etatism to a More Liberal Economy’, Journal of
Social, Political and Economic Studies, 22(2), 165-184
Akyüz Y., Boratav K. (2003), ‘The Making of the Turkish Financial Crisis’, World
Development, 31(9), 1549–1566
Aldan A., Gaygisiz E. (2006), ‘Convergence Across Provinces of Turkey: A Spatial
Analysis’, Working Paper No. 0609, Research and Monetary Policy Department,
Central Bank of the Republic of Turkey.
Alper C.E., Öniş Z. (2002), ‘Finansal Küreselleşme, Demokrasi Açığı ve Yükselen
Piyasalarda Yaşanan Sürekli Krizler: Sermaye Hareketlerinin Liberalleşmesi
Sonrasında Türkiye Deneyimi’, Doğu-Batı, 4(17), 203-226.
Altinbas S., Dogruel F., Gunes M. ((2002), ‘Turkiye’de Bolgesel Yakinsama:
Kalkinmada Oncelikli Iller Politikasi Basarili Mi?’, at <
http://www.econ.utah.edu/~ehrbar/erc2002/pdf/P192.pdf>
Atalik G. (1990), ‘Some Effects of Regional Differentiation on Integration in the
European Community’, Papers in Regional Science Association, 69, 11-19
Bayazıtoğlu B., Ercan H. (2001), ‘Turkish manufacturing wages: Inter-industry earning
inequality’, in Bulutay T. (ed), Wages, Income and Wages Distribution, State
Institute of Statistics, Printing Division, Ankara
Başlevent C., Dayıoğlu M. (2005a), ‘A household level examination of regional income
disparity in Turkey’, METU Studies in Development, 32, 275-302
Başlevent C., Dayıoğlu M. (2005b), ‘The Effect of Squatter Housing on Income
Distribution in Urban Turkey’, Urban Studies, 42 (1), 31-45
Boratav K., Yeldan E. (2006), ‘Turkey, 1980-2000: Financial Liberalization,
Macroeconomic (In)-Stability, and Patterns of Distribution’ in Taylor L. (ed),
External Liberalization in Asia, Post-Socialist Europe and Brazil, Oxford
University Press
Cizre Ü., Yeldan E. (2002), ‘Turkey: Economy, Politics and Society in the Post-Crisis
Era’, mimeo

29
Dayıoğlu M., Başlevent C. (2006), ‘Imputed Rents and Regional Income Inequality in
Turkey: A Subgroup Decomposition of the Atkinson Index’, Regional Studies,
40(8), 889-905
Doğruel F., Doğruel A. S. (2003), ‘Türkiye’de Bölgesel Gelir Farklılıkları ve Büyüme’,
in Köse A. H., Şenses F., Yeldan E. (eds), Kuresel Duzen: Birikim ve Siniflar,
Iletisim Yayinlari, Istanbul
Duygan B., Guner N. (2006), ‘Income and Consumption Inequality in Turkey: What role
does education play?’, in Altug S., Filiztekin A. (eds), The Turkish Economy: The
Real Economy, Corporate Governance and Reform and Stabilization Policy,
Routledge Curzon Studies in Middle Eastern Economies
Ekinci N.K., (1990), ‘Macroeconomic Developments in Turkey: 1980-1988’, METU
Studies in Development, 17(1-2), 73-114
Elveren A. Y., Hsu S., (2007), ‘Gender Gaps in the Individual Pension System in
Turkey’, University of Utah, Department of Economics, Working Paper No. 6
Elveren A. Y., Kar M., (2008), ‘Turkey’s Economic Integration into the EU: Challenges
and Opportunities’ in Phuskele P. (ed), Economic Integration – Global
Experience, ICFAI University Press, Hyderbad
Erdil E. (1996), ‘Inter-industry wage differentials: An analysis of wages in Turkish
manufacturing industry, 1980/1985’, Middle East Technical University Studies in
Development, 23(1), 1-19
Erk N., Ates S., Direkci T. (2000), ‘Convergence and Growth within GAP Region (South
Eastern Anatolia Project) and Overall Turkey’s Region
at <http://idari.cu.edu.tr/sanli/sanli8.pdf>
Erlat H. (2005), ‘Turkiye’de Bolgesel Yakinsama Sorununa Zaman Dizisi Yaklasimi’, in
Erlat H. (ed), Bolgesel Gelisme Stratejileri ve Akdeniz Ekonomisi, Ankara:
Turkish Economic Association
Filiztekin A. (1997), ‘Turkiye’de Iller Arasinda Yakinsama’, Koc University Working
Paper Series 1997-15
Gezici F., Hewings G. J.D. (2004), ‘Regional Convergence and the Economic
Performance of Peripheral Areas in Turkey’, Review of Urban and Regional
Development Studies, 16 (2), 113-132

30
Gezici F., Hewings G. J.D. (2003), ‘Spatial Analysis of Regional Inequalities in Turkey’,
43rd Congress of European Regional Science, 27-30 August, 2003, Jyvaskyla,
Finland, mimeo
Gürsel S., Levent H., Selim R., Sarıca Ö. (2000), ‘Individual Income Distribution in
Turkey, A Comparison with the European Union’ TUSIAD Publication No:
T/2000-12/296.
Güven A. (2007), ‘The Role of Incentive Policy on Income Inequality Between Turkish
Provinces: A Decomposition Analysis’, Akdeniz I.I.B.F. Dergisi, 14, 20-38
Hershlag Z.Y. (1968), Origins of Turkish Etatism in Turkey: The Challenge of Growth,
E.J. Brill, Leiden.
Karaca O. (2004), ‘Turkiye’de Bolgeler Arasi Gelir Farkliliklari: Yakinsama Var Mi?’,
Turkiye Ekonomi Kurumu Tartisma Metni 2004/7, at <
http://www.tek.org.tr/dosyalar/O-KARACA.pdf>
Keyder Ç. (1987), ‘The Political Economy of Turkish Democracy’, in Schick I. C.,
Tonak A. T. (eds), Turkey in Transition: New Perspectives, Oxford University
Pres, New York
Kızılırmak A. B. (2003), ‘Explaining Wage Inequality: Evidence from Turkey’, Ankara
University Faculty of Political Science Research Center for Development &
Society Working Paper Series, No. 57
Kirdar M G., Saracoglu D. S. (2006), ‘Does Internal Migration Lead to Faster Regional
Convergence in Turkey: An Emprical Investigation at <
http://www.ersa.org/ersaconfs/ersa06/papers/784.pdf>
Köse A. H., Bahçe S. (2007), ‘ “Yoksulluk” Yazınının Yoksulluğu: Toplumsal Sınıflarla
Düşünmek’, mimeo
Köse S., Güven A. (2007), ‘Government education expenditures and income inequality:
evidence from provinces of Turkey’, South-East Europe Review, 1/2007, 79-101
Memis E. (2007), ‘Inter-and Intraclass Distribution of Income in Turkish Manufacturing,
1970-2000’, Unpublished Ph.D. Dissertation, Department of Economics,
University of Utah
Memis E. (2005), ‘Is the Pattern of Wage Differentials Stable Over Times? A Cluster
Analysis in Turkish Manufacturing Industry’ at <

31
http://www.policyinnovations.org/ideas/policy_library/data/01224/_res/id=sa_File
1/>
OECD (2001), ‘Economic Survey of Turkey, 2000-01’, Policy Brief, OECD, Paris.
Okyar O. (1965), ‘The Concept of Etatism’, Economic Journal, March
Okyar O. (1979), ‘Development Background of the Turkish Economy, 1923-1973’,
International Journal of Middle East Studies, 10, 325-344
Ozcan Y., Ozcan K. (2003), ‘Measuring Poverty and Inequality in Turkey, 2001’, Topics
in Middle Eastern and North African Economies, electronic journal, Vol. 5,
Middle East Economic Association and Loyola University Chicago.
Ozmucur S. (2006), ‘Wage and Productivity Differentials in Private and Public
Manufacturing: The Case of Turkey’, at
<http://www.econ.upenn.edu/~ozmucur/papers/sonwagesandproductivitypdf.p
df>
Öniş Z. (1986), ‘Stabilisation and Growth in a Semi-industrial Economy: An Evaluation
of the Recent Turkish Experiment, 1977-84’, METU Studies in Development,
13(1-2), 7-28
Öniş Z., Webb B. (1999), ‘Turkey: Democratization and Adjustment From Above’, in
Öniş Z (ed), State and Market: The Political Economy of Turkey in Comparative
Perspective, Boğaziçi University Press, Istanbul
Özötün E. (1980), ‘Iller Itibariyle Türkiye Gayri Safi Yurtiçi Hasilasi- Kaynak ve
Yöntemler 1975-1978 Publication No. 907 Ankara: State Institute of Statistics
Özötün E. (1988), ‘Turkiye Gayri Safi Yurtici Hasilasinin Iller Itibariyle Dagilimi 1979-
1986’ Publication no 1988/8 Istanbul: Istanbul Chamber of Industry Research
Department
Pamukcu T., Yeldan E. (2005), ‘Country Profile: Turkey Macroeconomic Policy and
Recent Economic Performance’, at
<http://www.bilkent.edu.tr/~yeldane/FEMISE_Fiscal2005.pdf>
Rodrik D. (1990), ‘Premature Liberalization, Incomplete Stabilization: The Ozal Decade
in Turkey’, NBER Working Paper No. W3300, NBER
Sari R., Guven A. (2007), ‘Kalkınmada öncelikli yöreler uygulamasının iller arası gelir
dağılımı üzerindeki etkisi’, ODTU Gelisme Dergisi, 34, 77-96

32
Selim R., Küçükçiftçi S. (1999), ‘Income Inequality and Economic Growth: An
Empirical Study for Turkish Provinces’, Iktisat Isletme ve Finans, 14(160)
Silber J., Ozmucur S. (2000), ‘Decomposition of Income Inequality: Evidence from
Turkey’, Topics in Middle Eastern and North African Economies, at
<http://www.luc.edu/orgs/meea/volume2/ozmucur2.doc>
Şenesen U. (2003), ‘Bölgesel Gelir Dağılımı’, in Balkan N., Savran S. (eds),
Neoliberalizmin Tahribatı, Metis Yayinlari, Istanbul
Tansel A., N. D. (1997), ‘Income and Growth Convergence: An Application to the
Provinces of Turkey’, paper presented at the First Annual ERC/METU
Conference on Economics, September 18-20, 1997.
Temel A., Associates. (1999), ‘Functional distribution of income in Turkey’, (mimeo)
State Planning Organization: Ankara
Temel T., Tansel A., Albersen P. J. (1999), ‘Convergence and Spatial Patterns in Labor
Productivity: Nonparametric Estimations For Turkey’, Journal of Regional
Analysis and Policy, 29 (1), 3-19
Theil H. (1972), Statistical Decompostion Analysis: With Applications in the Social and
Administrative Sciences, Amsterdam-London: North Holland Publishing
Company
Voyvoda E., Yeldan E. (2001), ‘Patterns of Productivity Growth and the Wage Cycles in
Turkish Manufacturing’, International Review of Applied Economics, 15(4), 375-
396
Yeldan E. (2000), ‘The Impact of Financial Liberalization and the Rise of Financial
Rents on Income Inequality: The Case of Turkey’, WIDER Working Paper No.
206. at <http://62.237.131.23/publications/wp206.pdf>
Yeldan E. (2006), ‘Turkey 2001-2006 Macroeconomics of Post-Crisis Adjustment’,
Global Policy Network, at <http://www.gpn.org>
Yıldırım J., Öcal N. (2006), ‘Income Inequality and Economic Convergence in Turkey’,
Transition Studies Review, 13(3), 559-568
33
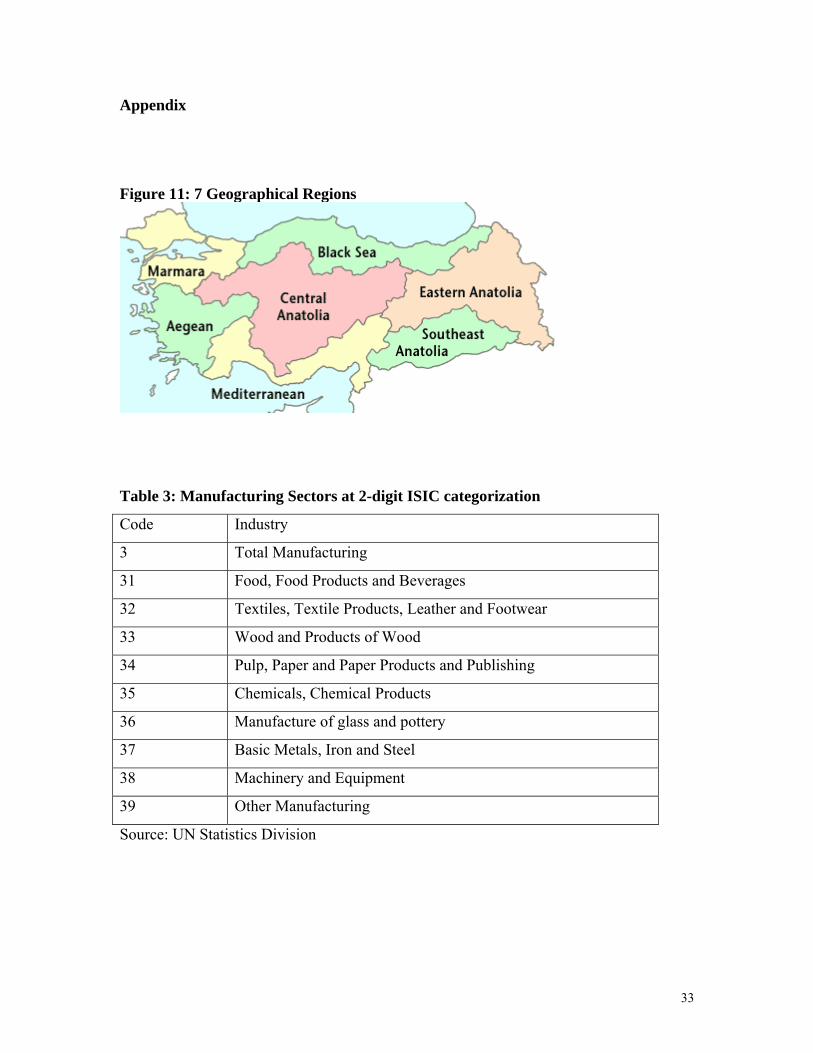
Appendix Figure 11: 7 Geographical Regions
Table 3: Manufacturing Sectors at 2-digit ISIC categorization
Code Industry
3 Total Manufacturing
31 Food, Food Products and Beverages
32 Textiles, Textile Products, Leather and Footwear
33 Wood and Products of Wood
34 Pulp, Paper and Paper Products and Publishing
35 Chemicals, Chemical Products
36 Manufacture of glass and pottery
37 Basic Metals, Iron and Steel
38 Machinery and Equipment
39 Other Manufacturing
Source: UN Statistics Division

34
Table 4: Provinces and Regions
Province Code
Name of Province Region
1 Adana Mediterranean 2 Adiyaman Southeast Anatolia 3 Afyon Aegean 4 Agri East Anatolia 5 Amasya Black Sea 6 Ankara Central Anatolia 7 Antalya Mediterranean 8 Artvin Black Sea 9 Aydin Aegean 10 Balikesir Marmara 11 Bilecik Marmara 12 Bingol East Anatolia 13 Bitlis East Anatolia 14 Bolu Black Sea 15 Burdur Mediterranean 16 Bursa Marmara 17 Canakkale Marmara 18 Cankiri Central Anatolia 19 Corum Black Sea 20 Denizli Aegean 21 Diyarbakir Southeast Anatolia 22 Edirne Marmara 23 Elazig East Anatolia 24 Ercinzan East Anatolia 25 Erzurum East Anatolia 26 Eskisehir Central Anatolia 27 Gaziantep Southeast Anatolia 28 Giresun Black Sea 29 Gumushane Black Sea 30 Hakkari East Anatolia 31 Hatay Mediterranean 32 Isparta Mediterranean 33 Icel Mediterranean 34 Istanbul Marmara 35 Izmir Aegean 36 Kars East Anatolia 37 Kastamonu Black Sea 38 Kayseri Central Anatolia 39 Kirklareli Marmara 40 Kirsehir Central Anatolia 41 Kocaeli Marmara 42 Konya Central Anatolia 43 Kutahya Aegean
35
44 Malatya East Anatolia 45 Manisa Aegean 46 Kahramanmaras Mediterranean 47 Mardin Southeast Anatolia 48 Mugla Aegean 49 Mus East Anatolia 50 Nevsehir Central Anatolia 51 Nigde Central Anatolia 52 Ordu Black Sea 53 Rize Black Sea 54 Sakarya Marmara 55 Samsun Black Sea 56 Siirt Southeast Anatolia 57 Sinop Black Sea 58 Sivas Central Anatolia 59 Tekirdag Marmara 60 Tokat Black Sea 61 Trabzon Black Sea 62 Tunceli East Anatolia 63 Uurfa Southeast Anatolia 64 Usak Aegean 65 Van East Anatolia 66 Yozgat Central Anatolia 67 Zonguldak Black Sea
Figure 12: Number of Employees in Manufacturing Sector
-100000
100000
300000
500000
700000
900000
1100000
1980 1982 1984 1986 1988 1990 1992 1994 1996 1998 2000
Private Public
Source: AMIS

36
Figure 13: Contribution to Inequality by Provinces (Total)
-0.12
-0.07
-0.02
0.03
0.08
0.13
1980 1982 1984 1986 1988 1990 1992 1994 1996 1998 2000Kocaeli Adana Ankara Hatay Sakarya Rize IzmirBalikesir Kirklareli Eskisehir Elazig Zonguldak Siirt MersinBilecik Erzurum Yozgat Burdur Artvin Samsun TokatKars Amasya Van Tunceli Kirsehir Mus AgriBolu Erzincan Bitlis Gumushane Bingol Sinop HakkariKastamonu Afyon Diyarbakir Mardin Sivas Cankiri NevsehirUrfa Adiyaman Canakkale Giresun Kutahya Mugla NigdeTrabzon Malatya Antalya Edirne Ordu Isparta CorumAydin Manisa Usak Konya Maras Tekirdag KayseriGaziantep Bursa Denizli Istanbul Theil
Source: Authors’ calculation based on AMIS
37
Figure 14: Pay Inequality by East-West (Public Sector)
-0.03
-0.02
-0.01
0
0.01
0.02
0.03
1980 1982 1984 1986 1988 1990 1992 1994 1996 1998 2000
East West Theil
Source: Authors’ calculation based on AMIS Figure 15: Pay Inequality by East-West (Total)
-0.01-0.008-0.006-0.004-0.002
00.0020.0040.0060.0080.01
0.012
1980 1982 1984 1986 1988 1990 1992 1994 1996 1998 2000
East West Theil
Source: Authors’ calculation based on AMIS

38
Figure 16: Pay Inequality by Manufacturing Sub-sectors (Region-Total)
-0.13
-0.08
-0.03
0.02
0.07
0.12
0.17
1980 1982 1984 1986 1988 1990 1992 1994 1996 1998 2000
Chemicals Machinery and Equipment MetalsFood Paper and Publishing Glass and PotteryOther Wood TextilesTheil
Figure 17: Pay Inequality by Manufacturing Sub-sectors (Province-Private Sector)
-0.15
-0.1
-0.05
0
0.05
0.1
0.15
0.2
1980 1982 1984 1986 1988 1990 1992 1994 1996 1998 2000Chemicals Machinery and EquipmentMetals Glass and PotteryPaper and Publishing OtherFood WoodTextiles Theil
Source: Authors’ calculation based on AMIS

39
Figure 18: Pay Inequality by Manufacturing Sub-sectors (Province-Public Sector)
-0.12
-0.07
-0.02
0.03
0.08
0.13
1980 1982 1984 1986 1988 1990 1992 1994 1996 1998 2000Metals ChemicalsPaper and Publishing WoodOther Glass and PotteryTextiles Machinery and EquipmentFood Theil
Source: Authors’ calculation based on AMIS Figure 19: Pay Inequality by Manufacturing Sub-sectors (Province-Total)
-0.13
-0.08
-0.03
0.02
0.07
0.12
0.17
1980 1982 1984 1986 1988 1990 1992 1994 1996 1998 2000
Chemicals Machinery and EquipmentMetals FoodPaper and Publishing Glass and PotteryOther WoodTextiles Theil
Source: Authors’ calculation based on AMIS
40
Figure 20: Pay Inequality by Manufacturing Sub-sectors (East-West; Private Sector)
-0.15
-0.1
-0.05
0
0.05
0.1
0.15
0.2
0.25
1980 1982 1984 1986 1988 1990 1992 1994 1996 1998 2000Chemicals Machinery and EquipmentMetals Glass and PotteryPaper and Publishing OtherFood WoodTextiles Theil
Source: Authors’ calculation based on AMIS Figure 21: Pay Inequality by Manufacturing Sub-sectors (East-West; Public Sector)
-0.13
-0.08
-0.03
0.02
0.07
0.12
0.17
1980 1982 1984 1986 1988 1990 1992 1994 1996 1998 2000
Metals ChemicalsPaper and Publishing WoodOther Glass and PotteryTextiles Machinery and EquipmentFood Theil
Source: Authors’ calculation based on AMIS

41
Figure 22: Pay Inequality by Manufacturing Sub-sectors (East- West, Total)
-0.15
-0.1
-0.05
0
0.05
0.1
0.15
0.2
1980 1982 1984 1986 1988 1990 1992 1994 1996 1998 2000Chemicals Machinery and EquipmentMetals FoodOther Paper and PublishingGlass and Pottery WoodTextiles Theil
Source: Authors’ calculation based on AMIS