Pay for Performance Conference Jon Kingsdale, Ph.D. John Freedman, M.D., M.B.A.
25
Pay for Performance Conference Jon Kingsdale, Ph.D. John Freedman, M.D., M.B.A.
-
Upload
brendan-bond -
Category
Documents
-
view
215 -
download
0
Transcript of Pay for Performance Conference Jon Kingsdale, Ph.D. John Freedman, M.D., M.B.A.
Pay for Performance Conference
Jon Kingsdale, Ph.D.
John Freedman, M.D., M.B.A.
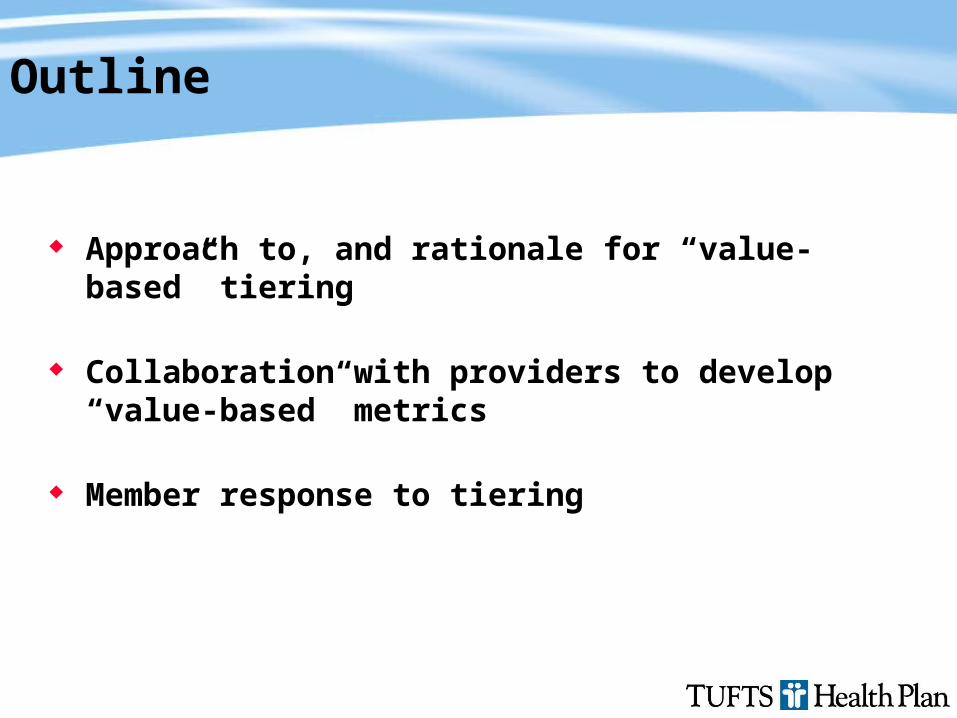
Outline
Approach to, and rationale for “value-based” tiering
Collaboration with providers to develop “value-based” metrics
Member response to tiering

Decrease Medical Trend & Improve Quality & Service
Supply Side Risk Contracting P4P Selective Contracting Profiling UR\PA TIERING
Demand Side Benefits Cost-Sharing HRA\HSA Disease Management Health Promotion TIERING
Network Tiering bridges the boundary between supply-side and demand-side initiatives
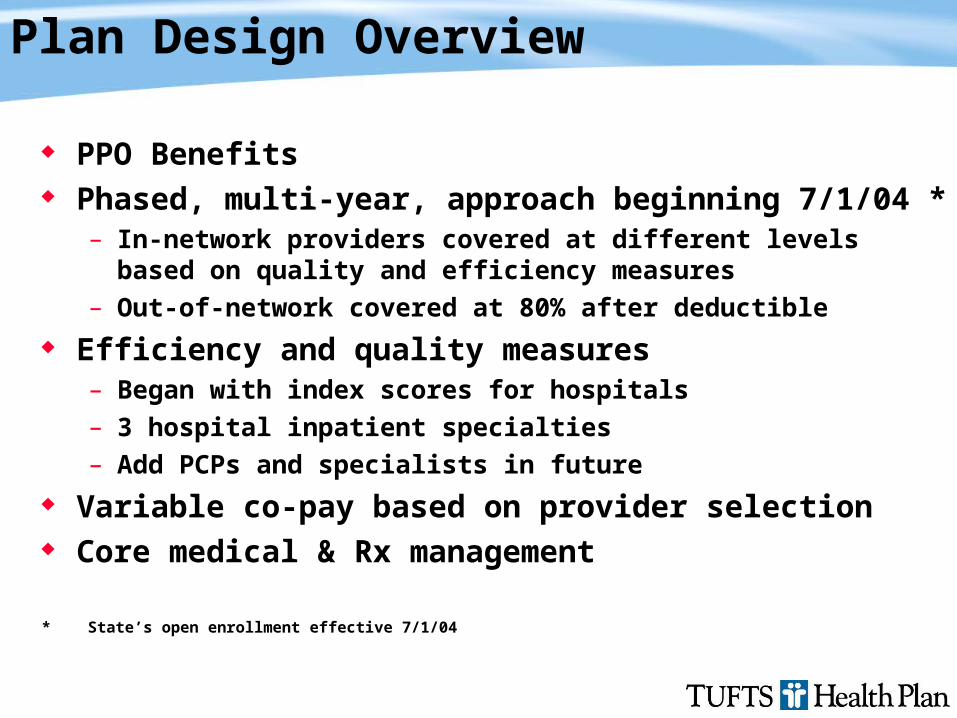
Plan Design Overview
PPO Benefits Phased, multi-year, approach beginning 7/1/04 *
– In-network providers covered at different levels based on quality and efficiency measures
– Out-of-network covered at 80% after deductible
Efficiency and quality measures– Began with index scores for hospitals– 3 hospital inpatient specialties– Add PCPs and specialists in future
Variable co-pay based on provider selection Core medical & Rx management
* State’s open enrollment effective 7/1/04
Year 1: Fiscal Year 2005 Model (7/1/04 – 6/30/05)
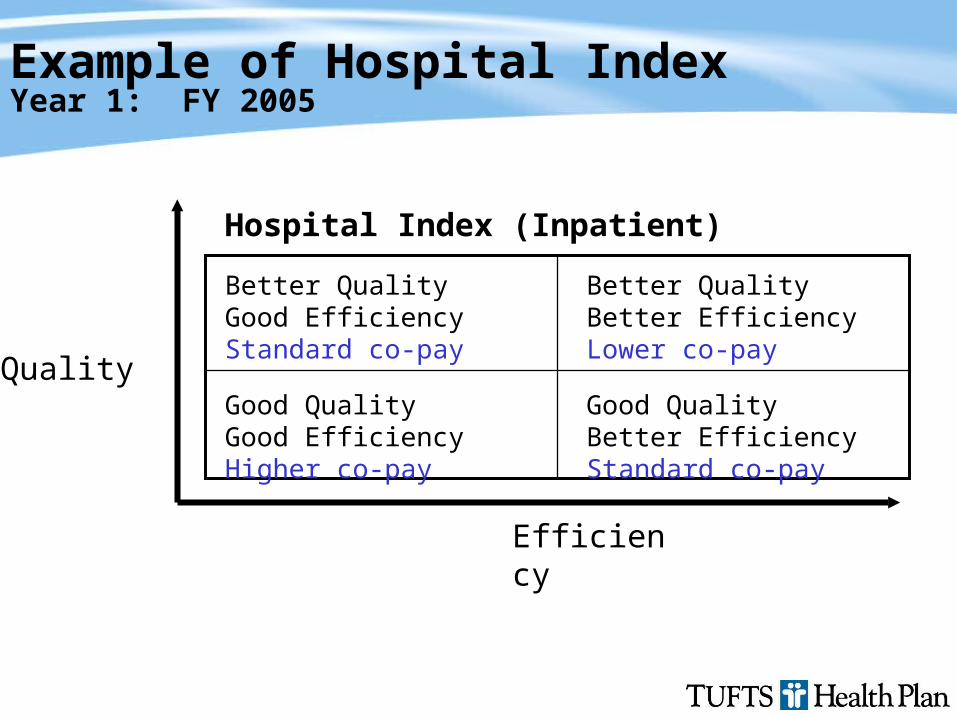
Example of Hospital IndexYear 1: FY 2005
Better QualityGood EfficiencyStandard co-pay
Better QualityBetter EfficiencyLower co-pay
Good QualityGood EfficiencyHigher co-pay
Good QualityBetter EfficiencyStandard co-pay
Hospital Index (Inpatient)
Efficiency
Quality
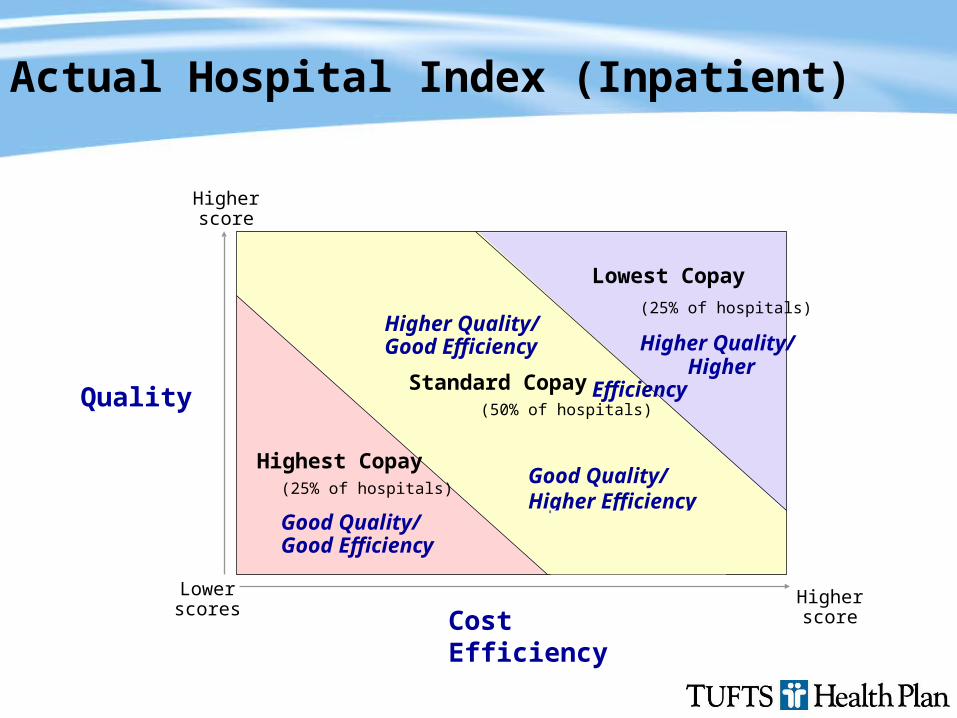
Year 1: Fiscal Year 2005 Model (7/1/04 – 6/30/05)Actual Hospital Index (Inpatient)
Cost Efficiency
Quality
Lower scores
Higher score
Higher score
Higher Quality/Good Efficiency
Standard Copay(50% of hospitals)
Good Quality/ Higher Efficiency
Lowest Copay
(25% of hospitals)
Higher Quality/ Higher Efficiency
Highest Copay(25% of hospitals)
Good Quality/ Good Efficiency
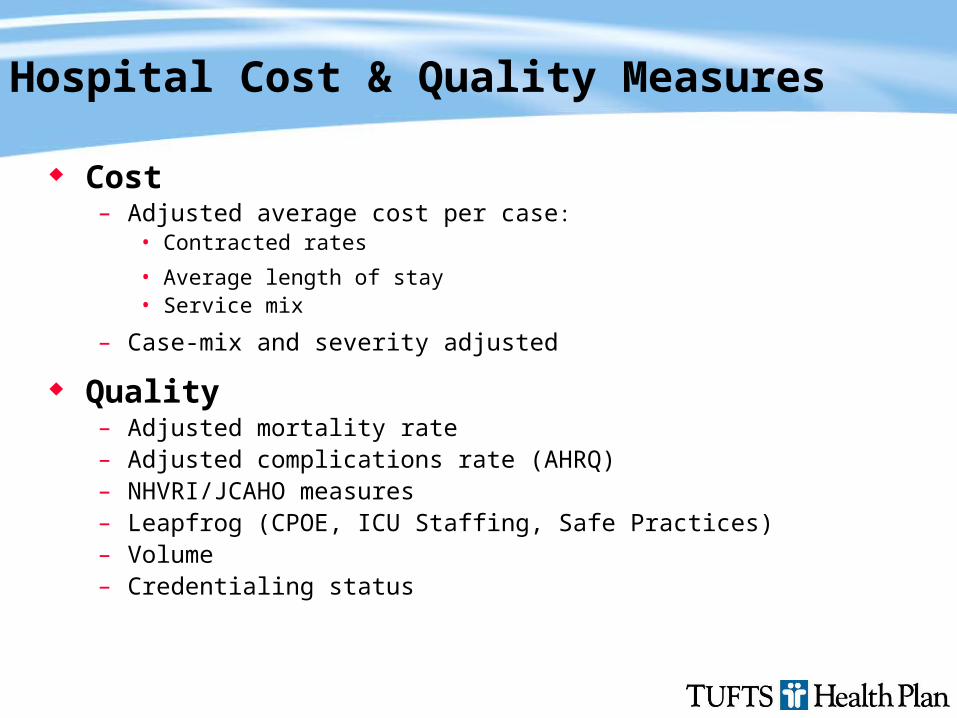
Hospital Cost & Quality Measures
Cost– Adjusted average cost per case:
• Contracted rates
• Average length of stay• Service mix
– Case-mix and severity adjusted
Quality– Adjusted mortality rate– Adjusted complications rate (AHRQ)– NHVRI/JCAHO measures– Leapfrog (CPOE, ICU Staffing, Safe Practices)– Volume– Credentialing status
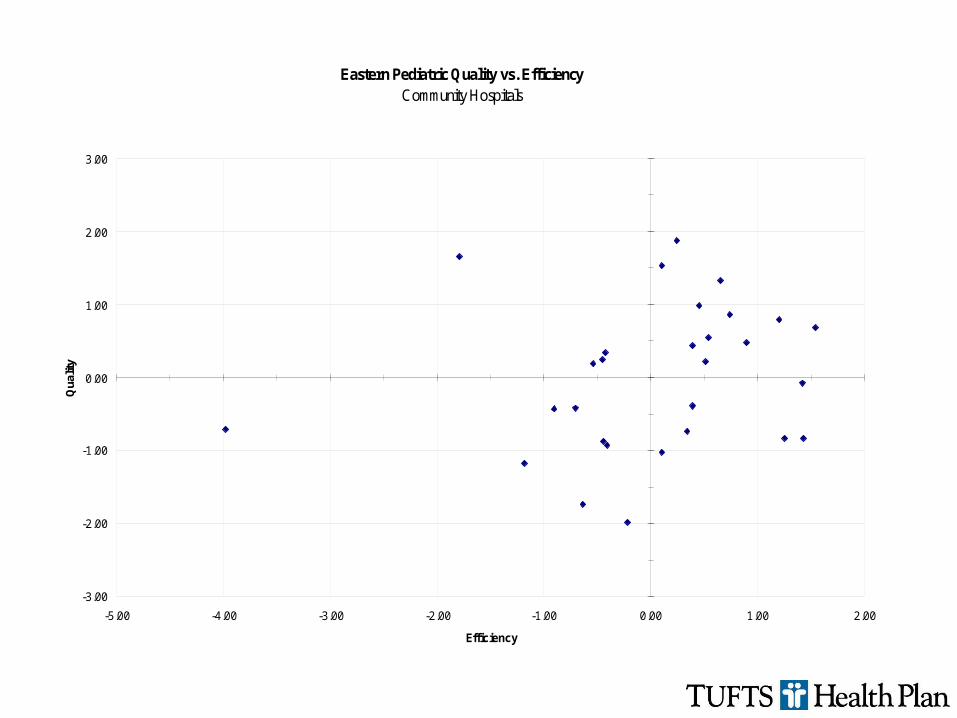
Eastern Pediatric Quality vs. EfficiencyCommunity Hospitals
-3.00
-2.00
-1.00
0.00
1.00
2.00
3.00
-5.00 -4.00 -3.00 -2.00 -1.00 0.00 1.00 2.00
Efficiency
Qua
lity
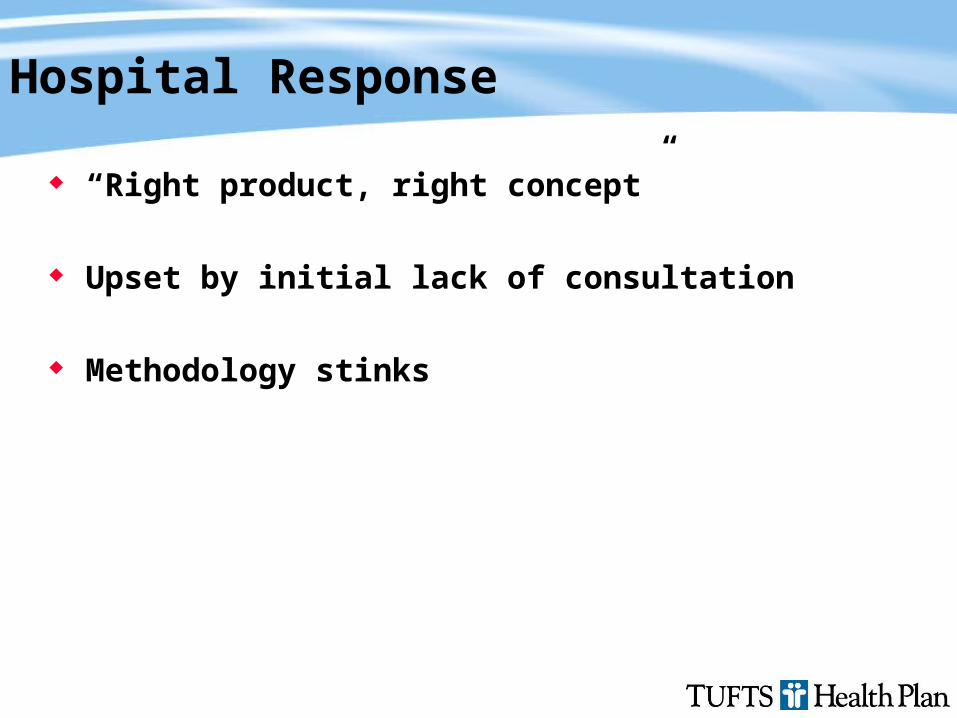
Hospital Response
“Right product, right concept”
Upset by initial lack of consultation
Methodology stinks
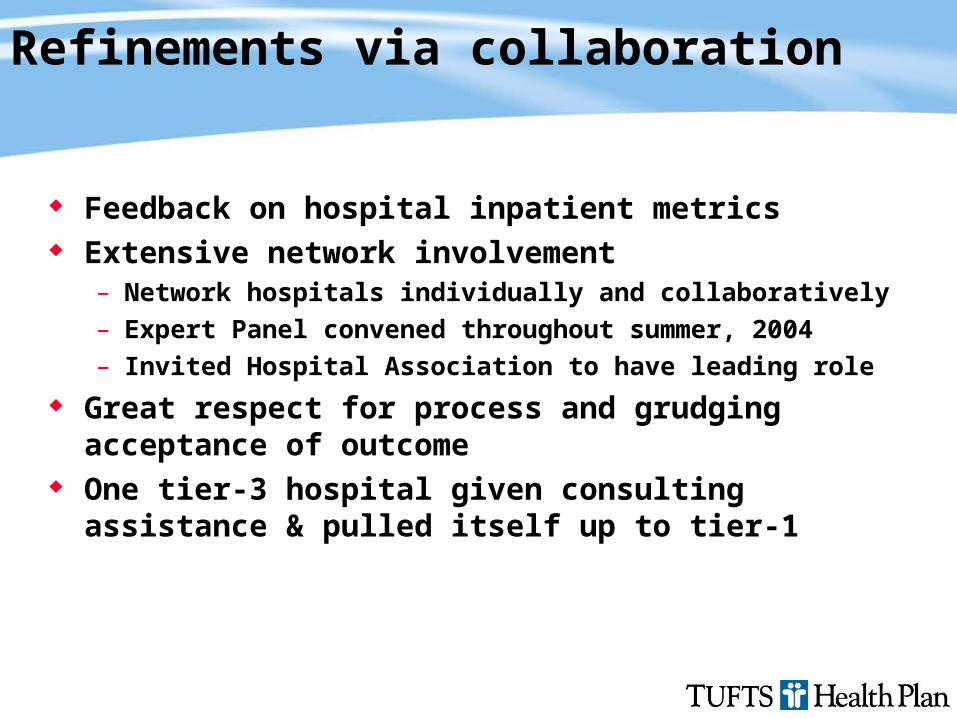
Refinements via collaboration
Feedback on hospital inpatient metrics Extensive network involvement
– Network hospitals individually and collaboratively– Expert Panel convened throughout summer, 2004– Invited Hospital Association to have leading role
Great respect for process and grudging acceptance of outcome
One tier-3 hospital given consulting assistance & pulled itself up to tier-1
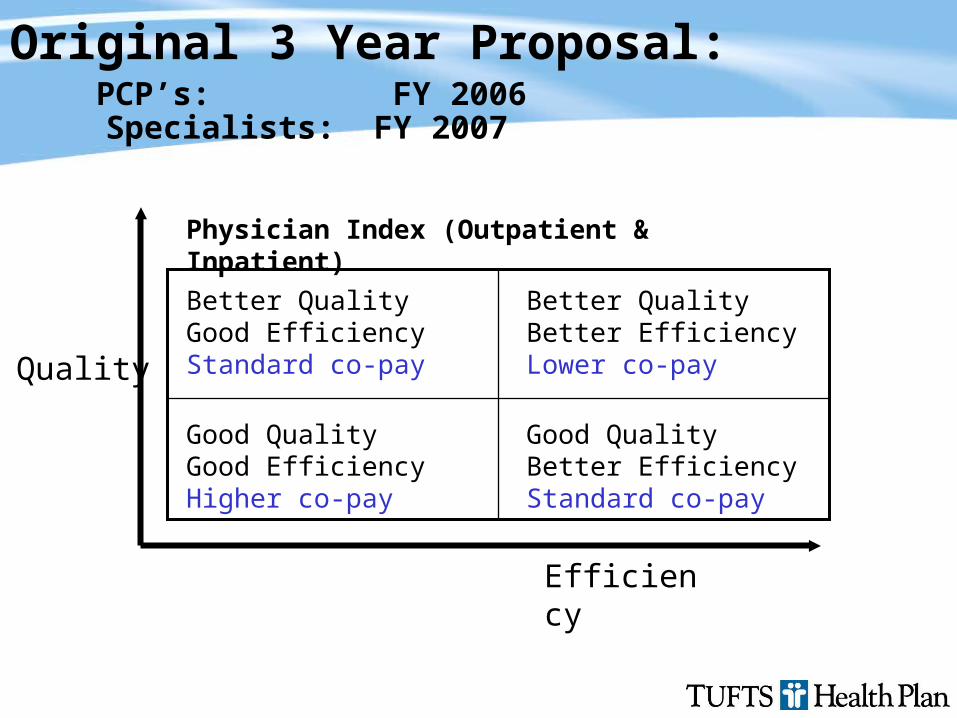
Better QualityGood EfficiencyStandard co-pay
Better QualityBetter EfficiencyLower co-pay
Good QualityGood EfficiencyHigher co-pay
Good QualityBetter EfficiencyStandard co-pay
Physician Index (Outpatient & Inpatient)
Efficiency
Quality
Original 3 Year Proposal: PCP’s: FY 2006 Specialists: FY 2007

Provider Education & Outreach 2.0
PCP ratings development began July, 2005 Began discussion with Central Physicians Committee in Sept.
2004– Review industry trends and Tufts HP strategy related to quality and
efficiency measurement
– Overview of plan design and tiering methodology by Ms. Mitchell Reached out to Massachusetts Medical Society Physician Quality Measurement Expert Advisory Panel
empowered to help define quality and efficiency metrics in conjunction with Central Physicians Committee
Value-based ratings using cost (episodes of care) and quality (HEDIS & patient satisfaction)
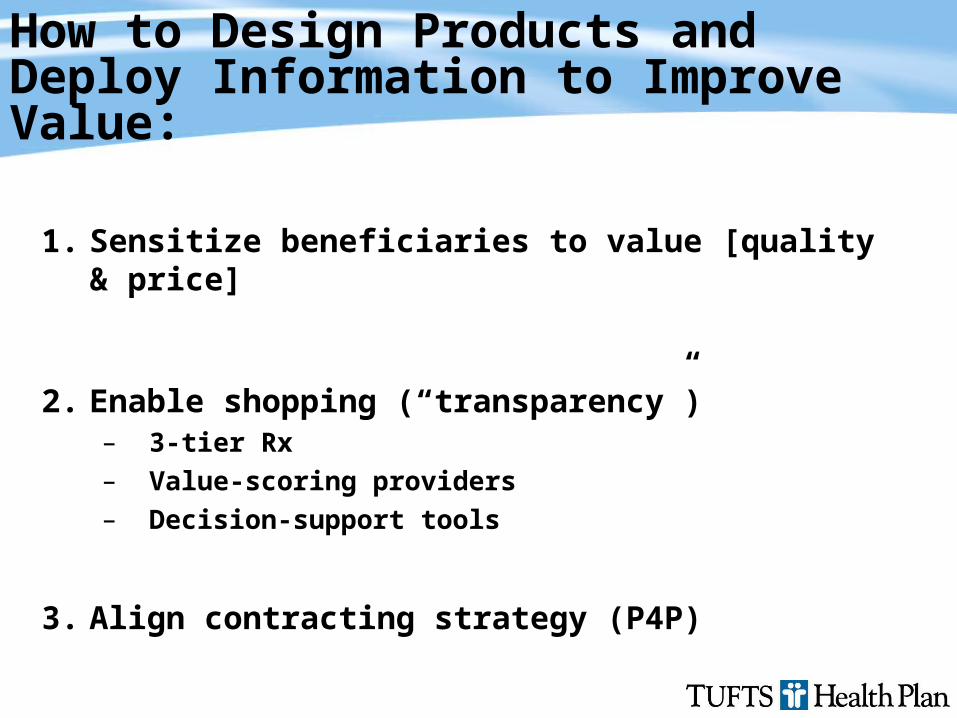
1. Sensitize beneficiaries to value [quality & price]
2. Enable shopping (“transparency”)– 3-tier Rx– Value-scoring providers– Decision-support tools
3. Align contracting strategy (P4P)
How to Design Products and Deploy Information to Improve Value:
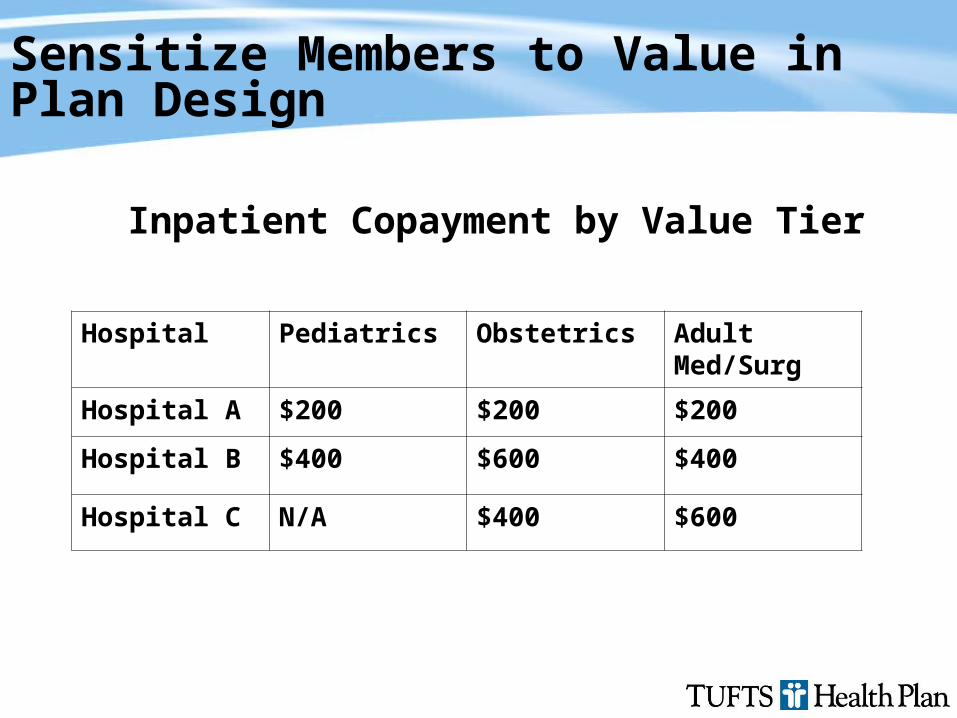
Sensitize Members to Value in Plan Design
Hospital Pediatrics Obstetrics Adult Med/Surg
Hospital A $200 $200 $200
Hospital B $400 $600 $400
Hospital C N/A $400 $600
Inpatient Copayment by Value Tier
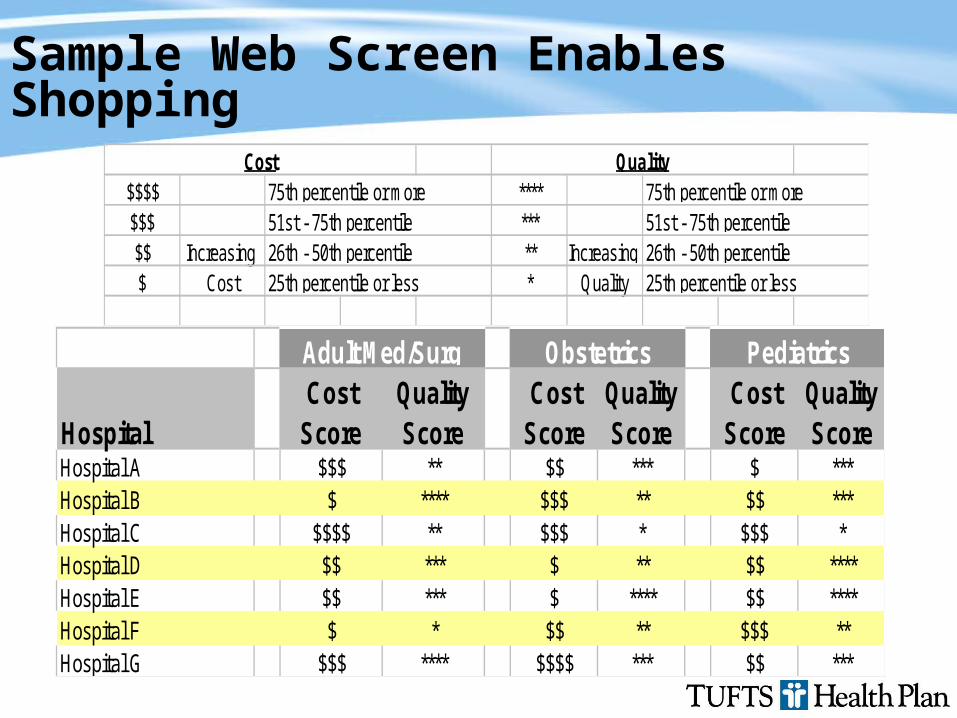
Sample Web Screen Enables Shopping
$$$$ ****$$$ ***$$ Increasing ** Increasing $ Cost * Quality
75th percentile or more
25th percentile or less
QualityCost75th percentile or more51st - 75th percentile26th - 50th percentile
25th percentile or less26th - 50th percentile51st - 75th percentile
HospitalCost
ScoreQualityScore
CostScore
QualityScore
CostScore
QualityScore
Hospital A $$$ ** $$ *** $ ***Hospital B $ **** $$$ ** $$ ***Hospital C $$$$ ** $$$ * $$$ *Hospital D $$ *** $ ** $$ ****Hospital E $$ *** $ **** $$ ****Hospital F $ * $$ ** $$$ **Hospital G $$$ **** $$$$ *** $$ ***
Adult Med/Surg Obstetrics Pediatrics
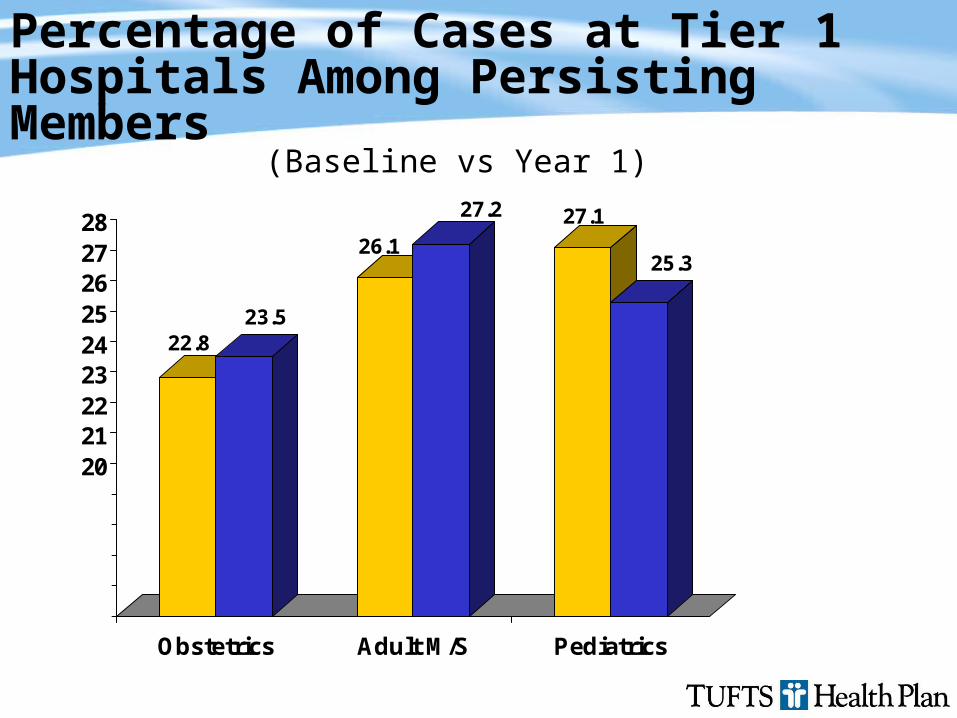
Percentage of Cases at Tier 1 Hospitals Among Persisting Members
22.823.5
26.1
27.2 27.1
25.3
1516171819202122232425262728
Obstetrics Adult M/S Pediatrics
(Baseline vs Year 1)
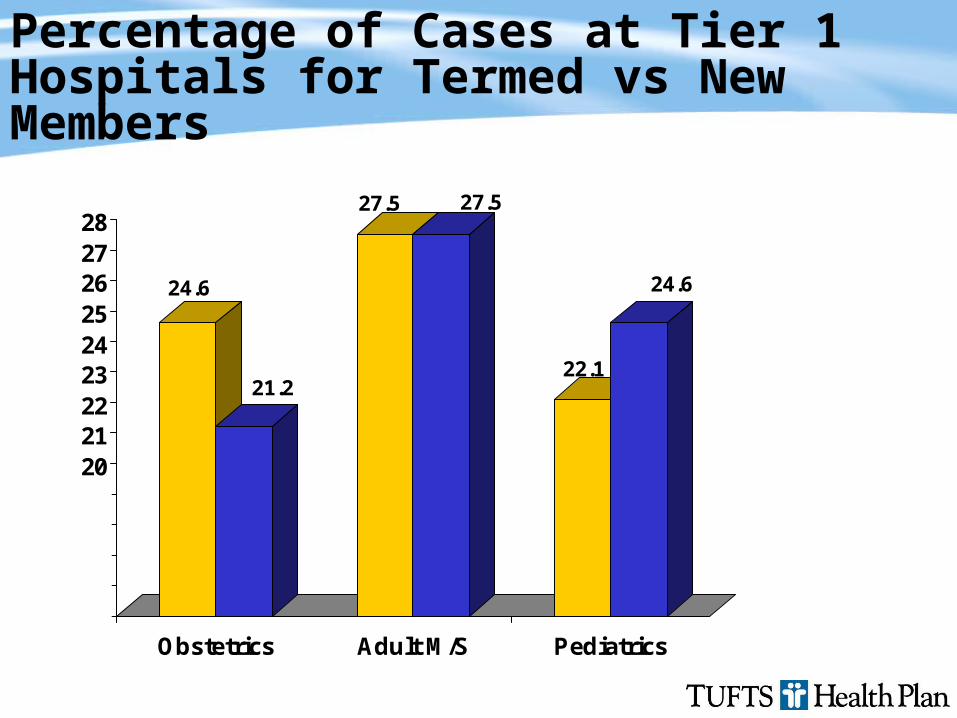
Percentage of Cases at Tier 1 Hospitals for Termed vs New Members
24.6
21.2
27.5 27.5
22.1
24.6
1516171819202122232425262728
Obstetrics Adult M/S Pediatrics
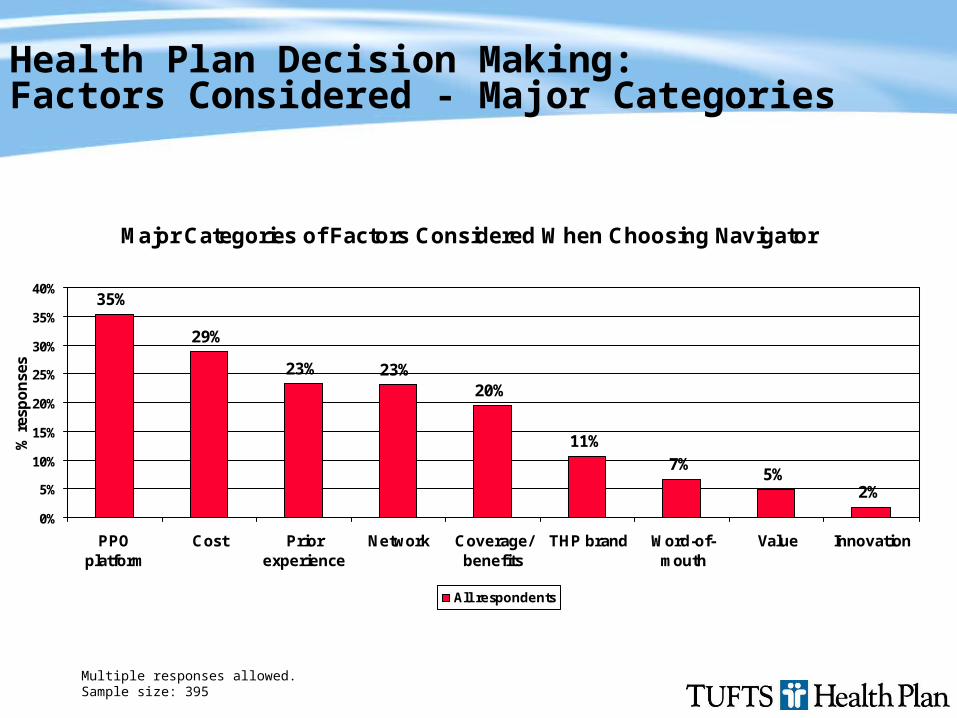
Health Plan Decision Making:Factors Considered - Major Categories
Major Categories of Factors Considered When Choosing Navigator
35%
29%
23% 23%20%
11%7%
5%2%
0%
5%
10%
15%
20%
25%
30%
35%
40%
PPOplatform
Cost Priorexperience
Network Coverage/benefits
THP brand Word-of-mouth
Value Innovation
% r
esp
on
ses
All respondents
Multiple responses allowed.Sample size: 395
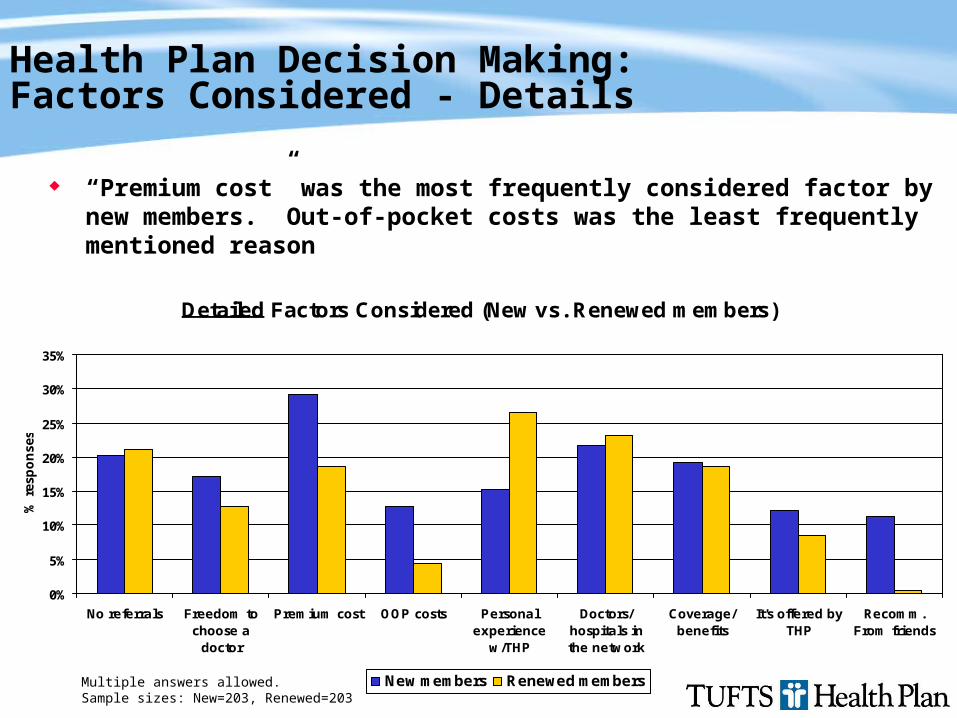
Health Plan Decision Making: Factors Considered - Details
“Premium cost” was the most frequently considered factor by new members. Out-of-pocket costs was the least frequently mentioned reason
Multiple answers allowed.Sample sizes: New=203, Renewed=203
Detailed Factors Considered (New vs. Renewed members)
0%
5%
10%
15%
20%
25%
30%
35%
No referrals Freedom tochoose a
doctor
Premium cost OOP costs Personalexperience
w/THP
Doctors/hospitals inthe network
Coverage/benefits
It's offered byTHP
Recomm.From friends
% r
esp
on
ses
New members Renewed members
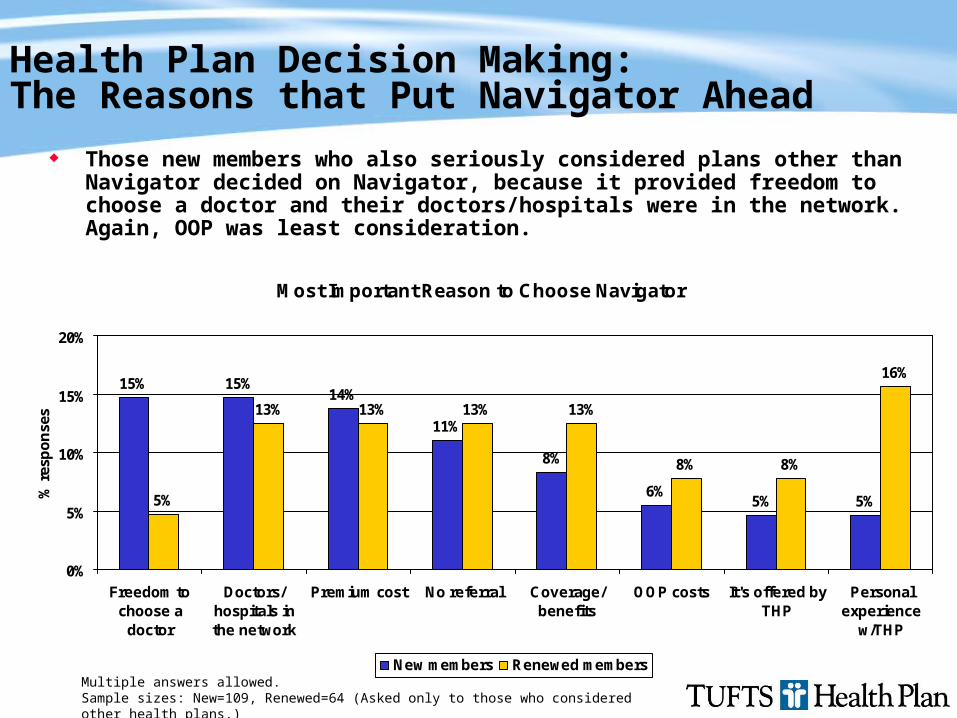
Health Plan Decision Making: The Reasons that Put Navigator Ahead
Those new members who also seriously considered plans other than Navigator decided on Navigator, because it provided freedom to choose a doctor and their doctors/hospitals were in the network. Again, OOP was least consideration.
Multiple answers allowed.Sample sizes: New=109, Renewed=64 (Asked only to those who considered other health plans.)
Most Important Reason to Choose Navigator
15% 15%14%
11%
8%
6%5% 5%5%
13% 13% 13% 13%
8% 8%
16%
0%
5%
10%
15%
20%
Freedom tochoose a
doctor
Doctors/hospitals inthe network
Premium cost No referral Coverage/benefits
OOP costs It's offered byTHP
Personalexperience
w/THP
% r
esp
on
ses
New members Renewed members
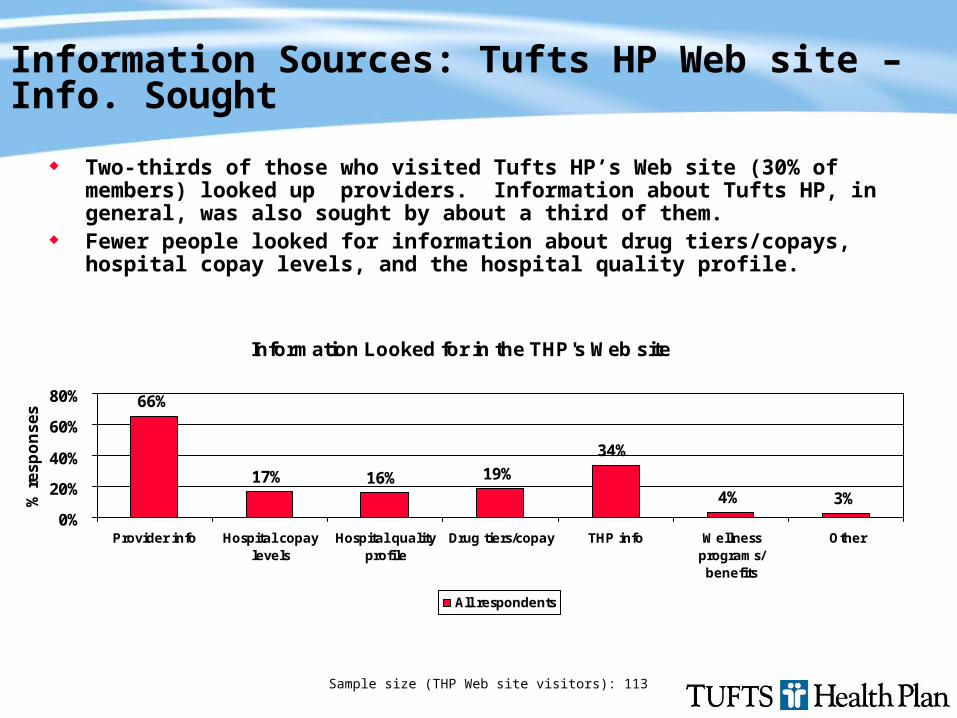
Information Sources: Tufts HP Web site – Info. Sought
Two-thirds of those who visited Tufts HP’s Web site (30% of members) looked up providers. Information about Tufts HP, in general, was also sought by about a third of them.
Fewer people looked for information about drug tiers/copays, hospital copay levels, and the hospital quality profile.
Information Looked for in the THP's Web site
66%
17% 16% 19%
34%
4% 3%0%
20%
40%
60%
80%
Provider info Hospital copaylevels
Hospital qualityprofile
Drug tiers/copay THP info Wellnessprograms/benefits
Other
% r
es
po
ns
es
All respondents
Sample size (THP Web site visitors): 113
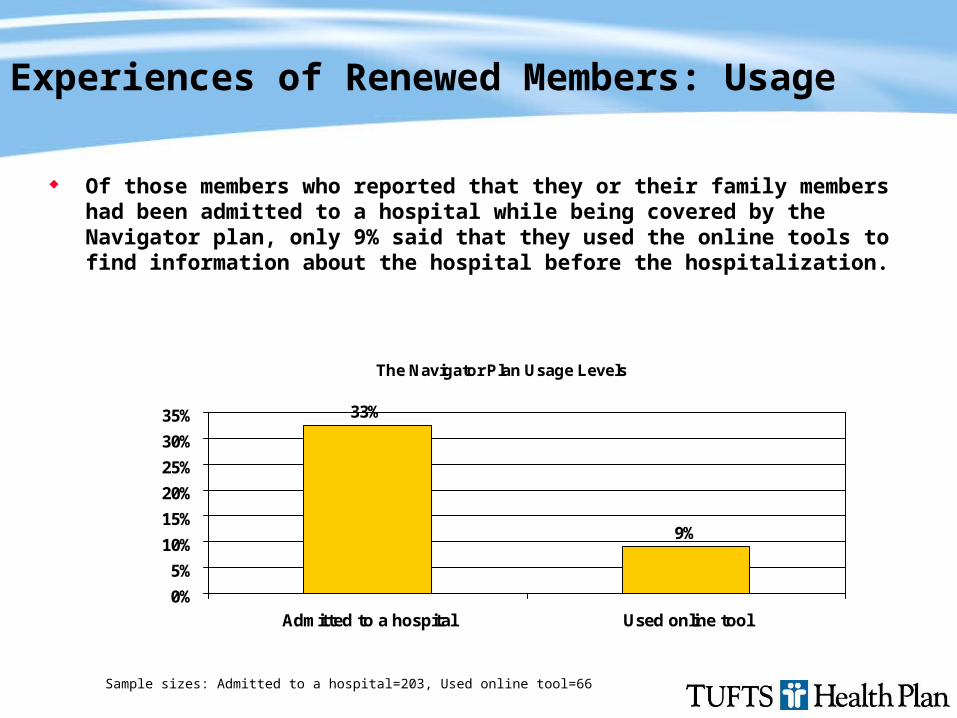
Experiences of Renewed Members: Usage
Of those members who reported that they or their family members had been admitted to a hospital while being covered by the Navigator plan, only 9% said that they used the online tools to find information about the hospital before the hospitalization.
The Navigator Plan Usage Levels
33%
9%
0%
5%
10%
15%
20%
25%
30%
35%
Admitted to a hospital Used online tool
Sample sizes: Admitted to a hospital=203, Used online tool=66

Experiences of Renewed Members: Satisfaction
89% of renewed members completely/very satisfied with the Navigator plan 77% of renewed members completely/very satisfied in 2005 CAHPS survey Satisfaction score of those Navigator members who were admitted was slightly lower than for members without such an experience. This
finding is consistent with results from other studies, which find that healthier members tend to be more satisfied.
Sample sizes: Overall=203, Hospital-Yes=66, No=137, Online: Yes=6, No=60
Satisfaction with the Navigator
89% 85% 83%91%
85%
0%
20%
40%
60%
80%
100%
Overall Admitted to a hospital Used Online tool
% C
om
ple
tely
/ver
y sa
tisf
ied
Yes
No
Completely/very/somewhat satisfied = 96.6%
Summary
Because of direct influence on providers and the providers’ influence on members, credibility of metrics is crucial
Collaboration with providers to develop “value-based” metrics is key process step
Provider response has been great respect for process and grudging acceptance of metrics & product
Early member response to metrics & copay tiering is marginal, but change on the margin may suffice