PAY AND ALLOWANCES 2013-14 - doe.gov.in · regular basis. The Report also contains information on...
41
ºÉiªÉàÉä´É VɪÉiÉä GOVERNMENT OF INDIA ANNUAL REPORT ON PAY AND ALLOWANCES OF CENTRAL GOVERNMENT CIVILIAN EMPLOYEES 2013-14 PAY RESEARCH UNIT DEPARTMENT OF EXPENDITURE MINISTRY OF FINANCE NEW DELHI For official use only
Transcript of PAY AND ALLOWANCES 2013-14 - doe.gov.in · regular basis. The Report also contains information on...

ºÉiªÉàÉä´É VɪÉiÉä
GOVERNMENT OF INDIA
ANNUAL REPORT
ON
PAY AND ALLOWANCES
OF
CENTRAL GOVERNMENT CIVILIAN EMPLOYEES
2013-14
PAY RESEARCH UNITDEPARTMENT OF EXPENDITURE
MINISTRY OF FINANCENEW DELHI
For official use only
PRINTED AT BUDGET PRESS, MINISTRY OF FINANCE, NEW DELHI

PREFACE
Department of Expenditure, Ministry of Finance is the nodal Department for pay and
allowances of all Central Government employees. The Pay Research Unit of the Department
of Expenditure brings out a report on pay and allowances of Central Government civilian
employees on an annual basis. The Annual Report for 2013-14 provides statistical information
on expenditure incurred by different Ministries/Departments of the Central Government on
Pay and Allowances including Dearness Allowance, House Rent Allowance, Transport
Allowance, Overtime Allowance etc. in respect of its employees who are holding posts on
regular basis. The Report also contains information on the group-wise number of sanctioned
posts and employees in position in various Ministries/Departments.
2. The data in the Report has been compiled on the basis of quarterly returns on
expenditure on pay and allowances and annual returns on staff strength furnished by the
Central Government Ministries/Departments to the Pay Research Unit of this Department.
In some cases, Ministries/Departments furnish unreconciled data or no data at all. In such
cases, the data is estimated on the basis of data of previous years and information contained
in Expenditure Budget document.
3. The Report may be useful for personnel planning and preparation of estimates of
financial implications concerning pay and allowances of Central Government employees.
While all efforts have been made to present the data in a meaningful manner, suggestions
for further improvement would be welcome.
4. Ministry of Finance would like to thank all the Central Government Ministries/
Departments for their cooperation in furnishing the data, without which this compilation would
not have been possible. This Ministry would also like to acknowledge the contribution of the
National Informatics Centre (North Block), New Delhi.
(Annie George Mathew)Joint Secretary(Pers.)
Department of ExpenditureMinistry of Finance
August, 2015New Delhi.
PROJECT STAFF
Name Designation
Smt. Renu Sarin Deputy Secretary
Ms. Ritu Assistant Director
Shri A. K. Puri Research Assistant
Smt. Pushp Lata Jr. Research Assistant
Smt. Simmi Takkar Computor
Shri Umesh Kumar Saini Computor
CHAPTER – I
i. Salient Features
CHAPTER - II
Total Expenditure
ii. Total expenditure on pay & allowances of Central Government civilian employees including employees
of UTs
iii. Total expenditure on pay and allowances of Central Government civilian employees including
employees of the Union Territories as percentage of Revenue Receipts and Revenue Expenditure
CHAPTER-III
Components of Expenditure
iv. Share of major components in total expenditure of Central Government civilian employees including
employees of UTs during last three years
v. Expenditure on major components of pay and allowances of Central Government civilian employees
including employees of UTs
vi. Expenditure on major components of pay and allowances of Central Government civilian employees
(excluding employees of UTs) including Mission Abroad
vii. Component-wise break up of expenditure on pay and allowances of the Central Government civilian
employees including employees of UTs during last three years
viii. Percentage distribution of expenditure incurred on different components of pay and allowances of
Central Government employees including employees of UTs during 2013-14
ix. Component-wise break up of expenditure on pay and allowances of the Central Government civilian
employees including Missions Abroad (excluding employees of UTs) during last three years
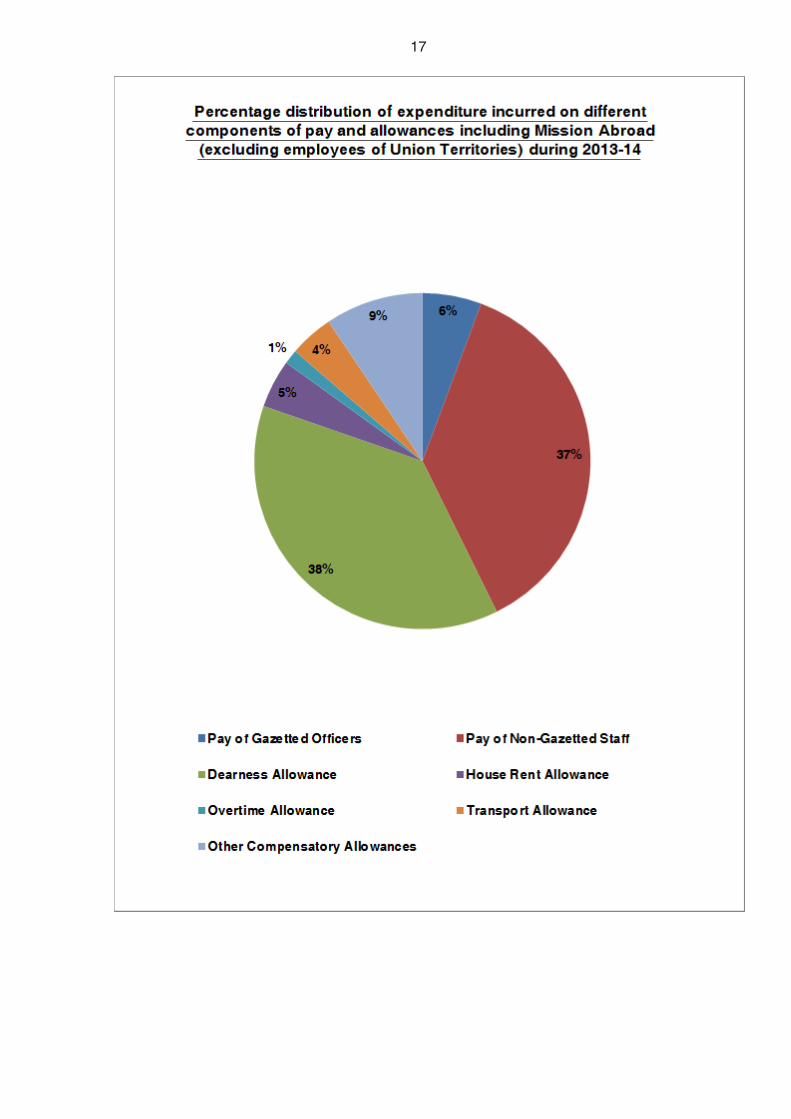
x. Percentage distribution of expenditure incurred on different components of pay and allowances
including Mission Abroad (excluding employees of UTs) during 2013-14
xi. Expenditure on House Rent Allowance(HRA) of Central Government civilian employees including
employees of Union Territories and rates of HRA and Transport Allowance
CHAPTER-IV
Expenditure of Major Ministries/Departments on Pay and Allowances
xii. Total expenditure on pay and allowances and expenditure of major Ministries/Departments during
last three years
CONTENTS
3-4
7
8
11
12
13
14
15
16
17
18
21

22
23
24
25
25
26
26
27
27
28-30
33
34
35
36
37-39
43
xiii. Share of major Ministries/Departments in total expenditure during last three years
xiv. Component-wise break up of expenditure on pay and allowances of the employees of other
departments excluding employees of UTs, Ministries/Departments of Railways, Defence, Posts,
Home Affairs and Missions Abroad
xv. Percentage distribution of expenditure incurred on different components of pay and allowances
excluding UTs, Railways, Defence, Posts, Home Affairs and Mission Abroad during 2013-14
xvi. Expenditure on pay and allowances of the employees of Ministry of Railways
xvii. Expenditure on pay and allowances of the civilian employees of Ministry of Defence (Civil)
xviii. Expenditure on pay and allowances of the employees of Department of Posts
xix. Expenditure on pay and allowances of the employees of Ministry of Home Affairs
xx. Expenditure on pay and allowances of employees of UTs Administrations
xxi. Expenditure on pay and allowances of regular employees and local recruits in Indian Missions
Abroad
xxii. Expenditure incurred on pay and allowances by the central Ministries/Departments on civilian
employees during 2013-14
CHAPTER-V
Sanctioned Strength and Employees in Position in Central Governmnt as on 1.3.2013
xxiii. Distribution of regular civilian employees (Group-wise) in Central Government and UTs Administration
as on 1.3.2013
xxiv. Group-wise number of sanctioned posts and incumbents in position, vacancies and their percentages
to total sanctioned posts as on 1.3.2013
xxv. Group-wise and status-wise estimated number of Central Government civilian regular employees
as on 1.3.2013 in major Ministries/Departments (excluding UTs)
xxvi. Strength (Number of sanctioned posts and number of employees in position) of Central Police Forces
xxvii. Group-wise and status-wise (Gazetted/Non-Gazetted) estimated number of Central Government
civilian regular employees as on 1.3.2013
CHAPTER – VI
All India Consumer Price Index up to 1.3.2014
xxviii. All india working class Consumer Price Index (CPI) number for industrial workers(base 2001=100)-
12 monthly average and percentage increase over 115.76 (12 monthly average of price index from
Jan 2005 to Dec 2005) points
(ii)

CHAPTER – I
Salient Features
SALIENT FEATURES
1. The total expenditure on Pay and Allowances (excluding Productivity Linked Bonus/Ad-hoc Bonus, Honorarium, Encashment of Earned Leave and Travelling Allowance) forRegular Central Government Civilian employees including employees of the Union Territorieswas `̀̀̀̀ 127074.60 crore in 2013-14 as compared to `̀̀̀̀ 108070.66 crore in 2012-13. Thus,there is an increase in expenditure by `̀̀̀̀ 19003.94 crore over previous year which inrelative terms works out to around 17.58%.
2. The total expenditure on Pay and Allowances as a percentage of Revenue Receiptsand Revenue Expenditure of the Central Government during the financial year 2013-14was 10.43% and 8.07% as compared to 10.23% and 7.60% respectively during the financialyear 2012-13.
3. Out of the total expenditure of `̀̀̀̀ 127074.60 crore, the percentage expenditure onPay, Dearness Allowance (DA), House Rent Allowance (HRA) and other allowances isaround 42.70%, 37.61%, 4.64% and 15.05% respectively.
4. The expenditure on Pay, DA, HRA, Transport Allowance, Children EducationAllowance (CEA), Reimbursement of Medical charges in 2013-14 has increased by around4.84%, 40.90%, 3.59%, 6.55%, 25.57%, 18.03% respectively as compared to thecorresponding expenditure of the previous year.
5. Out of the total expenditure of `̀̀̀̀ 5890.63 crore on HRA in 2013-14, the HRAexpenditure for X class cities is `̀̀̀̀ 2541.55 crore which is around 43.14% of the totalexpenditure on HRA.
6. Almost 85% of the total expenditure was incurred by five major Ministries/Departments (Railways, Defence (Civil), Home Affairs, Post and Revenue) during2013-14.
7. Of the total expenditure on Pay and Allowances in 2013-14, the Ministry of Railwayscontinues to have the largest share i.e. 36.60%, marginally increased from 35.68% in2012-13. Share of Ministry of Home Affairs and Department of Posts has increased from23.24% to 23.98% and from 7.53% to 8.09% respectively. Share of Ministry of Defence(Civil) has decreased from the previous year i.e. from 13.42% to 12.16%. Share of otherdepartments has slightly decreased from 20.13% to 19.17%.
8. The expenditure of UT administrations is `̀̀̀̀ 2757.40 crore in 2013-14 as comparedto `̀̀̀̀ 2436.87 crore in 2012-13. Thus, there is an increase in expenditure by `̀̀̀̀ 320.53 croreover previous year which in relative terms works out to around 13.15%.
3

9. The expenditure of Indian Missions/ Embassies abroad is `̀̀̀̀ 1030.42 crore in2013-14 as compared to ̀̀̀̀̀ 874.08 crore in 2012-13. Thus, there is an increase in expenditureby Rs. 156.34 crore over previous year which in relative terms works out to around 17.88%.
10. As on 01.03.2013 the total number of Regular Central Government CivilianEmployees in position was 31.14 lakh against the sanctioned strength of 37.16 lakh andapproximately 16.20% of the posts were vacant.
11. Almost 91% of the total manpower is covered by five major Ministries/ Departmentsviz. Railways, Defence (Civil), Home Affairs, Post and Revenue. Of the total strength of31.14 lakh, the percentage share of the Railways is 41.99%, Home Affairs is 27.99%,Defence (Civil) is 11.84%, Posts is 6.51% and all other Ministries/ Departments is around11.71%.
12. Against the sanctioned strength of 9.08 lakh in Central Police Forces, 8.39 lakhemployees were in position as on 1.3.2013. In Union Territories (UTs), 66413 employeeswere in position as on 01.03.2013.
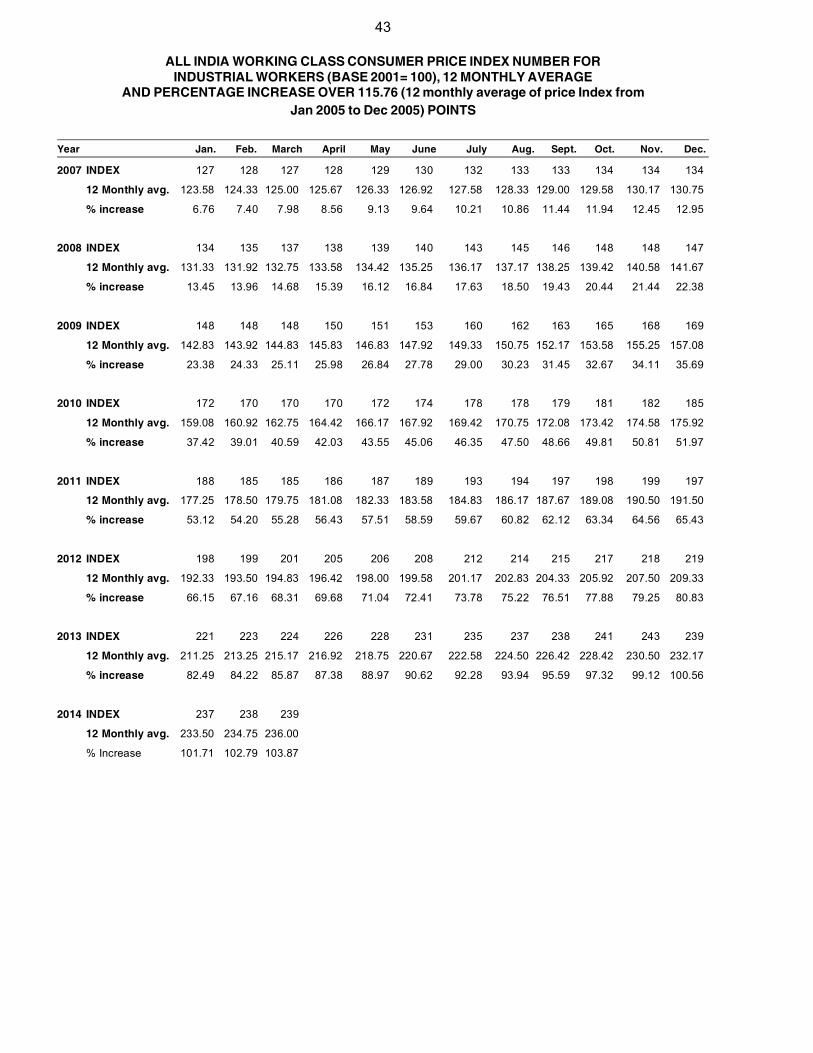
13. Consumer Price Index (CPI) Number for Industrial Worker (Base 2001=100) hasregistered an increase of 103.87% over 115.76 (12 monthly average of price index fromJanuary 2005 to December 2005) points up to March 2014.
*****
4

CHAPTER – II
Total Expenditure

7
Note: (i) This does not include the expenditure incurred on Travelling Allowance, Productivity LinkedBonus/Ad hoc Bonus, Honorarium and Encashment of Earned Leave.
TOTAL EXPENDITURE ON PAY AND ALLOWANCES OF THE CENTRAL GOVERNMENT CIVILIANEMPLOYEES INCLUDING EMPLOYEES OF UNION TERRITORIES
YEAR Expenditure Percentage Increase(`̀̀̀̀ in crore) (Over Previous Year)
2011-12 95291.27 7.49
2012-13 108070.66 13.41
2013-14 127074.60 17.58

8
TOTAL EXPENDITURE ON PAY AND ALLOWANCES OF CENTRAL GOVERNMENT CIVILIANEMPLOYEES INCLUDING EMPLOYEES OF THE UNION TERRITORIES AS PERCENTAGE
OF REVENUE RECEIPTS AND REVENUE EXPENDITURE
( `̀̀̀̀ in crore)
Year Expenditure on Pay and Revenue Receipits Revenue Expenditure Expenditure on pay andAllowances of Civilian of the Central of the Central Allowances as percentage ofEmployees of Central Government GovernmentGovernment & Union Revenue Revenue
Territories Receipts Expenditure
2011-12 95291 910556 1305195 10.47 7.30
2012-13 108070 1055891 1422087 10.23 7.60
2013-14 127075 1217799 1575097 10.43 8.07
Note: The above figures of the revenue receipts & expenditure have been taken from Annual Financial Statementof the Central Government as laid before the Parliament. The figures of receipts & expenditure includesRailways also.

CHAPTER – III
Components of Expenditure

11
Note: (i) This does not include the expenditure incurred on Travelling Allowance, Productivity Linked Bonus/Adhoc Bonus, Honorarium and Encashment of Earned Leave.
(ii) Other Allowances include OTA, Transport Allowance, Special Pay and Deputation (Duty) Allowance,CEA, Reimbursement of Medical Charges, Leave Travel Concession and Other CompensatoryAllowances.
SHARE OF MAJOR COMPONENTS IN TOTAL EXPENDITURE OF CENTRAL GOVERNMENTCIVILIAN EMPLOYEES INCLUDING EMPLOYEES OF UNION TERRITORIES
DURING THE LAST THREE YEAR
(Expressed as percentage to total)
Year Pay DA HRA Other TotalAllowances
2011-12 51.93 28.52 5.88 13.67 100.00
2012-13 47.89 31.39 5.26 15.46 100.00
2013-14 42.70 37.61 4.64 15.05 100.00

12
Note: (i) This does not include the expenditure incurred on Travelling Allowance, Productivity Linked Bonus/Adhoc Bonus, Honorarium and Encashment of Earned Leave.
(ii) Other Allowances include HRA, OTA, Transport Allowance, Special Pay and Deputation (Duty) Allowance,CEA, Reimbursement of Medical Charges, Leave Travel Concession and Other CompensatoryAllowances.
EXPENDITURE ON MAJOR COMPONENTS OF PAY AND ALLOWANCES OF THE CENTRALGOVERNMENT CIVILIAN EMPLOYEES INCLUDING EMPLOYEES OF UNION TERRITORIES
(`̀̀̀̀ in crore)
Year Pay DA Other Allowances Total
2011-12 49486.65 27176.04 18628.58 95291.27
2012-13 51751.54 33922.09 22397.03 108070.66
2013-14 54257.94 47797.04 25019.62 127074.60
13
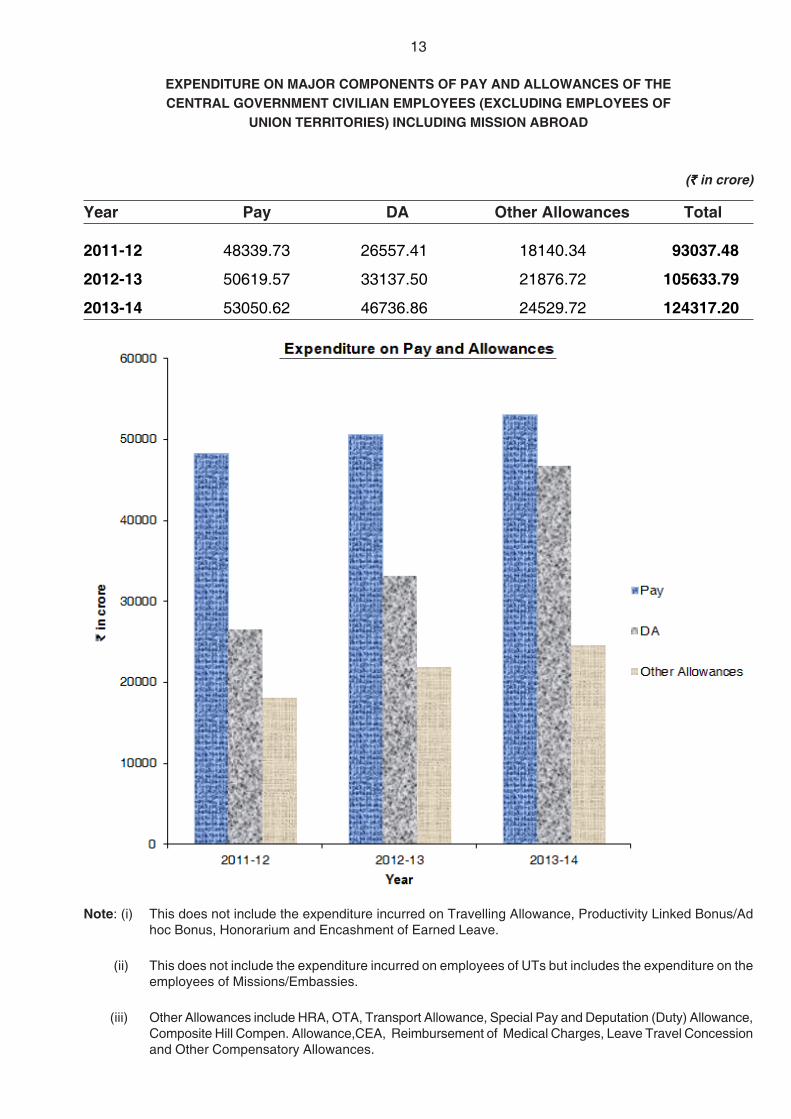
Note: (i) This does not include the expenditure incurred on Travelling Allowance, Productivity Linked Bonus/Adhoc Bonus, Honorarium and Encashment of Earned Leave.
(ii) This does not include the expenditure incurred on employees of UTs but includes the expenditure on theemployees of Missions/Embassies.
(iii) Other Allowances include HRA, OTA, Transport Allowance, Special Pay and Deputation (Duty) Allowance,Composite Hill Compen. Allowance,CEA, Reimbursement of Medical Charges, Leave Travel Concessionand Other Compensatory Allowances.
EXPENDITURE ON MAJOR COMPONENTS OF PAY AND ALLOWANCES OF THECENTRAL GOVERNMENT CIVILIAN EMPLOYEES (EXCLUDING EMPLOYEES OF
UNION TERRITORIES) INCLUDING MISSION ABROAD
(`̀̀̀̀ in crore)
Year Pay DA Other Allowances Total
2011-12 48339.73 26557.41 18140.34 93037.48
2012-13 50619.57 33137.50 21876.72 105633.79
2013-14 53050.62 46736.86 24529.72 124317.20

14
COMPONENT-WISE BREAK UP OF EXPENDITURE ON PAY AND ALLOWANCESOF THE CENTRAL GOVERNMENT CIVILIAN EMPLOYEES INCLUDING EMPLOYEES
OF UNION TERRITORIES DURING THE LAST THREE YEARS
(`̀̀̀̀ in crore)
S.No. Pay/Allowances 2011-12 2012-13 2013-14
(1) (2) (3) (4) (5)
1 Pay of Gazetted Officers 6609.79 7029.29 7221.31
2 Pay of Non-Gazetted Staff 42876.86 44722.25 47036.63
3 Dearness Allowance 27176.04 33922.09 47797.04
Sub-Total (i) 76662.69 85673.63 102054.98
1 House Rent Allowance 5598.86 5686.53 5890.63
2 Overtime Allowance 1238.80 1629.09 1758.17
3 Transport Allowance 4410.86 5049.61 5380.60
4 Spl. Pay & Deput. (Duty) Allowance 159.53 177.05 174.34
5 Composite Hill Compen. Allowance 141.45 157.14 161.19
6 Children Education Allowance 1149.97 1422.29 1785.92
7 Reimbursement of Medical Charges 619.68 718.20 847.68
8 Leave Travel Concession 618.93 794.43 849.79
9 Other Compensatory Allowances 4690.50 6762.69 8171.30
Sub-Total (ii) 18628.58 22397.03 25019.62
Grand Total (i) + (ii) 95291.27 108070.66 127074.60
Travelling Allowance 3459.07 3529.76 3470.78
Note: This does not include the expenditure incurred on Productivity Linked Bonus/Ad hoc Bonus, Honorariumand Encashment of Earned Leave.

15

16
COMPONENT-WISE BREAK UP OF EXPENDITURE ON PAY AND ALLOWANCESOF THE CENTRAL GOVERNMENT CIVILIAN EMPLOYEES INCLUDING MISSION ABROAD
(EXCLUDING EMPLOYEES OF UNION TERRITORIES) DURING THE LAST THREE YEARS
(`̀̀̀̀ in crore)
S.No. Pay/Allowances 2011-12 2012-13 2013-14
(1) (2) (3) (4) (5)
1 Pay of Gazetted Officers 6297.20 6720.87 6893.34
2 Pay of Non-Gazetted Staff 42042.53 43898.70 46157.28
3 Dearness Allowance 26557.41 33137.50 46736.86
Sub-Total (i) 74897.14 83757.07 99787.48
1 House Rent Allowance 5478.47 5560.38 5755.33
2 Overtime Allowance 1222.02 1595.06 1741.89
3 Transport Allowance 4369.52 5004.94 5332.34
4 Spl. Pay & Deput. (Duty) Allowance 156.40 173.76 170.56
5 Composite Hill Compen. Allowance 141.45 155.32 161.19
6 Children Education Allowance 1144.35 1416.68 1780.11
7 Reimbursement of Medical Charges 599.34 691.49 816.79
8 Leave Travel Concession 605.33 777.90 831.76
9 Other Compensatory Allowances 4423.46 6501.19 7939.75
Sub-Total (ii) 18140.34 21876.72 24529.72
Grand Total (i) + (ii) 93037.48 105633.79 124317.20
Travelling Allowance 3428.96 3499.26 3442.14
Note: (i) This does not include the expenditure incurred on Productivity Linked Bonus/Adhoc Bonus, Honorarriumand Enchashment of Earned Leave.
(ii) This does not include the expenditure incurred on employees of UTs but includes the expenditure on theemployees of Missions/Embassies.
17

18
EXPENDITURE ON HOUSE RENT ALLOWANCE (HRA) OF CENTRAL GOVERNMENT CIVILIANEMPLOYEES INCLUDING EMPLOYEES OF UNION TERRITORIES AND RATES OF
HRA AND TRANSPORT ALLOWANCE
( `̀̀̀̀ in crore)
Class of City Expenditure on House Rent Allowance2013-14
X 2541.55
(43.15)
Y 1787.52
(30.35)
Z 1561.56
(26.50)
Total 5890.63
(100.00)
N.B.: Figures in parentheses are the percentages to the total expenditure on House Rent Allowance.
RATES OF HOUSE RENT ALLOWANCE (w.e.f. 1.9.2008)
Classification of Cities/Towns Rates of HRA as a percentage of(Basic pay+NPA where applicable)
X 30%
Y 20%
Z 10%
RATES OF TRANSPORT ALLOWANCE (w.e.f. 1.9.2008)
Employees drawing grade of pay Rates of Transport Allowance per month in (`̀̀̀̀)
*13 cities previously Other Placesclassified as ‘A-1’/’A’
1. `̀̀̀̀ 5400 & above `̀̀̀̀ 3200+DA `̀̀̀̀ 1600+DA
2. `̀̀̀̀ 4200, `̀̀̀̀ 4600 and `̀̀̀̀ 4800
3. Below `̀̀̀̀ 4200 but drawing pay in the pay band `̀̀̀̀ 1600+DA `̀̀̀̀ 800+DAequal to `̀̀̀̀ 7440 & above
4. Below `̀̀̀̀ 4200 and pay in the pay band below `̀̀̀̀ 7440 `̀̀̀̀ 600+DA `̀̀̀̀ 400+DA
* Ahmedabad (UA), Bangalore (UA), Chennai (UA), Delhi (UA), Greater Mumbai (UA), Hyderabad (UA), Jaipur(UA), Kanpur (UA), Kolkata (UA), Lucknow (UA), Nagpur (UA), Pune (UA) & Surat (UA)

CHAPTER – IV
Expenditure of Major Ministries/Departments on
Pay & Allowances

21
TOTAL EXPENDITURE ON PAY AND ALLOWANCES AND EXPENDITURE OFMAJOR MINISTRIES/DEPARTMENT DURING THE LAST THREE YEARS
(`̀̀̀̀ in crore)
Year All India Railways Defence Posts Home Affairs(Civilian)
2011-12 95291.27 35097.08 13102.38 7343.91 20036.76
2012-13 108070.66 38560.80 14502.22 8143.43 25113.14
2013-14 127074.60 46508.76 15457.64 10276.89 30467.74
Note: Expenditure figure do not include Travelling Allowance, Productivity Linked Bonus/Ad hoc Bonus, Honorariumand Encashment of Earned Leave.

SHARE OF MAJOR MINISTRIES/DEPARTMENTS IN TOTALEXPENDITURE DURING LAST THREE YEARS
(Expressed as percentage to total)
Year Railways Defence Home Posts Other Departments Total(Civilian) Affairs including
Union Territories
2011-12 36.83 13.75 21.03 7.71 20.68 100.00
2012-13 35.68 13.42 23.24 7.53 20.13 100.00
2013-14 36.60 12.16 23.98 8.09 19.17 100.00
22
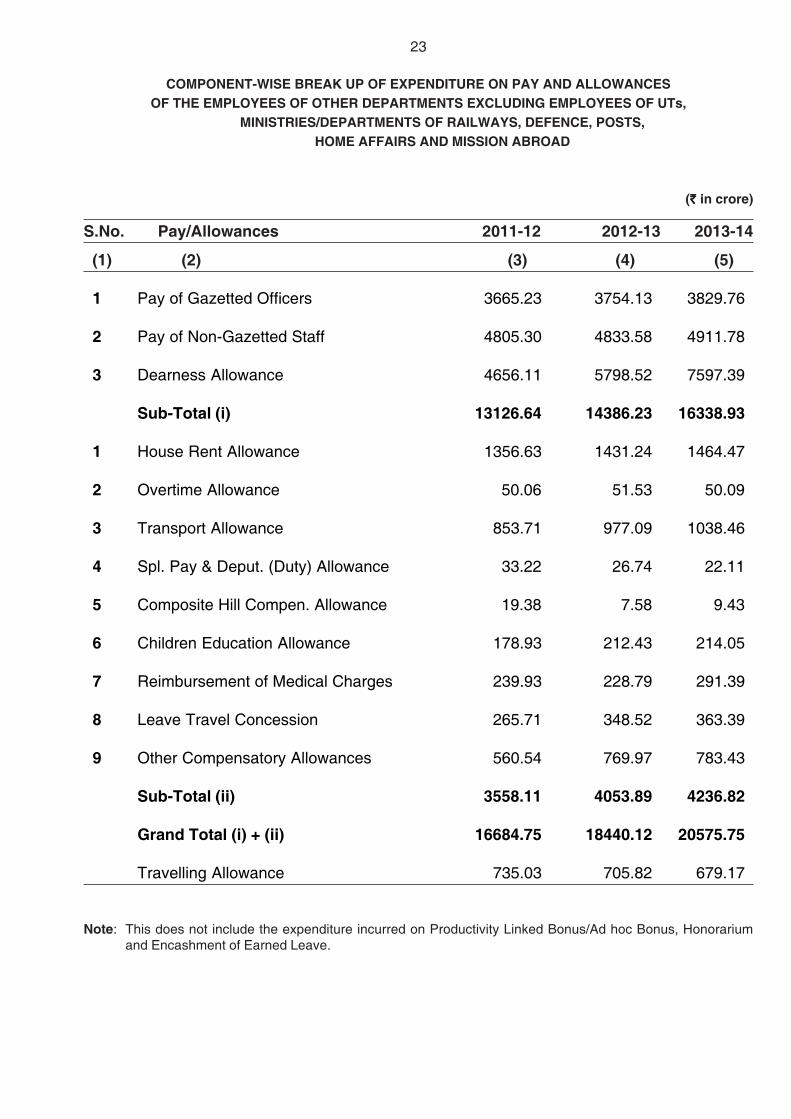
COMPONENT-WISE BREAK UP OF EXPENDITURE ON PAY AND ALLOWANCESOF THE EMPLOYEES OF OTHER DEPARTMENTS EXCLUDING EMPLOYEES OF UTs,
MINISTRIES/DEPARTMENTS OF RAILWAYS, DEFENCE, POSTS,HOME AFFAIRS AND MISSION ABROAD
(`̀̀̀̀ in crore)
S.No. Pay/Allowances 2011-12 2012-13 2013-14
(1) (2) (3) (4) (5)
1 Pay of Gazetted Officers 3665.23 3754.13 3829.76
2 Pay of Non-Gazetted Staff 4805.30 4833.58 4911.78
3 Dearness Allowance 4656.11 5798.52 7597.39
Sub-Total (i) 13126.64 14386.23 16338.93
1 House Rent Allowance 1356.63 1431.24 1464.47
2 Overtime Allowance 50.06 51.53 50.09
3 Transport Allowance 853.71 977.09 1038.46
4 Spl. Pay & Deput. (Duty) Allowance 33.22 26.74 22.11
5 Composite Hill Compen. Allowance 19.38 7.58 9.43
6 Children Education Allowance 178.93 212.43 214.05
7 Reimbursement of Medical Charges 239.93 228.79 291.39
8 Leave Travel Concession 265.71 348.52 363.39
9 Other Compensatory Allowances 560.54 769.97 783.43
Sub-Total (ii) 3558.11 4053.89 4236.82
Grand Total (i) + (ii) 16684.75 18440.12 20575.75
Travelling Allowance 735.03 705.82 679.17
Note: This does not include the expenditure incurred on Productivity Linked Bonus/Ad hoc Bonus, Honorariumand Encashment of Earned Leave.
23

24

25
EXPENDITURE ON PAY AND ALLOWANCES OF THE EMPLOYEES OF M/O RAILWAYS
(` in Crore)
Sl. No. Pay/Allowances 2011-12 2012-13 2013-14
1 2 3 4 5
1 Pay of Gazetted Officers 766.39 850.53 930.842 Pay of Non-Gazetted Staff 17737.22 17716.24 18953.823 Dearness Allowance 9969.56 12147.21 17539.57
Sub-Total (i) 28473.17 30713.98 37424.231 House Rent Allowance 2096.92 2001.18 2179.732 Overtime Allowance 641.19 791.65 987.453 Transport Allowance 1752.03 2088.13 2171.724 Special Pay and Deput.(Duty) Allowance 18.40 16.46 39.965 Composite Hill Compensatory Allowance 0.14 0.13 1.056 Children Education Allowance 377.32 463.06 609.577 Reimbursement of Medical Charges 30.62 37.33 69.928 Leave Travel Concession # 68.47 108.51 136.579 Other Compensatory Allowances 1638.82 2340.37 2888.56
Sub - Total ( ii ) 6623.91 7846.82 9084.53Grand Total ( i ) + ( ii ) 35097.08 38560.80 46508.76Travelling Allowance 1250.29 1272.00 1244.00
# The Employees of Railways get free passes.
EXPENDITURE ON PAY AND ALLOWANCES OF THECIVILIAN EMPLOYEES OF M/O DEFENCE (CIVIL)
(` in Crore)
Sl. No. Pay/Allowances 2011-12 2012-13 2013-2014
1 2 3 4 5
1 Pay of Gazetted Officers 1144.97 1365.83 1246.512 Pay of Non-Gazetted Staff 5490.90 5478.74 5419.393 Dearness Allowance 3642.92 4367.33 5793.93
Sub-Total (i) 10278.79 11211.90 12459.831 House Rent Allowance 917.71 939.12 836.972 Overtime Allowance 508.21 732.73 684.083 Transport Allowance 653.75 698.19 655.674 Special Pay and Deput.(Duty) Allowance 85.70 105.62 85.105 Composite Hill Compensatory Allowance 14.25 16.32 18.876 Children Education Allowance 107.68 126.91 136.987 Reimbursement of Medical Charges 147.76 183.70 165.858 Leave Travel Concession 104.65 119.85 120.849 Other Compensatory Allowances 283.88 367.88 293.45
Sub - Total ( ii ) 2823.59 3290.32 2997.81Grand Total ( i ) + ( ii ) 13102.38 14502.22 15457.64Travelling Allowance 345.57 349.89 320.01

26
EXPENDITURE ON PAY AND ALLOWANCES OF THE EMPLOYEES OFDEPARTMENT OF POSTS
(` in Crore)
Sl. No. Pay/Allowances 2011-12 2012-13 2013-2014 1 2 3 4 5
1 Pay of Gazetted Officers 136.07 154.75 142.452 Pay of Non-Gazetted Staff 3796.64 3734.01 4619.703 Dearness Allowance 2045.41 2663.07 4296.53
Sub-Total (i) 5978.12 6551.83 9058.681 House Rent Allowance 572.92 554.28 516.222 Overtime Allowance 21.72 18.38 18.303 Transport Allowance 392.45 393.69 369.354 Special Pay and Deput.(Duty) Allowance 2.58 2.54 2.805 Composite Hill Compensatory Allowance 4.72 3.56 3.536 Children Education Allowance 62.27 71.12 71.857 Reimbursement of Medical Charges 42.63 53.45 50.538 Leave Travel Concession 33.55 67.63 69.119 Other Compensatory Allowances 232.95 426.95 116.52
Sub - Total ( ii ) 1365.79 1591.60 1218.21Grand Total ( i ) + ( ii ) 7343.91 8143.43 10276.89Travelling Allowance 61.00 60.43 68.72
EXPENDITURE ON PAY AND ALLOWANCES OF THE EMPLOYEES OF MINISTRY OF HOME AFFAIRS
(` in Crore)
Sl. No. Pay/Allowances 2011-12 2012-13 2013-2014
1 2 3 4 5
1 Pay of Gazetted Officers 533.51 545.09 662.262 Pay of Non-Gazetted Staff 10036.92 11959.51 12031.073 Dearness Allowance 5912.23 7763.94 11088.00
Sub-Total (i) 16482.66 20268.54 23781.331 House Rent Allowance 534.29 634.56 757.942 Overtime Allowance 0.84 0.77 1.973 Transport Allowance 717.58 847.84 1097.144 Special Pay and Deput.(Duty) Allowance 16.50 22.40 20.595 Composite Hill Compensatory Allowance 102.96 127.73 128.316 Children Education Allowance 334.13 438.67 619.607 Reimbursement of Medical Charges 94.98 135.65 171.958 Leave Travel Concession 102.88 102.71 104.899 Other Compensatory Allowances 1649.94 2534.27 3784.02
Sub - Total ( ii ) 3554.10 4844.60 6686.41Grand Total ( i ) + ( ii ) 20036.76 25113.14 30467.74Travelling Allowance 892.71 975.97 995.09

27
EXPENDITURE ON PAY AND ALLOWANCES OF THE EMPLOYEESOF UNION TERRITORY ADMINISTRATIONS
(` in Crore)
Sl. No. Pay/Allowances 2011-12 2012-13 2013-2014
1 2 3 4 5
1 Pay of Gazetted Officers 312.59 308.42 327.972 Pay of Non-Gazetted Staff 834.33 823.55 879.353 Dearness Allowance 618.63 784.59 1060.18
Sub-Total (i) 1765.55 1916.56 2267.501 House Rent Allowance 120.39 126.15 135.302 Overtime Allowance 16.78 34.03 16.283 Transport Allowance 41.34 44.67 48.264 Special Pay and Deput. (Duty) Allow. 3.13 3.29 3.785 Children Education Allowance 5.62 5.61 5.816 Reimbursement of Medical Charges 20.34 26.71 30.897 Leave Travel Concession 13.60 16.53 18.038 Other Compensatory Allowances 267.04 263.32 231.55
Sub-Total (ii) 488.24 520.31 489.90Grand Total (i) + (ii) 2253.79 2436.87 2757.40Travelling Allowance 30.11 30.50 28.64
EXPENDITURE ON PAY AND ALLOWANCES OF REGULAR EMPLOYEES AND LOCAL RECRUITS IN INDIAN MISSIONS ABROAD
(` in Crore)
Sl. No. Pay/Allowances 2011-12 2012-13 2013-2014
1 2 3 4 5
INDIA BASED1 Pay of Officers 51.03 50.54 81.522 Pay of Establishment 48.11 37.06 51.65
Sub-total (i) 99.14 87.60 133.171 Foreign Allowance 331.18 397.43 421.442 Children Education Allowance 84.02 104.49 128.063 Home Leave Fares 30.07 30.68 36.964 Reimbursement of Medical Charges 43.42 52.57 67.155 Other Compensatory Allowances 18.15 14.78 28.926 Representational Grant 22.36 26.01 27.79
Sub- Total (ii) 529.20 625.96 710.32
LOCAL RECRUITS
1 Pay 127.44 139.56 169.872 Allowances 16.82 20.96 17.06
Sub-Total (iii) 144.26 160.52 186.93Grand Total (i)+(ii)+(iii) 772.60 874.08 1030.42Travelling Allowance 144.36 135.15 135.15

28
EX
PE
ND
ITU
RE
INC
UR
RE
D O
N P
AY
AN
D A
LLO
WA
NC
ES
BY
TH
E C
EN
TRA
L M
INIS
TRIE
S/D
EP
AR
TME
NTS
ON
CIV
ILIA
N E
MP
LOY
EE
S D
UR
ING
201
3-14
(`
in C
rore
)
Sl.
Min
istr
y/D
epar
tmen
t P
ayD
AH
RA
OTA
TPT
Oth
ers
Tota
lTr
avel
Bon
usH
onor
a-E
ncas
hmen
t
No.
Allo
w.
rium
of E
.L.
12
34
56
78
9 1
0
11
12
13
1A
gric
ultu
ral R
esea
rch
& E
duca
tion
1.52
1.35
0.24
0.00
0.12
0.19
3.42
0.49
0.01
0.01
0.09
2A
gric
ultu
re a
nd C
oope
ratio
n92
.64
81.3
116
.54
0.21
8.82
10.8
421
0.36
10.7
70.
980.
802.
87
3A
nim
al H
usba
ndry
, Dai
ryin
g &
Fis
herie
s54
.08
46.7
56.
471.
407.
006.
4212
2.12
4.03
0.89
0.32
5.21
4A
tom
ic E
nerg
y92
3.60
768.
9194
.40
33.0
196
.19
438.
5323
54.6
446
.84
0.00
0.43
48.0
8
5A
YU
SH
4.10
3.60
0.80
0.01
0.62
0.28
9.41
0.60
0.02
0.01
0.75
6B
io-T
echn
olog
y6.
015.
231.
070.
000.
720.
6113
.64
2.03
0.05
0.02
0.34
7C
abin
et S
ecre
taria
t8.
957.
391.
030.
091.
331.
1819
.97
0.00
0.07
0.12
0.04
8C
hem
ical
s, P
etro
chem
ical
s &
Pha
rmac
eutic
als
8.18
6.78
1.20
0.04
1.27
1.58
19.0
51.
540.
060.
060.
46
9C
ivil
Avi
atio
n29
.76
26.1
34.
770.
024.
651.
0566
.38
4.47
0.23
0.05
0.08
10C
oal
7.52
6.40
1.36
0.02
1.13
1.02
17.4
51.
800.
150.
110.
68
11C
omm
erce
146.
3611
7.66
31.4
40.
2719
.03
24.5
233
9.28
22.3
01.
620.
211.
15
12C
onsu
mer
Affa
irs20
.97
18.4
84.
120.
033.
962.
4850
.04
1.98
0.22
0.03
1.98
13C
orpo
rate
Affa
irs38
.54
33.9
16.
610.
055.
654.
5589
.31
3.15
0.28
0.09
2.37
14C
ultu
re10
8.19
94.7
420
.92
0.48
17.0
121
.32
262.
6612
.16
1.51
2.81
3.02
15D
efen
ce (C
ivil)
6665
.90
5793
.93
836.
9768
4.08
655.
6782
1.09
1545
7.64
320.
0187
.72
2.28
130.
66
16D
evel
opm
ent o
f NE
Reg
ion
6.33
5.83
0.94
0.03
0.64
5.91
19.6
80.
820.
060.
050.
30
17D
isin
vest
men
t1.
701.
390.
240.
000.
220.
183.
733.
350.
010.
020.
12
18D
rinki
ng W
ater
& S
anita
tion
4.02
3.54
0.40
0.02
0.38
0.36
8.72
0.96
0.01
0.00
0.00
19E
arth
Sci
ence
s12
2.80
106.
0419
.03
0.02
16.3
118
.05
282.
258.
401.
410.
148.
16
20E
cono
mic
Affa
irs25
.21
22.0
14.
180.
064.
163.
5659
.18
6.69
0.20
0.39
1.67
21E
nviro
nmen
t & F
ores
ts67
.80
55.0
68.
740.
087.
2113
.77
152.
6618
.17
0.72
0.34
3.05
22E
xpen
ditu
re22
.97
20.2
34.
250.
053.
942.
7154
.15
2.03
0.18
0.07
0.85
23E
xter
nal A
ffairs
*81
.85
70.1
212
.89
0.22
14.0
07.
4118
6.49
38.8
50.
670.
9113
.76
24Fe
rtiliz
ers
8.16
7.19
1.14
0.05
0.99
0.78
18.3
10.
990.
060.
080.
73

29
(` C
rore
)
Sl.
Min
istr
y/D
epar
tmen
t P
ayD
AH
RA
OTA
TPT
Oth
ers
Tota
lTr
avel
Bon
usH
onor
a-E
ncas
hmen
t
No.
Allo
w.
rium
of E
.L.
12
34
56
78
9 1
0
1112
13
25Fi
nanc
ial S
ervi
ces
25.5
222
.79
5.09
0.12
2.24
5.16
60.9
21.
450.
310.
060.
00
26Fo
od &
Pub
lic D
istri
butio
n19
.65
17.8
73.
780.
152.
973.
8648
.28
1.66
0.30
0.30
0.89
27Fo
od P
roce
ssin
g In
dust
ries
4.33
3.81
0.65
0.03
0.63
0.36
9.81
1.90
0.02
0.02
0.51
28H
ealth
& F
amily
Wel
fare
634.
8254
2.39
110.
260.
3074
.63
121.
3714
83.7
714
.86
6.24
0.11
18.1
9
29H
eavy
Indu
stry
5.73
4.75
0.84
0.03
0.89
1.12
13.3
60.
920.
040.
040.
32
30H
ighe
r Edu
catio
n27
.09
24.2
35.
950.
053.
714.
0165
.04
2.71
0.31
0.31
0.00
31H
ome
Affa
irs12
693.
3311
088.
0075
7.94
1.97
1097
.14
4829
.36
3046
7.74
995.
0921
7.97
5.83
183.
18
32In
dian
Aud
it &
Acc
ount
s10
84.3
194
3.65
193.
750.
4013
0.09
109.
5824
61.7
813
0.21
9.26
3.02
62.2
7
33In
dust
rial P
olic
y &
Pro
mot
ion
49.1
843
.09
7.48
0.18
7.39
5.41
112.
734.
950.
430.
143.
53
34In
form
atio
n an
d B
road
cast
ing
89.7
578
.52
12.3
30.
3312
.13
9.21
202.
277.
200.
950.
232.
33
35In
form
atio
n Te
chno
logy
194.
7417
9.78
33.1
30.
1524
.26
22.3
145
4.37
9.51
0.48
0.46
5.50
36La
bour
& E
mpl
oym
ent
150.
2312
8.16
16.6
30.
1112
.52
34.2
934
1.94
12.9
81.
320.
186.
47
37La
nd R
esou
rces
2.89
2.40
0.45
0.02
0.44
0.45
6.65
0.15
0.02
0.04
0.26
38La
w a
nd J
ustic
e48
.07
42.7
28.
110.
206.
756.
8611
2.71
5.26
0.54
0.53
0.55
39M
icro
, Sm
all a
nd M
ediu
m E
nter
pris
es44
.26
38.8
66.
050.
543.
987.
3810
1.07
2.26
0.36
0.72
0.59
40M
ines
208.
6418
3.36
56.4
40.
1435
.96
25.0
050
9.54
28.0
81.
230.
069.
13
41M
inor
ity A
ffairs
4.42
3.90
0.78
0.02
0.52
0.44
10.0
80.
970.
020.
050.
50
42N
ew &
Ren
ewab
le E
nerg
y7.
076.
131.
150.
011.
200.
9116
.47
2.36
0.06
0.04
0.00
43O
vers
eas
Indi
an A
ffairs
3.10
2.70
0.55
0.00
0.37
0.31
7.03
1.75
0.03
0.01
0.18
44P
anch
ayat
i Raj
2.55
2.25
0.40
0.01
0.32
0.26
5.79
0.35
0.02
0.00
0.09
45P
arlia
men
tary
Affa
irs3.
382.
940.
600.
000.
410.
337.
660.
920.
030.
010.
19
46P
erso
nnel
, Pub
lic G
rieva
nces
& P
ensi
ons
166.
8214
2.37
27.3
00.
1124
.03
114.
8747
5.50
24.8
12.
290.
503.
39
47P
etro
leum
and
Nat
ural
Gas
7.22
6.35
1.11
0.04
1.05
0.50
16.2
71.
070.
050.
100.
06
48P
lann
ing
Com
mis
sion
37.9
233
.37
6.60
0.01
4.43
3.74
86.0
710
.97
0.32
0.10
0.12
49P
osts
4762
.15
4296
.53
516.
2218
.30
369.
3531
4.34
1027
6.89
68.7
224
5.31
5.23
221.
88
50P
ower
34.7
529
.55
6.08
0.03
5.46
3.81
79.6
83.
700.
220.
143.
58
51P
resi
dent
’s S
ecre
taria
t6.
235.
140.
290.
080.
921.
0313
.69
0.07
0.07
0.14
0.20

30
(` C
rore
)
Sl.
Min
istr
y/D
epar
tmen
t P
ayD
AH
RA
OTA
TPT
Oth
ers
Tota
lTr
avel
Bon
usH
onor
a-E
ncas
hmen
t
No.
Allo
w.
rium
of E
.L.
12
34
56
78
9 1
0
1112
13
52P
rime
Min
iste
r’s
Offi
ce9.
278.
161.
030.
161.
481.
3321
.43
1.34
0.10
0.14
0.10
53P
ublic
Ent
erpr
ises
2.34
2.04
0.42
0.00
0.28
0.24
5.32
0.67
0.02
0.01
0.13
54R
ailw
ays
1988
4.66
1753
9.57
2179
.73
987.
4521
71.7
237
45.6
346
508.
7612
44.0
014
45.4
612
.14
1123
.64
55R
even
ue23
83.7
720
97.7
240
7.62
6.42
262.
2126
9.95
5427
.69
67.4
113
.89
1.96
56.3
8
56R
oad
Tran
spor
t & H
ighw
ays
37.9
430
.73
7.47
0.04
5.80
4.63
86.6
15.
160.
310.
231.
40
57R
ural
Dev
elop
men
t11
.35
9.88
2.03
0.00
1.36
1.15
25.7
72.
020.
100.
030.
65
58S
choo
l Edu
catio
n an
d Li
tera
cy6.
355.
661.
000.
011.
240.
1914
.45
1.00
0.12
0.06
0.37
59S
cien
ce &
Tec
hnol
ogy
120.
7610
8.34
36.3
20.
0615
.65
17.2
929
8.42
13.8
30.
200.
079.
33
60S
hipp
ing
38.0
333
.85
4.33
0.06
3.61
6.99
86.8
75.
170.
470.
140.
72
61S
ocia
l Jus
tice
& E
mpo
wer
men
t13
.47
12.0
32.
360.
052.
281.
8031
.99
2.36
0.08
0.05
0.67
62S
pace
475.
7241
8.63
77.9
00.
9147
.19
241.
1512
61.5
039
.74
0.00
0.51
29.8
8
63S
tatis
tics
& P
rogr
amm
e Im
plem
enta
tion
102.
9190
.11
26.2
10.
0514
.45
13.2
424
6.97
16.9
51.
370.
1016
.30
64S
teel
6.49
5.54
1.13
0.06
1.03
0.98
15.2
31.
120.
050.
100.
48
65Te
leco
mm
unic
atio
n92
.89
80.7
515
.32
0.25
11.7
412
.51
213.
4614
.41
0.29
0.46
8.90
66Te
xtile
s71
.08
62.9
411
.78
0.03
8.19
9.55
163.
578.
461.
220.
033.
05
67To
uris
m8.
817.
631.
470.
021.
261.
1420
.33
2.13
0.06
0.08
0.33
68Tr
ibal
Affa
irs5.
464.
830.
940.
030.
780.
6612
.70
0.50
0.06
0.00
0.00
69U
nion
Pub
lic S
ervi
ce C
omm
issi
on30
.99
27.7
95.
340.
105.
514.
4774
.20
1.78
0.35
1.34
2.43
70U
rban
Dev
elop
men
t **
474.
1341
5.73
80.3
42.
1862
.58
13.6
710
48.6
312
.80
1.80
0.15
8.12
71V
ice
Pre
side
nt’s
Sec
reta
riat
0.91
0.81
0.07
0.05
0.16
0.14
2.14
0.12
0.01
0.00
0.00
72W
ater
Res
ourc
es17
6.15
156.
7029
.48
0.23
16.6
930
.81
410.
0616
.58
2.07
0.23
4.60
73W
omen
& C
hild
Dev
elop
men
t11
.79
10.5
12.
140.
031.
441.
1127
.02
1.07
0.12
0.04
1.14
74Y
outh
Affa
irs a
nd S
ports
7.00
5.88
1.19
0.13
0.88
0.93
16.0
11.
060.
070.
080.
59
Tota
l52
747.
5846
315.
4257
55.3
317
41.8
953
32.3
411
394.
2212
3286
.78
3306
.99
2053
.55
45.6
720
19.5
4
* E
xclu
ding
Mis
sion
s A
broa
d.
** In
clud
ing
HU
PA
.

CHAPTER – V
Sanctioned strength and employees in position in
Central Government as on 1.3.2013

31
DISTRIBUTION OF REGULAR CIVILIAN EMPLOYEES (GROUP-WISE) IN CENTRALGOVERNMENT AND UNION TERRITORY ADMINISTRATIONS AS ON 1.3.2013
Sl. No. Central Government / Union Group of PostsTerritory Administrations A B C$ Total
(1) (2) (3) (4) (5) (6)
1 CENTRAL GOVERNMENT 90192 201963 2822040 3114195(2.89) (6.49) (90.62) (100.00)
2 UNION TERRITORYADMINISTRATIONS 2972 13445 49996 66413
(4.48) (20.24) (75.28) (100.00)TOTAL 93164 215408 2872036 3180608
(2.93) (6.77) (90.30) (100.00)
$ Erstwhile Group D posts have been categorized as Group C after implementation of recommendations of 6th Central PayCommission (CPC).
33
32
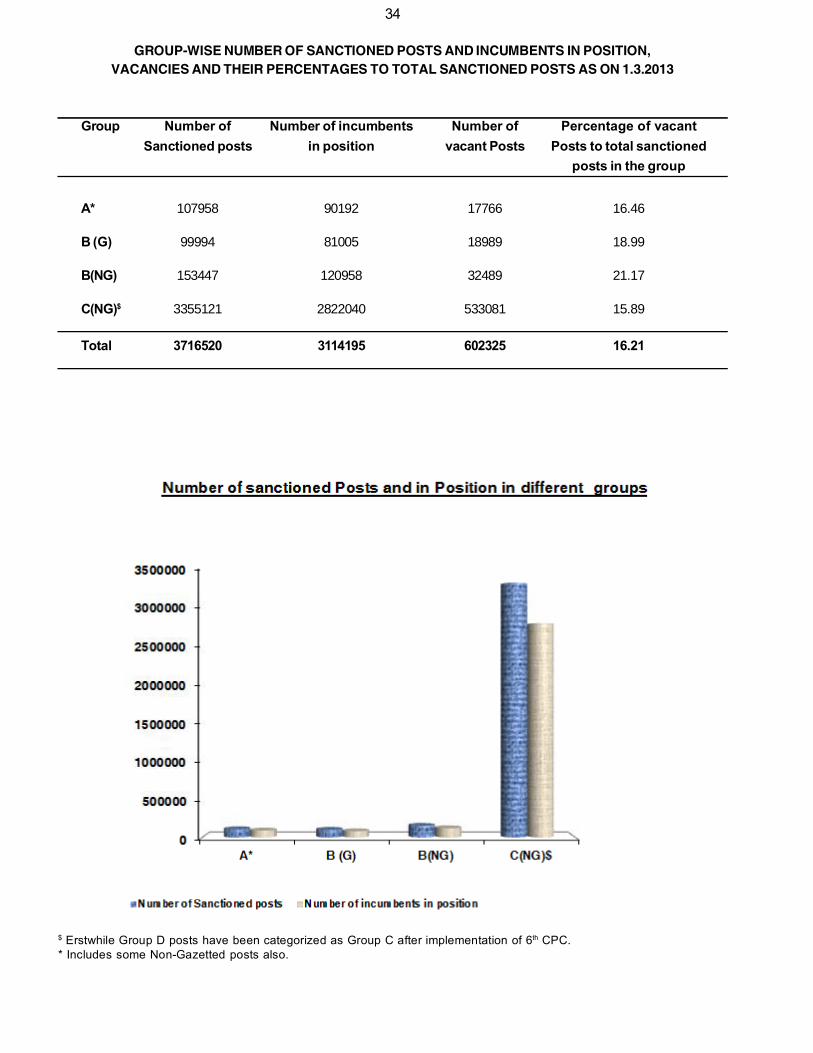
GROUP-WISE NUMBER OF SANCTIONED POSTS AND INCUMBENTS IN POSITION,VACANCIES AND THEIR PERCENTAGES TO TOTAL SANCTIONED POSTS AS ON 1.3.2013
Group Number of Number of incumbents Number of Percentage of vacantSanctioned posts in position vacant Posts Posts to total sanctioned
posts in the group
A* 107958 90192 17766 16.46
B (G) 99994 81005 18989 18.99
B(NG) 153447 120958 32489 21.17
C(NG)$ 3355121 2822040 533081 15.89
Total 3716520 3114195 602325 16.21
$ Erstwhile Group D posts have been categorized as Group C after implementation of 6th CPC.* Includes some Non-Gazetted posts also.
34
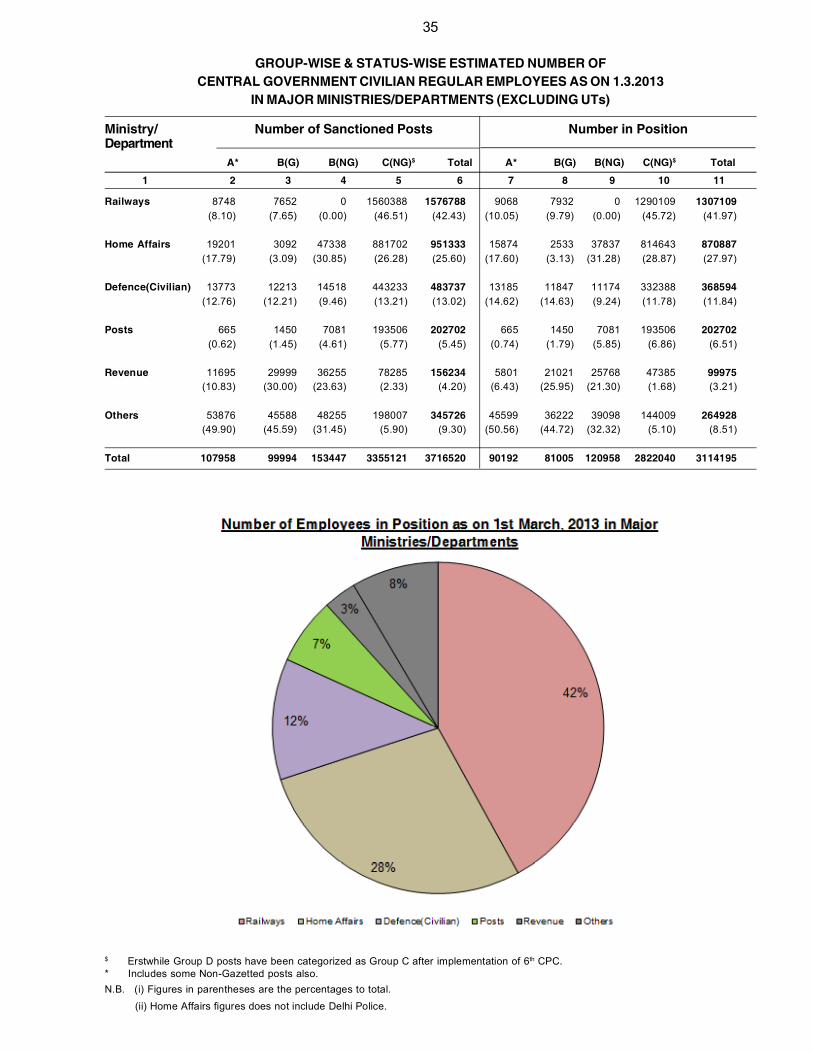
GROUP-WISE & STATUS-WISE ESTIMATED NUMBER OFCENTRAL GOVERNMENT CIVILIAN REGULAR EMPLOYEES AS ON 1.3.2013
IN MAJOR MINISTRIES/DEPARTMENTS (EXCLUDING UTs)
Ministry/ Number of Sanctioned Posts Number in PositionDepartment
$ Erstwhile Group D posts have been categorized as Group C after implementation of 6th CPC.* Includes some Non-Gazetted posts also.N.B. (i) Figures in parentheses are the percentages to total. (ii) Home Affairs figures does not include Delhi Police.
A* B(G) B(NG) C(NG)$ Total A* B(G) B(NG) C(NG)$ Total
1 2 3 4 5 6 7 8 9 10 11
Railways 8748 7652 0 1560388 1576788 9068 7932 0 1290109 1307109(8.10) (7.65) (0.00) (46.51) (42.43) (10.05) (9.79) (0.00) (45.72) (41.97)
Home Affairs 19201 3092 47338 881702 951333 15874 2533 37837 814643 870887(17.79) (3.09) (30.85) (26.28) (25.60) (17.60) (3.13) (31.28) (28.87) (27.97)
Defence(Civilian) 13773 12213 14518 443233 483737 13185 11847 11174 332388 368594(12.76) (12.21) (9.46) (13.21) (13.02) (14.62) (14.63) (9.24) (11.78) (11.84)
Posts 665 1450 7081 193506 202702 665 1450 7081 193506 202702(0.62) (1.45) (4.61) (5.77) (5.45) (0.74) (1.79) (5.85) (6.86) (6.51)
Revenue 11695 29999 36255 78285 156234 5801 21021 25768 47385 99975(10.83) (30.00) (23.63) (2.33) (4.20) (6.43) (25.95) (21.30) (1.68) (3.21)
Others 53876 45588 48255 198007 345726 45599 36222 39098 144009 264928(49.90) (45.59) (31.45) (5.90) (9.30) (50.56) (44.72) (32.32) (5.10) (8.51)
Total 107958 99994 153447 3355121 3716520 90192 81005 120958 2822040 3114195
35

STRENGTH (NUMBER OF SANCTIONED POSTS AND NUMBER IN POSITION)OF CENTRAL POLICE FORCES
Sl. Name of the Central Police Force Number of Sanctioned posts Number in PositionNo. (as on 1st March) (as on 1st March)
2011 2012 2013 2011 2012 2013
1 2 3 4 5 6 7 8
1 Border Security Force (BSF) 240532 243161 246963 214859 228727 239485
2 Central Reserve Police Force (CRPF) 285626 296804 298645 264100 268598 274371
3 Central Industrial Security Force (CISF) 129842 131781 134503 110372 110937 119177
4 Indo Tibetan Border Police(ITBP) 49946 57374 66788 49946 57374 66788
5 Assam Rifles 65582 65386 66412 63854 65386 64172
6 Special Service Bureau(SSB) 75937 78774 85755 52563 58225 66907
7 National Security Guard(NSG) 9506 9507 9507 8889 9058 8771
TOTAL 856971 882787 908573 764583 798305 839671
36

GR
OU
P-W
ISE
AN
D S
TATU
S-W
ISE
(G/N
G) E
STI
MA
TED
NU
MB
ER
OF
CE
NTR
AL
GO
VE
RN
ME
NT
CIV
ILIA
N R
EG
ULA
R E
MP
LOY
EE
S A
S O
N 1
.3.2
013
Num
ber
of S
anct
ione
d P
osts
Num
ber
in P
ositi
onS
l.M
inis
try/
Dep
tt.
No.
A(G
)*B
(G)
B(N
G)
C(N
G)$
Tota
lA
(G)*
B(G
)B
(NG
)C
(NG
)$To
tal
1 2
3
4
5
6
7
8 9
10
11
12
1A
gric
ultu
ral R
esea
rch
& E
duca
tion
176
917
4917
69
1749
2A
gric
ultu
re a
nd C
oope
ratio
n69
158
065
245
4264
6542
335
439
827
7739
523
Ani
mal
Hus
band
ry a
nd D
airy
ing
341
123
584
3326
4374
216
7936
123
4329
994
Ato
mic
Ene
rgy
1011
873
511
220
1483
736
910
9510
690
1051
311
298
3201
15
AY
US
H81
2056
9325
059
735
6316
46
Bio
-Tec
hnol
ogy
8140
4988
258
7415
4758
194
7C
abin
et S
ecre
taria
t52
4197
152
342
5030
8312
528
88
Che
mic
als,
Pet
roch
emic
als
& P
harm
aceu
tical
s80
5675
150
361
5943
6796
265
9C
ivil
Avi
atio
n69
910
122
654
515
7128
974
168
340
871
10C
oal
5037
8423
140
236
3575
173
319
11C
omm
erce
**68
891
010
3444
7271
0468
891
010
3444
7271
0412
Con
sum
er A
ffairs
238
204
190
727
1359
169
152
106
543
970
13C
orpo
rate
Affa
irs44
90
791
1066
2306
347
048
764
314
7714
Cul
ture
291
380
541
6865
8077
291
380
541
6865
8077
15D
efen
ce (C
ivilia
n)**
1377
312
213
1451
844
3233
4837
3713
185
1184
711
174
3323
8836
8594
16D
evel
opm
ent o
f NE
Reg
ion
6281
3715
933
952
5527
118
252
17D
isin
vest
men
t19
813
1555
197
1213
5118
Drin
king
Wat
er &
San
itatio
n28
2740
2912
422
1326
1980
19E
arth
Sci
ence
s60
513
0926
9835
2281
3432
984
920
7020
9353
4120
Eco
nom
ic A
ffairs
309
176
2294
014
4733
119
913
725
1268
21E
nviro
nmen
t & F
ores
ts85
410
0429
627
1748
7166
555
015
717
1130
8322
Exp
endi
ture
208
318
175
690
1391
131
257
125
392
905
23E
xter
nal A
ffairs
2495
1098
2071
2665
8329
2242
943
1730
2215
7130
24Fe
rtiliz
ers
5534
8215
832
952
3266
123
273
25Fi
nanc
ial S
ervi
ces
258
148
359
817
1582
223
9522
560
211
4526
Food
& P
ublic
Dis
tribu
tion
236
8720
888
114
1218
686
168
502
942
27Fo
od P
roce
ssin
g In
dust
ries
3115
5268
166
2815
3355
131
28H
ealth
& F
amily
Wel
fare
2822
787
1239
2066
325
511
2759
769
1211
2020
024
939
29H
eavy
Indu
stry
5545
5012
827
847
3238
8119
8
37

38
30H
ighe
r Edu
catio
n20
616
931
369
713
8516
112
325
944
799
031
Hom
e A
ffairs
1920
130
9247
338
8817
0295
1333
1587
425
3337
837
8146
4387
0887
32In
dian
Aud
it &
Acc
ount
s69
524
900
044
405
7000
057
419
520
027
415
4750
933
Indu
stria
l Pol
icy
& P
rom
otio
n**
350
205
229
1674
2458
350
205
229
1674
2458
34In
form
atio
n an
d B
road
cast
ing
513
537
889
4400
6339
334
352
603
2964
4253
35In
form
atio
n Te
chno
logy
3274
731
633
1275
5913
3260
659
483
1011
5413
36La
bour
& E
mpl
oym
ent*
*13
2948
113
9852
3884
4689
034
588
041
6762
8237
Land
Res
ourc
es34
2429
4313
024
1718
2786
38La
w a
nd J
ustic
e27
021
924
111
1618
4627
021
924
111
1518
4539
Mic
ro, S
mal
l and
Med
ium
Ent
erpr
ises
232
387
6012
8519
6423
238
760
1285
1964
40M
ines
4274
1239
1543
7076
1413
223
7958
611
4951
8192
9541
Min
ority
Affa
irs59
2459
128
270
4118
3974
172
42N
ew &
Ren
ewab
le E
nerg
y11
90
105
172
396
103
082
143
328
43O
vers
eas
Indi
an A
ffairs
3215
4891
186
2710
3559
131
44P
anch
ayat
i Raj
**36
2028
3111
527
1122
2383
45P
arlia
men
tary
Affa
irs21
2033
8515
921
1821
6312
346
Per
sonn
el, P
ublic
Grie
vanc
es &
Pen
sion
s13
9562
489
275
6810
479
1036
459
742
6577
8814
47P
etro
leum
and
Nat
ural
Gas
6461
7113
533
158
4161
9425
448
Pla
nnin
g C
omm
issi
on55
630
034
565
918
6037
317
525
846
112
6749
Pos
ts**
665
1450
7081
1935
0620
2702
665
1450
7081
1935
0620
2702
50P
ower
600
293
328
838
2059
366
146
232
376
1120
51P
resi
dent
’s S
ecre
taria
t27
3755
164
283
2737
5515
427
352
Prim
e M
inis
ter’s
Offi
ce92
015
228
352
782
013
319
140
653
Pub
lic E
nter
pris
es30
1030
5212
227
417
2472
54R
ailw
ays
8748
7652
015
6038
815
7678
890
6879
320
1290
109
1307
109
55R
even
ue11
695
2999
936
255
7828
515
6234
5801
2102
125
768
4738
599
975
56R
oad
Tran
spor
t & H
ighw
ays
397
156
340
1101
1994
303
131
307
965
1706
57R
ural
Dev
elop
men
t94
121
121
244
580
8582
9714
941
358
Sch
ool E
duca
tion
and
Lite
racy
9731
9717
139
671
2665
126
288
59S
cien
ce &
Tec
hnol
ogy*
*60
383
127
110
622
1232
741
913
3420
452
4972
06
Num
ber
of S
anct
ione
d P
osts
Num
ber
in P
ositi
onS
l.M
inis
try/
Dep
tt.
No.
A(G
)*B
(G)
B(N
G)
C(N
G)$
Tota
lA
(G)*
B(G
)B
(NG
)C
(NG
)$To
tal
1 2
3
4
5
6
7
8 9
10
11
12

39
*In
clud
es s
ome
non-
gaze
tted
post
s al
so.
**S
anct
ione
d st
reng
th/In
pos
ition
are
pro
visi
onal
.**
*In
clud
ing
HU
PA
.$
Ers
twhi
le G
roup
D p
osts
hav
e be
en c
ateg
oriz
ed a
s G
roup
C a
fter i
mpl
emen
tatio
n of
6th C
PC
Num
ber
of S
anct
ione
d P
osts
Num
ber
in P
ositi
onS
l.M
inis
try/
Dep
tt.
No.
A(G
)*B
(G)
B(N
G)
C(N
G)$
Tota
lA
(G)*
B(G
)B
(NG
)C
(NG
)$To
tal
1 2
3
4
5
6
7
8 9
10
11
12
60S
hipp
ing
337
193
542
1603
2675
222
142
338
1189
1891
61S
ocia
l Jus
tice
& E
mpo
wer
men
t12
197
170
340
728
8784
129
295
595
62S
pace
9425
644
3509
6415
1999
384
9648
228
7230
6514
915
63S
tatis
tics
& P
rogr
amm
e Im
plem
enta
tion
489
1736
2666
1379
6270
414
1454
1659
1033
4560
64S
teel
5350
6614
231
147
4163
9925
0
65Te
leco
mm
unic
atio
n**
1223
188
384
1152
2947
1223
188
384
1152
2947
66Te
xtile
s31
920
672
534
8947
3926
218
066
531
3142
38
67To
uris
m70
8057
377
584
6467
3533
450
068
Trib
al A
ffairs
8028
5014
230
055
2232
9520
4
69U
nion
Pub
lic S
ervi
ce C
omm
issi
on19
824
345
711
0220
0016
219
037
881
015
40
70U
rban
Dev
elop
men
t ***
2321
970
5155
1462
923
075
2289
793
4546
9332
1696
0
71V
ice
Pre
side
nt’s
Sec
reta
riat
65
049
605
30
4149
72W
ater
Res
ourc
es17
7012
0929
9364
2412
396
1296
875
1729
4249
8149
73W
omen
& C
hild
Dev
elop
men
t10
661
157
400
724
8253
104
297
536
74Y
outh
Affa
irs a
nd S
ports
4673
6424
843
141
6647
211
365
Tota
l10
7958
9999
415
3447
3355
121
3716
520
9019
281
005
1209
5828
2204
031
1419
5

CHAPTER – VI
All India Consumer Price Index upto 1.3.2014
43
ALL INDIA WORKING CLASS CONSUMER PRICE INDEX NUMBER FORINDUSTRIAL WORKERS (BASE 2001= 100), 12 MONTHLY AVERAGE
AND PERCENTAGE INCREASE OVER 115.76 (12 monthly average of price Index fromJan 2005 to Dec 2005) POINTS
Year Jan. Feb. March April May June July Aug. Sept. Oct. Nov. Dec.
2007 INDEX 127 128 127 128 129 130 132 133 133 134 134 134
12 Monthly avg. 123.58 124.33 125.00 125.67 126.33 126.92 127.58 128.33 129.00 129.58 130.17 130.75
% increase 6.76 7.40 7.98 8.56 9.13 9.64 10.21 10.86 11.44 11.94 12.45 12.95
2008 INDEX 134 135 137 138 139 140 143 145 146 148 148 147
12 Monthly avg. 131.33 131.92 132.75 133.58 134.42 135.25 136.17 137.17 138.25 139.42 140.58 141.67
% increase 13.45 13.96 14.68 15.39 16.12 16.84 17.63 18.50 19.43 20.44 21.44 22.38
2009 INDEX 148 148 148 150 151 153 160 162 163 165 168 169
12 Monthly avg. 142.83 143.92 144.83 145.83 146.83 147.92 149.33 150.75 152.17 153.58 155.25 157.08
% increase 23.38 24.33 25.11 25.98 26.84 27.78 29.00 30.23 31.45 32.67 34.11 35.69
2010 INDEX 172 170 170 170 172 174 178 178 179 181 182 185
12 Monthly avg. 159.08 160.92 162.75 164.42 166.17 167.92 169.42 170.75 172.08 173.42 174.58 175.92
% increase 37.42 39.01 40.59 42.03 43.55 45.06 46.35 47.50 48.66 49.81 50.81 51.97
2011 INDEX 188 185 185 186 187 189 193 194 197 198 199 197
12 Monthly avg. 177.25 178.50 179.75 181.08 182.33 183.58 184.83 186.17 187.67 189.08 190.50 191.50
% increase 53.12 54.20 55.28 56.43 57.51 58.59 59.67 60.82 62.12 63.34 64.56 65.43
2012 INDEX 198 199 201 205 206 208 212 214 215 217 218 219
12 Monthly avg. 192.33 193.50 194.83 196.42 198.00 199.58 201.17 202.83 204.33 205.92 207.50 209.33
% increase 66.15 67.16 68.31 69.68 71.04 72.41 73.78 75.22 76.51 77.88 79.25 80.83
2013 INDEX 221 223 224 226 228 231 235 237 238 241 243 239
12 Monthly avg. 211.25 213.25 215.17 216.92 218.75 220.67 222.58 224.50 226.42 228.42 230.50 232.17
% increase 82.49 84.22 85.87 87.38 88.97 90.62 92.28 93.94 95.59 97.32 99.12 100.56
2014 INDEX 237 238 239
12 Monthly avg. 233.50 234.75 236.00
% Increase 101.71 102.79 103.87