Pavement Reinforcement Study using Small Dimension … · Pavement Reinforcement Study using Small...
10
The First Pan American Geosynthetics Conference & Exhibition 2-5 March 2008, Cancun, Mexico Pavement Reinforcement Study using Small Dimension Pullout Equipment J.A.Z. Ferreira, Department of Geotechnical Engineering-EESC, University of Sao Paulo, Sao Carlos, Brazil B.S. Bueno, Department of Geotechnical Engineering-EESC, University of Sao Paulo, Sao Carlos, Brazil J.G. Zornberg, Civil Engineering Department-GEO, The University of Texas at Austin, Austin, USA ABSTRACT This work presents an evaluation of four rigid geosynthetics in reinforcing subgrade layers of road pavement: glass fiber, polypropylene and polyester geogrids; and a polypropylene woven geotextile. A clayey soil (subgrade) and a sandy-silty gravely (base course) soil were used. The strain rupture of the glass fiber geogrid tested is 2 % while the strain rupture of the other geosynthetics tested ranges from 8 to 18 %. A small pullout box and a laser displacement device were used in this study. An approach was developed to use pullout test results for pavement reinforcement. The results showed that the junction strength is decisive in providing confined stiffness for geosynthetics. This parameter was more important than the unconfined stiffness. Accordingly, there is good evidence that the polypropylene and the glass fiber geogrids are the best and the worst options, respectively, for pavement reinforcement among the geosynthetics used in this study. RESUMO Este trabalho avalia quatro rígidos geossintéticos no reforço de subleito de pavimentos viários: geogrelhas de fibra de vidro, polipropileno e poliéster; e um geotêxtil não-tecido de polipropileno. Um solo argiloso (subleito) e um solo areno- silto pedregulhoso foram utilizados. A deformação de ruptura da geogrelha de fibra de vidro testada é de 2 %, enquanto que a deformação de ruptura dos demais geossintéticos testados varia de 8 a 18 %. Uma caixa de arrancamento de pequenas dimensões e um leitor de deslocamentos à laser foram utilizados. Uma abordagem foi desenvolvida aos resultados dos ensaios de arrancamento visando aplicá-los em reforço de pavimento. Os resultados mostraram que a resistência de junta é decisiva para a rigidez confinada de geossintéticos. Este parâmetro mostrou-se mais importante que a rigidez não-confinada. Portanto, há boa evidência que as geogrelhas de polipropileno e de fibra de vidro são a melhor e a pior opção, respectivamente, para uso em reforço de pavimento dentre os geossintéticos utilizados neste estudo. 1. INTRODUCTION The performance of road pavements can be improved by using geosynthetics to reinforce the soil layers of these structures or the asphalt cover on flexible pavements. In the reinforcement of soil layers, the geosynthetics can be placed in the middle of the base course layer or in the interface between the base course and the subgrade layers. Independent of the reinforcement position, the geosynthetic may extend the life-span of the pavement, increase the load distribution and the confinement of the soil thus improving the soil strength. Perkins (1999) identified four reinforcement mechanisms by placing geosynthetics in road soil layers and detailed discussion can be found in this paper. The amount of improvement in pavement performance caused by geosynthetics is due to soil-reinforcement interaction. The influence of the soil on this interaction is related to the strength and particle size distribution of the base and subgrade soils. Regarding the influence of the geosynthetic on soil-reinforcement interaction, Chan et al. (1989) showed that geogrids are better reinforcements than geotextiles when inserted into base layer, even the geogrid having lesser unconfined stiffness than the geotextile. In this case, the soil-reinforcement interaction is favorable to the geogrid due to interlocking of base course particles through geogrid aperture (Giroud and Han 2004). Consequently, the geogrid increase the ability of road soil layers in supporting outward shear stresses (Jewell 1990) or, in other words, the geogrid restrains lateral movement of the aggregate (Giroud and Han 2004) due to surface loading. In addition, Chang et al. (1998) pointed out that this efficiency of the geogrid as reinforcement is related to the stiffness and not to the tensile strength of the geogrid. Dondi (1994), in a finite element study, concluded that geogrids do not experiment high stresses in pavement reinforcement but need high stiffness to be mobilized. This interaction between geosynthetic and soil has been extensively studied in the literature using pullout tests. Pullout tests can be performed in the field (with real structures) or in laboratory. Laboratory tests are more expeditious and relatively low cost. These laboratory tests also allow studying the influence of specific characteristics of geosynthetics in an easier, faster and less expensive manner than building real structures. Laboratory pullout tests commonly use large pullout devices that conform to minimum recommendations of the American Society for Testing and Material (ASTM), specifically the ASTM D6706. Nonetheless, traditional pullout tests still require considerable effort to execute. On 963 Ferreira, J.A.Z, Bueno, B.S., and Zornberg, J.G. (2008). “Pavement Reinforcement Study using Small Dimension Pullout Equipment.” Proceedings of GeoAmericas 2008, the First PanAmerican Geosynthetics Conference and Exhibition, Cancún, Mexico, 2-5 March, pp. 963-972.
Transcript of Pavement Reinforcement Study using Small Dimension … · Pavement Reinforcement Study using Small...
The First Pan American Geosynthetics Conference & Exhibition2-5 March 2008, Cancun, Mexico
Pavement Reinforcement Study using Small Dimension Pullout Equipment J.A.Z. Ferreira, Department of Geotechnical Engineering-EESC, University of Sao Paulo, Sao Carlos, Brazil B.S. Bueno, Department of Geotechnical Engineering-EESC, University of Sao Paulo, Sao Carlos, Brazil J.G. Zornberg, Civil Engineering Department-GEO, The University of Texas at Austin, Austin, USA ABSTRACT This work presents an evaluation of four rigid geosynthetics in reinforcing subgrade layers of road pavement: glass fiber, polypropylene and polyester geogrids; and a polypropylene woven geotextile. A clayey soil (subgrade) and a sandy-silty gravely (base course) soil were used. The strain rupture of the glass fiber geogrid tested is 2 % while the strain rupture of the other geosynthetics tested ranges from 8 to 18 %. A small pullout box and a laser displacement device were used in this study. An approach was developed to use pullout test results for pavement reinforcement. The results showed that the junction strength is decisive in providing confined stiffness for geosynthetics. This parameter was more important than the unconfined stiffness. Accordingly, there is good evidence that the polypropylene and the glass fiber geogrids are the best and the worst options, respectively, for pavement reinforcement among the geosynthetics used in this study. RESUMO Este trabalho avalia quatro rígidos geossintéticos no reforço de subleito de pavimentos viários: geogrelhas de fibra de vidro, polipropileno e poliéster; e um geotêxtil não-tecido de polipropileno. Um solo argiloso (subleito) e um solo areno-silto pedregulhoso foram utilizados. A deformação de ruptura da geogrelha de fibra de vidro testada é de 2 %, enquanto que a deformação de ruptura dos demais geossintéticos testados varia de 8 a 18 %. Uma caixa de arrancamento de pequenas dimensões e um leitor de deslocamentos à laser foram utilizados. Uma abordagem foi desenvolvida aos resultados dos ensaios de arrancamento visando aplicá-los em reforço de pavimento. Os resultados mostraram que a resistência de junta é decisiva para a rigidez confinada de geossintéticos. Este parâmetro mostrou-se mais importante que a rigidez não-confinada. Portanto, há boa evidência que as geogrelhas de polipropileno e de fibra de vidro são a melhor e a pior opção, respectivamente, para uso em reforço de pavimento dentre os geossintéticos utilizados neste estudo.
1. INTRODUCTION The performance of road pavements can be improved by using geosynthetics to reinforce the soil layers of these structures or the asphalt cover on flexible pavements. In the reinforcement of soil layers, the geosynthetics can be placed in the middle of the base course layer or in the interface between the base course and the subgrade layers. Independent of the reinforcement position, the geosynthetic may extend the life-span of the pavement, increase the load distribution and the confinement of the soil thus improving the soil strength. Perkins (1999) identified four reinforcement mechanisms by placing geosynthetics in road soil layers and detailed discussion can be found in this paper. The amount of improvement in pavement performance caused by geosynthetics is due to soil-reinforcement interaction. The influence of the soil on this interaction is related to the strength and particle size distribution of the base and subgrade soils. Regarding the influence of the geosynthetic on soil-reinforcement interaction, Chan et al. (1989) showed that geogrids are better reinforcements than geotextiles when inserted into base layer, even the geogrid having lesser unconfined stiffness than the geotextile. In this case, the soil-reinforcement interaction is favorable to the geogrid due to interlocking of base course particles through geogrid aperture (Giroud and Han 2004). Consequently, the geogrid increase the ability of road soil layers in supporting outward shear stresses (Jewell 1990) or, in other words, the geogrid restrains lateral movement of the aggregate (Giroud and Han 2004) due to surface loading. In addition, Chang et al. (1998) pointed out that this efficiency of the geogrid as reinforcement is related to the stiffness and not to the tensile strength of the geogrid. Dondi (1994), in a finite element study, concluded that geogrids do not experiment high stresses in pavement reinforcement but need high stiffness to be mobilized. This interaction between geosynthetic and soil has been extensively studied in the literature using pullout tests. Pullout tests can be performed in the field (with real structures) or in laboratory. Laboratory tests are more expeditious and relatively low cost. These laboratory tests also allow studying the influence of specific characteristics of geosynthetics in an easier, faster and less expensive manner than building real structures. Laboratory pullout tests commonly use large pullout devices that conform to minimum recommendations of the American Society for Testing and Material (ASTM), specifically the ASTM D6706. Nonetheless, traditional pullout tests still require considerable effort to execute. On
963
Ferreira, J.A.Z, Bueno, B.S., and Zornberg, J.G. (2008). “Pavement Reinforcement Study using Small Dimension Pullout Equipment.” Proceedings of GeoAmericas 2008, the First PanAmerican Geosynthetics Conference and Exhibition, Cancún, Mexico, 2-5 March, pp. 963-972.

average, the volume of soil used ranges from 0.3 to 0.5 m3 and the mounting, executing and dismounting procedures of a test require five or six days. In order to provide less expensive and more expeditious, but still reliable tests, small pullout test devices have been developed by Nakamura 2003, Kakuda et al. 2006 and Ju et al. 2006, for example. However, pullout test results have been applied to structures such as reinforced soil walls or embankments on soft soil but not yet to reinforced road pavements. Furthermore, studies of road reinforcement reported in the literature use road constructed sections or expensive laboratory tests. The study of soil-geosynthetic interaction in pavement reinforcement using pullout tests may be preferable than the usual approaches, such as building reinforced pavement sections or expensive model tests that need specific devices for applying dynamic loads, for example. Although, many pavement reinforcement studies have investigated the influence of geometric and mechanical characteristics of geosynthetics in this type of application, no study directly addressed the influence of the stiffness together with the junction strength of geogrids in reinforcing road pavements. Geogrids may need high junction strength and high stiffness in order to not only be mobilized but to prevent lateral movement of the particles of the base layer due to traffic loading. Moreover, current design methods also do not account both of these geosynthetic characteristics and current practice in road construction is highly empirical. Accordingly, engineers need options to evaluate different choices of geosynthetics for using with specific soils in a fast, easy, reliable and relatively cheap way before building the road. The purpose of this paper is to evaluate the soil-reinforcement interaction of four rigid geosynthetics in reinforcing subgrade layers of road pavements. An approach was developed to apply results obtained from small pullout test to pavement reinforcement, thus creating a manner to evaluate the probable best option among various geosynthetics to be used with specific soils. It was also investigated whether the geosynthetic with the highest stiffness also presents the highest confined stiffness. The confined stiffness may be direct related with the junction strength of the geosynthetic. 2. MATERIALS AND METHODS
2.1 Geosynthetics, soils and equipment
Four different rigid geosynthetics were used in this study: a glass fiber geogrid, a polypropylene geogrid, a polyester geogrid and a polypropylene woven geotextile. The characteristics of these geosynthetics are summarized in Table 1.
Table 1. Characteristics of the geosynthetics used in the study.
Type of geosynthetic and constituent polymer Property Manufacturing
Direction GF GG
PP GG
PET GG
PP GT
MD 50 12,4 29,2 70 Ultimate tensile strength (kN/m) (ASTM 6637) CD 50 19,0 29,2 70
MD (1) 205 365 700 Unconfined stiffness modulus (JU) at 2% of deformation (kN/m) CD (1) 330 365 965
MD (1) 15.4(2) 5.8(2) Junction Strength (kN/m) CD (1) 29.0(2) 7.1(2) MD 22,5 25,0 25,4 Aperture size
(mm) CD 30,0 33,0 25,4 Rib thickness (mm) CD 1,50(3) 0,76 1,50(3)
Note: Nominal values given by the manufacturers. GF – Glass Fiber; PP – Polypropylene; PET – Polyester; GG – Geogrid; GT – Woven Geotextile; MD – Machine Direction; CD – Cross Direction. (1) Value not given by the
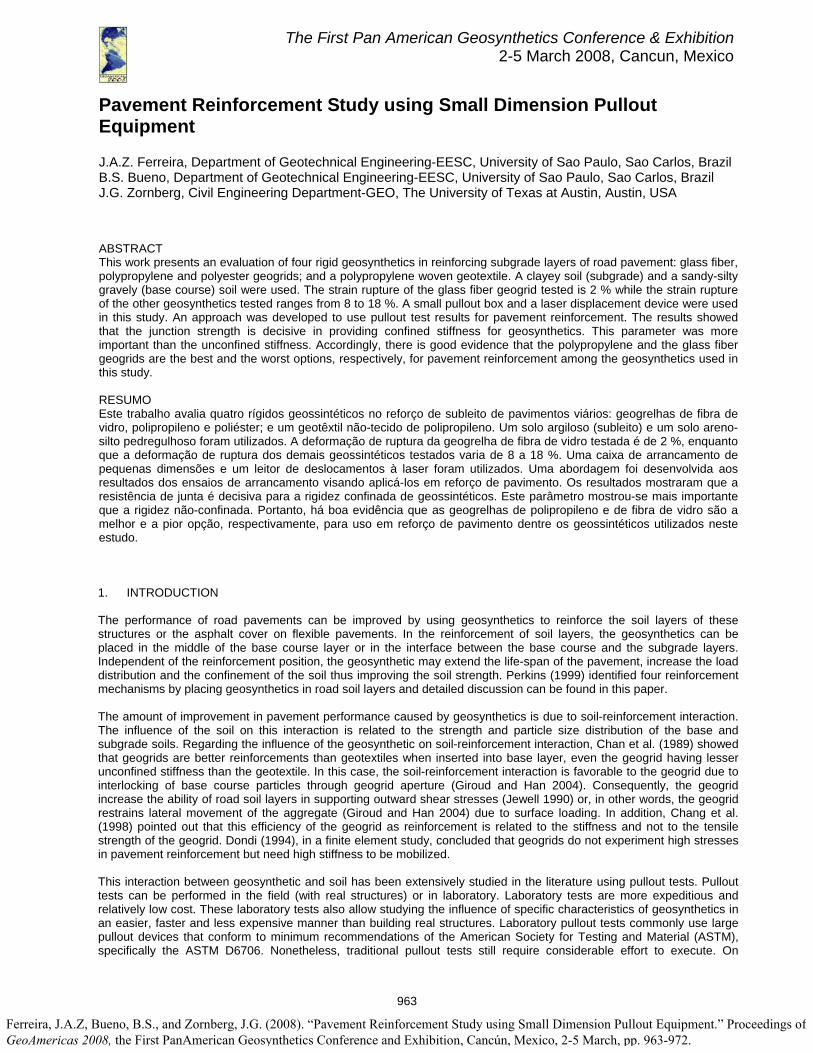
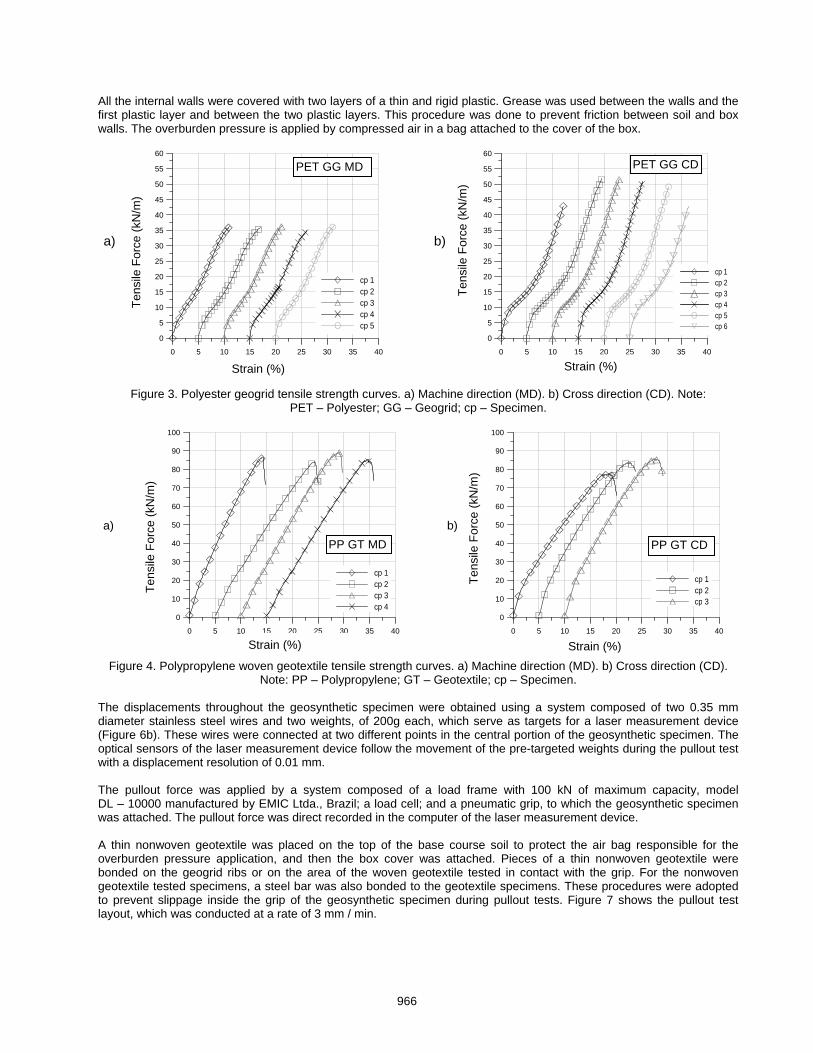
manufacturer; (2) Tests conducted at TxDOT laboratory; (3) Value measured by paper authors. All of these geosynthetics are manufactured for road base course or subgrade reinforcement purposes. The curves of the ultimate tensile strength test of the geosynthetics used in this study are shown in Figures 1 to 4. The plots in these figures were translated at increments of 5 % in the horizontal axis to better distinguish the behavior of individual specimens. These tensile strength tests were performed following the recommendations of ASTM D6637. The tests with the glass fiber geogrid were performed at the Laboratory of Geosynthetics of the University of Sao Paulo at Sao Carlos and the tests with the other geosynthetics were performed at the Laboratory of Texas Department of Transportation (TxDOT) (Gupta et al. 2008). Figure 1 shows that the glass fiber geogrid ruptures at approximately 2 % of deformation. Figures 2 to 4 show that the other geosynthetics rupture at nearly 8 to 18 % of deformation. The ultimate tensile strength curves reveal that the glass fiber geogrid is the geosynthetic that has the highest potential for use in road pavement reinforcement. This advantage is because of the high stiffness of the glass fiber demonstrated by the extremely low value of deformation at rupture.
964
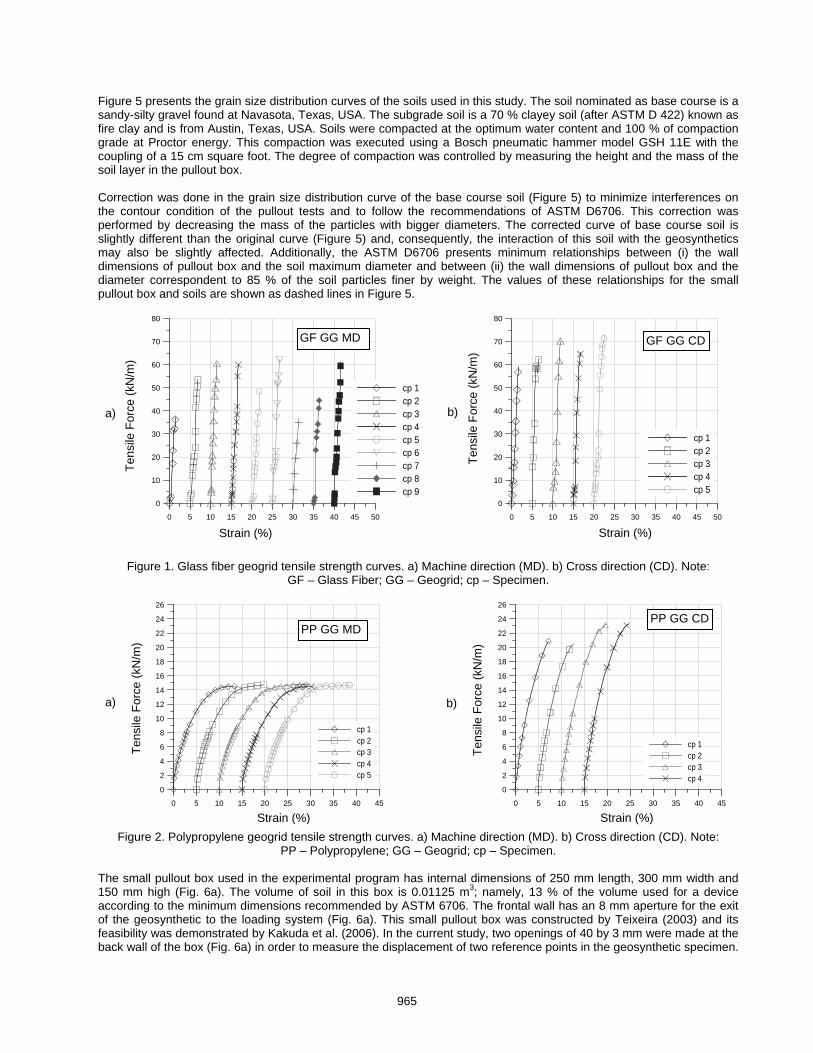
Figure 5 presents the grain size distribution curves of the soils used in this study. The soil nominated as base course is a sandy-silty gravel found at Navasota, Texas, USA. The subgrade soil is a 70 % clayey soil (after ASTM D 422) known as fire clay and is from Austin, Texas, USA. Soils were compacted at the optimum water content and 100 % of compaction grade at Proctor energy. This compaction was executed using a Bosch pneumatic hammer model GSH 11E with the coupling of a 15 cm square foot. The degree of compaction was controlled by measuring the height and the mass of the soil layer in the pullout box. Correction was done in the grain size distribution curve of the base course soil (Figure 5) to minimize interferences on the contour condition of the pullout tests and to follow the recommendations of ASTM D6706. This correction was performed by decreasing the mass of the particles with bigger diameters. The corrected curve of base course soil is slightly different than the original curve (Figure 5) and, consequently, the interaction of this soil with the geosynthetics may also be slightly affected. Additionally, the ASTM D6706 presents minimum relationships between (i) the wall dimensions of pullout box and the soil maximum diameter and between (ii) the wall dimensions of pullout box and the diameter correspondent to 85 % of the soil particles finer by weight. The values of these relationships for the small pullout box and soils are shown as dashed lines in Figure 5.
0
10
20
30
40
50
60
70
80
0
10
20
30
40
50
60
70
80
Figure 1. Glass fiber geogrid tensile strength curves. a) Machine direction (MD). b) Cross direction (CD). Note: GF – Glass Fiber; GG – Geogrid; cp – Specimen.
Figure 2. Polypropylene geogrid tensile strength curves. a) Machine direction (MD). b) Cross direction (CD). Note:
PP – Polypropylene; GG – Geogrid; cp – Specimen. The small pullout box used in the experimental program has internal dimensions of 250 mm length, 300 mm width and 150 mm high (Fig. 6a). The volume of soil in this box is 0.01125 m3; namely, 13 % of the volume used for a device according to the minimum dimensions recommended by ASTM 6706. The frontal wall has an 8 mm aperture for the exit of the geosynthetic to the loading system (Fig. 6a). This small pullout box was constructed by Teixeira (2003) and its feasibility was demonstrated by Kakuda et al. (2006). In the current study, two openings of 40 by 3 mm were made at the back wall of the box (Fig. 6a) in order to measure the displacement of two reference points in the geosynthetic specimen.
0 5 10 15 20 25 30 35 40 45Deformação ( % )
0
2
4
6
8
10
12
14
16
18
20
22
24
26
Forç
a de
Tra
ção
( kN
/m )
a) b)
PP GG MD
0 5 10 15 20 25 30 35 40 45Deformação ( % )
0
2
4
6
8
10
12
14
16
18
20
22
24
26
Forç
a de
Tra
ção
( kN
/m )
PP GG CD
cp 1cp 2cp 3cp 4cp 5
cp 1cp 2cp 3cp 4
Tens
ile F
orce
(kN
/m)
Tens
ile F
orce
(kN
/m)
Strain (%) Strain (%)
a) b)
0 5 10 15 20 25 30 35 40 45 50Deformação ( % )
Forç
a de
Tra
ção
( kN
/m )
GF GG MD
Forç
a de
Tra
ção
( kN
/m )
GF GG CD
0 5 10 15 20 25 30 35 40 45 50
cp 1cp 2cp 3cp 4cp 5cp 6cp 7cp 8
Tens
ile F
orce
(kN
/m)
Tens
ile F
orce
(kN
/m)
cp 1cp 2cp 3cp 4cp 5cp 9
Strain (%) Strain (%)
965
All the internal walls were covered with two layers of a thin and rigid plastic. Grease was used between the walls and the first plastic layer and between the two plastic layers. This procedure was done to prevent friction between soil and box walls. The overburden pressure is applied by compressed air in a bag attached to the cover of the box.
0
5
10
15
20
25
30
35
40
45
50
55
60
0
5
10
15
20
25
30
35
40
45
50
55
60
Figure 3. Polyester geogrid tensile strength curves. a) Machine direction (MD). b) Cross direction (CD). Note:
PET – Polyester; GG – Geogrid; cp – Specimen.
Figure 4. Polypropylene woven geotextile tensile strength curves. a) Machine direction (MD). b) Cross direction (CD).
Note: PP – Polypropylene; GT – Geotextile; cp – Specimen. The displacements throughout the geosynthetic specimen were obtained using a system composed of two 0.35 mm diameter stainless steel wires and two weights, of 200g each, which serve as targets for a laser measurement device (Figure 6b). These wires were connected at two different points in the central portion of the geosynthetic specimen. The optical sensors of the laser measurement device follow the movement of the pre-targeted weights during the pullout test with a displacement resolution of 0.01 mm. The pullout force was applied by a system composed of a load frame with 100 kN of maximum capacity, model DL – 10000 manufactured by EMIC Ltda., Brazil; a load cell; and a pneumatic grip, to which the geosynthetic specimen was attached. The pullout force was direct recorded in the computer of the laser measurement device. A thin nonwoven geotextile was placed on the top of the base course soil to protect the air bag responsible for the overburden pressure application, and then the box cover was attached. Pieces of a thin nonwoven geotextile were bonded on the geogrid ribs or on the area of the woven geotextile tested in contact with the grip. For the nonwoven geotextile tested specimens, a steel bar was also bonded to the geotextile specimens. These procedures were adopted to prevent slippage inside the grip of the geosynthetic specimen during pullout tests. Figure 7 shows the pullout test layout, which was conducted at a rate of 3 mm / min.
a) b)
0 5 10 15 20 25 30 35 40Deformação ( % )
0
10
20
30
40
50
60
70
80
90
100
Forç
a de
Tra
ção
( kN
/m )
0 5 10 15 20 25 30 35 40Deformação ( % )
0
10
20
30
40
50
60
70
80
90
100
Forç
a de
Tra
ção
( kN
/m )
PP GT CD
cp 1cp 2cp 3cp 4
cp 1cp 2cp 3
Tens
ile F
orce
(kN
/m)
Tens
ile F
orce
(kN
/m)
Strain (%) Strain (%)
PP GT MD
0 5 10 15 20 25 30 35 40Deformação ( % )
Forç
a de
Tra
ção
( kN
/m )
PET GG CDPET GG MD
0 5 10 15 20 25 30 35 40Deformação ( % )
Forç
a de
Tra
ção
( kN
/m )
a) b)
cp 1cp 2cp 3cp 4
Tens
ile F
orce
(kN
/m)
Tens
ile F
orce
(kN
/m)
cp 1cp 2cp 3cp 4cp 5
cp 5 cp 6
Strain (%) Strain (%)
966

Figure 5. Grain size curves of the soils used in the study.
Figure 6. a) Perspective of the small pullout box used in the study (Dimensions in mm). b) Laser displacement device.
Figure 7. Small dimension pullout test layout. a) Placement of the pullout box. b) Positioning of the laser displacement device.
Pneumatic grip
Pullout box
Overburden application
Weights attached to the stainless steel wires
a) b)
Load cell
300
250
40 3
Openings
Frontal aperture for the exit of the geosynthetic specimen (h = 8 mm)
150Optical sensors
Arm for positioning the optical sensor
Step motor
a) b)
Holes for attaching the pullout box in the load frame
0
10
20
30
40
50
60
70
80
90
100
0.001 0.01 0.1 1 10
% fi
ner b
y wei
ght
Particle Size (mm)
3/8in 3/4in
Clay SiltFine Medium Coarse
GravelSand
ASTM D 422
D85
D85 ≤ 12,5
Dmax ≤ 25
416 102030405060100140200
Subgrade
Base Course
Corrected Base
Course
967
2.2 Confined stiffness modulus (JC) and unconfined stiffness modulus (JU) The approach used in the pullout test results for pavement reinforcement was to define a confined stiffness modulus (JC). JC is the pullout force divided by the correspondent deformation of the geosynthetic specimen. Equation 1 presents the definition of JC.
JC = [1] Deformation %
Geosynthetics are extensible reinforcements and, consequently, are progressively mobilized. Thus, the applied force throughout the geosynthetic specimen is not constant. This force is maximum at the active end of the specimen (where the pullout force is applied) and decreases along the length of the specimen. Accordingly, the force being applied at the central portion of the specimen, where the wires for measuring displacements are attached to, is smaller than the pullout force. Hence, there is an error in Jc calculated by Equation 1. However, this error may be relatively small because of the small length of the specimen, which is only 250 mm. Moreover, this error may be proportional for each geosynthetic. For these reasons, the analyses in this paper are qualitative. In order to make quantitative and more accurate analyses, it would be necessary to back-calculate the force applied in the central portion of the geosynthetic using theoretical and more sophisticated approaches. Nonetheless, using more sophisticated approaches would deviate this work from the initial motivation of proposing an easy and practical manner of evaluating different geosynthetics for building roads with specific/regional soils.
Pullout Force kN/m
Furthermore, the results of the pullout tests applied in the Equation 1 were those related only to the initial slope of the curve pullout force vs. displacement, before the pullout tests reaching the maximum value of pullout force. In addition to the comparison of the Jc curves of the geosynthetics, comparative analyses of confined stiffness vs. unconfined stiffness of the geosynthetics were also performed. The unconfined stiffness modulus (JU) is defined as the tensile force (kN/m) divided by the correspondent deformation of the geosynthetic specimen (Equation 2) in the ultimate tensile strength test (ASTM 6637).
JU = [2] Tensile Force kN/mDeformation %
3. RESULTS AND DISCUSSION Pullout tests were conducted with the subgrade soil in the bottom layer of the pullout box and the base course soil in the upper layer of the pullout box. Geosynthetics were tested in both directions in these pullout tests. Overburden pressures of 7 and 21 kPa were applied in order to make these pressures compatible to normal pressures occurring in road pavements. Figure 8 presents the confined stiffness moduli (JC) of the geosynthetics tested in the machine direction with overburden of 7 (Figure 8a) and 21 kPa (Figure 8b).This figure shows that the polypropylene (PP) geogrid performs best with the soils used in the testing program for pavement reinforcement. This best performance occurs because the PP geogrid showed the highest JC for all levels of deformation in comparison with the other geosynthetics tested (Figure 8). On the other hand, the glass fiber (GF) geogrid has the worst performance. This worst performance occurs because the GF geogrid presented the lowest JC for all levels of deformation among the geosynthetics tested (Figure 8). The same relative behavior was observed when the geosynthetics were tested in the cross machine direction. The relative behavior of the curves in Figure 8 contradicts the initial perception that the most rigid geosynthetic would have the highest potential for pavement reinforcement (see section 2.1). This difference between the initial perception and relative behavior of the geosynthetics showed in Figure 8 is due to soil-reinforcement interaction. The PP and the GF geogrids presented the highest and lowest JC (Figure 8), respectively, due to the interaction of these geosynthetics with the soils used in the study. However, the PP geogrid has the lowest JU among the geosynthetics tested (Table 1). Although the JU at 2 % strain of the GF geogrid was not provided by the manufacturer (Table 1), the ASTM D 6637 tests show evidence that this geogrid has the highest JU. In fact, the GF geogrid ruptures at 2 % strain (Figure 1) while the rupture strains of the other geosynthetics are from 10 to 18 % (Figure 2 to 4). Because manufacturers provide Ju at specific values of strain (usually 1, 2 and/or 5 %) and curves of confined stiffness are for small strains (less than 2 %), plots of JU vs. strain (Figure 9) were generated from data of tensile strength tests (Figures 1 to 4). Additionally, JU varies with strain (Figure 9) and, thus, plots of JU provide better evaluation of the geosynthetics than using a single number. Nevertheless, results of the GF geogrid were excluded from Figure 9 due to the high variability of this geosynthetic and more detailed discussion is provided latter in this paper. Figure 9 shows that the PP geogrid has the lowest JU for all levels of strains and the PET geogrid has the highest JU for strains until 0.9 %. From strains higher than 0.9 %, the PP geotextile has the highest JU (Figure 9). Based on the relative behavior of the geosynthetics tested in confined and unconfined situations (Figures 8 and 9), it can be concluded that the
968

soil-reinforcement interaction was more efficient for the PP geogrid than for the PET geogrid and in turn for the other geosynthetics. The best performance of the PP geogrid was due to its junction strength, which is higher than the junction strength of the PET geogrid.
0
500
1000
1500
2000
2500
3000
3500
4000
4500
5000
the PET geogrid turns to be higher than the skin friction developed by the PP geotextile.
Figure 8. Confined stiffness modulus (JC) vs. Deformation curves of geosynthetics tested in machine direction with
subgrade soil in the bottom and base course soil in the upper layers of the pullout box. a) Overburden 7 kPa. b) Overburden 21 kPa. Note: PP– Polypropylene; PET– Polyester; GF– Glass Fiber; MD–Machine Direction;
σ-Overburden.
Figure 9. Comparison among the unconfined stiffness moduli (JU) of the geosynthetics tested in the machine direction.
Note: PP – Polypropylene; PET – Polyester; GG – Geogrid; GT – Geotextile; MD – Machine Direction. Tests done by TxDOT laboratory of transportation (Gupta et al. 2008) showed that the PP geogrid has 15.4 kN/m of junction strength at the machine direction while the PET geogrid has 5.8 kN/m (Table 1). This is the only parameter that is higher for the PP geogrid than for the PET geogrid. The rib thickness, the ultimate tensile strength (Table 1) and the unconfined stiffness (Figure 9) of the PET geogrid are higher than those of the PP geogrid. In contrast, the aperture sizes of both geogrids are similar. Therefore, the junction strength was the most important factor in soil-reinforcement interaction of the materials tested and was responsible for providing the highest confined stiffness for the PP geogrid. Hence, there is good evidence that the PP geogrid may be better than the PET geogrid for pavement reinforcement. However, further research is needed to confirm that the performance of the geosynthetics observed in these small pullout tests will match the performance of these geosynthetics in the field. Field research with the geosynthetics and soils used in this work are being studying in ongoing research of Gupta et al. (2008). In addition to the tests with the geogrids, a PP woven geotextile was also used. For an overburden of 7 kPa, the PP geotextile showed higher JC than the PET geogrid (Figure 8). On the other hand, for an overburden of 21 kPa, the PP geotextile showed lower JC than the PET geogrid (Figure 8) because the geogrid acted as a confinement element for the soil. For an overburden of 7 kPa, a low pressure, the geotextile is better because a bigger area is available for the development of skin friction between soil and reinforcement. For this level of overburden, the mechanisms of the bearing capacity and the cutting action of the geogrid bearing members are not highly mobilized. However, for a 21 kPa overburden, the soil-soil contact through the aperture of the geogrid is increased. Consequently, the cutting action of the geogrid bearing members becomes harder to develop, thus increasing the bearing capacity of these members. As a result, the contribution of the bearing members to the pullout resistance increases and the total resistance developed by
0 0.2 0.4 0.6 0.8 1 1.2 1.4 1.6 1.8 2Deformation ( % )
0500
10001500
2000
250030003500
4000
45005000
J U (
kN/m
)
PP GG MDPET GG MDPP GT MD
Strain (%)
a) b)
0 0.2 0.4 0.6 0.8 1 1.2 1.4 1.6 1.8 2
Deformation ( % )
J C (
kN/m
)
PP Geogrid MDPET Geogrid MDPP Geotextile MDGF Geogrid MD
0
500
1000
1500
2000
2500
3000
3500
4000
4500
5000PP Geogrid MDPET Geogrid MDPP Geotextile MDGF Geogrid MD
J C (
kN/m
)
σ = 21 kPa σ = 7 kPa
0 0.2 0.4 0.6 0.8 1 1.2 1.4 1.6 1.8 2Deformation ( % )
969
ower than the performance for verburden of 7 kPa (Figure 8a). This unexpected result for the test with 21 kPa of overburden may have been caused
interaction with e soils used in the pullout tests. Because of this weak interaction, the supposed advantage for pavement reinforcement
ons of manufacturing was evident when the specimens were hecked after pullout tests. This low junction strength was observed mainly for the geogrid tested in the cross machine
Second, the med geogrid pecimen after pullout test performed with 21 kPa of overburden. This specimen ruptured at four different points
eogrid. An average timate strength of 51.4 kN/m was obtained for the virgin specimens in the machine direction, while an average of
vtimate strength of the virgin GF geogrid in both directions of manufacturing (almost 21 and 11 % in the machine and
– Deformation at Rupture.
However, the performance of the PP geotextile for overburden of 21 kPa (Figure 8b) was loby the device used against slippage inside the grips. Slippage might have occurred during this pullout test due to adjustments of the steel bar used to prevent this slippage. For some reason, these adjustments did not influence the curve pullout force vs. displacements but were decisive for the deformation behavior of the geosynthetic. Moreover, a GF geogrid was also used in the experimental testing program. This GF geogrid had a weak thof the GF geogrid in comparison to the other geosynthetics tested was lost. Four reasons were identified for the bad performance of the GF geogrid: (i) low junction strength, (ii) high sensibility to installation damage, (iii) high manufacturing variability and (iv) low coefficient of friction. First, the GF geogrid’s low junction strength in both directicdirection. Figure 10a shows the exhumed GF geogrid specimen after a pullout test conducted with 21 kPa of overburden. It can be seen in Figure 10a that the transverse ribs simply slid uniformly throughout the longitudinal members of the geogrid specimen.
Figure 10. Conditions of the Glass Fiber (GF) geogrid specimens after pullout tests with 21 kPa of overburden. a)
Specimen tested in the cross machine direction. b) Specimen tested in the machine direction.
a) b)
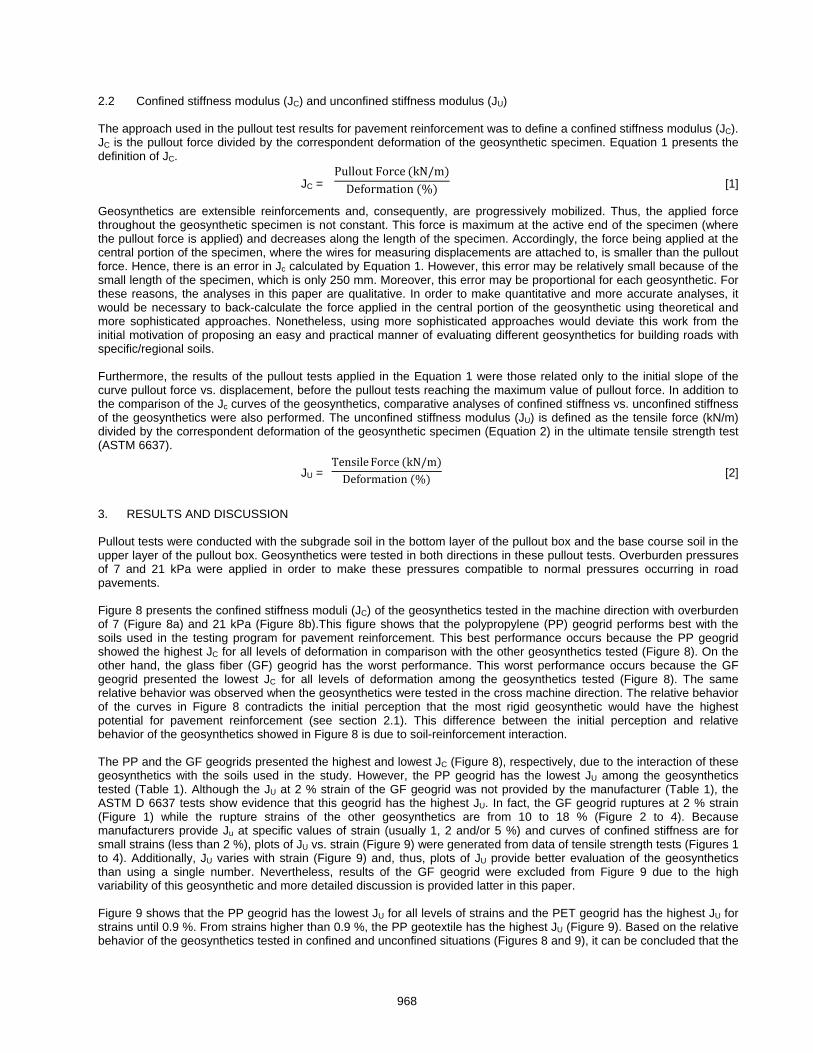
GF geogrid also showed high sensitivity to installation damage. Figure 10b displays the exhus(Figure 10b), which did not happen to the other geosynthetics tested. A specific test was performed to quantify the sensitivity of the GF geogrid to installation damage. It is good to emphasize that the installation damage referred in this paper is related to the compaction procedure for the pullout tests. The actual installation damage in the field may be worse due to heavy equipment commonly used to build pavements. The procedure for the installation damage tests in this work were (i) mounting a test as it would be done for the pullout tests; then, instead of running a pullout test, (ii) the top soil layer was carefully removed from the pullout box; and (iii) the damaged geogrid specimen was tested according to ASTM D 6637 (tensile strength tests). The differences between the specimens for pullout and damage installation tests were that the samples for damage installation tests were placed in a manner that the damaged part was the central part of the specimen. This procedure was considered to be successful because all specimens ruptured in the central damaged part during tensile strength tests, not in the boundary between damaged and intact parts. Table 2 summarizes the results obtained for the installation damage test performed with the GF gul24.1 kN/m was obtained for the damaged specimens. In other words, the GF geogrid loses more than half of its resistance in damaged conditions compared to the virgin condition. Additionally, on average, the GF geogrid in cross direction loses 30 % of the ultimate strength in damaged conditions compared to virgin conditions. Third, the GF geogrid has high manufacturing variability. Table 2 shows the high coefficient of variation (C ) of the ulcross directions, respectively). This high variability in the manufacturing process of the GF geogrid can also be perceived in its curves unconfined stiffness modulus (JU) vs. deformation. The curves of the GF geogrid did not show a tendency or the normal behavior expected for this type of graphic (Figure 11a), while the other geosynthetics used clearly showed a tendency or the normal behavior expected for this type of graphic (Figures 11b, c and d). Table 2. Results of the installation damage test performed with the glass fiber (GF) geogrid. Note: MD – Machine Direction; CD – Cross Direction; Tult – Ultimate Strength; Cv – Coefficient of Variation; εrupt
970
GF geogrid specimen Tult (kN/m) Cv (%) εrupt (%) Cv (%)
MD 51.4 20.6 1.6 13.2 Vi D
D
rgin C 64.0 11.0 1.9 16.7 MD 24.1 14.2 1.3 23.2 amaged CD 44.8 17.2 1.1 18.4
Figure 11. Curves unconfined stiffness modulus (JU) vs. deformation of the geosynthetics tested in the machine direction.
a) Glass fiber geogrid. b) Polypropylene geogrid. c) Polyester geogrid. d) Polypropylene geotextile. Note: GF – Glass Fiber; PP – Polypropylene; PET – Polyester; GG – Geogrid; GT – Geotextile; MD – Machine Direction; cp – Specimen.
inally, the GF geogrid used in the study has a low coefficient of friction. The longitudinal elements of the geogrid areomposed by two fragile and extremely thin “sub elements” (Figure 12). Each sub element is only 1.25 mm wide.
F
Figure 12. Detail of the GF geogrid members. Note: W 1 sub – Width of one longitudinal “sub element”; WT – Width of a transverse member.
cTherefore, the available surface is very small for the development of skin friction between the solid surface of the geogrid and the adjacent soil. Figure 12 shows the longitudinal elements of the GF geogrid in detail.
WT
W 1 Lsub
W 1 Lsub = 1.25 mm
WT = 3.00 mm
Longitudinal elements composed by two “sub elements”
Transverse elements
a) b)
0 0.2 0.4 0.6 0.8 1 1.2 1.4 1.6 1.8 2Deformation ( % )
0
1000
2000
3000
4000
5000
6000
7000
8000
J U (
kN/m
)
cp 1cp 2cp 3cp 4
p
0
200
400
600
800
1000
1200
1400
1600cp 5cp 6cp 7cp 8cp 9
GF GG MD
cp 1cp 2cp 3cp 4cp 5
J U (
kN/m
)
PP GG MD
0 2 4 6 8 10 12 14 16 18 20Deformation ( % )
c) d)
0 2 4 6 8 10 12 14 16Deformation ( % )
0
1000
2000
3000
4000
5000
6000
7000
J U (
kN/m
)
PET GG MD
cp 1cp 2cp 3cp 4cp 5
0
1000
2000
3000
4000
5000
6000
7000
8000
0 2 4 6 8 10 12 14 16 18 20 22Deformation ( % )
J U (
kN/m
)
cp 1cp 2cp 3cp 4
PP GT MD
971
4. CONCLUSION Four rigid geosynt evaluated fo ement reinforcement purposes. The geosynthetics tested included glass fiber, polyp ter geogrid polypropylene woven geotextile. The evalu was done by using pullout tests i s ipment. An approach was developed in order to appl of the small pullout tests in road forcement. Clay an andy-silty gravel were used to s performance of the geosynthetics placed between the subgrade and yers of a road pavement. The main advantage of the approach done in this study, using small pullout test and qualitative analyses, is that an engineer can evaluate several different geosynthetics to be used with particular soils in a faster, practical and relatively cheap manner. The main conclusions that can be drawn from this study include: • s
. Consequently, the soil-reinforcement interact the PP geogrid and there is good evidence that this geogrid is better for pavement reinforcement than the other geosynthetics used in this work. Further research is needed to confirm this observation in the field.
• The reasons related to the low performance of the glass fiber geogrid were its low junction strength, high sensitivity
to installation damage, high manufacturing variability and low friction coefficient. These factors are related to geometric characteristics and manufacturing procedures. Consequently, improving these aspects would take advantage of the high potential of the glass fiber geogrid for pavement reinforcement.
ACKNOWLEDGEMENTS The writers would like to acknowledge the scholarship assistance of CNPq given to the first author and the Department of Geotechnical Engineering of University of Sao Paulo at Sao Carlos. The authors are also thankful to Ranjiv Gupta, PhD candidate of the Civil Engineering Department-GEO of The University of Texas at Austin, for giving information and sending part of the materials used in this study from Austin-USA to Sao Carlos-Brazil.
REFERENCES ASTM D 6637. Standard test method for determining tensile properties of geogrids by the single or multi-rib tensile
method. American Society for Testing and Materials, West Conshohocken, Pennsylvania, USA. ASTM D 6706. Standard test method for measuring geosynthetic pullout resistance in soil. American Society for Testing
and Materials, West Conshohocken, Pennsylvania, USA. ASTM D 422. Standard test method for particle-size analysis of soils. American Society for Testing and Materials, West
Conshohocken, Pennsylvania, USA. Chan, F., Barksdale, R.D., Brown, S.F. (1989). Aggregate base reinforcement of surfaced pavements. Geotextiles and
Geomembranes, 8: 165-189. Chang, D.T., Wang, W.J., Wang, Y.H. (1998). Laboratory study of the dynamic test system on geogrid reinforced
subgrade soil. 6ICG, IGS, Atlanta, USA, 967-970. Dondi, G. (1994). Three-dimensional finite element analysis of a reinforced paved road. 5th International Conference on
Geotextiles, Geomembranes and Related Products, Singapore, 95:100. Giroud, J.P.; Han, J. (2004). Design method for geogrid-reinforced unpaved roads. I. Development of Design Method.
Journal of Geotechnical and Geoenvironmental Engineering, 130: 775-786. Gupta, R., Zornberg, J.G., Prozzi, J. (2008). 0-5812 . TxDOT CTR Report (In preparation). Jewell, R.A. (1990). Strength and deformation in reinforced soil design. 4th International Conference on Geotextiles,
Geomembranes and Related Products, Balkema, The Hague, The Netherlands, 3: 913-946. Ju, J.W., Park, J.B., Song, C.S., Chun, S., Cho, S.D. and Kim, J.H. (2006). New definition of pullout constant. 8ICG, IGS,
Yokohama, Japan, 1437-1441. Kakuda, F.M., Bueno, B.S. and Teixeira, S.H.C. (2006). Geogrid pullout tests using small scale equipment. 8ICG, IGS,
Yokohama. Japan, 1443-1446. Nakamura, T., Mitachi, T. and Ikeura, I. (2003). Estimating method for the in-soil deformation behavior of geogrid based
on the results of direct box shear test. Soil and Foundations, 43: 47-57. Perkins, S.W. (1999). Mechanical Response of Geosynthetic-Reinforced Flexible Pavements. Geosynthetics
International, 6: 347-382. Teixeira (2003). Estudo da interação solo-geogrelha em testes de arrancamento e a sua aplicação na análise e
dimensionamento de maciços reforçados. PhD dissertation, Dept. of Geotechnical Engineering, Engineering School of Sao Carlos, Univ. of Sao Paulo (in Portuguese).
hetics were ropylene and polyes
r pavs; and a ation
y the results tudy the
n ma pullout equ pavement rein
ll d sbase course la
The junction strength is the most important factor influ ing the confined stiffness of geogrids. This parameter wamore important for confined stiffness than the unconfined stiffness of the geosynthetics used in this study
ion was favorable for
enc
972