Pavement Management Systems: L.A. County perspective
17
LOS ANGELES COUNTY’S PAVEMENT MANAGEMENT SYSTEM STANTEC ROADMATRIX Network Level Approach To Managing County Roads Presented by: IMELDA DIAZ, PE,APM, MS Geotechnical & Materials Engineering Division - Pavement Management Unit April 15, 2015
-
Upload
california-asphalt-pavement-association -
Category
Engineering
-
view
78 -
download
4
Transcript of Pavement Management Systems: L.A. County perspective

LOS ANGELES COUNTY’SPAVEMENT MANAGEMENT SYSTEM
STANTEC ROADMATRIX
Network Level Approach To Managing County RoadsPresented by: IMELDA DIAZ, PE,APM, MS
Geotechnical & Materials Engineering Division - Pavement Management Unit
April 15, 2015
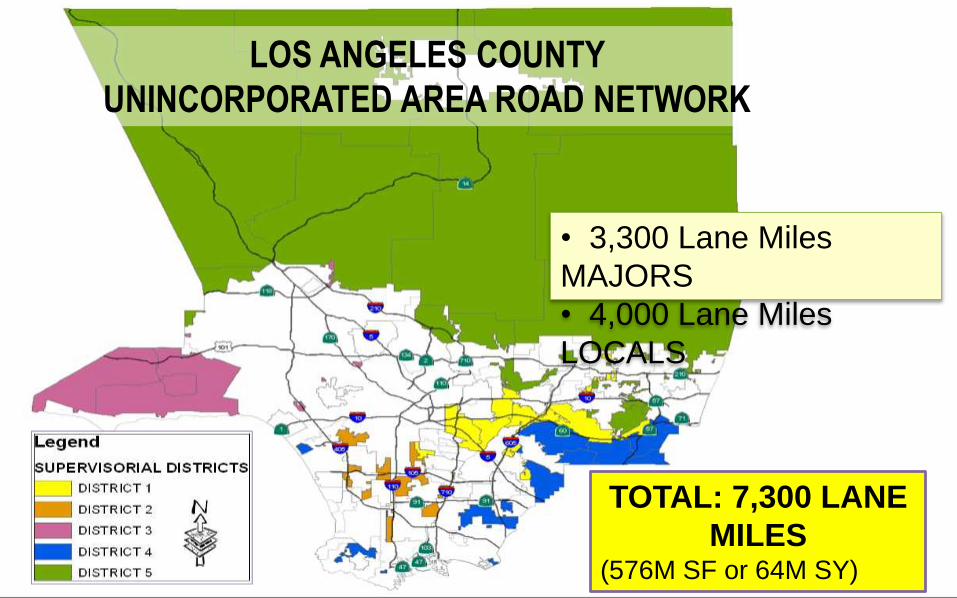
LOS ANGELES COUNTY
UNINCORPORATED AREA ROAD NETWORK
• 3,300 Lane Miles
MAJORS
• 4,000 Lane Miles
LOCALS
TOTAL: 7,300 LANE
MILES(576M SF or 64M SY)

NORTH COUNTY NETWORK
51% of Network
57% Rural - 2 lanes
Low to Moderate Traffic
No Curb and Gutter
Extreme Temp. Fluctuations

49% of Network
92% Urban – 4 to 7 lanes
Moderate - High traffic
Commercial / Residential
SOUTH COUNTY(LA BASIN)NETWORK
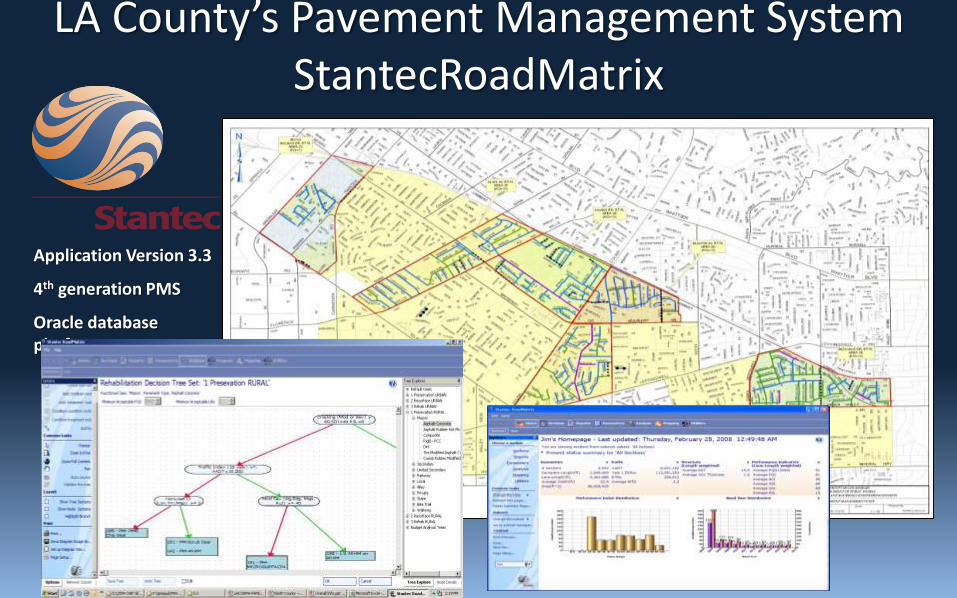
LA County’s Pavement Management System StantecRoadMatrix
Application Version 3.3
4th generation PMS
Oracle database platform

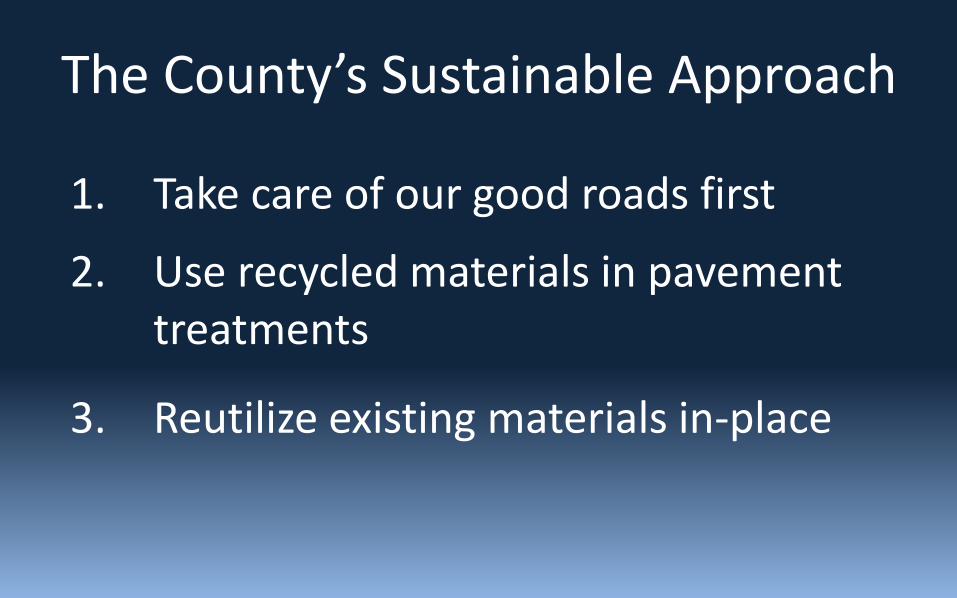
The County’s Sustainable Approach
1. Take care of our good roads first
2. Use recycled materials in pavement treatments
3. Reutilize existing materials in-place

Typical Pavement Performance Curve
Preservation ($0.20-$1.25/sf)
Resurface ($1.75-$2.50/sf)
Major Rehabilitation ($3-$5/sf)
Reconstruction ($6-$12/sf)

Pavement Performance Prediction CurvesP
av
em
en
t C
on
dit
ion
In
dex
(PC
I)
100
80
60
40
20
Thick Pavement
Low Traffic
Strong Subgrade
Thin Pavement
High Traffic
Weak Subgrade

Decision Tree Analysis
What are the possible
treatment alternatives?
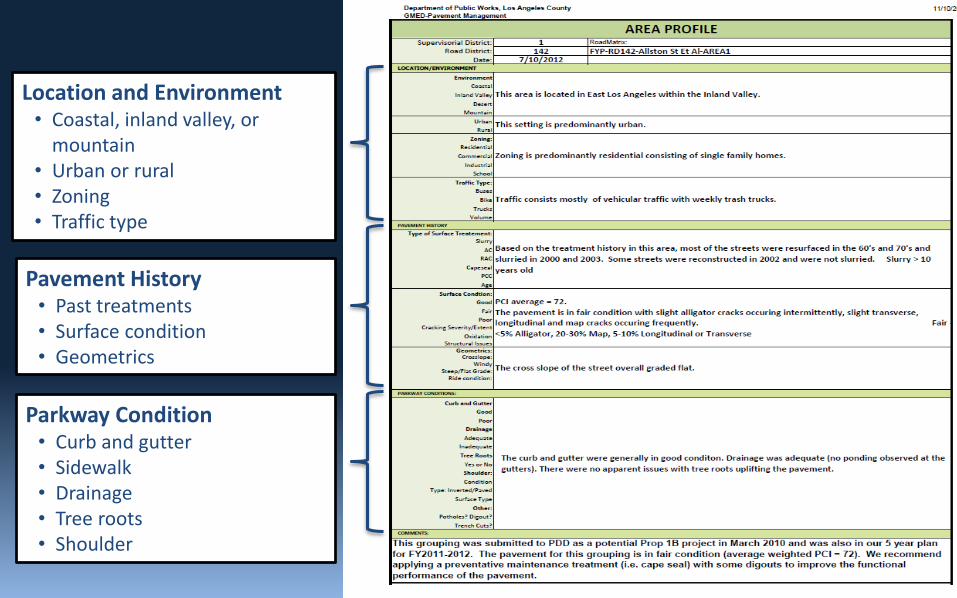
Location and Environment• Coastal, inland valley, or
mountain• Urban or rural• Zoning • Traffic type
Pavement History• Past treatments• Surface condition• Geometrics
Parkway Condition• Curb and gutter• Sidewalk• Drainage• Tree roots• Shoulder

Road District 142

BEFOREGIS
COMPONENT

Sustainable Approach vs. Worst First
52%34%
12%
2%COUNTY'S THREE-PRONGED SUSTAINABLE APPROACH
Good-Excellent
At Risk
Poor
Failed
42%
41%
15%
2%WORST FIRST APPROACH (PROJECTED)
Good-Excellent
At Risk
Poor
Failed
Square footage to be treatedRoads rated Good-Excellent
Roads rated Poor & FailedOverall Network PCI
145MSF 45MSF 100MSF52% 42%Almost25%increase
14% 17% Almost 20%decrease
71 66 Almost 10% increase
3-Pronged Sustainable Approach
Worst FirstApproach
(Projected) Δ100,000 tons of CO2E reduced

0
10,000,000
20,000,000
30,000,000
40,000,000
50,000,000
60,000,000
FY 09-10 FY 10-11 FY 11-12 FY 12-13 FY 13-14
AR
EA, S
F
FIVE YEAR ROAD PROGRAMTREATMENT CATEGORIES TO MAINTAIN EXISTING PCI FOR MAJORS AND LOCAL SYSTEM
PREVENTATIVE MAINTENANCE RESURFACE REHABILITATION RECONSTRUCTION
PCI AFTER= 76TOTAL = 48 MSFTOTAL = $91M
PCI AFTER= 76 PCI AFTER= 76PCI AFTER= 77PCI AFTER= 77TOTAL = 30 MSFTOTAL = $65M
TOTAL = 41 MSF TOTAL= 58.5 MSFTOTAL = $66M
TOTAL = 39.7 MSFTOTAL = $68M TOTAL= $57M
LEGEND:

5-Year Work History & Network PCI
32MSF
8.5MSF 12MSF
16.6MSF
8.8MSF
$66M
$15M
$30M
$26M
$19M
76
74
73
72
71
68
69
70
71
72
73
74
75
76
77
-
10
20
30
40
50
60
70
FY 2009/10 FY 2010/11 FY 2011/12 FY 2012/13 FY 2013/14
Mill
ion
s Sq
uar
e Fe
et (
MSF
)
Pavement Preservation ($1.0/SF)
Resurface ($2/SF)
Rehab/Recon ($3-5/SF)
Treatment Cost ($)
Weighted Avg. PCI
Weigh
ted
Avg. P
CI

Pavement Management System Core Principles
Decisions Based on Quality Information
Performance Based
Various Scenarios/Alternatives Evaluated
Policy Driven
Clear Accountability