Pavel Hajda, Ph.D., P.E., Symbiont - c.ymcdn.comc.ymcdn.com/sites/ · 1. Identify technologies...
37
Pavel Hajda, Ph.D., P.E., Symbiont
Transcript of Pavel Hajda, Ph.D., P.E., Symbiont - c.ymcdn.comc.ymcdn.com/sites/ · 1. Identify technologies...
Pavel Hajda, Ph.D., P.E., Symbiont
1. 2011 IAWA Nutrient Study
2. Supplemental analysis
3. Other efforts
4. Conclusions
1. Identify technologies widely applicable to P and/or N removal upgrades
2. Assess the expected performance of those technologies
3. Express the above as effluent standard concepts
4. Support reasonable technology requirements in Springfield

Literature review focusing on established technologies
Critical assessment of the statistical basis of performance
Qualitative identification of sustainability issues (chemicals, sludge, and energy)
Only incidental coverage of costs

Biases:
where, when, for how long, in what plant context
potential gain or loss (information source/user)
Approach in this study:
reasonable target plant (not best in class)
central tendency of sustained operation
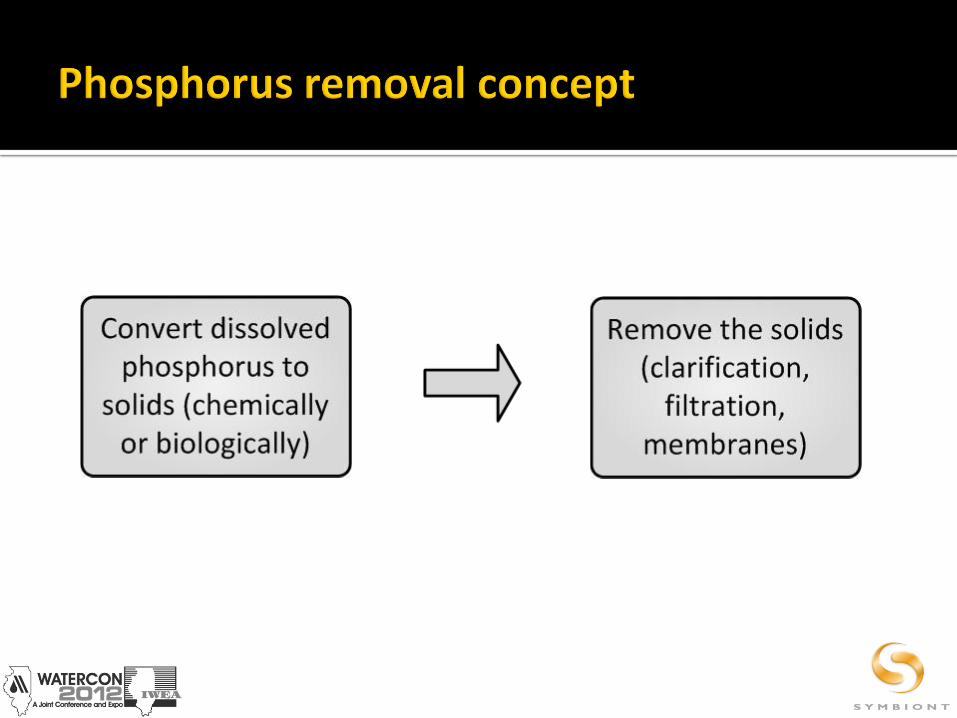

Configure activated sludge for biological phosphorus removal
Add metal salt to precipitate/adsorb dissolved phosphorus
Enhance solids removal beyond conventional secondary clarification
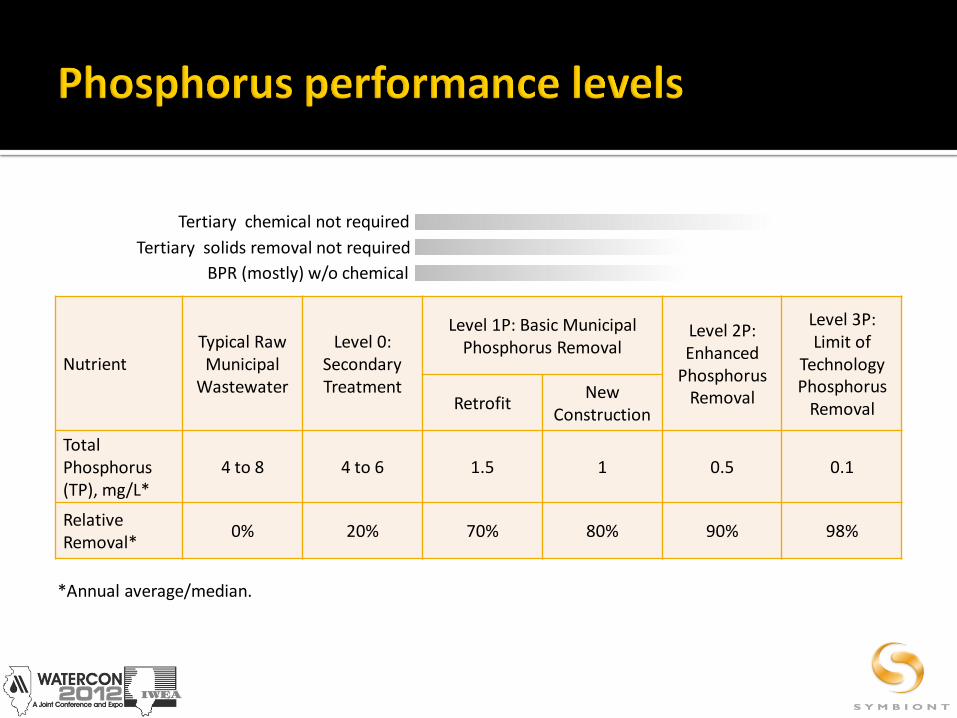
Nutrient Typical Raw Municipal
Wastewater
Level 0: Secondary Treatment
Level 1P: Basic Municipal Phosphorus Removal
Level 2P: Enhanced
Phosphorus Removal
Level 3P: Limit of
Technology Phosphorus
Removal Retrofit New
Construction
Total Phosphorus (TP), mg/L*
4 to 8 4 to 6 1.5 1 0.5 0.1
Relative Removal*
0% 20% 70% 80% 90% 98%
BPR (mostly) w/o chemical
Tertiary solids removal not required
Tertiary chemical not required
*Annual average/median.
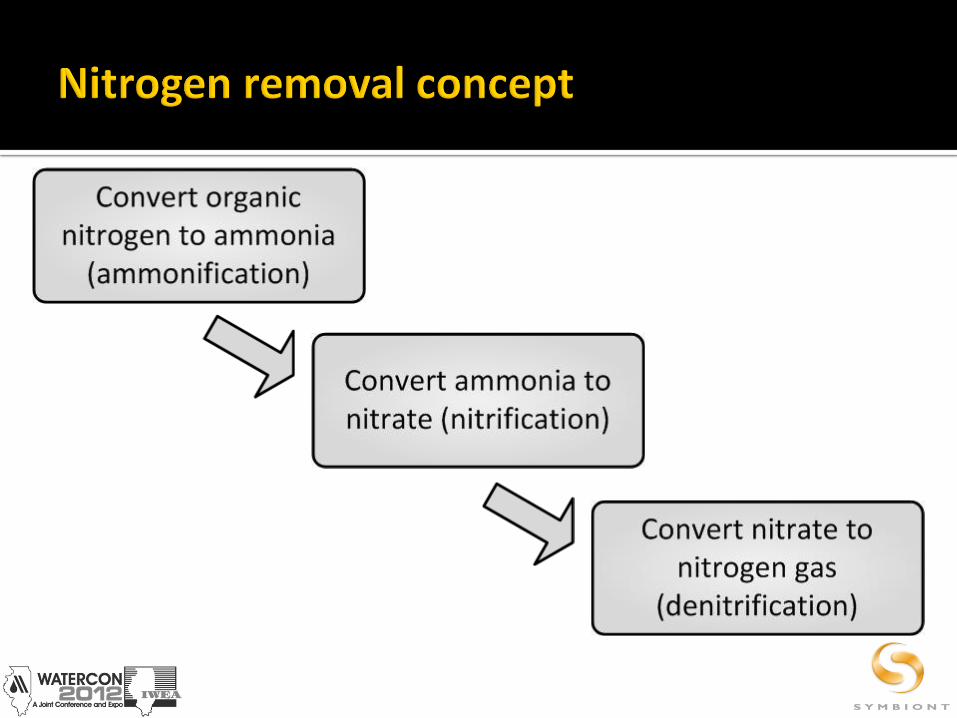

How implemented:
combine biological nitrification with
▪ pre-anoxic zones (MLE), post-anoxic zones (Wuhrmann), simultaneous denitrification (macro or micro); and/or
▪ separate-stage (tertiary) denitrification activated sludge or attached-growth system

Nutrient Typical Raw Municipal
Wastewater
Level 0: Secondary Treatment
Level 1N: Basic Municipal Nitrogen Removal
Level 2N: Enhanced Nitrogen Removal
Level 3N: Limit of
Technology Nitrogen Removal Retrofit
New Construction
Total Nitrogen (TN), mg/L*
25 to 35 20 to 30 15 10 6 3
Total Inorg. N (TIN), mg/L*
12 8
Relative Removal (TN)*
0% 20% 50% 70% 80% 90%
Pre-anoxic zones sufficient
Supplemental carbon not required
Tertiary treatment not required
*Annual average/median.
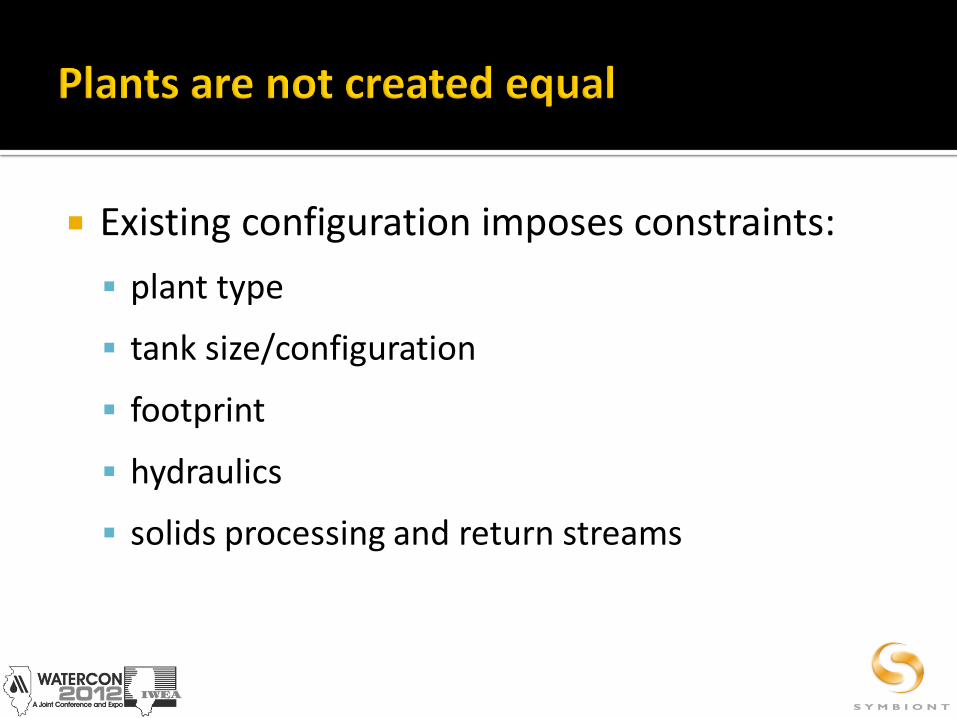
Existing configuration imposes constraints:
plant type
tank size/configuration
footprint
hydraulics
solids processing and return streams
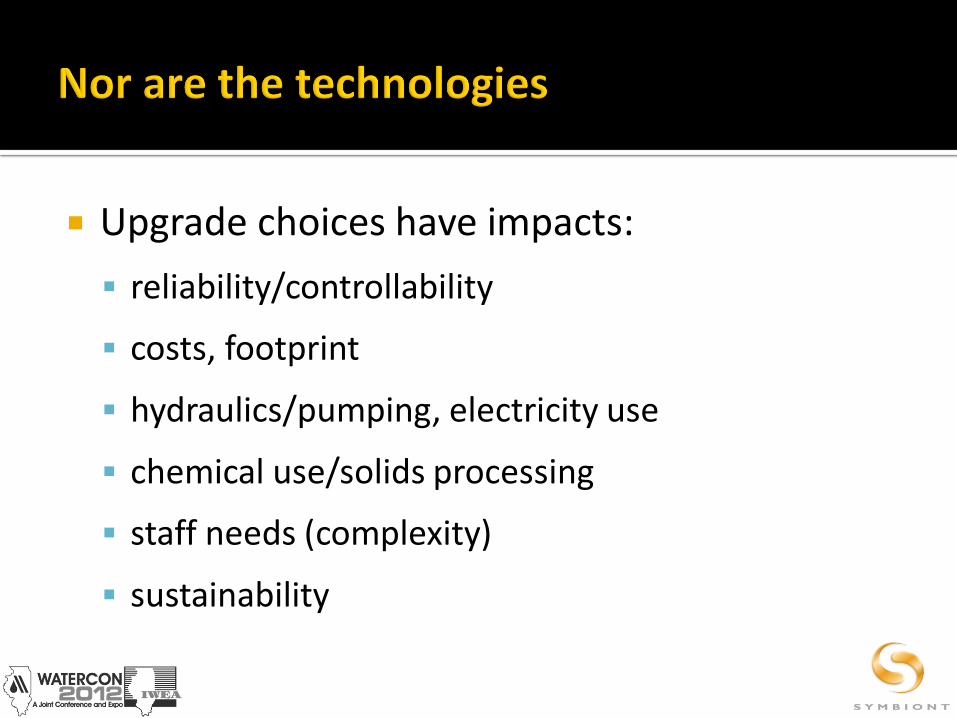
Upgrade choices have impacts:
reliability/controllability
costs, footprint
hydraulics/pumping, electricity use
chemical use/solids processing
staff needs (complexity)
sustainability
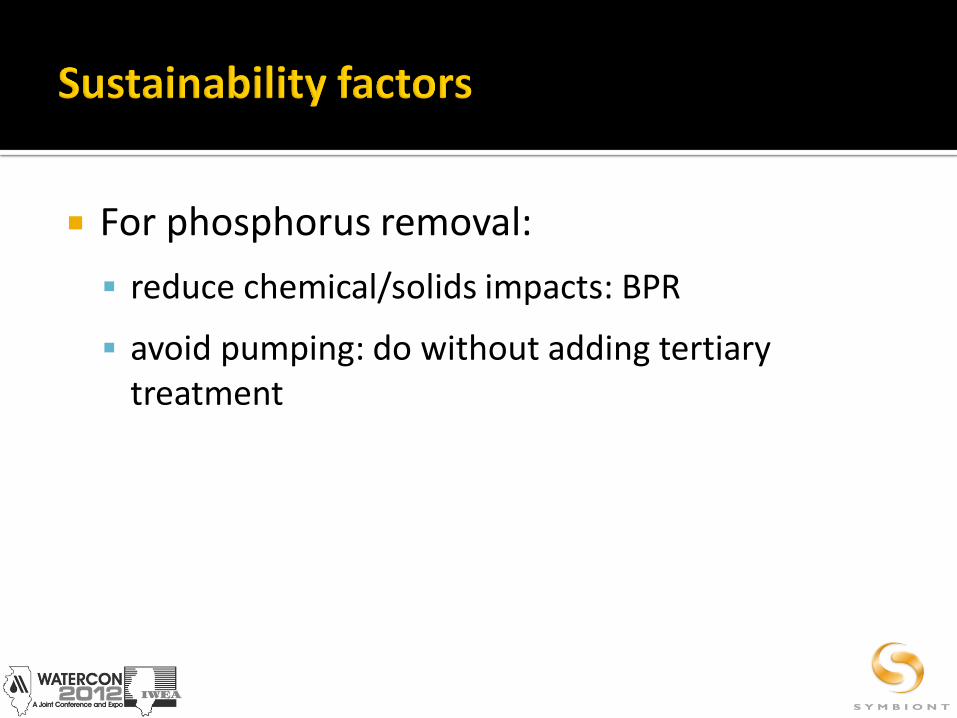
For phosphorus removal:
reduce chemical/solids impacts: BPR
avoid pumping: do without adding tertiary treatment
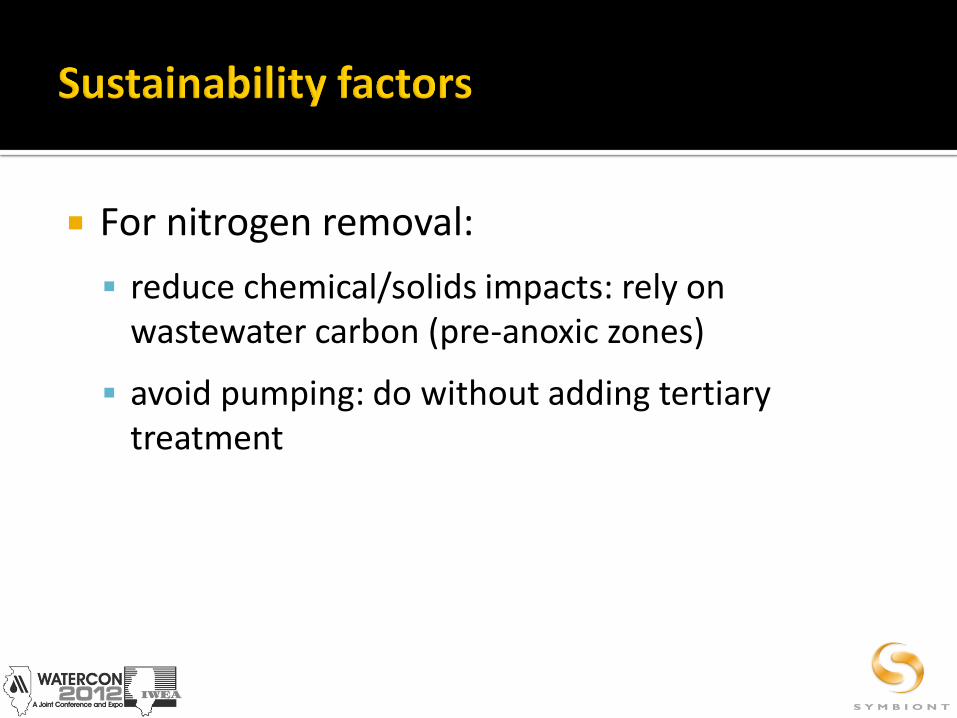
For nitrogen removal:
reduce chemical/solids impacts: rely on wastewater carbon (pre-anoxic zones)
avoid pumping: do without adding tertiary treatment

Very site-specific, but tend to increase with
number of nutrients to be removed
stringency of nutrient limits
existing plant/process constraints
for unit costs ($/gal): decreasing plant capacity


Making the same limit harder to meet:
shorter averaging periods (small “sample” n)
mean harder than median
absolute compliance harder than probabilistic
local conditions (influent, temperature…)
full inclusion of unknown refractory fractions
the rest of the permit (N/P, NH3, Al, Fe, Cl-, SO42-)

No standards for small plants
Annual medians for the rest:
TP at Level 1P
if nitrogen: TIN at Level 1N, with relative removal as an optional compliance pathway

“Report not strong enough to justify [Level 1P] standards”
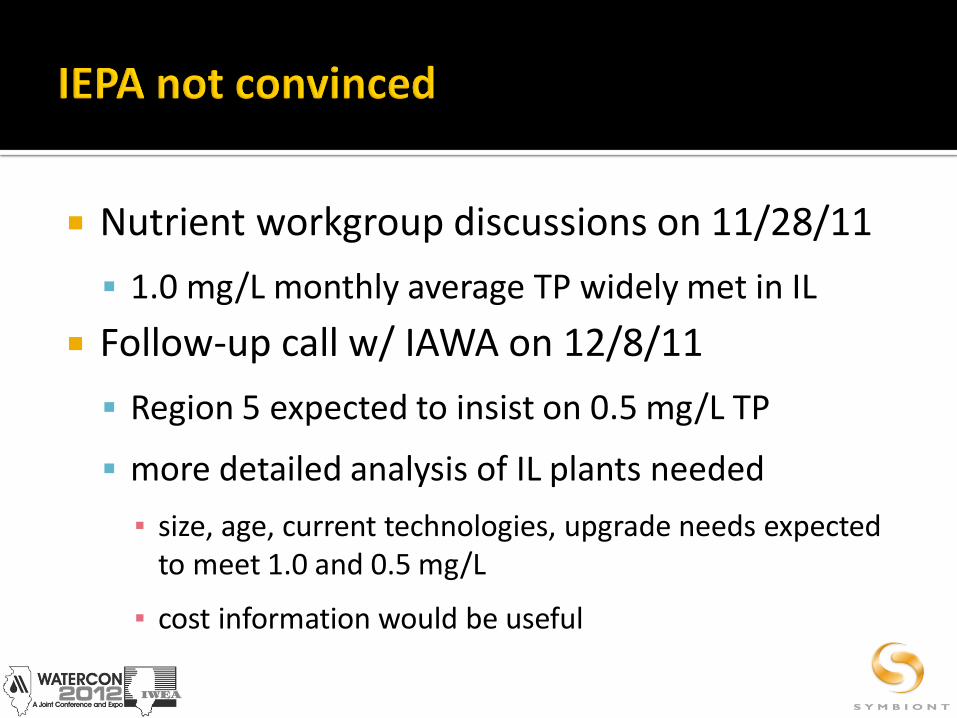
Nutrient workgroup discussions on 11/28/11
1.0 mg/L monthly average TP widely met in IL
Follow-up call w/ IAWA on 12/8/11
Region 5 expected to insist on 0.5 mg/L TP
more detailed analysis of IL plants needed
▪ size, age, current technologies, upgrade needs expected to meet 1.0 and 0.5 mg/L
▪ cost information would be useful
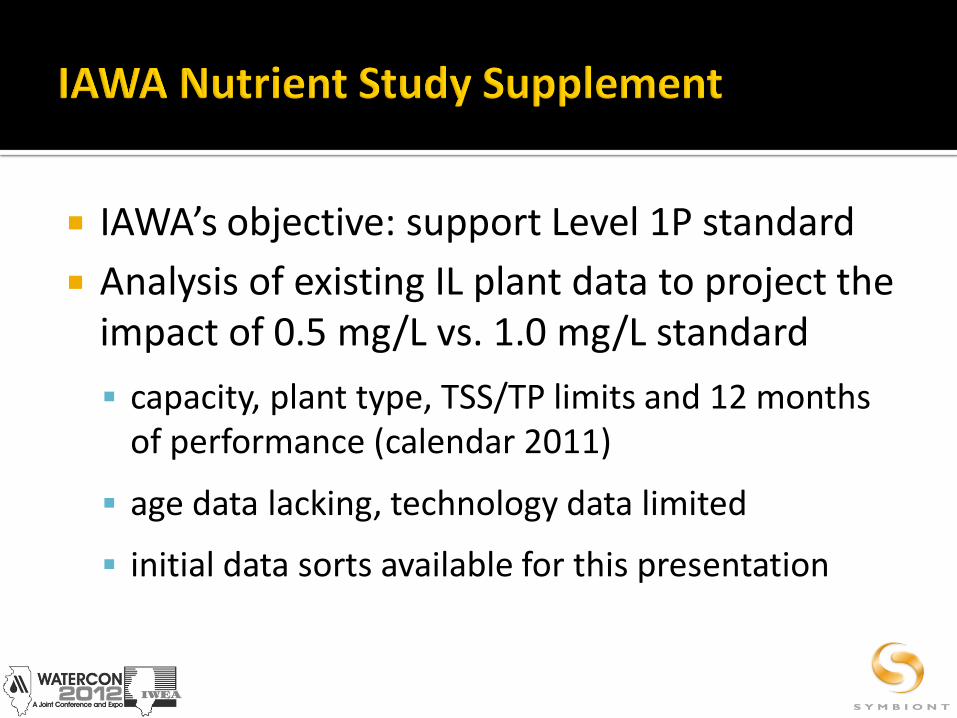
IAWA’s objective: support Level 1P standard
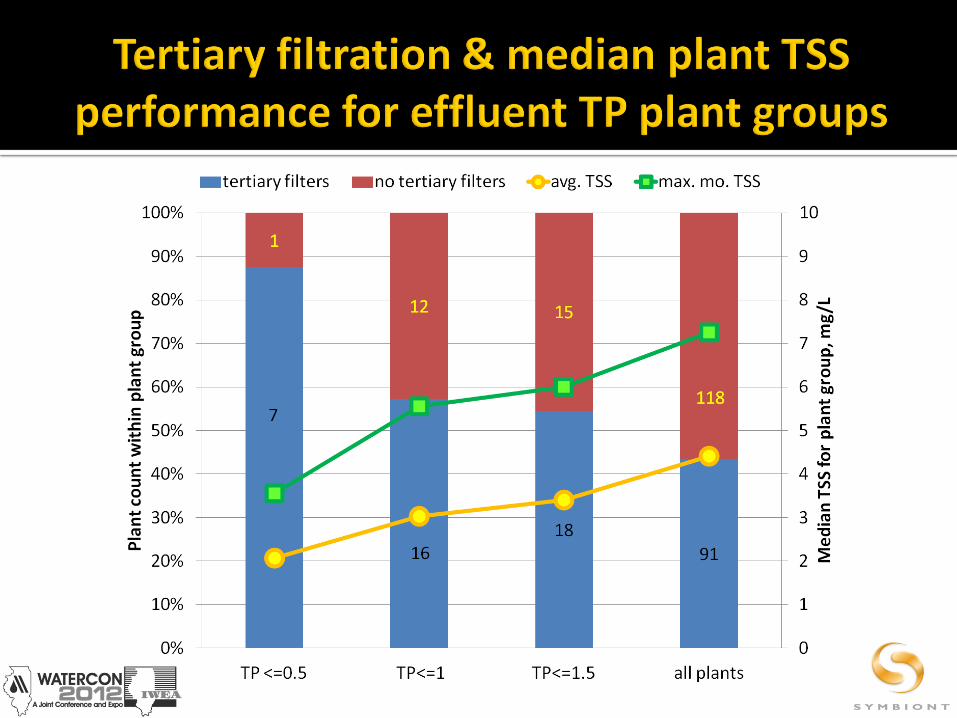
Analysis of existing IL plant data to project the impact of 0.5 mg/L vs. 1.0 mg/L standard
capacity, plant type, TSS/TP limits and 12 months of performance (calendar 2011)
age data lacking, technology data limited
initial data sorts available for this presentation
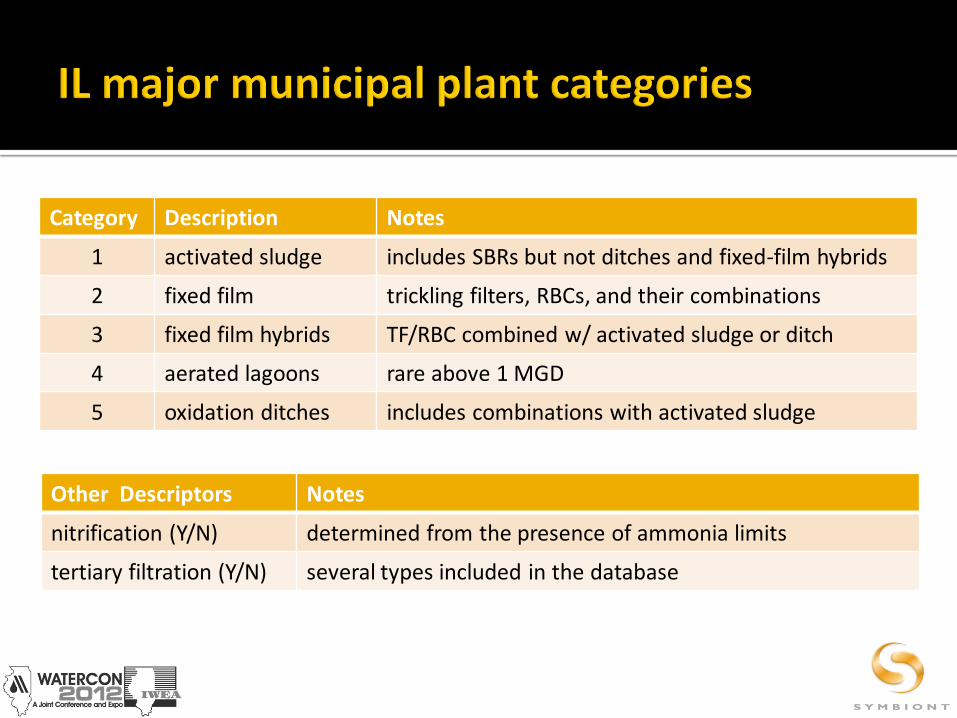
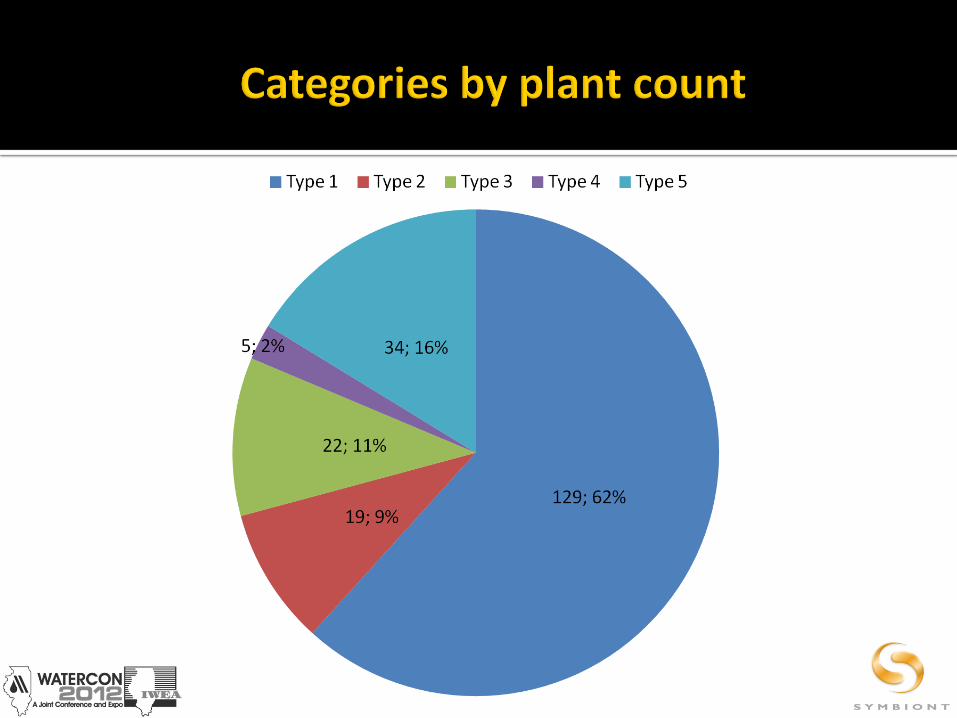
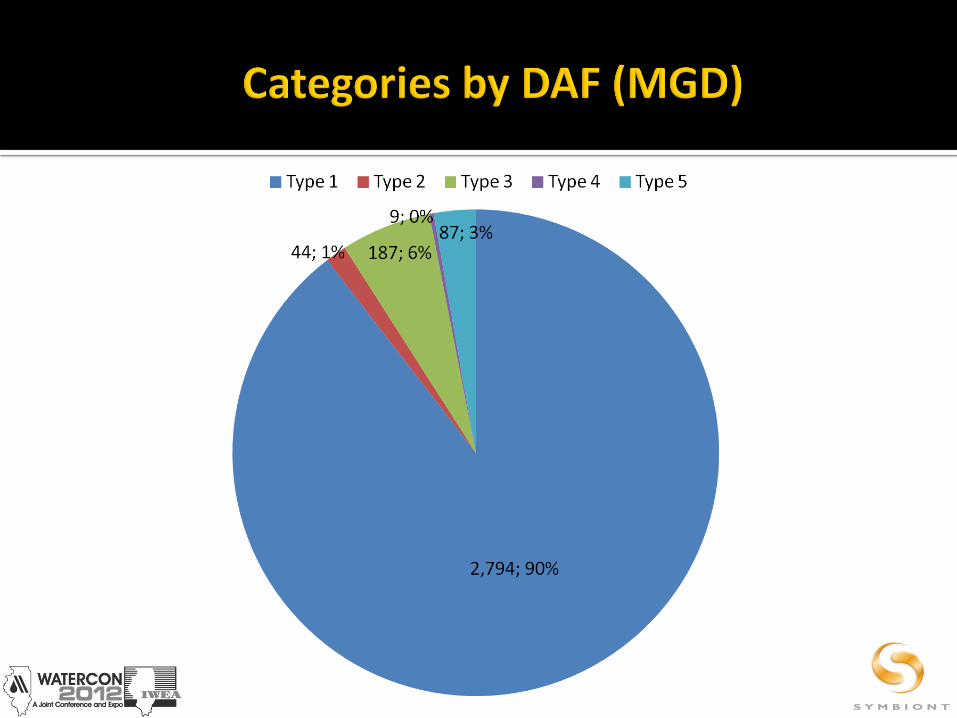
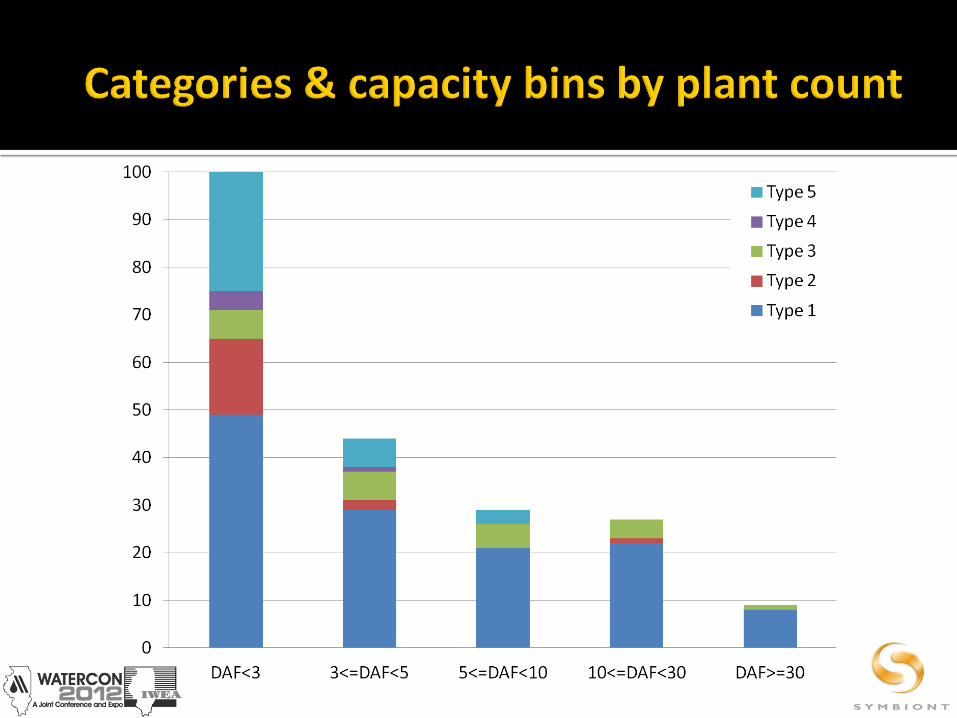
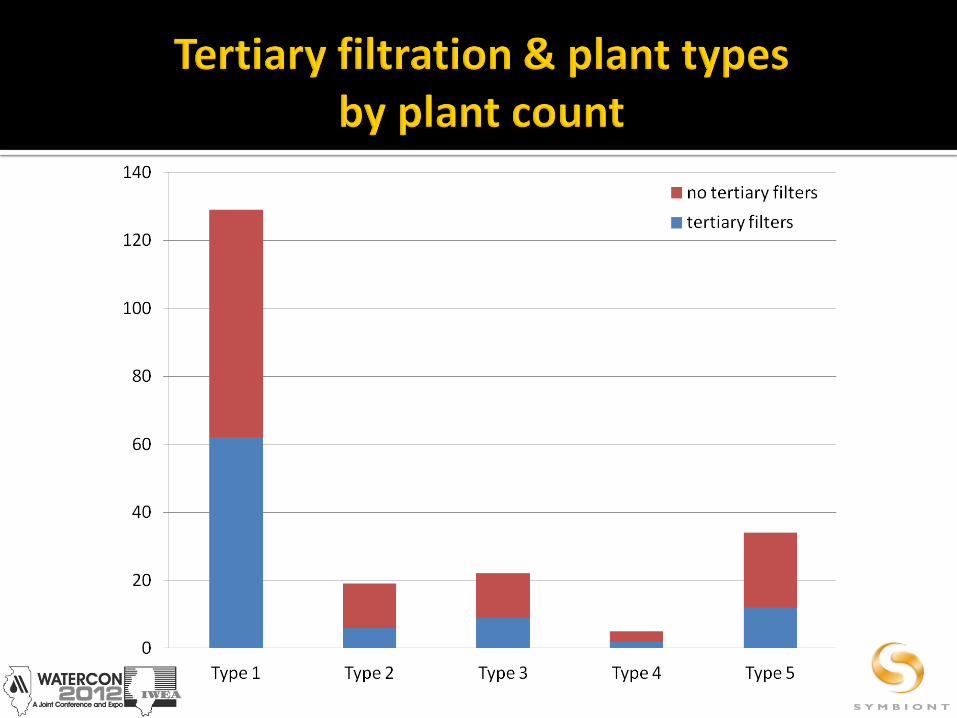
Category Description Notes
1 activated sludge includes SBRs but not ditches and fixed-film hybrids
2 fixed film trickling filters, RBCs, and their combinations
3 fixed film hybrids TF/RBC combined w/ activated sludge or ditch
4 aerated lagoons rare above 1 MGD
5 oxidation ditches includes combinations with activated sludge
Other Descriptors Notes
nitrification (Y/N) determined from the presence of ammonia limits
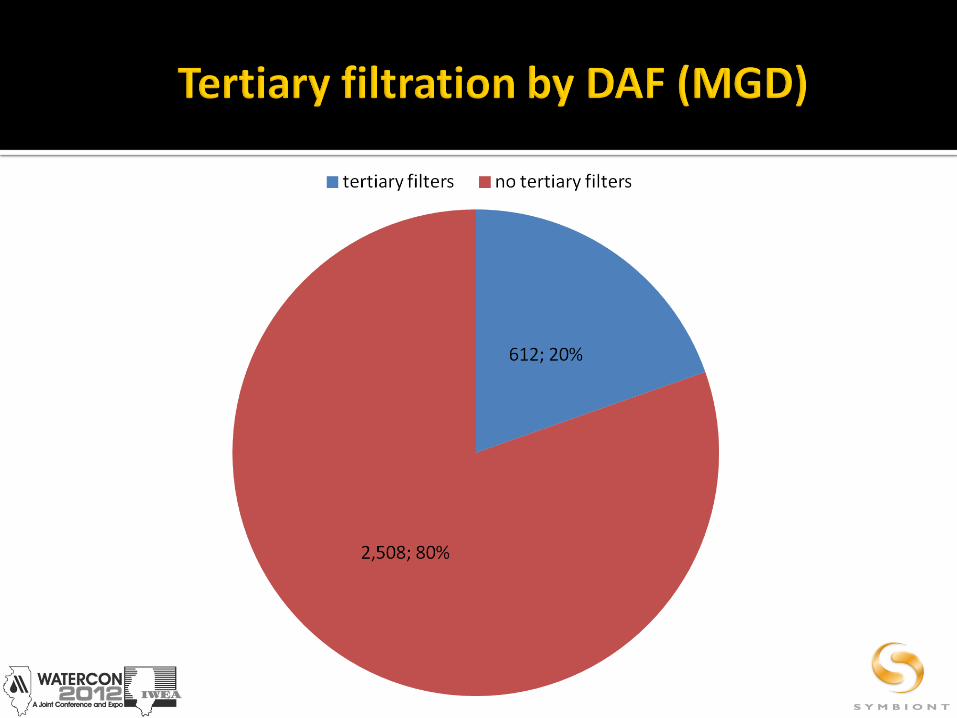
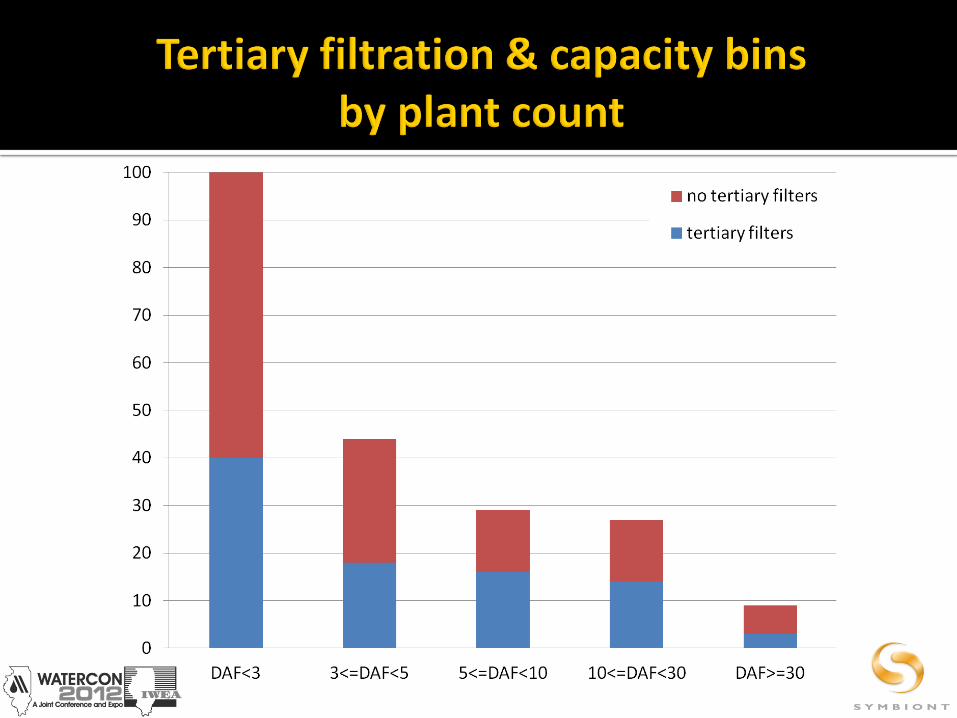
tertiary filtration (Y/N) several types included in the database


IWEA Nutrients Committee:
Nutrient Survey results in “late spring or early summer 2012”
focused on available and planned nutrient removal technologies and costs
Technology Standards Stakeholder Subgroup
18 volunteers
venue likely to bring other efforts together

The rulemaking outcome likely to reflect
technology performance expectations
conclusions from statewide and plant-specific data
upgrade cost expectations
All of the above likely to be subjective
promote sensible outcomes by committed participation in the rulemaking process

Pavel Hajda Symbiont (414)291-8840 [email protected]