Paulo Arvate São Paulo School of Business Administration ... · Administration at Getúlio Vargas...
32
CONDEMNING CORRUPTION WHILE CONDONING INEFFICIENCY: AN EXPERIMENTAL INVESTIGATION INTO VOTING BEHAVIOR * Paulo Arvate São Paulo School of Business Administration Center for Applied Microeconometrics (C-Micro) Getúlio Vargas Foundation 1 Sergio Mittlaender Leme de Souza Max Planck Institute for Social Law and Social Policy 2 ABSTRACT This article reports results from an economic experiment that investigates to what extent voters punish corruption and waste in elections. While both are responsible for a loss of welfare for voters, they are not necessarily perceived as equally immoral. The empirical literature in political agency has not yet dealt with these two dimensions that determine voters’ choices. Our results suggest that morality and norms are indeed crucial for a superior voting equilibrium in systems with heterogeneous politicians: while corruption is always punished, self-interest alone – in the absence of norms – leads to the acceptance and perpetuation of waste and social losses. JEL code: C91, D72, H23, H72. Keywords: corruption; waste; elections; experiment. * The authors would like to thank Rodrigo Bandeira de Mello, Paola Bertoli, Maria Bigoni, Boudewijn Bouckaert, Marco Casari, Bruno Ferman, Andrea Ichino, Rosilene Marcon, Alan Miller, Dennis Müller, Marcos Nakaguma, Thomas Ulen, Sergio Werlang, Christian Zehnder, and participants at the European Public Choice Society 2016, 5th Southern Europe Experimentalist Meeting, 11th Italian Society of Law and Economics, European Master in Law and Economics Midterm Meeting, and São Paulo School of Business Administration Seminar Series for suggestions and contributions to the research project. The authors are also grateful to André Prunner, Giovana Bueno, Gisele Galilea, and Marina Gama for their assistance in implementing the experiment at the University of the Itajaí Valley, in Itajaí, Brazil, in November 2014. Financial support for the experiment was provided by the São Paulo School of Business Administration at Getúlio Vargas Foundation. 1 Rua Itapeva 474, 01332-000 São Paulo, Brazil, 55 11 32817765, [email protected] 2 Amalienstraße 33, 80799 Munich, Germany, 49 89 38602407, [email protected]
Transcript of Paulo Arvate São Paulo School of Business Administration ... · Administration at Getúlio Vargas...

CONDEMNING CORRUPTION WHILE CONDONING INEFFICIENCY: AN EXPERIMENTAL INVESTIGATION INTO VOTING BEHAVIOR*
Paulo Arvate
São Paulo School of Business Administration Center for Applied Microeconometrics (C-Micro)
Getúlio Vargas Foundation1
Sergio Mittlaender Leme de Souza
Max Planck Institute for Social Law and Social Policy2
ABSTRACT
This article reports results from an economic experiment that investigates to what extent voters punish corruption and waste in elections. While both are responsible for a loss of welfare for voters, they are not necessarily perceived as equally immoral. The empirical literature in political agency has not yet dealt with these two dimensions that determine voters’ choices. Our results suggest that morality and norms are indeed crucial for a superior voting equilibrium in systems with heterogeneous politicians: while corruption is always punished, self-interest alone – in the absence of norms – leads to the acceptance and perpetuation of waste and social losses.
JEL code: C91, D72, H23, H72.
Keywords: corruption; waste; elections; experiment.
* The authors would like to thank Rodrigo Bandeira de Mello, Paola Bertoli, Maria Bigoni, Boudewijn Bouckaert, Marco Casari, Bruno Ferman, Andrea Ichino, Rosilene Marcon, Alan Miller, Dennis Müller, Marcos Nakaguma, Thomas Ulen, Sergio Werlang, Christian Zehnder, and participants at the European Public Choice Society 2016, 5th Southern Europe Experimentalist Meeting, 11th Italian Society of Law and Economics, European Master in Law and Economics Midterm Meeting, and São Paulo School of Business Administration Seminar Series for suggestions and contributions to the research project. The authors are also grateful to André Prunner, Giovana Bueno, Gisele Galilea, and Marina Gama for their assistance in implementing the experiment at the University of the Itajaí Valley, in Itajaí, Brazil, in November 2014. Financial support for the experiment was provided by the São Paulo School of Business Administration at Getúlio Vargas Foundation. 1 Rua Itapeva 474, 01332-000 São Paulo, Brazil, 55 11 32817765, [email protected] 2 Amalienstraße 33, 80799 Munich, Germany, 49 89 38602407, [email protected]
1. Introduction
Elections serve two main functions in representative democracies: they allow voters to select the
politicians that best represent their preferences and to punish incumbents that misbehave. Theory
(Barro 1973; Ferejohn 1986; Persson and Tabellini 2002), corroborated by evidence (Ferraz and
Finan 2008, 2011; Winters and Weitz-Shapiro 2013), reveals that voters punish corrupt
incumbents whenever they have access to credible and reliable information about acts of
corruption. Politicians, however, misbehave both when they engage in corruption and when they
create waste of public resources because of their mismanagement or misuse (Bandiera et al. 2009).
Waste and corruption are both responsible for a loss of welfare for the voters, but these may not
perceive them as equally unacceptable. Voters might be willing to condemn corruption, but also
to condone waste.
The recent Brazilian case involving the giant oil-company Petrobrás – pivotal to the recent
political crisis that engulfed the country – is representative of this situation in the real world. The
company is partially owned by the state, which appoints several directors and its chairman, which
included Brazilian president Dilma Rousseff prior to her election for presidency. In 2014, the
audited losses occasioned by corrupt activities involving its activities were of around 6 billion
Reais; losses due to misuse and mismanagement of resources were seven times higher, of around
44 billion Reais.3 In the first six months of 2015, a nationwide study in Italy by the financial police
investigated 4,835 civil servants and estimated a total loss of 3 billion Euros either because of
corruption or waste. Around 1 billion Euros was lost because of mismanagement of property
3 As in the audited balance sheet of the company for the year 2014 (by Mckinsey & Co.), released on April 22, 2015.

assets, and another 800 million Euros were lost because of extensive waste in the health sector.
Corrupt cases accounted for a significant but smaller loss of 1.3 billion Euros.4
Recent models in political agency take into account the heterogeneity among politicians
and show that those that misbehave can, in certain situations, survive reelections if voters seek to
maximize individual gains (Besley 2006; Besley and Smart 2007). Politicians differ from each
other in competence, and their skill in bargaining over the distribution of public funds, and to
provide pork to their constituents is a preponderant component of their competence in the political
economy literature (see, e.g., Coate and Morris 1995). A politician that embezzles or wastes public
funds can survive reelections if she brings more pork to her constituents than other politicians that
do not misbehave. In this case, voters face a trade-off between what is best for themselves and
what is best for society, and elections might fail to concomitantly select the politicians that best
represent voters’ interests and to punish those that misbehave.
We investigate voters’ behavior when this trade-off is present, and when voters’ decision
is not trivial. When the politician that is the most skilled one does not misbehave, then voters are
univocally expected to select this candidate, and no problem emerges. The same is true when the
politician that misbehaves is not skilled in bringing home the bacon: voters are then univocally
expected to punish her in reelections. We consider the situation in which voters have to choose
between a politician that provides them more pork but misbehaves (either by engaging in
corruption or by creating waste), and another competitor that provides them less pork but does not
misbehave.
4 As reported by Corriere della Sera, September 21, 2015.

Voters may condone politicians that misbehave because of the absence of a norm that they
ought not do it, and that can allow voters to coordinate their actions. A norm, if agreed and accepted
by the majority of the voters is apt to induce them to reject those politicians even when monitoring
and sanctioning by other citizens is impossible: since the vote is secret, voters do not observe the
vote of the others, and are bound only by their conscience. We therefore study, in addition, how
far such a non-binding norm, agreed upon by the majority of the voters, allows them to overcome
their self-interest and to consider the social interest when casting the ballot.
Our results reveal, firstly, that voters overwhelmingly condemn corrupt politicians, almost
completely eliminating their electoral chances, but very often condone politicians who only create
waste. Unlike previous lab experiments that investigate corruption in the bribe game, and that
found weak or no evidence for the moral costs of corruption (Abbink and Hennig-Schmitt 2006;
Barr and Serra 2009), our game includes the negative externality of corruption in elections and
confirms that corruption is strongly punished. In contrast, results reveal that voters often condone
politicians that create an equal loss of welfare because of waste of public funds. Lastly, a norm
that is accepted by the majority of the citizens allows voters to coordinate their actions and
encourages them to consider the interests of the whole society, and not only of their district.
Results from lab experiments in corruption have been found to be generalizable outside the
lab and, to some extent, also across cultures (Barr and Serra 2010; Armantier and Boly 2012,
2013), providing support for their external validity. While cultural differences might affect the
propensity of individuals to punish corrupt behavior, individuals engage in that type of punishment
in a wide variety of countries (Cameron et al. 2009, Barr and Serra 2010). Experimental evidence
is therefore capable of providing meaningful insights into voting behavior and into the effect of
norms, as well as useful recommendations for policymakers.

The type of coordination created by norms can be achieved, in reality, by the individuals
themselves, backed up by NGOs and other actors, and need not be enforced by the state or by the
law. There is willingness to abide by a legitimate norm even in secret ballots, when punishment
for deviation is not possible because the vote is secret and hence not observable to others. However,
for this norm to be effective, voters need to have information on amounts of waste created by the
activities of different politicians. The provision of information concerning amounts embezzled is
widely encouraged by the law and by different political and social organizations. We argue that
equally or perhaps even more important for the welfare of voters is information concerning waste,
so that possibly existing norms that waste ought not to be condoned can be effective.
The paper is structured in the following way. In section 2, theoretical and empirical studies
on the role of elections to punish politicians that misbehave are reviewed together with the existing
experimental studies on corruption, which commonly focus on the bribe game, and not on
elections. Section 3 presents the experimental study, the implemented game and treatments, and
hypotheses under scrutiny. Results are presented and analyzed in section 4, and section 5
concludes.
2. Related literature
The role of elections to replace corrupt politicians is explained in theoretical models. The political
agency model, firstly developed by Barro (1973) and Ferejohn (1986), considers politicians as
agents responsible for taking actions that are not observable to voters (Persson and Tabellini 2002).
Since those models assume that politicians do not to differ from each other, they predict that voters
will always punish corrupt incumbents if they have access to credible and reliable information on
acts of corruption.5
Politicians, however, differ from each other in reality, and this heterogeneity brought the
selection function of elections to the forefront of the analysis. Fearon (1999) showed that the
equilibrium in pure moral hazard models is not robust to the introduction of candidate
heterogeneity when voters’ payoffs depend on differences between candidates. Besley (2006)
distinguished between good (congruent) and bad (incongruent) politicians and showed how the
selection and the disciplinary functions of elections have to be weighed up when assessing the
effect of improved information on voter’s welfare.6
In case of a legislative body empowered with the task of distributing public resources
between municipalities or states, elected representatives have incentives to bring home as much
pork as possible for the benefit of their constituents. In attempting to maximize their own gains,
voters fail to internalize the impact that such pork-barrel spending have on other districts, and
politicians seeking to be reelected have incentives to maximize spending on their electoral districts,
creating thereby a suboptimal allocation of resources and an overall loss of welfare. Aidt and
Shvets (2012) studied the incentive effect of reelections on the allocation of public spending and
5 In identifying the secrecy of corruption as the main cause of such phenomenon, the literature has focused its policy recommendations in terms of improved transparency and accountability (Ferraz and Finan 2008, 2011), stricter enforcement of crimes involving corruption (Fisman and Miguel 2007), better wages and benefits for politicians (Azfar and Nelson Jr. 2007), and staff-rotation measures (Abbink 2004). 6 “The idea that potential politicians differ in their competence is no different from a standard assumption in labor market models that individuals have specific skills so that they will perform better or worse when matched in certain jobs… If competence differs, then an important role of elections is to pick competent politicians and to remove from office those who are demonstrably out of their depth.” (Besley 2006: 48).

showed how reelection induces representatives to bring more pork to their districts and exacerbates
the common-pool problem studied initially by Weingast and co-authors (1981).7
We explore a political failure that emerges when candidates differ from each other in their
skill to bring pork to their constituents and in the amount of resources they embezzle or waste, and
where the number of candidates is not infinite but rather limited in each district. In this case, voters
often face a trade-off between voting for a politician who can bring them more pork at a cost to
society and a politician who, while bringing them less pork, does not cause such a loss. The study
of this subset of political failures may shed light on the limitations of elections to provide
incentives for elected agents to refrain from corruption and mismanagement of public funds, and
for voters to be able to eliminate, in secret elections, the loss of welfare that such acts create.
The experimental literature on corruption that emerged in recent decades investigates the
determinants of corrupt behavior and the efficacy of anti-corruption measures in the bribe game.
Less attention has been devoted to how voters react to corruption and waste in secret elections.
Existing experiments on corruption regularly involve two or more players in a game in which the
first player takes the role of the briber and the second one of the public official (Abbink et al. 2000,
2002; Abbink 2004). In this setting, variations in politicians’ salaries did not affect observed levels
of bribes (Abbink et al. 2000), but staff rotation measures reduced them (Abbink 2004). The study
of Abbink, Irlenbusch and Renner (2002) also introduced the negative externality of the bribe in
the game, and found no evidence that individuals take into account the harm they cause to other
subjects when deciding whether to offer or accept a bribe.
7 A political system that encourage legislators to bring home more pork might encourage voters to monitor them (Kunicová and Rose-Ackerman 2005), but nothing guarantees that voters will not reward, instead of punish, those that are best at bringing home the bacon independent of the high costs, in terms of inefficiency and waste, that such pork-barrel spending might create for society as a whole.

We contribute to the literature by investigating, firstly, to what extent voters punish
corruption and waste in secret elections. Secondly, we study the impact of a shared and agreed
norm prescribing that one shall not vote for politicians that misbehave in either of those dimensions
on voter’s behavior. In the experiment, corruption and waste created losses for voters, and hence
capture the negative externality that those acts have, in reality, inside the game.
3. Experimental Design
We implement a finitely repeated voting game in which a skilled politician in pork-barreling runs
against a less skilled one in each electoral district. The politician with most votes in each district
is elected to represent that district, thus determining the amount of funds it will receive. Between
treatments, we manipulate whether the skilled politician simply creates waste or embezzles the
same amount of resources for her personal gain. In both cases, the amount wasted or embezzled is
limited, such that skilled politicians still provide more pork to their voters after considering those
losses, and the strictly dominant strategy for the voters is always to vote for them.
As detailed below, politicians were real participants who willingly decided to take the role
of such politicians after reading the instructions and receiving complete information about the
game they would play. Although they did not decide, in every round, to embezzle funds, they
actively and freely decided to be that politician with full knowledge of the consequences, and in
fact earned amounts embezzled (that were deducted from the amount destined to their district)
whenever they were elected.
3.1. The Voting Game
The game involves a fixed national budget B = 10,000 and four electoral districts, denoted 𝑛 ∈
𝑁 = 1,2,3,4 . All districts have the same two types of politicians running for the post and five

voters each. Politicians with most votes in each district are elected for one period (simple majority
voting). The game is repeated for ten periods and participants receive feedback on the number of
elected politicians of each type, the amount of social losses created, the earnings in their district,
and the earnings of the elected politicians (including the amounts embezzled by the politician, if
corrupt) after each round.
The sequence of actions and events in the voting game is straightforward: voters cast their
ballots and election results are announced. Elected politicians bargain over the distribution of the
fixed budget, and bring to the districts they represent an amount that depends on their skill, as well
as on the skill of all other elected politicians. New elections follow, always with the same
politicians, and voters can reelect the incumbent or vote for the challenger.
Politician 2 is twice as skilled in bringing funds from the budget to her electoral district as
politician 1. If elected, however, politician 2 creates a loss of 25 percent of that higher transfer.
Therefore, politician 2 can provide voters in the district she represents an amount that is 50 percent
higher than politician 1.8
Let 𝛼- ∈ 1,2 denotes the skill of politician 1 and 2, respectively, who are elected in
district n. The amount of public funds 𝑔- allocated to each district n from the available budget of
10,000 depends on the skill of the politician elected in that district, and on the skill of all other
politicians elected in the remaining n-1 districts, and is given by:
𝑔- 𝑝𝑜𝑙𝑖𝑡𝑖𝑐𝑖𝑎𝑛1, 𝛼-78 = 1 ∙ 8:,:::;<<
8 When politicians differ in their skill in pork-barreling and in the loss of welfare they occasion for voters, there are several possible combinations of types that could arise. We focus on the one that presents a trade-off for voters, and not on those that do not, as for example when a skilled politician that does not create any waste runs against any other type, or when an unskilled politician that creates waste runs against a politician that is better than her in any dimension.

𝑔- 𝑝𝑜𝑙𝑖𝑡𝑖𝑐𝑖𝑎𝑛2, 𝛼-78 = 2 ∙ 8:,:::;<<
Voter’s i individual payoff y>𝑦@ is given by the amount of funds that her district receives,
which is divided equally between the five members of the district after considering the loss of 25
percent of the transfer occasioned by politician 2.
𝑦@,-(𝑝𝑜𝑙𝑖𝑡𝑖𝑐𝑖𝑎𝑛1, 𝛼-78) =8C∙ 8:,:::
;<<
𝑦@,- 𝑝𝑜𝑙𝑖𝑡𝑖𝑐𝑖𝑎𝑛2, 𝛼-78 = 8,CC∙ 8:,:::
;<<
Since 𝑦@,- 𝑝𝑜𝑙𝑖𝑡𝑖𝑐𝑖𝑎𝑛2 > 𝑦@,- 𝑝𝑜𝑙𝑖𝑡𝑖𝑐𝑖𝑎𝑛1 , regardless of how the other districts vote,
voting for politician 2 is the strictly dominant strategy for voters in the game in any one period. A
district will always earn more funds by electing politician 2 given any possible electoral outcome
in the other districts. The predicted outcome is hence a suboptimal Nash equilibrium upon which
no district can improve upon by electing politician 1.
If all districts elect, in this manner, politician 2, then they all equally split the available
budget after the losses of 25 percent are considered. Since all elected politicians are then equally,
highly skilled in pork-barreling, each district receives 1,875, and each voter earns 375. In this case,
there is a loss of 2,500, and only 7,500 is distributed across districts. In contrast, if all districts
elect politician 1, then they all equally split the available budget and there is no social loss. Since
all elected politicians are in this case equally skilled, each of the four districts receives 2,500, and
each voter in each district earns 500. If some districts elect politician 1, and others elect politician
2, then the ones that elect politician 2 receive 50 percent more funds than the ones that elect
politician 1. In this case, the total available amount of resources to be distributed across districts
is smaller and proportional to the number of politicians 2 elected.

Politicians who are elected receive a fixed salary of 600 in that period, and participants
have therefore incentives to be politicians. Politicians who are not elected receive an amount equal
to the one received by voters in that district in that period. This amount is not deducted from the
national budget in the experiment in order to make the non-elected politician’s earnings equal to
the voters’ earnings.
3.2. Treatments
The experiment involved four treatments. In treatment waste, voters chose between politician 1
(“a politician who brings fewer resources but who does not create a loss of funds from the budget”)
and politician 2 (“a politician who brings twice as many resources (as politician 1) but who creates
a loss equal to 25% of that amount of funds”). The amount of funds lost in the election of politician
2 did not benefit anybody in the experiment, and voters were aware of this fact. Any elected
politician, whether type 1 or type 2, always earned a fixed salary of 600 when elected.
In treatment corruption, voters could vote for politician 1 (“a politician who brings fewer
resources but who does not divert public funds from the budget for personal gain”) or for politician
2 (“a politician who brings twice as many resources (as politician 1) but who diverts 25% of that
amount of funds for personal gain”). The amount embezzled by the last one was diverted to the
earnings of the participant who willingly decided to take the role of the corrupt politician and
benefited only herself, and voters were aware of these facts. Therefore, participants who decided
to be politician 2 earned the public salary of 600 plus the amount embezzled when elected.
In treatment waste with norm, participants took part in a referendum, before playing the
game, for the possible institution of a norm that established that “one shall not vote for politicians
who create losses of resources from the budget.” Participants were informed that if the majority of

them voted in favor of the norm, then it would be enacted, but not otherwise. There was no
sanctioning or monitoring, and participants were aware of this fact. After receiving information on
whether the norm was enacted or not, participants played the same game as in treatment waste.
In treatment corruption with norm, participants took part in a referendum for the possible
institution of a norm that established that “one shall not vote for politicians who divert resources
from the budget.” The voting and procedure for the establishment of the norm was exactly the
same as in treatment waste with norm. After receiving information on whether the norm was
enacted or not, subjects played the same game as in treatment corruption.
3.3. Hypotheses
Voters willing to maximize their individual gains are predicted to vote for politician 2 in all rounds,
and in the suboptimal Nash equilibrium of the game all districts are predicted to elect and reelect
that politician. Social losses are expected to be maximal and equal to 25% of the total amount of
public funds.
HYPOTHESIS 0. Voters will always vote for politician 2 in all treatments.
Voters, however, might be willing to incur a personal cost to punish politicians that are
corrupt or that create waste. There are two possible reasons for their willingness to condone
politicians who create waste, but not politicians who are corrupt. The first one is inequality-
aversion (Fehr and Schmidt 1999, Bolton and Ockenfels 2000): corruption creates inequality since
the politician enriches herself at the expense of the voters, while waste does not create inequality
per se, but only losses for voters. The second one is normative: corruption is immoral while waste
is not necessarily perceived as immoral. Since there is evidence that morality plays its role in the
rejection of corruption (Banerjee 2016), we favor the second explanation in our study, which aims

at investigating how voters behave when faced with those two types of misbehavior, and not on
the cognitive mechanism underlying voter’s preferences with respect to waste and corruption.
HYPOTHESIS 1. Voters will vote for politician 2 more often in treatment waste than in
treatment corruption.
The norm that one ought not to vote for politicians who create social losses, when agreed
upon by the majority of subjects, is apt to create and reinforce moral commitment, and to signal to
voters that voting for politician 2, and condoning waste or corruption is not acceptable behavior.
We therefore expect the norm to discourage voters from subsequently voting for the politician who
creates waste or who embezzles funds.9
HYPOTHESIS 2. Voters will vote for politician 2 more often in treatment waste than in
treatment waste with norm.
HYPOTHESIS 3. Voters will vote for politician 2 more often in treatment corruption than in
treatment corruption with norm.
3.4. Procedure
The experiment was implemented on November 3, 4, 5, and 6, 2014, in Itajaí, Brazil (state of Santa
Catarina), with one session on each day. It involved 112 participants in four sessions with 28
participants in each (20 voters and 8 politicians), and each subject participated in only one session.
It was approved by the Ethics Committee of the São Paulo School of Business Administration
(Getúlio Vargas Foundation), designed and implemented with z-Tree (Fischbacher 2007), and
participants were recruited through advertisements, emails, and posters on campus in the previous
9 There is no monitoring or sanctioning, for the vote is secret, and subjects, just as voters in reality, are bound only by their moral and ethical convictions at the time of casting their vote, and of complying with the norm.

weeks. Subjects earned, on average, around 20 Reais, and each session lasted only about one
hour.10 There was no follow-up session.
All sessions took place in the afternoon and in the same computer lab of the university,
which had room for up to 60 participants. Since only 28 participants per session were needed, there
was an empty terminal between each subject. All subjects who registered for the experiment could
take part, and they all provided their written informed consent to participate before the start. The
beginning of all sessions had to be delayed to wait for latecomers, and only those participants who
arrived after the session had started were not allowed to participate. There was no instance of any
anomaly or disruption during the sessions.
Although the primary interest lies on the test of the described hypotheses in round 1 of part
1 of each session (including only independent observations), each treatment involved 10 repeated
games to provide insights into the stability of voters’ behavior. Each session included two
treatments, with and without norm, and the order of implementation was inverted to minimize
ordering effects.11 Subjects were not informed of the content of the second part before reaching
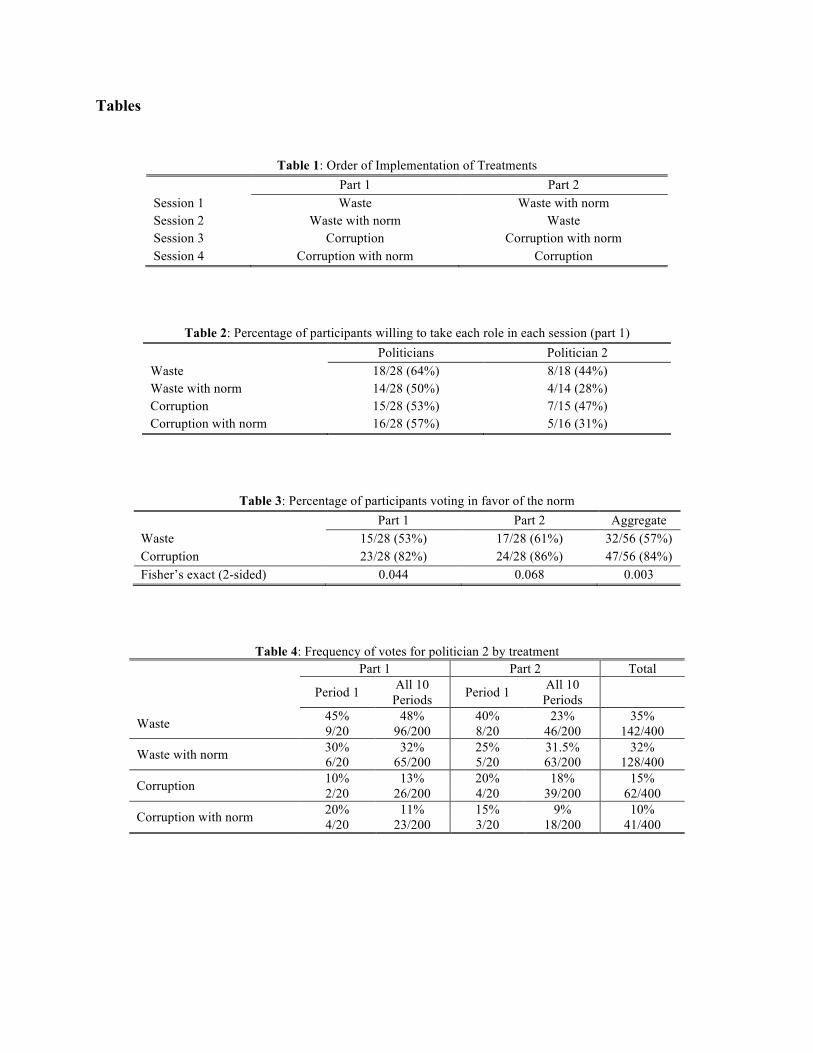
that part of the session. The order of implementation of the treatments is shown in Table 1.
Insert table 1
In each session, participants decided before the beginning of the game, but after reading
the instructions, which role they would like to take in the experiment. They decided, firstly, if they
wanted to be politician or voter. Secondly, and only for those who chose to be politicians, they
10 R$ 20 corresponded to around US$ 8 in October 2014, quite a substantial amount given the costs of living in Itajaí, Brazil, a small-medium sized city where average household income is R$ 3195 per month. Considering a workload of 40 hours per week, and four individuals per household, average earnings per hour are R$ 20 in Itajaí. 11 The second part of sessions 2 and 4 suffers from the fact that subjects will remember the norm after playing under it in part 1, even if they were told that the norm was not valid anymore in part 2. We still keep that part of those sessions in the design for reasons of symmetry, although they are not important for the hypothesis under scrutiny.

decided whether they wanted to be a type 1 or type 2 politician. In sessions 1 and 2, they therefore
chose to be a skilled politician who creates waste or a less skilled politician who does not create
waste. In sessions 3 and 4, they chose to be a skilled but corrupt politician or a less skilled politician
who is not corrupt. Voters and politicians were then all randomly allocated to one of the four
electoral districts. Participants chose their role only once, in the beginning of each session, and
kept the same role throughout the whole session.
If more than eight subjects decided to be politicians, then eight would be randomly chosen
by the computer for that role because there were only eight places for politicians in four districts.
They could then choose the type of politician they wanted to be. From the design of the experiment,
there were only four places for politician 2. If more than four participants were willing to take that
role, then four were randomly selected to play it.
We do not randomly allocate subjects to the different roles for ethical reasons. We believe
it is unethical to put a participant in the role of a corrupt politician that embezzles ressouces from
the district she represents. If, however, a participant wanted and actively chose to take that role,
with full knowledge of the game, then it is not unethical to allow her to play in that role.
This procedure was explained to the participants in the instructions and again on the screens
of the experiment. They were assured that the computer would never select participants to take a
role they did not choose; that is, a participant who did not choose to take the role of politician 2
was never put in that position, and a participant who did not choose to be a politician was never
put in that position. All subjects were carefully informed of this procedure, including those that
decided to be voters. In fact, if fewer than four participants were willing to be politicians of type
2, then that session would have to be cancelled, just as if fewer than eight participants were willing

to be politicians. As described below, this did not happen, and there were sufficient participants
willing to take those roles with full knowledge of their consequences.
Participants received written instructions (see appendix) including a table with how much
they would earn depending on the politician elected in their district and in all other districts. There
were only five possible outcomes, ranging from the one where no district elected politician 2 to
the one where all districts elected politician 2. At the end of the experiment, points were converted
into money, subjects were paid in closed envelopes, and then left the room one at a time.
4. Results
The subject pool was reasonably diverse and average age of participants was 29 years, with a slight
majority (55%) of females (average age in Brazil is 32 years, with 52% females). The majority of
participants had a job (61%), attended a public school (53%, Brazilian average is around 80%),
and did not have private health insurance (59%, compared with an average of 67% in that region
of Brazil). The obtained sample is therefore quite representative of the population of that region,
with however a higher predominance of subjects with a private schooling background.
4.1. Willingness to be Politicians, the Type of Politician, and Voting for the Norm
A slight majority of participants choose to be politicians, as reported in the first column of table 2,
something expected given the fact that politicians could never earn less than voters. Surprising,
however, is the percentage of participants who chose to be politicians and that subsequently also
chose to be politicians of type 2, reported in the second column. Almost half of them (44%) chose
to be a politician who creates waste. Even more surprising is that 47% of the subjects decided to
be a corrupt politician. These percentages were lower when subjects voted for the enactment of
the norm before choosing the role they would like to take (in sessions 2 and 4, where the treatment

with norm preceded the one without norm). This outcome provides a first insight into the effect
the norm had to encourage individuals to consider the common good, and to change their behavior.
Insert table 2
With respect to the vote for or against the norm, only a slight majority of subjects voted in
favor of the norm against waste, as reported in table 3. In contrast, a substantial majority voted in
favor of the norm against corruption. While 82% of them agreed that voters ought not to vote for
corrupt politicians 1 under the veil of ignorance (in part 1), only 53% of them agreed that voters
ought not to vote for politicians who create waste (also in part 1). Almost identically, when
participants voted in the referendum after having played 10 rounds of the game (in part 2), then
86% voted in favor of the norm in treatment corruption, and only 61% in treatment waste.
Insert table 3
These differences are statistically significant, as reported in the last row of table 3 (Fisher’s
exact test). Both norms could equally improve voters’ welfare in preventing that public funds did
not reach them, if they were respected. However, almost half the participants did not see the need
for such a norm when self-interested behavior would lead to public funds being simply wasted. In
contrast, a substantial majority of subjects saw the need for such a norm when public funds would
not be wasted, but would personally benefit the politician. The significant differences in the results
from voting for the norm across treatments waste and corruption provide a first insight into
individuals’ willingness to condone waste, but not corruption.
4.2. Voting for Corrupt and Inefficient Politicians
Table 4 reports the number and frequency of votes for politician 2 in the different treatments. The
first column reports votes collected only in period 1 of part 1, when voters did not have any type
of information on how other voters decided, and hence considers only independent observations.
They provide observations for the tests implemented between treatments. The remaining columns
report frequencies that consider further periods, and may shed light on the stability of voter choices
in the repeated game, and on the robustness of the results.
Insert table 4
We can initially reject the strict rational choice hypothesis that voters will always vote for
politician 2, disregarding waste and corruption associated with it. Voting for politician 2, either in
treatment waste or corruption, and either in the presence or absence of the norm, is the strictly
dominant strategy for voters. The frequency of votes for politician 2, however, is dramatically
distant from the predicted average of 100%, and in the case of corrupt politicians it is, in fact, close
to zero.
However, roughly half of the subjects (45%) voted for the politician who creates waste. In
contrast, only a minute share of the subjects (10%) voted for the corrupt politician. Observations
collected in the first period of part 1 allow us to implement a non-parametric test of hypothesis 1,
and to examine whether the observed proportion of votes for the politician who creates waste and
for the politician who embezzles funds are statistically different. In effect, voters were more willing
to accept waste than corruption (Fisher’s exact test, waste vs. corruption, p-value = 0.031),
providing support for hypothesis 1: voters are more willing to accept waste than corruption.
This result is rarely described in the literature. Empirical studies most often focus solely
on corruption (e.g. Ferraz and Finan 2008, 2011), and do not consider the equally detrimental
losses stemming from the misuse, misallocation and mismanagement of public resources that are
often attached to distributive politics and pork barreling. Voters vote strategically and do not

refrain from electing and reelecting politicians who create those losses, but who can bring home
the bacon even when they observe the welfare losses and the negative externality attached to their
vote.
4.3. Voting under a Norm
The effect of the norm for encouraging regard for the interests of all districts together can
be captured within subjects, considering how many subjects changed their own vote after the norm
was institutionalized, as reported in table 5. In session 1, there were nine subjects who voted for
the politician who created social losses, and eleven who refused to do so, and who therefore voted
for politician 1. Of these eleven subjects, all of them voted for politician 1 in part 2, after the norm
was established, and did not alter their choice. Of the former nine, five still voted for politician 2,
but four changed their behavior and voted for politician 1.
Insert table 5
The result of McNemar’s test of proportions (of the symmetry of the contingency table), in
session 1, provide support for hypothesis 2: a norm, agreed by the majority of subjects, reduced
the number of votes for politicians who create waste. In session 2, the test concerns whether “de-
institutionalizing” the norm led voters to change their behavior and to accept social losses more
often in the absence of the norm than in its presence. This comparison suffers from the fact that
subjects retain a memory of the norm even when they are told that the norm is not valid anymore
in part 2. There is, in accordance, no significant evidence that supports the hypothesis that de-

institutionalizing the norm will increase acceptance of waste, but point estimates are in this
direction.12
4.4. Regression results
Regression analysis provides a robustness check for the obtained results and allows us to
investigate the extent to which individual decisions depend on the decision of other members of
the group, and on the decision of the other groups. We choose treatment corruption as the baseline
because this is the case that has been studied at length in the literature. We then study if voters are
equally, more, or less likely to reject politicians who create waste in comparison to those who are
corrupt. Lastly, we study the effect of a norm against corruption, and of a norm against waste in
comparison with the baseline. The different indicator variables waste, waste with norm, and
corruption with norm indicate whether the observation was collected in the respective treatment
(equal to unit) or not (equal to zero).
We estimate three sets of models, using, respectively, data from each individual decision,
from each group decision, and from each treatment. Observations are truly independent only in the
first period, since in that one, participants’ decisions do not depend on how other participants
behaved in previous periods. We therefore firstly report regression results that consider only those
observations in Table 6. After each round, subjects received information and so could alter their
behavior based on these facts. They might, therefore, conform to how other members of the group
vote, or to how other groups vote. We take advantage of this information and include the first,
second, and third lag of these two variables – group choice and number of type 2 policticans elected
12 The analysis of the effect of the norm on vote for the corrupt politician, in sessions 3 and 4, suffers from the fact that very few voters accepted that politician at the first place, with or without the norm, and there are, as a result, not enough observations for the test of the third hypothesis.

– in the regressions that consider observations from the repeated game, and study the extent to
which they affect individual choices.
We subsequently consider the decisions of each group in each period as one observation in
Table 8. This excludes the dependence between individual decisions and decisions of the other
members of the same group (electoral district). We can, therefore, drop the variable Group choice,
which is present in the previous model. However, observations per group are still dependent on
the impact of the decision of the other groups; in other words, how each group decided, in each
period apart from the first one, may depend on the decision of the other groups. We therefore keep
the variable Number of type 2 politicians, and in the last set of regressions presented in Table 9,
we exclude that form of dependence by considering treatment averages.
In the first column of Table 6, we report estimates of the linear model including only those
observations collected in the first period of the first part (all independent observations). In the
second column, we do the same with a non-linear model (a probit model in which vote=1 if the
decision is to vote for politician 2 and vote=0 if the decision is to vote for politician 1). In the third
column, we report regression results from the linear model with all observations collected in part
1, and hence for the ten rounds of the treatment. Since each subject took the same decision
repeatedly, standard errors are all clustered by subject. In the fourth and last column, we do the
same with the probit model.
Insert table 6
Voters are substantially more likely to vote for the politician who, instead of diverting
funds, simply creates an equal social loss. The point estimates reveal that they are, on average,
from 35% to almost 50% more likely to accept waste than corruption. Regression results provide

additional support for the results of the non-parametric tests reported above, and for hypothesis 1.
Regression results further reveal how acceptance of politician 2 by other groups in the
previous election induced voters to reject politician 2, and to vote more cooperatively. The first
lag of the variable Number of type 2 politicians is weakly significant, but its effect is small. It may
point to a reaction of voters against the overall acceptance of politician 2 by others, which
encouraged a more conscious and pro-social behavior when others behave less cooperatively.
Moreover, acceptance of politician 2 by the other members of one’s own group, in the
previous election, increased vote for politician 2. This effect of the first lag of Group choice is
large and significant. It shows how voters’ behavior depends on the vote and behavior of other
members of the group. When these revealed their acceptance of politician 2 in the previous
election, voters were more likely to do the same and to accept such a politician, thus conforming
to group behavior and choices. A similar effect has been observed in experiments studying
corruption in collaborative settings, and that reveal how these increase rates of corruption (Weisel
and Shalvi 2015).
There is no statistical evidence that the norm encouraged the very few voters that were
willing to accept corruption to refrain from it. In the presence of a norm that encouraged voters
not to vote for the politician who created waste, point estimates suggest that acceptance of such a
politician was lower in the presence of the norm, which is consistent with the results reported in
table 5 above, where the norm reduced the frequency of votes for politician 2 from roughly 50%
to around 30%. In order to test whether the norm had an effect and encouraged voters not to vote
for politicians who create welfare losses, in comparison to voting for those politicians in the
absence of a norm, we test whether the coefficient of waste and waste with norm are statistically
different. Table 7 reports the results.

Insert table 7
There is some supporting evidence for hypothesis 2, in models (3) and (4), that the norm
encouraged voters to consider the welfare of society and to refrain from the self-interested, strictly
dominant strategy to vote for politician 2, and to vote instead for politician 1.
Table 8 presents different models that consider observations by group: OLS, OLS with
bootstrap, multilevel mixed-effects linear regression (Mixed), and the same Mixed model with
bootstrap. There were four groups in each session, and there are hence sixteen observations in
total. The last two columns present results from those models but consider observations from all
first ten rounds. Standard errors are clustered by groups in all models that take into account more
than just the first period (models 5 and 6).
Insert table 8
Results are very similar to those obtained before. Voters are considerably more likely to
accept waste than corruption. The estimated points are also very similar. Therefore, the
dependence between each individual decision and the decision of other individuals in the same
group (electoral district) is likely to be unimportant in defining previous results.
Lastly, we collapse voting by subject, group, and treatment, and take only one observation
in each treatment per period into account. With four sessions, there are only four independent
observations in the first period of the first part and, therefore, not enough observations to estimate
that model, as in the previous tables. We consider those four observations in the 10 periods of the
first part, and there are hence 40 observations in the first four models. We then use all observations,
including from the second part, and have therefore 80 observations in the four final models.
Insert table 9

Our robustness checks reveal that the results concerning waste are consistent for any
investigation undertaken. There is, therefore, strong support for hypothesis 1 that voters are more
likely to elect and reelect a politician who creates waste than a politician who is corrupt. There is
also further support for the hypothesis that a norm discourages voters from doing so, and instead
fosters prosocial voting and regard for the interests of all voters and districts.
5. Conclusion
Unlike other lab experiments in corruption that focus on bribes (for reviews, see Abbink 2006,
Serra and Wantchekon 2012), we study voters' willingness to punish corruption and waste in secret
elections. Results from the experiment reveal that voters refuse to vote for corrupt politicians when
they have access to credible and reliable information on acts of corruption. Corruption emerges as
a valence issue, as the vast majority of subjects refused to vote for those politicians at a cost to
themselves, and elections largely reduced their electoral chances. Elections indeed served the
purpose of eliminating corrupt politicians even when voters must incur a personal cost to do so.
However, when politicians are not corrupt, but rather responsible for waste of public funds,
then roughly half the subjects voted for them, and the loss of welfare occasioned by them persisted.
Elections and the provision of information on amounts wasted were not enough to minimize the
loss of welfare predicted in the Nash equilibrium of the game, thus providing evidence for our
hypothesis that voters are more willing to accept waste than corruption of equal magnitude. When
considered together with results from the voter’s choice to enact a norm against corruption or
waste, results provide support for the hypothesis that while voters strongly reject the first one, they
often condone the second one.

The introduction of a norm, or of a coordinating mechanism voted by the subjects, induced
a change in their electoral behavior, and reduced their willingness to condone waste. They were
less likely to fall into the suboptimal Nash equilibrium of the game, and social losses were reduced.
Results provide support for our hypothesis that norms induce voters to refrain from voting for
politicians who create waste, and to consider the interests of the whole society when casting the
ballot. Moreover, results from subjects’ lower willingness to take the role of politicians who create
waste or that are corrupt, in the presence of a norm, provide additional support for that hypothesis.
The results on the effectiveness of such a norm have policy implications. For norms to be
effective, voters need to have information on the acts and amounts. While there is a large body of
literature advancing the need for transparency and information in order to reduce corruption (e.g.
Ferraz and Finan 2008, 2011), we argue that equally important for voters’ welfare is transparency
concerning the inefficient use of public resources. For instance, even if the stadiums for the last
FIFA world cups in South Africa and Brazil were not the targets of corruption, the misallocation
and misuse of public funds to build some of them in cities where they were not needed led to large
fund losses and benefited only the few who live in those cities. Citizens seem to have become
aware of this, as the massive demonstrations condemning those expenses that took place before
the world cup in Brazil demonstrate. To avoid more waste and to implement a superior equilibrium,
more transparency and a clearer assignment of responsibilities for those who make such decisions
is needed if voters are to punish politicians who are responsible for waste of public funds.
Finally, the fact that the norm was not supported by sanctions nor by the law suggests that
citizens themselves can coordinate their choices and overcome a suboptimal Nash equilibrium in
elections. Several NGOs have been created to improve the transparency of government spending
and to support private actions that reveal this type of information to the public (e.g. Transparency

Accountability Initiative, Transparência Brasil). Moreover, legislation that requires the state to
make the relevant information public, such as the Federal Funding Accountability and
Transparency Act of 2006 in the U.S., is capable of improving the capacity of citizens and civil
society to select the best politicians and to punish those that misbehave, and for secret elections to
eliminate corruption and waste, and thereby to maximize voters’ welfare.
References
Abbink, K., Irlenbusch, B., Renner, E., 2000. The moonlighting game: An experimental study on
reciprocity and retribution. Journal of Economic Behavior & Organization 42, 265-277.
___, 2002. An experimental bribery game. Journal of Law, Economics, and Organization 18, 428-
454.
Abbink, K., 2004. Staff rotation as an anti-corruption policy: an experimental study. European
Journal of Political Economy 20, 887-906.
___, 2006. Laboratory experiments on corruption. In Rose-Ackerman, S. (Ed.), International
Handbook on the Economics of Corruption. Cheltenham: Edward Elgar, 418-438.
Abbink, K., Hennig-Schmidt, H., 2006. Neutral versus loaded instructions in a bribery
experiment. Experimental Economics 9, 103-121.
Aidt, T., Shvets, J., 2012. Distributive politics and electoral incentives: evidence from seven US
state legislatures. American Economic Journal: Economic Policy 4, 1-29.
Armantier, O., Boly, A., 2012. On the external validity of laboratory experiments on corruption.
In Serra, D., Wantchekon L. (Eds.), New Advances in Experimental Research on Corruption
Research in Experimental Economics. Bingley: Emerald, 117-144.
Armantier, O., Boly, A., 2013. Comparing corruption in the laboratory and in the field in Burkina
Faso and in Canada. Economic Journal 123, 1168-1187.
Azfar, O., Nelson Jr., W., 2007. Transparency, wages, and the separation of powers: an
experimental analysis of corruption. Public Choice 130, 471-493.

Bandiera, O., Prat, A., Valletti, T., 2009. Active and passive waste in government spending:
Evidence from a policy experiment. American Economic Review 99, 1278-1308.
Banerjee, R., 2016. On the interpretation of bribery in a laboratory corruption: moral frames and
social norms. Experimental Economics 19, 240-267.
Barr, A., Serra, D., 2009. The effect of externalities and framing on bribery in a petty corruption
experiment. Experimental Economics 12, 488–503.
___, 2010. Corruption and culture: An experimental analysis. Journal of Public Economics 94,
862-869.
Barro, R., 1973. The control of politicians: An economic model. Public Choice 14, 19-42.
Besley, T., 2006. Principled Agents? The Political Economy of Good Government. Oxford: Oxford
University Press.
Besley, T, Smart, M., 2007. Fiscal restraints and voter welfare. Journal of Public Economics 91,
755-773.
Bolton, G., Ockenfels, A., 2000. ERC: A theory of equity, reciprocity and competition. American
Economic Review 90, 166-193.
Cameron, L., A. Chaudhuri, N. Erkal, Gangadharan, L., 2009. Propensities to engage in and punish
corrupt behavior: experimental evidence from Australia, India, Indonesia and Singapore.
Journal of Public Economics 93, 843-851.
Coate, S., Morris., S., 1995. On the Forms of Transfers to Special Interests. Journal of Political
Economy 103, 1210-1235.
Fearon, J., 1999. Electoral accountability and the control of politicians: selecting good types versus
sanctioning poor performance. In Przeworski, A., Stokes, S. (Eds.), Democracy,
Accountability, and Representation. Cambridge (UK): Cambridge University Press, 29-54.
Fehr, E., Schmidt, K., 1999. A theory of fairness, competition and cooperation. Quarterly Journal
of Economics 114, 817-868.
Ferejohn, J., 1986. Incumbent performance and electoral control. Public Choice 50, 5-25.

Ferraz, C., Finan, F., 2008. Exposing corrupt politicians: The effects of Brazil’s publicly released
audits on electoral outcomes. Quarterly Journal of Economics 123, 703-745.
___, 2011. Electoral accountability on corruption: evidence from the audits of local governments.
American Economic Review 101, 1274-1311.
Fisman, R., Miguel, E., 2007. Corruption, norms, and legal enforcement: evidence from diplomatic
parking tickets. Journal of Political Economy 115, 1020-1048.
Fischbacher, U., 2007. z-Tree: Zurich toolbox for ready-made economics experiments.
Experimental Economics 10, 171-178.
Kunicová, J., Rose-Ackerman, S., 2005. Electoral rules and constitutional structures as constraints
on corruption. British Journal of Political Science 35, 573-606.
Persson, T., Tabellini, G., 2000. Political Economics: Explaining Economic Policy, Cambridge
(MA): M.I.T.
Rawls, J., 1971. A Theory of Justice. Cambridge (MA): Harvard University Press.
Serra, D., Wantchekon, L., 2012. New Advances in Experimental Research on Corruption.
London: Emerald Books.
Weingast, B., Shepsle, K., Johnsen, C., 1981. The political economy of benefits and costs: A
neoclassical approach to distributive politics. The Journal of Political Economy 89, 642-664.
Weisel, O., Shalvi, S., 2015. The collaborative roots of corruption. Proceedings of the National
Academy of Science 112, 10652-10656.
Winters, M., Weitz-Shapiro, R., 2013. Lacking information or condoning corruption: when do
voters support corrupt politicians. Comparative Politics 45, 418-436.
Tables
Table 1: Order of Implementation of Treatments Part 1 Part 2 Session 1 Waste Waste with norm Session 2 Waste with norm Waste Session 3 Corruption Corruption with norm Session 4 Corruption with norm Corruption
Table 2: Percentage of participants willing to take each role in each session (part 1) Politicians Politician 2 Waste 18/28 (64%) 8/18 (44%) Waste with norm 14/28 (50%) 4/14 (28%) Corruption 15/28 (53%) 7/15 (47%) Corruption with norm 16/28 (57%) 5/16 (31%)
Table 3: Percentage of participants voting in favor of the norm Part 1 Part 2 Aggregate Waste 15/28 (53%) 17/28 (61%) 32/56 (57%) Corruption 23/28 (82%) 24/28 (86%) 47/56 (84%) Fisher’s exact (2-sided) 0.044 0.068 0.003
Table 4: Frequency of votes for politician 2 by treatment Part 1 Part 2 Total Period 1 All 10
Periods Period 1 All 10 Periods
Waste 45% 48% 40% 23% 35% 9/20 96/200 8/20 46/200 142/400
Waste with norm 30% 32% 25% 31.5% 32% 6/20 65/200 5/20 63/200 128/400
Corruption 10% 13% 20% 18% 15% 2/20 26/200 4/20 39/200 62/400
Corruption with norm 20% 11% 15% 9% 10% 4/20 23/200 3/20 18/200 41/400

Table 5: Effect of the Norm on Votes for Politician 2 (Treatment Waste) Period 1, Part 1 Period 1, Part 2 McNemar
Session 1 Waste Waste with norm 45% 25% χ2 = 4 (1) 9/20 5/20 p = 0.0455
Session 2 Waste with norm Waste
30% 40% χ2 = 1 (1) 6/20 8/20 p = 0.3173
Table 6: Individual Results Dependent Variable: Vote for politician 2
(1) (2) (3) (4) OLS Probit OLS Probit
Period 1 Period 1 Part 1 Part 1
Waste 0.35** 0.39*** 0.46*** 0.49***
(0.14) (0.15) (0.16) (0.15)
Corruption with norm 0.10 0.13 -0.06 -0.08
(0.14) (0.15) (0.06) (0.08)
Waste with norm 0.20 0.24 0.26** 0.27**
(0.14) (0.15) (0.11) (0.11)
Number of type 2 politicians t-1 - - -0.08* -0.07* - - (0.04) (0.04)
Number of type 2 politicians t-2 - - -0.05 -0.05 - - (0.04) (0.03)
Number of type 2 politicians t-3 - - -0.02 -0.02 - - (0.04) (0.03)
Group choice t-1 - - 0.22*** 0.19*** - - (0.07) (0.06)
Group choice t-2 - - 0.11 0.09 - - (0.08) (0.07)
Group choice t-3 - - 0.02 0.01 - - (0.08) (0.06)
Period - - 0.02 0.02 - - (0.01) (0.01)
Constant 0.10 - 0.03 - (0.10) - (0.08) -
Observations 80 80 560 560 R2/Pseudo-R2 0.0864 0.0744 0.1755 0.1519 F/χ2 2.39 7.13 4.67 44.86 p-value 0.0749 0.0680 0.0000 0.0000 Number (cluster) - - 80 80 Note: *** p<0.01, ** p<0.05, * p<0.1; Standard errors clustered by Subject in models (3) and (4); Average marginal effects reported in models (2) and (4); standard errors clustered by subject.

Table 7: Effect of Norm to Discourage Acceptance of Social Losses
(1) OLS Period 1
(2) Probit Period 1
(3) OLS Part 1
(4) Probit Part 1
Test: waste = waste with norm (two-sided)
F(1, 79) = 0.93 χ2 (1) = 0.85 F(1, 79) = 3.15 χ2 (1) = 3.63
Prob>F = 0.336 Prob>χ2 = 0.330 Prob>F = 0.079 Prob>χ2 = 0.056
Table 8: Group Results
Dependent Variable: Vote (1) (2) (3) (4) (5) (6)
OLS Boot OLS
Mixed Boot Mixed
OLS Mixed
Period 1, Part 1 Part 1
Waste 0.35** 0.35*** 0.35*** 0.35*** 0.46*** 0.46*** (0.13) (0.11) (0.13) (0.11) (0.15) (0.15)
Corruption with norm 0.10 0.10 0.10 0.10 -0.06 -0.06
(0.13) (0.10) (0.11) (0.09) (0.07) (0.07)
Waste with norm 0.20 0.20 0.20* 0.20 0.26* 0.26*
(0.13) (0.14) (0.11) (0.14) (0.14) (0.14)
Number of type 2 politicians t-1 - - - - -0.02 -0.02 - - - - (0.04) (0.03)
Number of type 2 politicians t-2 - - - - -0.02 -0.02 - - - - (0.03) (0.03)
Number of type 2 politicians t-3 - - - - -0.01 -0.01 - - - - (0.03) (0.03)
Period - - - - 0.02 0.02 - - - - (0.01) (0.01)
Constant 0.10 0.10* 0.10 0.10* 0.03 0.03 (0.09) (0.06) (0.09) (0.06) (0.09) (0.09)
Observations 16 16 16 16 112 112 R-squared 0.38 0.38 - - 0.42 - F/ χ2 2.49 11.13 9.95 11.60 10.96 81.90 p-value 0.110 0.0110 0.019 0.0089 0.0001 0 Number (cluster) - - - - 16 16 Note: *** p<0.01, ** p<0.05, * p<0.1; Models (2) and (4) include 1000 replications of the original sample; standard errors clustered by group (district of the subject) in models (5) and (6).

Table 9: Treatment results Dependent Variable: Vote
(1) (2) (3) (4) (5) (6) (7) (8) OLS Boot
OLS Mixed Boot
Mixed OLS Boot
OLS Mixed Boot
Mixed Part 1 All
Waste 0.35*** 0.35*** 0.35*** 0.35*** 0.20*** 0.20*** 0.20*** 0.20*** (0.03) (0.03) (0.03) (0.03) (0.03) (0.03) (0.03) (0.03)
Corruption with norm -0.01 -0.01 -0.01 -0.01 -0.05* -0.05** -0.05* -0.05** (0.03) (0.03) (0.03) (0.03) (0.03) (0.02) (0.03) (0.02)
Waste with norm 0.20*** 0.20*** 0.20*** 0.20*** 0.16*** 0.16*** 0.16*** 0.16*** (0.03) (0.03) (0.03) (0.03) (0.03) (0.02) (0.03) (0.03)
Period 0.00 0.00 0.00 0.00 0.00 0.00 0.00 0.00 (0.00) (0.00) (0.00) (0.00) (0.00) (0.00) (0.00) (0.00)
Part - - - - -0.09** -0.09** -0.09** -0.09** - - - - (0.04) (0.04) (0.04) (0.04)
Constant 0.11*** 0.11*** 0.11*** 0.11*** 0.26*** 0.26*** 0.26*** 0.26*** (0.03) (0.03) (0.03) (0.03) (0.04) (0.04) (0.04) (0.04)
Observations 40 40 40 40 80 80 80 80 R-squared 0.85 0.85 - - 0.62 0.62 - - F/ χ2 50.94 181.99 232.8 192.8 24.23 135.0 131.0 132.1 p-value 0 0 0 0 0 0 0 0 Number (cluster) - - - - - - - - Note: *** p<0.01, ** p<0.05, * p<0.1; Models (2), (4), (6), and (8) include 1000 replications of the original sample; Models (3), (4), (7), and (8) are linear mixed effects models.