WILLIAM BUTLER YEATS BY WILLIAM HICKEY WILLIAM BUTLER YEATS BY WILLIAM HICKEY.
DATA DOWNLOADWHAT’S GOING TO WORK BEST IN 2018
(based on real Google Analytics Data from 325+ websites in 2017)
Paul Hickey
www.datadriven.design
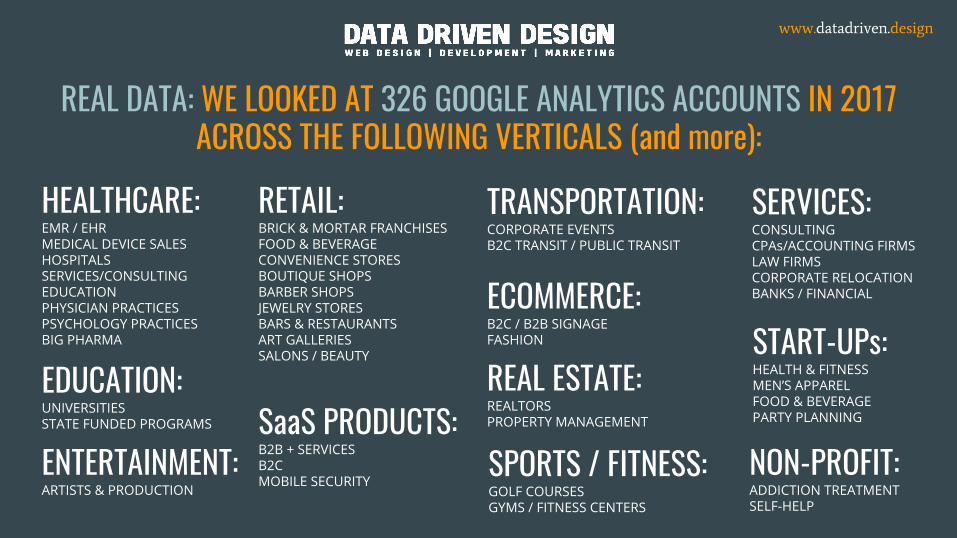
REAL DATA: WE LOOKED AT 326 GOOGLE ANALYTICS ACCOUNTS IN 2017ACROSS THE FOLLOWING VERTICALS (and more):
www.datadriven.design
HEALTHCARE:EMR / EHRMEDICAL DEVICE SALESHOSPITALSSERVICES/CONSULTINGEDUCATIONPHYSICIAN PRACTICESPSYCHOLOGY PRACTICESBIG PHARMA
ENTERTAINMENT:ARTISTS & PRODUCTION
SaaS PRODUCTS:B2B + SERVICESB2CMOBILE SECURITY
RETAIL:BRICK & MORTAR FRANCHISESFOOD & BEVERAGECONVENIENCE STORESBOUTIQUE SHOPSBARBER SHOPSJEWELRY STORESBARS & RESTAURANTSART GALLERIESSALONS / BEAUTY
TRANSPORTATION:CORPORATE EVENTSB2C TRANSIT / PUBLIC TRANSIT
ECOMMERCE:B2C / B2B SIGNAGEFASHION
NON-PROFIT:ADDICTION TREATMENTSELF-HELP
SERVICES:CONSULTINGCPAs/ACCOUNTING FIRMSLAW FIRMSCORPORATE RELOCATIONBANKS / FINANCIAL
START-UPs:HEALTH & FITNESSMEN’S APPARELFOOD & BEVERAGEPARTY PLANNING
REAL ESTATE:REALTORSPROPERTY MANAGEMENT
SPORTS / FITNESS:GOLF COURSESGYMS / FITNESS CENTERS
EDUCATION:UNIVERSITIESSTATE FUNDED PROGRAMS
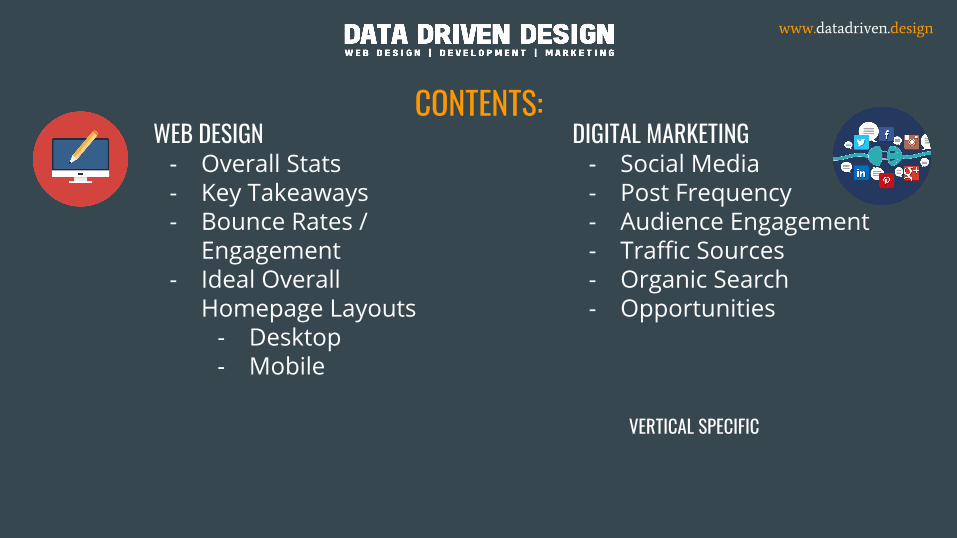
CONTENTS:
www.datadriven.design
WEB DESIGN- Overall Stats- Key Takeaways- Bounce Rates /
Engagement- Ideal Overall
Homepage Layouts- Desktop- Mobile
DIGITAL MARKETING- Social Media- Post Frequency- Audience Engagement- Traffic Sources- Organic Search- Opportunities
VERTICAL SPECIFIC
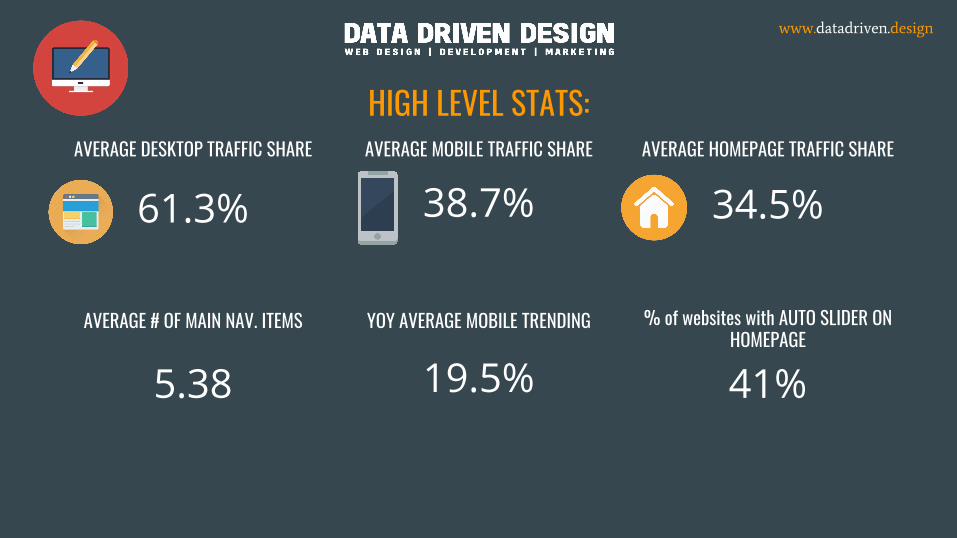
HIGH LEVEL STATS:
www.datadriven.design
AVERAGE DESKTOP TRAFFIC SHARE AVERAGE MOBILE TRAFFIC SHARE AVERAGE HOMEPAGE TRAFFIC SHARE
YOY AVERAGE MOBILE TRENDINGAVERAGE # OF MAIN NAV. ITEMS % of websites with AUTO SLIDER ON HOMEPAGE
38.7%61.3% 34.5%
19.5% 41%5.38
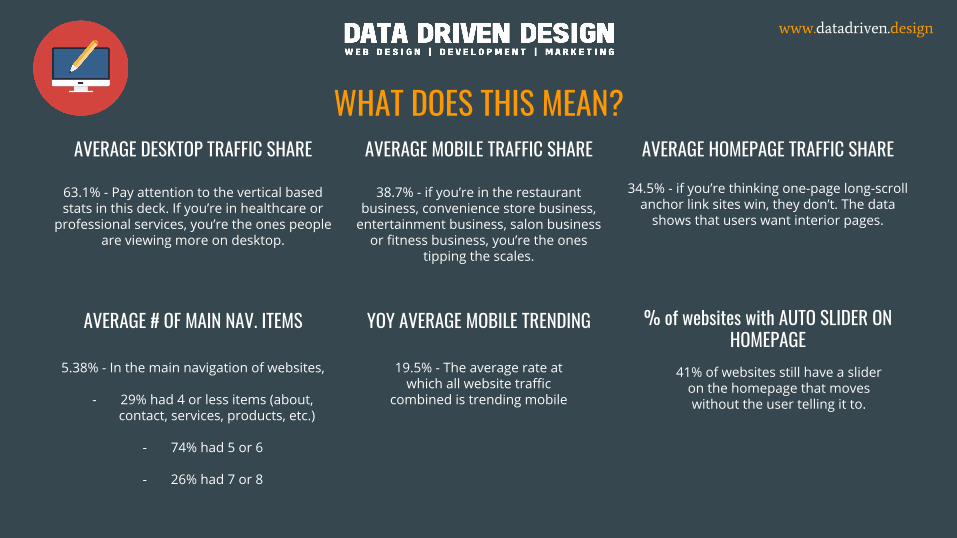
WHAT DOES THIS MEAN?
www.datadriven.design
AVERAGE DESKTOP TRAFFIC SHARE AVERAGE MOBILE TRAFFIC SHARE AVERAGE HOMEPAGE TRAFFIC SHARE
YOY AVERAGE MOBILE TRENDINGAVERAGE # OF MAIN NAV. ITEMS % of websites with AUTO SLIDER ON HOMEPAGE
63.1% - Pay attention to the vertical based stats in this deck. If you’re in healthcare or
professional services, you’re the ones people are viewing more on desktop.
34.5% - if you’re thinking one-page long-scroll anchor link sites win, they don’t. The data
shows that users want interior pages.
19.5% - The average rate at which all website traffic
combined is trending mobile
5.38% - In the main navigation of websites,
- 29% had 4 or less items (about, contact, services, products, etc.)
- 74% had 5 or 6
- 26% had 7 or 8
38.7% - if you’re in the restaurant business, convenience store business,
entertainment business, salon business or fitness business, you’re the ones
tipping the scales.
41% of websites still have a slider on the homepage that moves without the user telling it to.
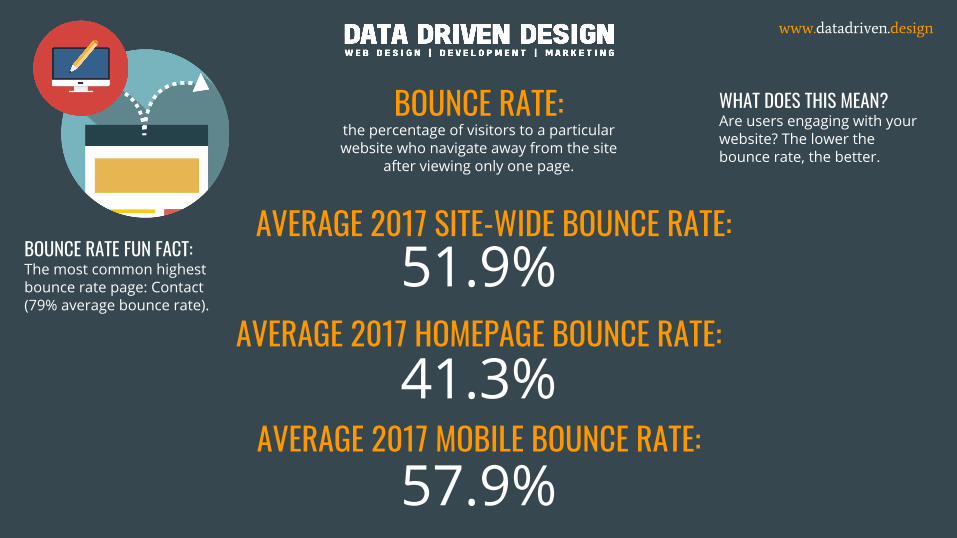
BOUNCE RATE:
www.datadriven.design
the percentage of visitors to a particular website who navigate away from the site
after viewing only one page.
AVERAGE 2017 HOMEPAGE BOUNCE RATE:51.9%
AVERAGE 2017 SITE-WIDE BOUNCE RATE:
41.3%
WHAT DOES THIS MEAN?Are users engaging with your website? The lower the bounce rate, the better.
AVERAGE 2017 MOBILE BOUNCE RATE:57.9%
BOUNCE RATE FUN FACT:The most common highest bounce rate page: Contact (79% average bounce rate).
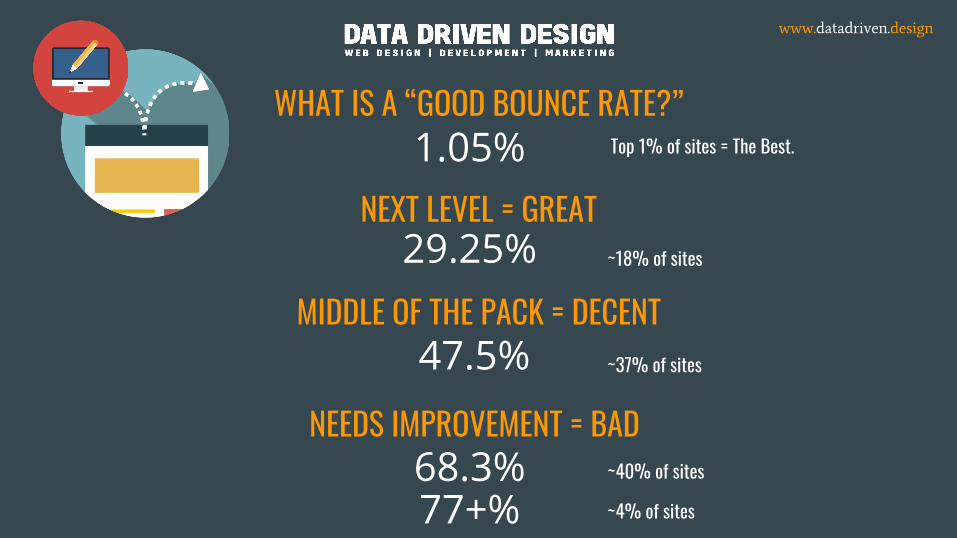
WHAT IS A “GOOD BOUNCE RATE?”
www.datadriven.design
MIDDLE OF THE PACK = DECENT
1.05%NEXT LEVEL = GREAT
47.5%
29.25%
NEEDS IMPROVEMENT = BAD68.3%
Top 1% of sites = The Best.
~18% of sites
~37% of sites
~40% of sites
~4% of sites77+%
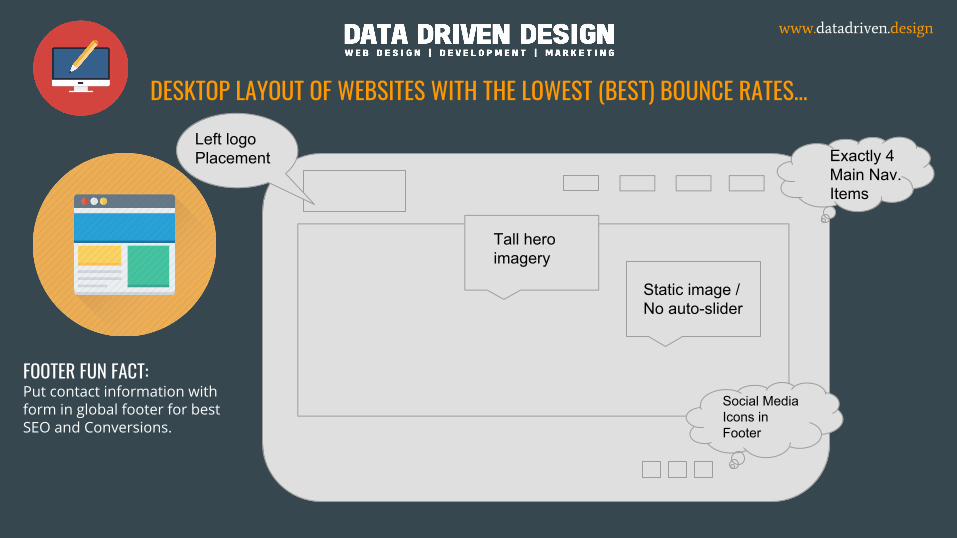
DESKTOP LAYOUT OF WEBSITES WITH THE LOWEST (BEST) BOUNCE RATES...
www.datadriven.design
Tall hero imagery
Static image / No auto-slider
Exactly 4Main Nav. Items
Left logoPlacement
Social MediaIcons in Footer
FOOTER FUN FACT:Put contact information with form in global footer for best SEO and Conversions.
www.datadriven.design
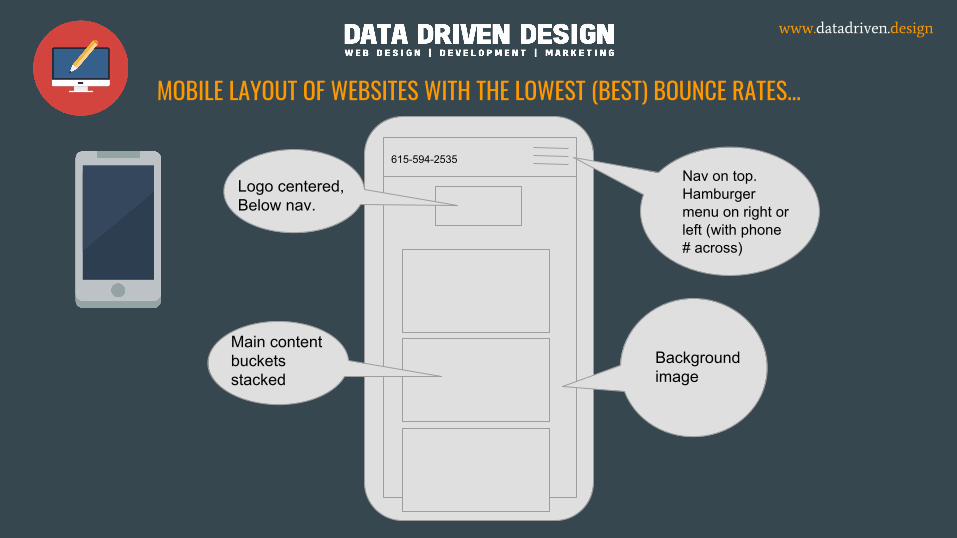
MOBILE LAYOUT OF WEBSITES WITH THE LOWEST (BEST) BOUNCE RATES...
Background image
Logo centered,Below nav.
Main content buckets stacked
Nav on top. Hamburger menu on right or left (with phone # across)
615-594-2535
www.datadriven.design
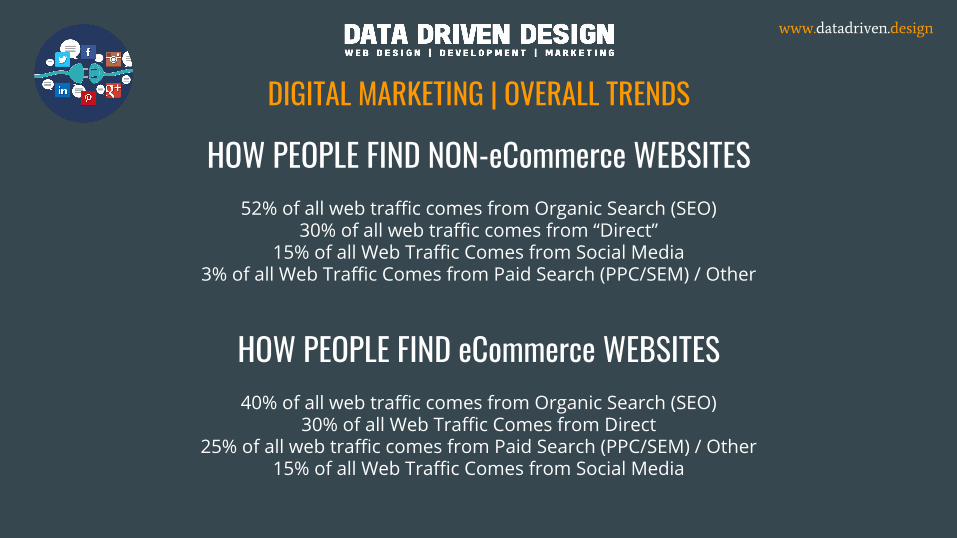
DIGITAL MARKETING | OVERALL TRENDS
HOW PEOPLE FIND NON-eCommerce WEBSITES52% of all web traffic comes from Organic Search (SEO)
30% of all web traffic comes from “Direct”15% of all Web Traffic Comes from Social Media
3% of all Web Traffic Comes from Paid Search (PPC/SEM) / Other
HOW PEOPLE FIND eCommerce WEBSITES40% of all web traffic comes from Organic Search (SEO)
30% of all Web Traffic Comes from Direct25% of all web traffic comes from Paid Search (PPC/SEM) / Other
15% of all Web Traffic Comes from Social Media
www.datadriven.design
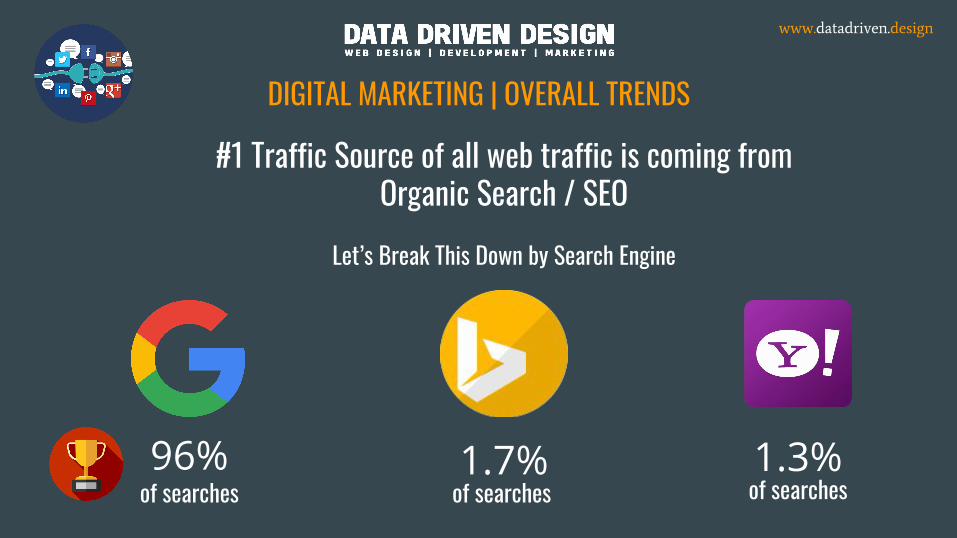
#1 Traffic Source of all web traffic is coming from Organic Search / SEO
Let’s Break This Down by Search Engine
96% 1.7% 1.3%of searches of searches of searches
DIGITAL MARKETING | OVERALL TRENDS
www.datadriven.design
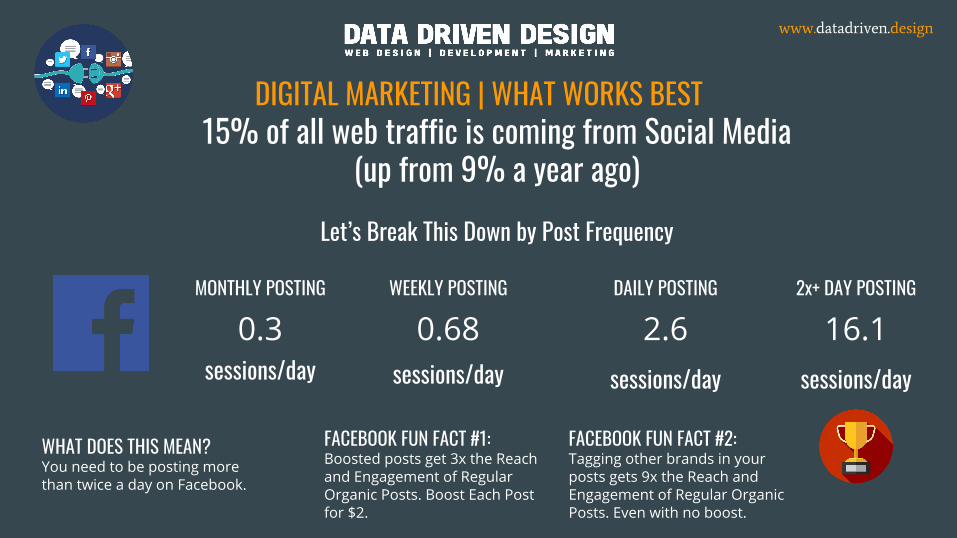
DIGITAL MARKETING | WHAT WORKS BEST15% of all web traffic is coming from Social Media
(up from 9% a year ago)Let’s Break This Down by Post Frequency
MONTHLY POSTING WEEKLY POSTING DAILY POSTING 2x+ DAY POSTING
0.3sessions/day
0.68sessions/day
2.6sessions/day
16.1sessions/day
WHAT DOES THIS MEAN?You need to be posting more than twice a day on Facebook.
FACEBOOK FUN FACT #1:Boosted posts get 3x the Reach and Engagement of Regular Organic Posts. Boost Each Post for $2.
FACEBOOK FUN FACT #2:Tagging other brands in your posts gets 9x the Reach and Engagement of Regular Organic Posts. Even with no boost.
www.datadriven.design
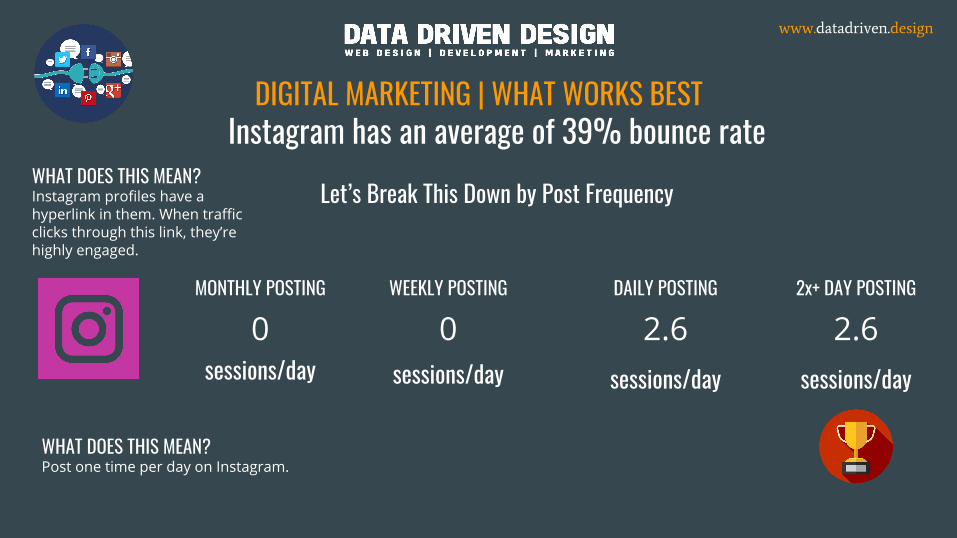
DIGITAL MARKETING | WHAT WORKS BESTInstagram has an average of 39% bounce rate
Let’s Break This Down by Post Frequency
MONTHLY POSTING WEEKLY POSTING DAILY POSTING 2x+ DAY POSTING
0sessions/day
0sessions/day
2.6sessions/day
2.6sessions/day
WHAT DOES THIS MEAN?Post one time per day on Instagram.
WHAT DOES THIS MEAN?Instagram profiles have a hyperlink in them. When traffic clicks through this link, they’re highly engaged.
www.datadriven.design
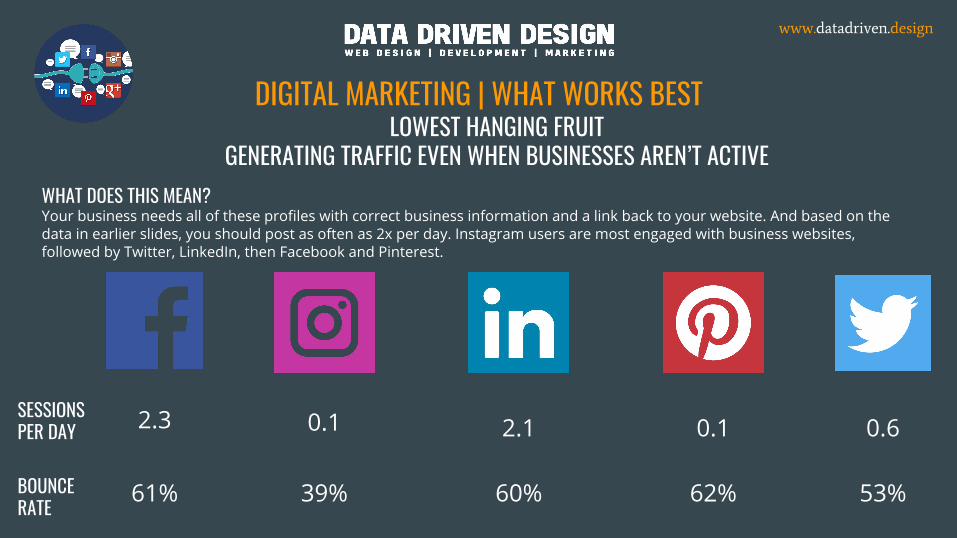
DIGITAL MARKETING | WHAT WORKS BESTLOWEST HANGING FRUIT
GENERATING TRAFFIC EVEN WHEN BUSINESSES AREN’T ACTIVEWHAT DOES THIS MEAN?Your business needs all of these profiles with correct business information and a link back to your website. And based on the data in earlier slides, you should post as often as 2x per day. Instagram users are most engaged with business websites, followed by Twitter, LinkedIn, then Facebook and Pinterest.
SESSIONS PER DAY
BOUNCE RATE 39%61% 60% 62% 53%
2.3 0.1 2.1 0.60.1
www.datadriven.design
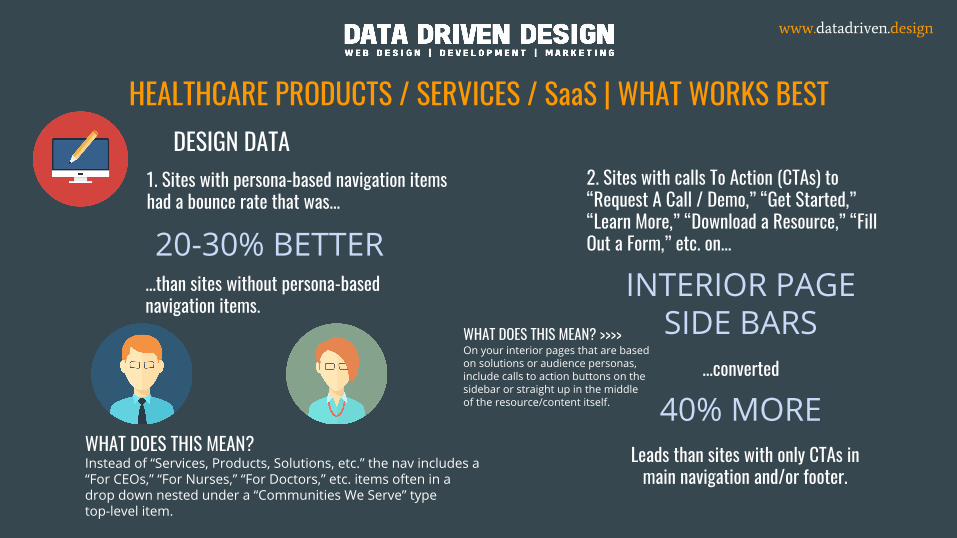
HEALTHCARE PRODUCTS / SERVICES / SaaS | WHAT WORKS BESTDESIGN DATA
1. Sites with persona-based navigation items had a bounce rate that was...
20-30% BETTER...than sites without persona-based navigation items.
WHAT DOES THIS MEAN?Instead of “Services, Products, Solutions, etc.” the nav includes a “For CEOs,” “For Nurses,” “For Doctors,” etc. items often in a drop down nested under a “Communities We Serve” type top-level item.
2. Sites with calls To Action (CTAs) to “Request A Call / Demo,” “Get Started,” “Learn More,” “Download a Resource,” “Fill Out a Form,” etc. on...
INTERIOR PAGE SIDE BARS
...converted
40% MORELeads than sites with only CTAs in
main navigation and/or footer.
WHAT DOES THIS MEAN? >>>>On your interior pages that are based on solutions or audience personas, include calls to action buttons on the sidebar or straight up in the middle of the resource/content itself.
www.datadriven.design
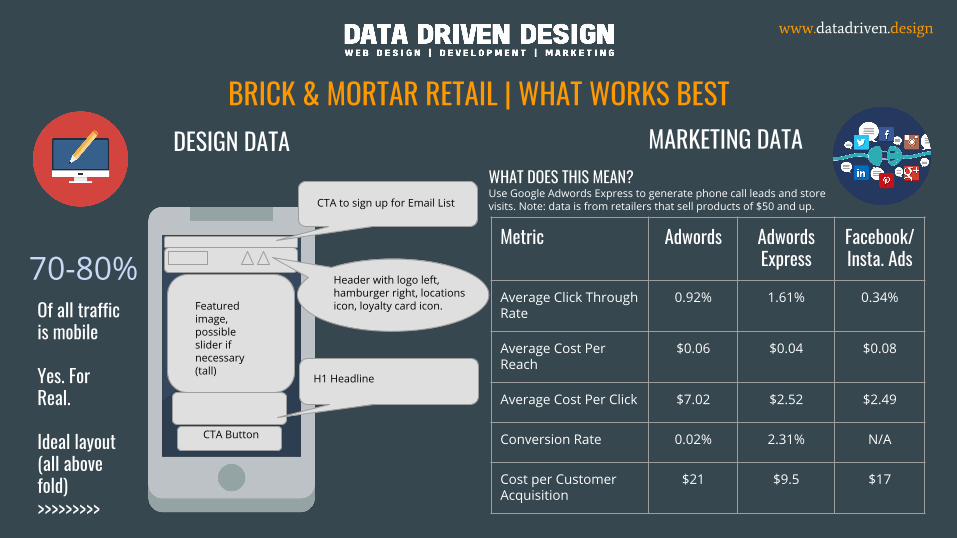
BRICK & MORTAR RETAIL | WHAT WORKS BEST
Metric Adwords Adwords Express
Facebook/Insta. Ads
Average Click Through Rate
0.92% 1.61% 0.34%
Average Cost Per Reach
$0.06 $0.04 $0.08
Average Cost Per Click $7.02 $2.52 $2.49
Conversion Rate 0.02% 2.31% N/A
Cost per Customer Acquisition
$21 $9.5 $17
MARKETING DATADESIGN DATA
70-80%Of all traffic is mobile
Yes. For Real.
Ideal layout(all above fold)>>>>>>>>>
CTA to sign up for Email List
Header with logo left, hamburger right, locations icon, loyalty card icon.
H1 Headline
Featured image, possible slider if necessary (tall)
CTA Button
WHAT DOES THIS MEAN?Use Google Adwords Express to generate phone call leads and store visits. Note: data is from retailers that sell products of $50 and up.
www.datadriven.design
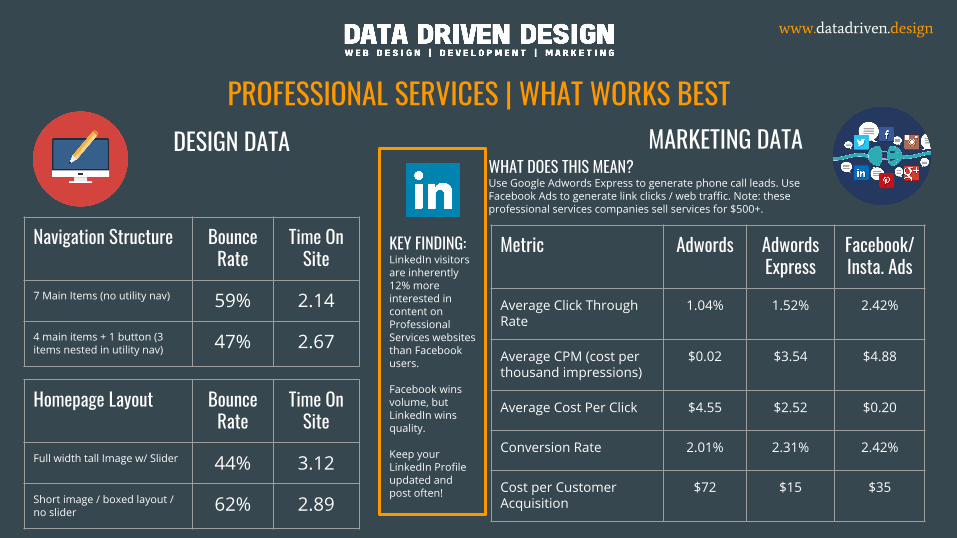
PROFESSIONAL SERVICES | WHAT WORKS BESTDESIGN DATA MARKETING DATA
WHAT DOES THIS MEAN?Use Google Adwords Express to generate phone call leads. Use Facebook Ads to generate link clicks / web traffic. Note: these professional services companies sell services for $500+.
Metric Adwords Adwords Express
Facebook/Insta. Ads
Average Click Through Rate
1.04% 1.52% 2.42%
Average CPM (cost per thousand impressions)
$0.02 $3.54 $4.88
Average Cost Per Click $4.55 $2.52 $0.20
Conversion Rate 2.01% 2.31% 2.42%
Cost per Customer Acquisition
$72 $15 $35
Navigation Structure Bounce Rate
Time On Site
7 Main Items (no utility nav) 59% 2.14
4 main items + 1 button (3 items nested in utility nav) 47% 2.67
Homepage Layout Bounce Rate
Time On Site
Full width tall Image w/ Slider 44% 3.12
Short image / boxed layout / no slider 62% 2.89
KEY FINDING:LinkedIn visitors are inherently 12% more interested in content onProfessional Services websites than Facebook users.
Facebook wins volume, but LinkedIn wins quality.
Keep your LinkedIn Profile updated and post often!
www.datadriven.design
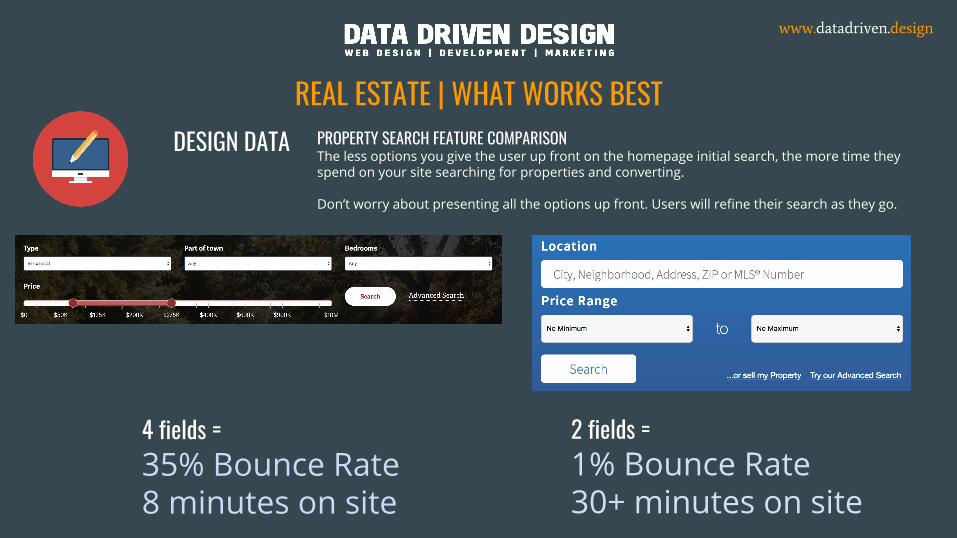
REAL ESTATE | WHAT WORKS BESTDESIGN DATA
4 fields =35% Bounce Rate8 minutes on site
PROPERTY SEARCH FEATURE COMPARISONThe less options you give the user up front on the homepage initial search, the more time they spend on your site searching for properties and converting.
Don’t worry about presenting all the options up front. Users will refine their search as they go.
2 fields =1% Bounce Rate30+ minutes on site
www.datadriven.design
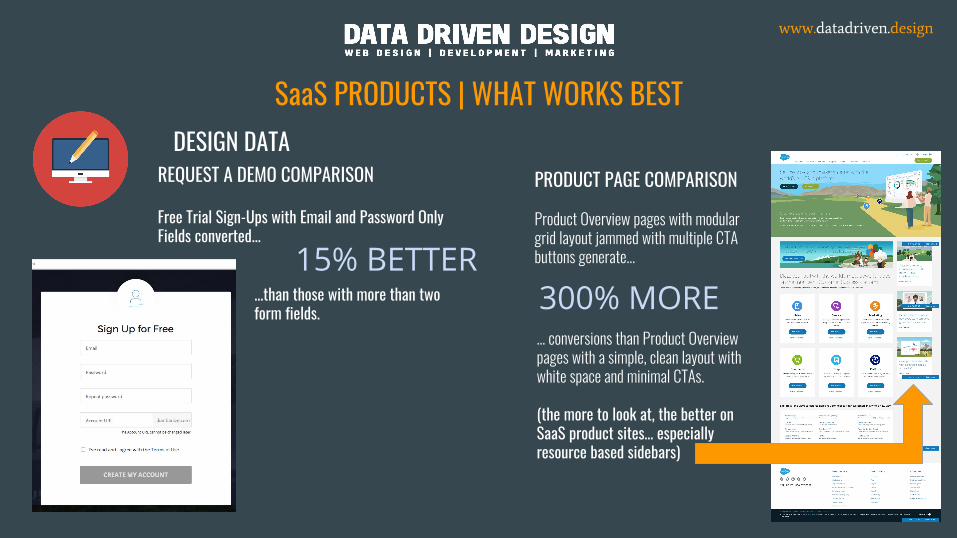
SaaS PRODUCTS | WHAT WORKS BESTDESIGN DATA
...than those with more than two form fields.
15% BETTER
REQUEST A DEMO COMPARISON
Free Trial Sign-Ups with Email and Password Only Fields converted...
PRODUCT PAGE COMPARISON
Product Overview pages with modular grid layout jammed with multiple CTA buttons generate...
300% MORE… conversions than Product Overview pages with a simple, clean layout with white space and minimal CTAs.
(the more to look at, the better on SaaS product sites… especially resource based sidebars)
www.datadriven.design
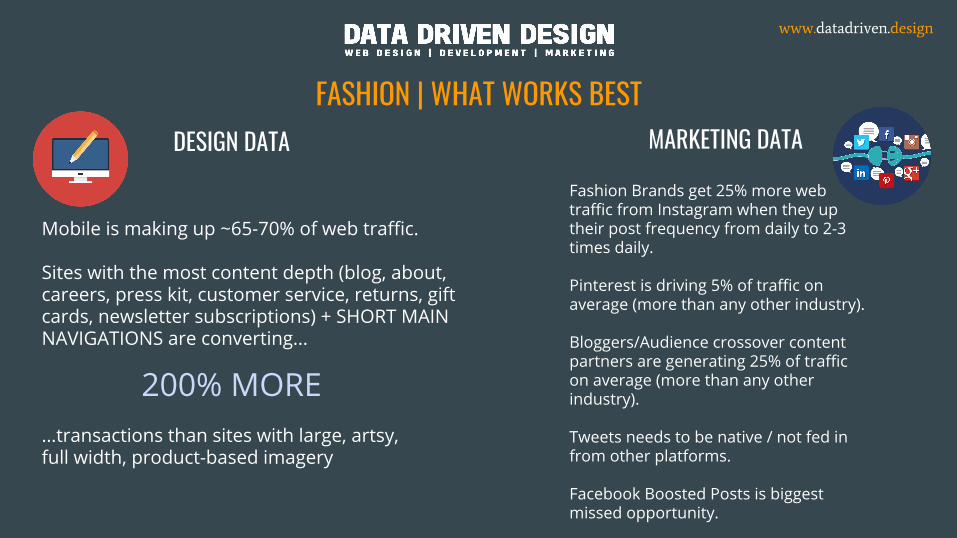
FASHION | WHAT WORKS BEST
Mobile is making up ~65-70% of web traffic.
Sites with the most content depth (blog, about, careers, press kit, customer service, returns, gift cards, newsletter subscriptions) + SHORT MAIN NAVIGATIONS are converting...
Fashion Brands get 25% more web traffic from Instagram when they up their post frequency from daily to 2-3 times daily.
Pinterest is driving 5% of traffic on average (more than any other industry).
Bloggers/Audience crossover content partners are generating 25% of traffic on average (more than any other industry).
Tweets needs to be native / not fed in from other platforms.
Facebook Boosted Posts is biggest missed opportunity.
DESIGN DATA MARKETING DATA
200% MORE…transactions than sites with large, artsy, full width, product-based imagery
www.datadriven.design
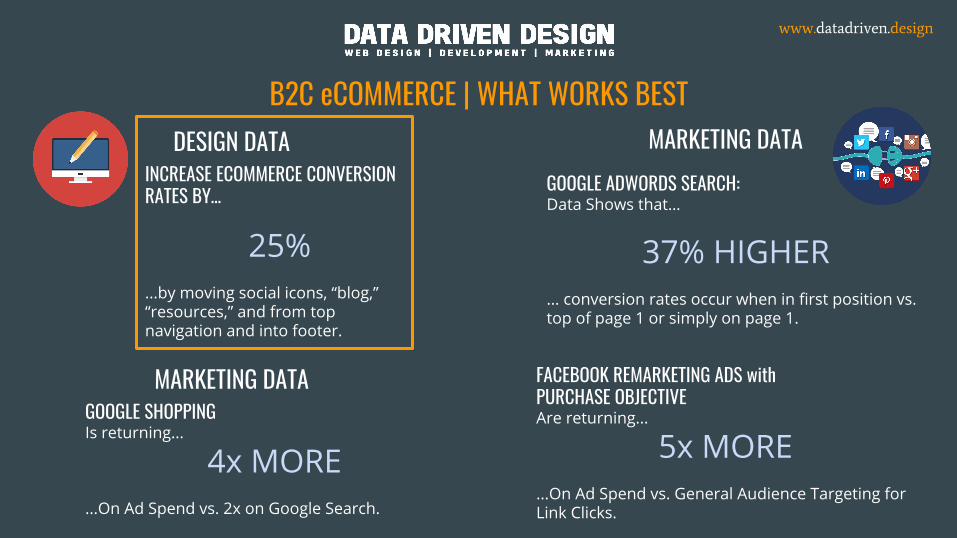
B2C eCOMMERCE | WHAT WORKS BEST
GOOGLE ADWORDS SEARCH: Data Shows that…
37% HIGHER... conversion rates occur when in first position vs. top of page 1 or simply on page 1.
MARKETING DATADESIGN DATAINCREASE ECOMMERCE CONVERSION RATES BY…
25%...by moving social icons, “blog,” “resources,” and from top navigation and into footer.
GOOGLE SHOPPINGIs returning...
4x MORE...On Ad Spend vs. 2x on Google Search.
MARKETING DATA FACEBOOK REMARKETING ADS with PURCHASE OBJECTIVEAre returning...
5x MORE...On Ad Spend vs. General Audience Targeting for Link Clicks.

THANKS FOR YOUR ATTENTION!datadriven.design
DAILY TIPS DAILY TIPS