Paul Dix (Founder InfluxDB) - Organising Metrics at #DOXLON
69
Organizing Metrics: Hierarchical or Tagged? Paul Dix CEO of InfluxDB paul@influxdb.com @pauldix
Transcript of Paul Dix (Founder InfluxDB) - Organising Metrics at #DOXLON

Organizing Metrics?

Necessary when you have thousands, tens, hundreds, or millions

DiscoveryWhat metrics do I have?

Merging and Aggregating
Combine these and give me a result


Hierarchy
Artifact of Whisper’s implementation

Series are round robin files on disk organized in
directories (hierarchy)
Meta data encoded in series name


Tagged?

OpenTSDB Metrics
mysql.bytes_received \ !
1287333217 327810227706 \ !
schema=foo host=db1

mysql.bytes_received \ !
1287333217 327810227706 \ !
schema=foo host=db1
Name

mysql.bytes_received \ !
1287333217 327810227706 \ !
schema=foo host=db1
Tags
Single Level Hierarchy + Tags

Hierarchy: names

Tags
Meta data encoded in series name and tags


Data[ { "name": "cpu", "columns": ["time", "value", "host"], "points": [ [1395168540, 56.7, "foo.influxdb.com"], [1395168540, 43.9, "bar.influxdb.com"] ] } ]

Flat

list series
list series /.*dc\.USWest/

select percentile(90, value) from merge(/cpu_wait.*dc\.USWest.*/) group by time(10m) where time > now() - 4h

Doesn’t scale well to millions of series!

select percentile(90, value) from cpu_wait group by time(10m) where time > now() - 4h and dataCenter = ‘USWest’

Doesn’t scale well to thousands of hosts!

We have to pick a method
Hierarchy vs. Tags?

Religious Debate?

Emacs vs. Vim

i.e. debates that can’t be solved

Scientific Debate?

acceleration due to gravity

Things that have a clear testable answer

Hierarchy vs. Tags a bit of both?

Tags are vastly superior to hierarchies

What questions can you ask?
What sensors do I have?
CPU Idle, network in bytes, memory used, redis key count, etc.

OpenTSDBnames

cpu_wait network_in_bytes network_out_bytes …

Graphitetraverse hierarchy
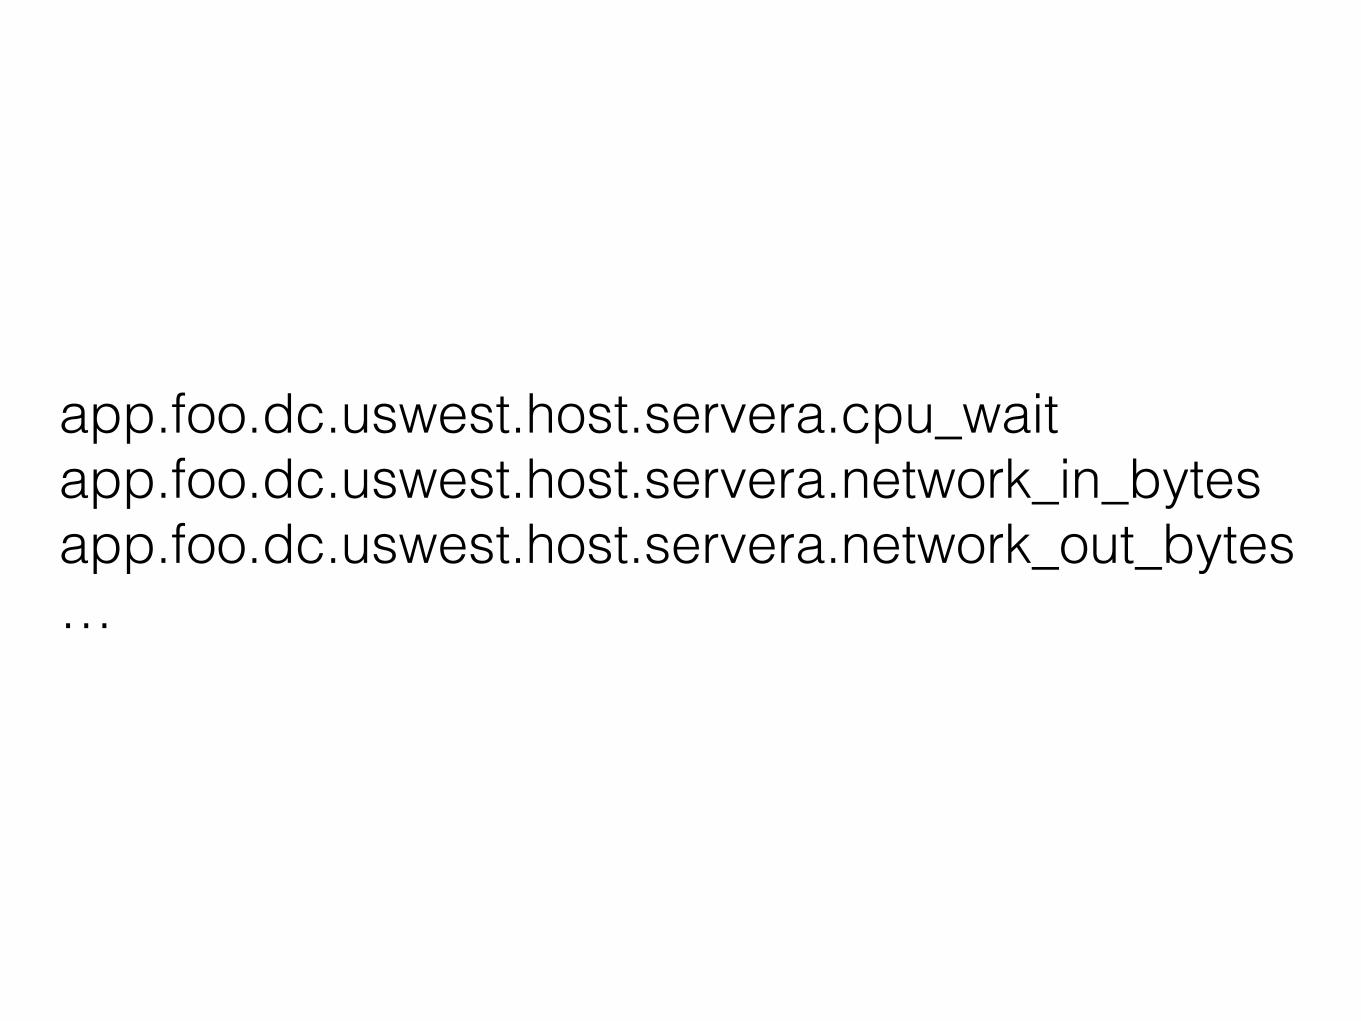
app.foo.dc.uswest.host.servera.cpu_wait app.foo.dc.uswest.host.servera.network_in_bytes app.foo.dc.uswest.host.servera.network_out_bytes …

app.foo.dc.uswest.host.servera.cpu_wait app.foo.dc.uswest.host.servera.network_in_bytes app.foo.dc.uswest.host.servera.network_out_bytes …
Sensor at the end

What values do I have on dimension X?hosts, data centers, services, applications
OpenTSDBtraverse one level and tags
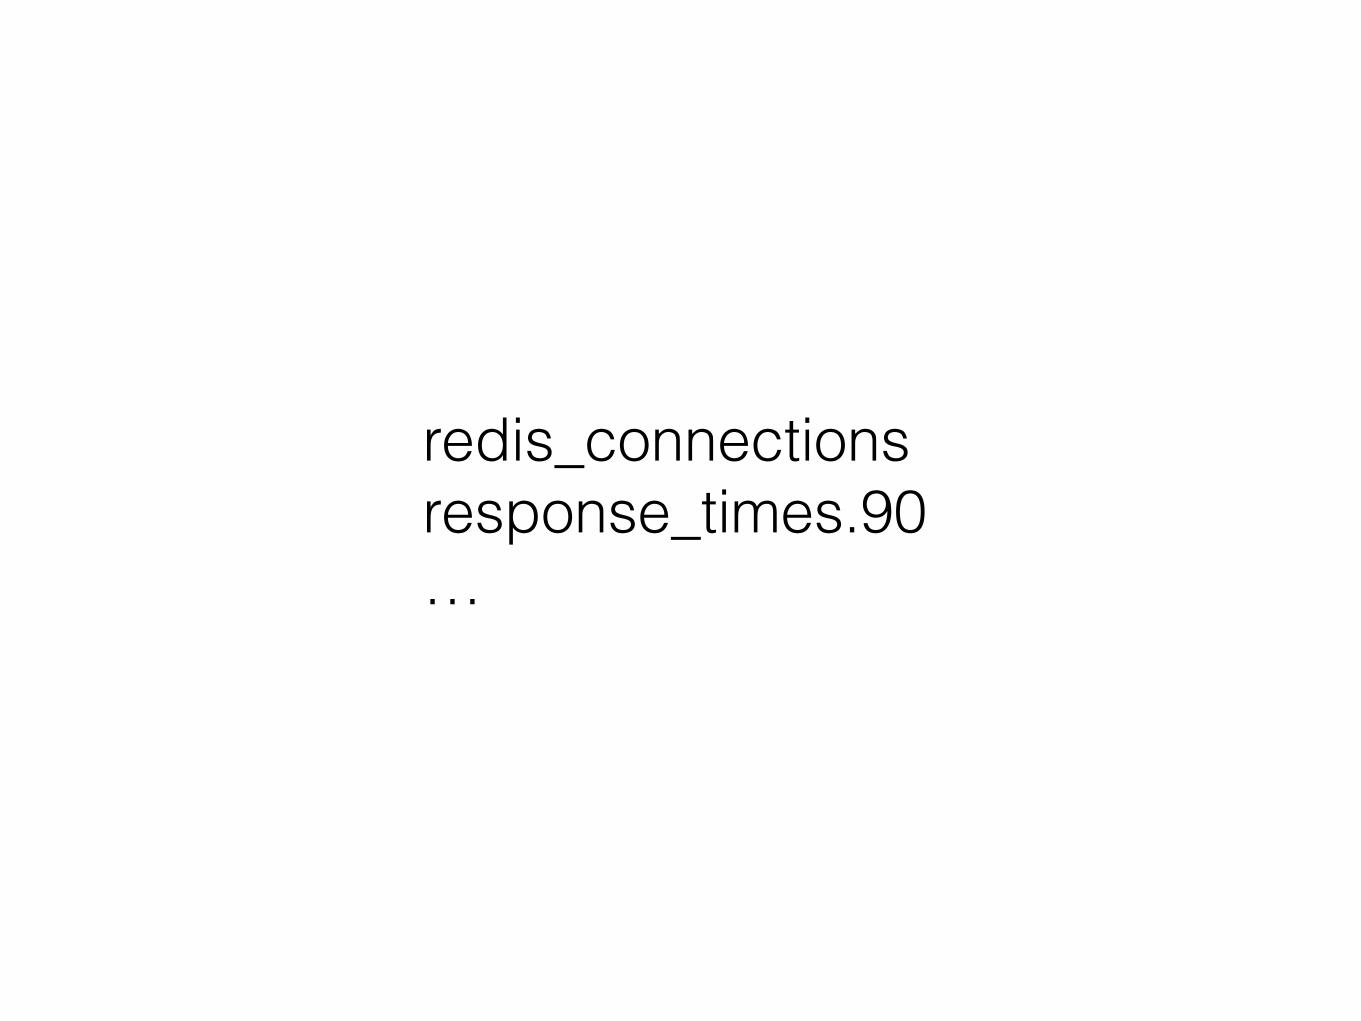
redis_connections response_times.90 …

app.foo.dc.uswest.host.servera.cpu_wait app.foo.dc.uswest.host.servera.network_in_bytes app.foo.dc.uswest.host.servera.network_out_bytes …

Show me all time series for X
dashboard for MySQL, dashboard for host
Computationspercentiles across sets of hosts, data centers, services

Pure tagging
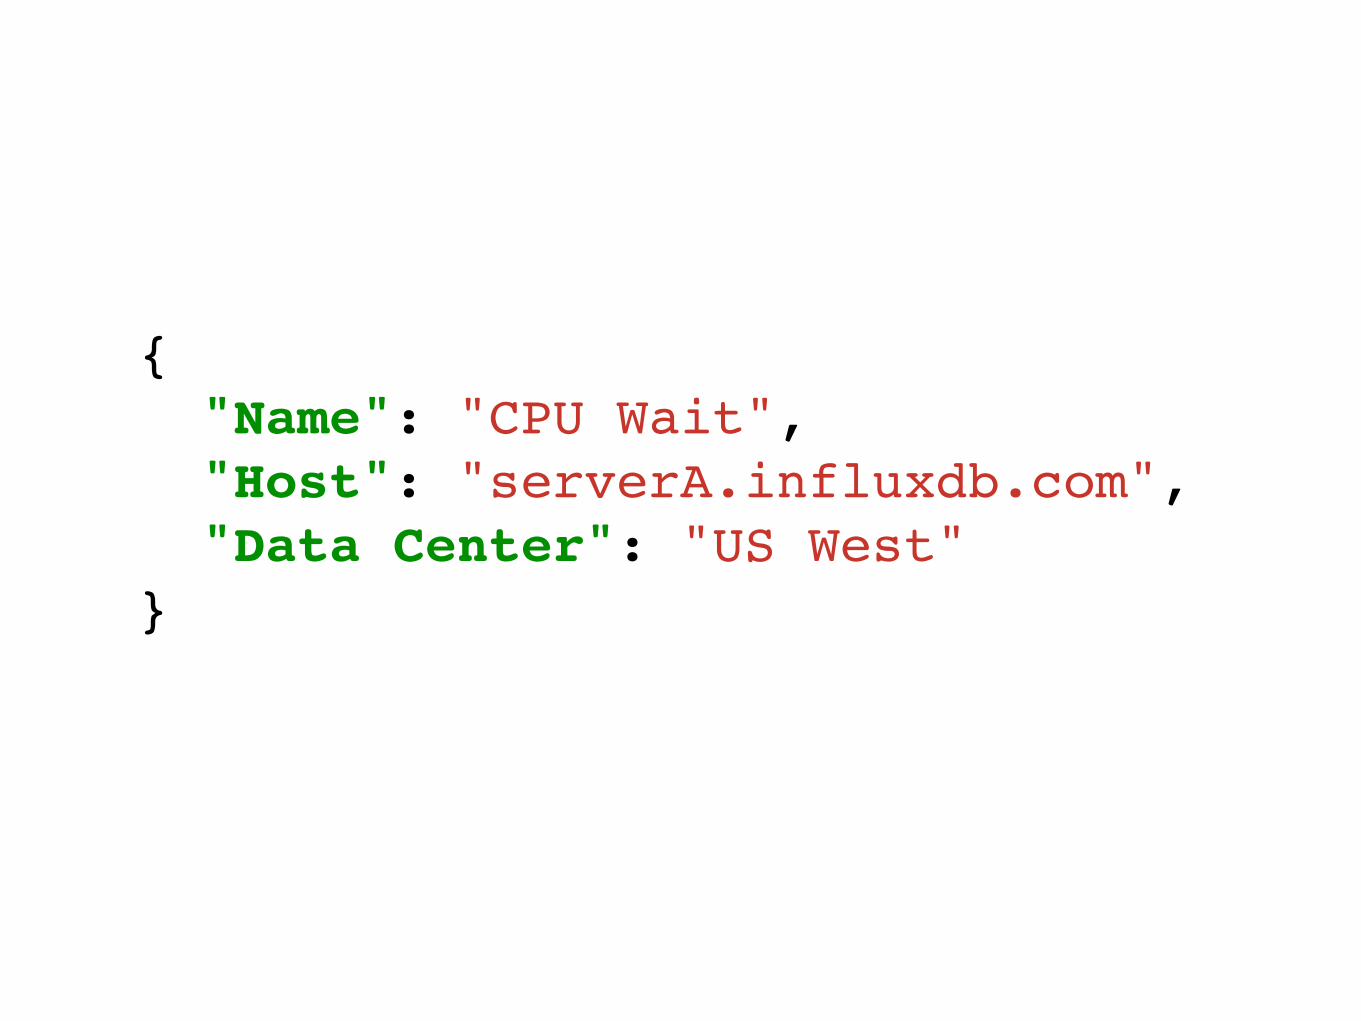
{! "Name": "CPU Wait",! "Host": "serverA.influxdb.com",! "Data Center": "US West"!}!

{! "Name": "CPU Wait",! "Host": "serverA.influxdb.com",! "Data Center": "US West"!}!
Readable Names!
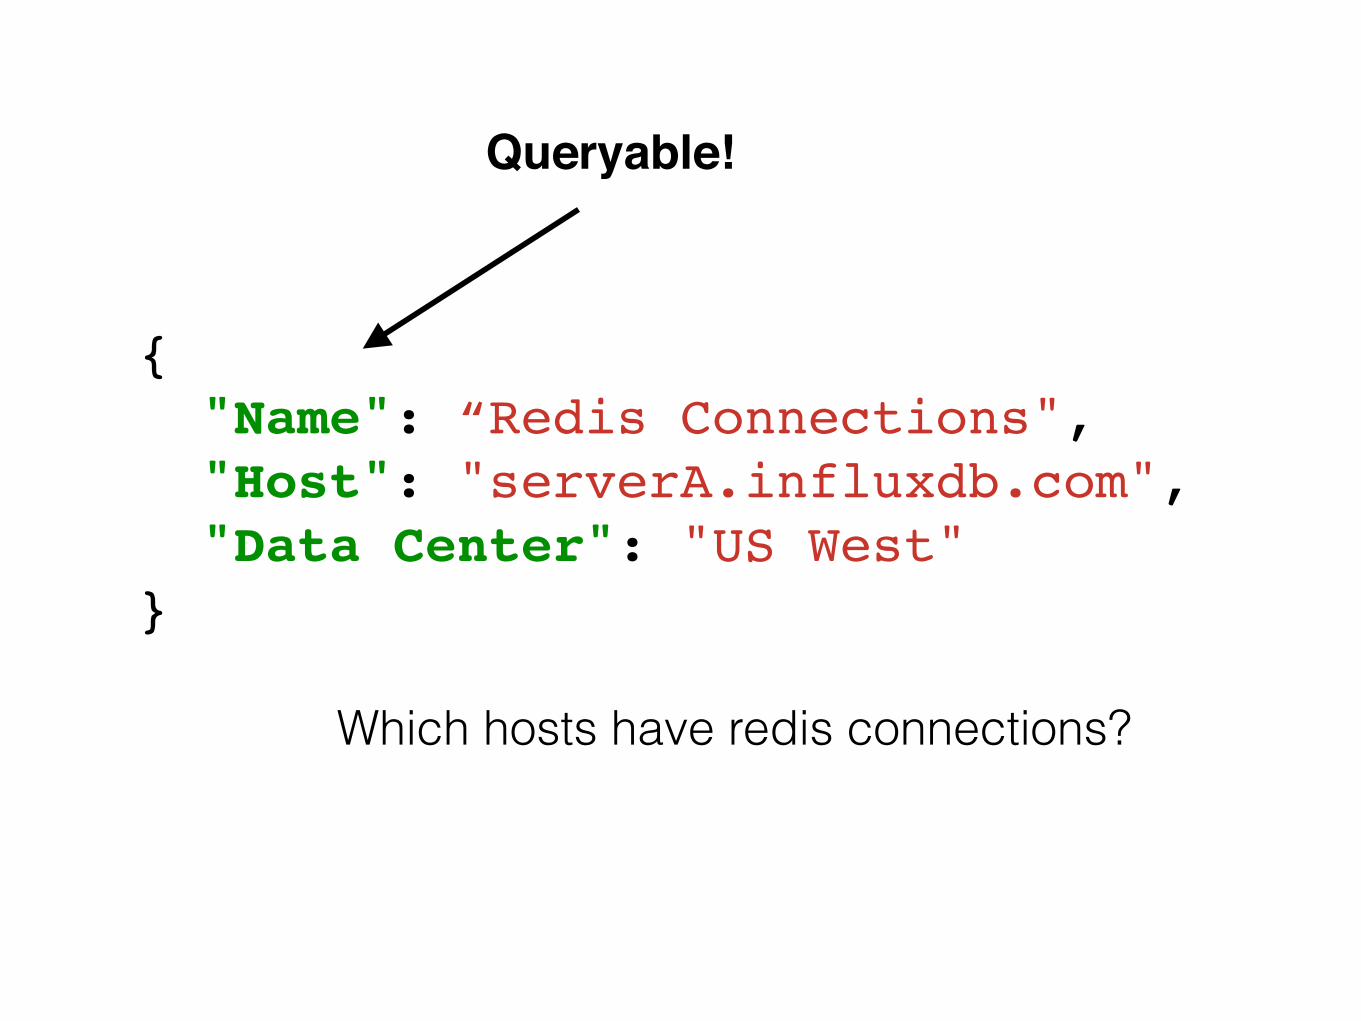
{! "Name": “Redis Connections",! "Host": "serverA.influxdb.com",! "Data Center": "US West"!}!
Queryable!
Which hosts have redis connections?

{! "Name": "Erorrs",! "Host": "serverA.influxdb.com",! "Data Center": "US West",! "Application": "My super rad app"!}!
Queryable!
What names (sensors) do I have for My super rad app?

Queryable!
What names (sensors) do I have at 1h precision?
{! "Name": "Erorrs",! "Host": "serverA.influxdb.com",! "Data Center": "US West",! "Application": "My super rad app",! "Precision": "1h"!}!
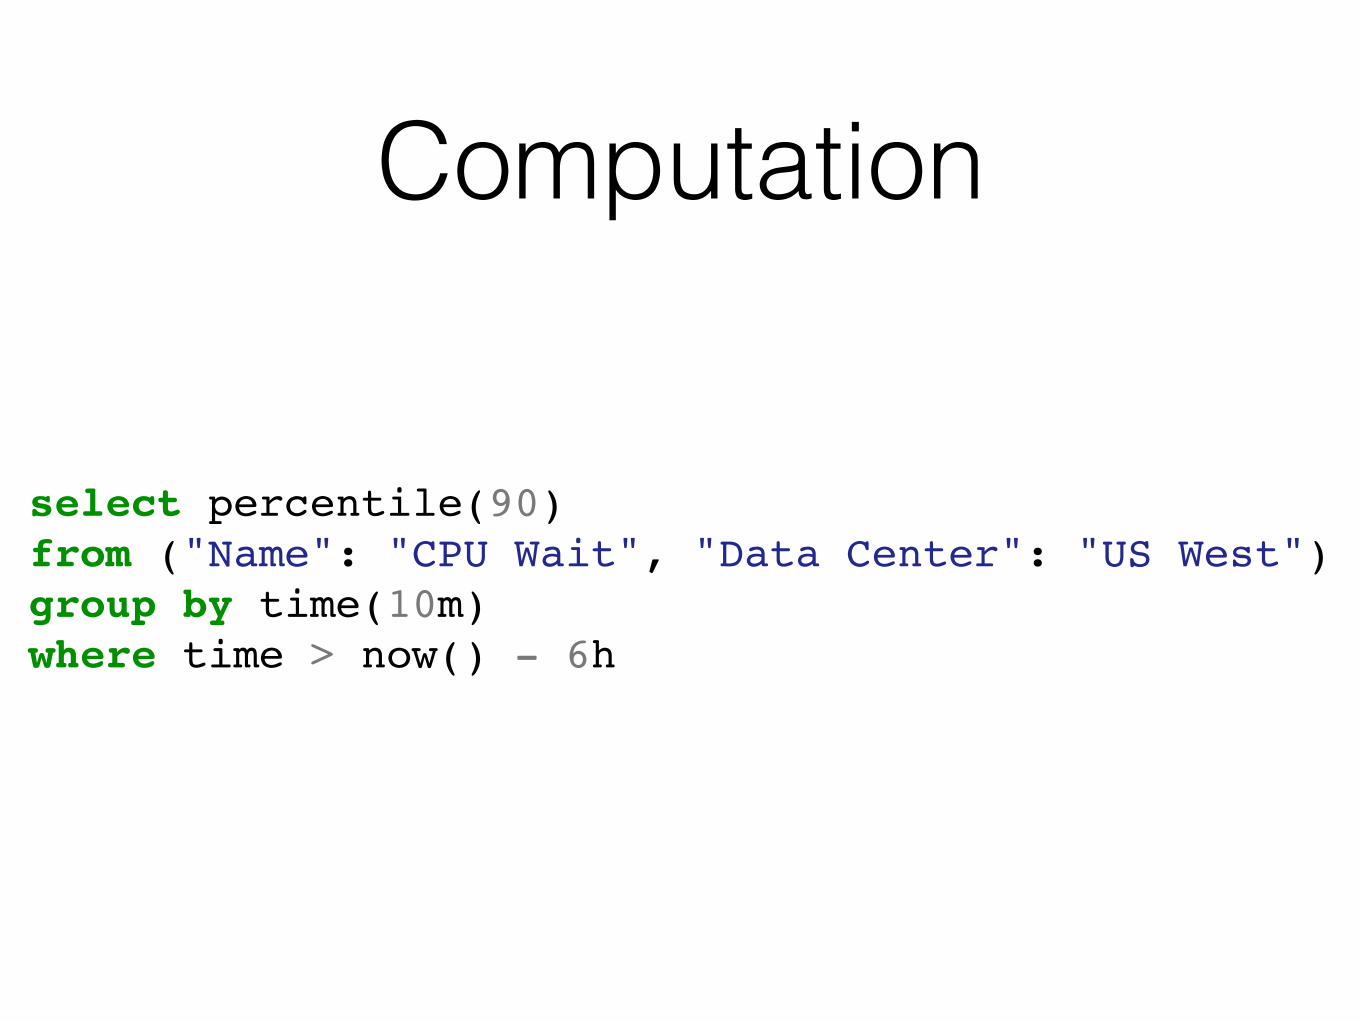
Computation
select percentile(90)!from ("Name": "CPU Wait", "Data Center": "US West")!group by time(10m)!where time > now() - 6h!

Hierarchy on the flyWhat tags co-occur with a given tag?

Faceted Serch

Given “Host” and “Data Center” what other tags
are there?

"Data Center" = "US West" !
"Name": 2153 "Host": 256 "Service": 20 "Precision": 10 "Application": 4
Need to be able to add dimensions/tags

Need to support a large number of tags
Both for a single data point and over all
Pure tagging gives you much more power than
hierarchies

Can be combinatorialOpenTSDB hot spots, etc
Need to be able to define indexing behavior for
tags

Can it work?
This is part of what InfluxDB is working on
Feedback welcome! http://influxdb.com/community.html
@InfluxDB


![EPICS and Open Source Data Analytics Platformsaccelconf.web.cern.ch/AccelConf/icalepcs2017/papers/thpha032.pdf · InfluxDB InfluxDB is the "I" in InfluxData's TICK stack [2]. It is](https://static.fdocuments.us/doc/165x107/5e10b6a492860a5fec500b29/epics-and-open-source-data-analytics-influxdb-influxdb-is-the-i-in-influxdatas.jpg)