Paul Ahlstram Alta Ventures -...
45
1 MitaTech Talks Cross Border Investing Presentation, 2016 @PaulAhlstrom
Transcript of Paul Ahlstram Alta Ventures -...

11
MitaTech TalksCross Border Investing Presentation, 2016
@PaulAhlstrom

22
2006 to 2016 Investing in Mexican Innovation: Cross-border venture investing lessons learned

33
Heber M. Cluff
President Diaz said– The colonists were not only welcome in Mexico, but the Government was anxious to have them help in the development of the country.

44
Pioneer
VS

55
Phase I: The Alta Selection Process
Primary & Secondary Research In Search of the Next Emerging Market…

66
In Search of Stability & Growth The Ring of Fire
Source: Data from World Economic Outlook Database 2012, The Ring of Fire, PIMCO, 2009
Macroeconomic Fundamentals
-15.0%
-12.5%
-10.0%
-7.5%
-5.0%
-2.5%
0.0%
2.5%
5.0%
7.5%
10.0%
12.5%
0.0% 50.0% 100.0% 150.0% 200.0% 250.0%
Public Sector Deficit (% of
GDP)
Chile
Australia
Sweden
Mexico
Finland
Norway
Brazil
NetherlandsSpain
Germany
UK
Canada
France
USAIreland
Portugal
Italy
GreeceJapan
Public Sector Debt (% of GDP)
Argentina
Denmark
Colombia
77
Latin America Deleveraging 2003-2009 (in percent)
Sources: International Monetary Fund, World Economic Outlook, World, Bank, Quarterly External Debt Statistics (QUEDS).

88
Continued Growth in Emerging Markets – Rising Tide
Emerging Markets
Source: IMF, World Economic Outlook Database, 2009
GDP Growth In Emerging Markets Predicted to Outperform Developed Countries
GDP Growth Predicted to Remain Positive in Most Emerging Markets

99
The centers of rapid wealth creation are shifting from Developed to Emerging Markets
Source: IMF, World Economic Outlook Database, April 2012,Data for years 2012-2019 are estimates
Contribution to Global GDP Growth (Share of World Total)
Key Drivers are:• Rapid industrialization• Significant income growth
• Improved long-term household financial confidence
Emerging Markets GDP Growth1995 to 2005 Snapshot
Advanced Economies
Emerging & DevelopingEconomies
30%35%40%45%50%55%60%65%70%
Emerging markets are responsible for over half of the world’s GDP

10
10
Countries of the WorldAlbania Chad Grenada Lesotho Papua New Guinea SwazilandAlgeria Chile Guatemala Liberia Paraguay SwedenAngola China Guinea Libya Peru SwitzerlandAntigua and Barbuda Colombia Guinea-Bissau Lithuania Philippines Syrian Arab RepublicArgentina Comoros Guyana Luxembourg Poland Taiwan Prov of ChinaArmenia Costa Rica Haiti Madagascar Portugal TajikistanAustralia Croatia Honduras Malawi Qatar TanzaniaAustria Cyprus Hong Kong SAR Malaysia Republic of Congo ThailandAzerbaijan Czech Republic Hungary Maldives Republic of Yemen The BahamasBahrain Dem. Rep. of Congo Iceland Mali Romania The Gambia
BangladeshDem. Rep. of Timor-Leste India Malta Russia Togo
Barbados Denmark Indonesia Mauritania Rwanda TongaBelarus Djibouti Iraq Mauritius Samoa Trinidad and TobagoBelgium Dominica Ireland Mexico Saudi Arabia TunisiaBelize Dominican Republic I. Rep. of Afghanistan Moldova Senegal TurkeyBenin Ecuador I. Rep. of Iran Mongolia Serbia TurkmenistanBhutan Egypt Israel Montenegro Seychelles UgandaBolivia El Salvador Italy Morocco Sierra Leone UkraineBosnia and Herzegovina Equatorial Guinea Jamaica Mozambique Singapore United Arab EmiratesBotswana Eritrea Japan Myanmar Slovak Republic United KingdomBrazil Estonia Jordan Namibia Slovenia United StatesBrunei Darussalam Ethiopia Kazakhstan Nepal Solomon Islands Uruguay
Bulgaria Fiji Kenya NetherlandsSÒo TomÚ and PrÝncipe Uzbekistan
Burkina Faso Finland Kiribati New Zealand South Africa VanuatuBurundi F. Y. Rep. of Macedonia Korea Nicaragua Spain VenezuelaCote d'Ivoire France Kosovo Niger Sri Lanka VietnamCambodia Gabon Kuwait Nigeria St. Kitts and Nevis ZambiaCameroon Georgia Kyrgyz Republic Norway St. Lucia ZimbabweCanada Germany Lao People's D.R. Oman St. Vincent &GrenadinesCape Verde Ghana Latvia Pakistan SudanCentral AfricanRepublic Greece Lebanon Panama Suriname

11
11 Albania Chad Grenada Lesotho Papua New Guinea SwazilandAlgeria Chile Guatemala Liberia ParaguayAngola China Guinea Libya PeruAntigua and Barbuda Colombia Guinea-Bissau Lithuania Philippines SyrianArabRepublicArgentina Comoros Guyana PolandArmenia Costa Rica Haiti Madagascar Tajikistan
Honduras Malawi TanzaniaMalaysia Republic of Congo Thailand
Azerbaijan Hungary Maldives Republic of YemenDem. Rep. of Congo Mali Romania The Gambia
BangladeshDem. Rep. of Timor-Leste India Russia Togo
Barbados Indonesia Mauritania Rwanda TongaBelarus Djibouti Iraq Mauritius Samoa
Dominica Mexico TunisiaBelize DominicanRepublic I. Rep. of Afghanistan Moldova Senegal TurkeyBenin Ecuador I. Rep. of Iran Mongolia Serbia TurkmenistanBhutan Egypt Seychelles UgandaBolivia El Salvador Morocco Sierra Leone UkraineBosnia and Herzegovina Equatorial Guinea Jamaica MozambiqueBotswana Eritrea MyanmarBrazil Jordan Namibia
Ethiopia Kazakhstan Nepal SolomonIslands UruguayBulgaria Fiji Kenya SÒoTomÚ and PrÝncipe UzbekistanBurkina Faso Kiribati South Africa VanuatuBurundi F. Y. Rep. of Macedonia Nicaragua VenezuelaCote d'Ivoire Niger Sri Lanka VietnamCambodia Gabon Nigeria St. Kitts and Nevis ZambiaCameroon Georgia KyrgyzRepublic St. Lucia Zimbabwe
Lao People's D.R. St. Vincent &GrenadinesCape Verde Ghana Latvia Pakistan SudanCentral African Republic Lebanon Panama Suriname
*Based on IMF Information.
Narrow the Field: Emerging MarketsPer capita GDP below $14k in 2005

12
12Algeria Chile
China PeruColombia Philippines
Argentina Poland
Malaysia ThailandHungary
RomaniaBangladesh India Russia
Indonesia
MexicoTurkey
I. Rep. of IranEgypt
Morocco Ukraine
BrazilKazakhstan
South AfricaVenezuelaVietnam
Nigeria
Pakistan
Narrow the Field: Larger EconomiesGDP over $75 billion in 2005
*Based on IMF Information.

13
13China
Philippines
Thailand
Bangladesh India RussiaIndonesia
MexicoTurkey
I. Rep. of IranEgypt
Brazil
VietnamNigeria
Pakistan
Narrow the Field: Larger Populations over 50 Million People
*Based on IMF Information.

1414
14
Country Population GDP 2009 (billion)
GDP per capita
China 1,334.74 $ 4,909 * $ 3,678 India 1,199.06 $ 1,236 * $ 1,031 Indonesia 231.55 $ 539 $ 2,329 Brazil 191.48 $ 1,574 $ 8,220 Bangladesh 165.71 $ 95 * $ 574Pakistan 163.77 $ 167 * $ 1,017 Nigeria 151.87 $ 173 * $ 1,142 Russia 141.39 $ 1,229 * $ 8,694 Mexico 107.55 $ 875 $ 8,135 Philippines 92.23 $ 161 $ 1,746 Vietnam 87.21 $ 92 * $ 1,060 Egypt 76.70 $ 188 * $ 2,450 Iran 74.10 $ 330 * $ 4,460 Turkey 70.54 $ 615 $ 8,723 Thailand 66.98 $ 264 $ 3,940
Source: International Monetary Fund
Narrowed Field: Largest 15 Emerging Markets
*Estimated

1515
• Launched in 2005, GES was developed to capture the factors that crucially affect the ability of an economy to grow.
• This tool helps Goldman to predict if their BRIC theory will become a reality in the next 20-40 years. (Variables include inflation, government deficit, external debt, investment rate, penetration of phones, PC’s, and Internet, education, life expectancy,political stability, rule of law and corruption)
Source: Goldman Sachs
BRICS and N-11 Goldman Sachs Growth Environment Score (GES) 2009
Narrowed the Field: BRICS + N11Goldman Sachs Growth Environment Score

1616
Alta Analysis of Key Indicators BRICS vs. other Markets (as of 2005)

17
‘05 Summary Analysis of Top LatAmMexico Brazil Chile Argentina Columbia
Population 114,975,406 199,321,413 17,067,369 42.192,494 45,239,079
GDP GDP Growth: 3.2%PerCapita: $10,514
GDP Growth: 3.2%Per Capita: $12,465
GDP Growth: 5.5%Per Capita:
GDP Growth: 9.2%Per Capita: $11,453
GDP Growth: 5.0%Per Capita: $8,127
Strength/Opportunities
- Relatively low competition- Fast-growing IT market- Skilled labor- Open to foreign investment- Standard corporate regulations- Strong public and private universities- Huge capital gap
- Market Size- Economic stability- Political stability- Trained IT labor- Strong US business presence- Strong exit markets/liquidity
- Ease to do business- Very low trade barriers- Economic stability- Political stability- Highly trained IT labor- Strong US business presence- Channel of distribution follows US models- Port of entry for Asian products- Great base for South American operations
- Demand for technology products- Undergoing positive economic changes- US business presence- World class software and design talent- High level of sophistication and quality of life
- Demand for technology products- Government sector offers good opportunities- Channel of distribution- Some US business presence- Dramatically improved public safety
Weaknesses/Risks
- Weak framework for fund activity- Bankruptcy & judicial system remains inefficient- Perceptions of corruption- Concerns about ongoing drug trade
- Regulated economy- Bureaucratic government & legal system- Time required to start a business (58 days)- Difficult to transfer profits back to US- Trade barriers- Cost of capital- Government is the largest IT customer- Social discrepancies- High crime rates
- Small internal market- High shutdown costs- Business permitting process
- Relatively smallcorporate market in spite of US presence- Currency fluctuation- Government debt- Government perception- Bureaucratic environment- Social discrepancies- High crime rates
- Social discrepancies- Columbian peso fluctuations- Relatively high cost of labor- Perception of safety

1818
Top Choices: Mexico & the BRICS (Based on 2005-2009Analysis)
• Trending First choice*: Mexico • Second place: Brazil• Solid option: India• Largest market: China• Fading star: Russia
* based on market PE/VC attractiveness and underserved capital

19
Hypothesis: Mexico
2020
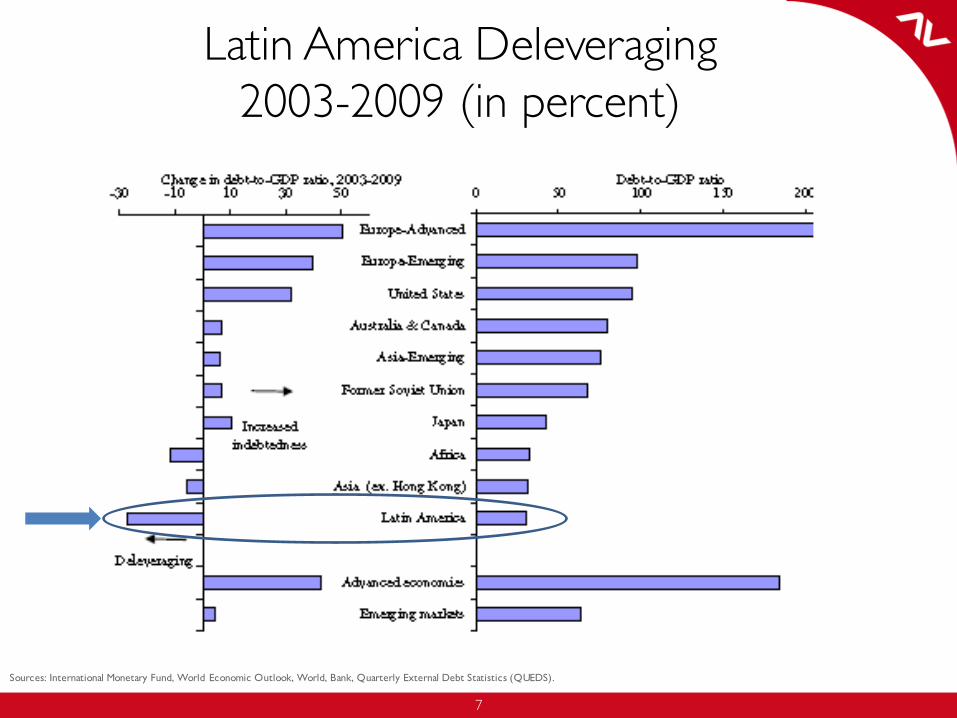
Taking the entrepreneur ecosystem to the next level.
PHASE 1:RESEARCH
PHASE 2:DEAL FLOW
PHASE 3:CAPITAL
Primary & Secondary Research. Hundreds of meetings with entrepreneurs and ecosystem players.(2006 – 2008)
Increased deal flow systems using a variety of development tools.(2009 – 2011)
Increasing capital formation.(2012 – current)
20
Ecosystem Development Process

2121
Sovereign Debt Rating as of 2013
Country Debt RatingChile A+Mexico BBB+Brazil BBBPeru BBBColumbia BBB-Uruguay BBB-
Country Debt RatingParaguay BB-Venezuela B+Bolivia B+Argentina BEcuador B-
Country Debt RatingChina AA-Russia BBBIndia BBB-
Investment Grade Non-Investment Grade
Non-Latin America Countries
Source: Standard & Poor’s.
21
Phase 1 Secondary Research: Mexico’s Sovereign Risk Environment

2222
81%
4%15%
0%
20%
40%
60%
80%
100%
US Canada Other
Mexico’s export productsIn %
Commodities Automotive Electronics Other0%
10%
20%
30%
40%
Mexico’s export partners (2011 in %)
(18%): oil, fruits and vegetables, coffee, cotton
(22%): vehicles, auto parts
(23%): TVs, mobile phones, refrigerators & appliances
(37%): Other manufactured
goods
* 2010. 53 foot container from Mexico to Chicago and 40 foot container from China to Chicago
Mexico’s Export Advantages
Transportation cost*USDs
Lead time*Days
Mexico China
$3058
5 22
$5239
With Significant Export Upside
Labor Unit CostUSDs $4.40 $4.50
0.00
2.00
4.00
6.00
01 03 05 07 09
China
Mexico
Labor unit costUSDs
Mexico’s export oriented manufacturing industry will continue to fuel growth
Source: World Bank, 2012.
22
Phase 1 Research: Mexico’s Manufacturing Advantage– Cost, Quality & Speed

23
Baja CaliforniaChihuahuaCoahuilaNuevo LeónTamaulipasSan Luis PotosíGuanajuatoQuerétaroJaliscoEdo. de MéxicoDistrito FederalTlaxcalaPuebla
VentiladoresCopacabana
Merrytech
G.S.E.B
TIMCO
More than 32 firms*
Mexico Mexico’s Home Appliances Industry: 2005
* Snapshot of 2005 analysis

2424
Increase in Household Appliance Ownership in Mexico
Appliance 2000 2005 2010 2011 2012 2015
Dishwasher 3.8 6.3 9.2 9.8 10.3 11.5
Freezer 4.2 5.3 5.9 6.0 6.1 6.4Microwave Oven 13.0 22.3 29.5 30.8 32.0 35.4
Refrigerator 68.5 79.0 82.1 82.3 82.5 83.2
Telephone 36.2 48.8 46.6 46.0 44.6 42.3
Tumble Drier 4.7 5.0 5.2 5.2 5.3 5.5Vacuum Cleaner 14.1 24.0 35.9 38.2 40.2 46.6Washing Machine 52.0 62.7 66.4 67.0 67.5 68.8
*All figures represent a percentage of households**Source: Euromonitor International
Mexicans are buying modern conveniences

2525
Mexico Aerospace IndustryMexico’s Aerospace Industry grew from 100 in 2004 to 300+ Manufacturers in 2013

26
Querétaro� VISTAR� VITROMATIC (2)
CuernavacaCuernavaca( NEC
Torreónº THOMSON
Monterrey¹ PIONNER� DANFOSS COMPRESSORS� VITROMATIC (3)� MABE (2)º KODAKº NIPPON DENSO (Automotriz)º AXA YAZAKI (Automotriz)
Mexicali¹ SONY¹ DAEWOO(SLRC)¹ MITSUBISHI¹ GOLDSTAR
Aguascalientes�WHITE�WESTINGHOUSE� MEX*º TEXAS INTS.º XEROXº SIEMENS
Querétaro¹ CLARION� DAEWOO� BLACK & DECKER� MABE (2)� SINGERº SIEMENS
MexicoEstado de Mexico� MABE� BRAUN� ELECTROLUX� SUNBEAM� KOBLENZ( ERICSSON( ALCATEL/INDETELº AMP
Puebla� GESTAR� SINGER� VITROMATIC
SaltilloSaltillo� MABE� HAMILTONBEACH*
Reynosa
� VITROMATIC( NOKIA
¹ DELCO (Automotriz)¹ PHILIPS¹ SONY¹ MATSUSHITA (Automotriz)
( LUCENT TECHNOLOGIESº FUJITSU (Automotriz)º CONDURA (Automotriz)º DELNOSA (Automotriz)
SanLuis SanLuis PotosíMABE GE�MABE SANYO�
Chihuahua( MOTOROLAº ALTELº KIOCERAº JABIL
Juárez
¹ KENWOOD� ELECTROLUX7 ACER
¹ TOSHIBA¹ PHILIPS¹ THOMSON
º ELAMEXº PLEXUS
Tijuana¹ SANYO¹ SONY¹ HITACHI¹ MATSUSHITA¹ JVC¹ SAMSUNG¹ PIONNER
º SANYO ELECTRODOMÉSTICOSº PHILIPSº CASIOº KODAKº CANONº KIOCERAº INTERNACIONAL RECTIFIER
¹ MITSUBISHI¹ SHARP
Guadalajara7 I.B.M7 H.P.( NECLUCENT TECHNOLOGIES(
º MOTOROLAº KODAKº CUMEXº SIEMENSº SOLECTRON DE MEXICOº FLEXTRONICSº JABIL CIRCUITº MTI ELECTRONICSº SCI SANMINA
Estado de MéxicoEstado de México
� ELECTROLUX� FILTER QUEEN� HOOVER� IMAN� KOBLENZ� MABE� PHILIPS� SUNBEAMº OLIVETTI
¹ PANASONIC
º OLIMPIA
¹ AUDIO & VIDEO� Home Appliance
7 Computer Equipment
( Telecommunicationsº Other
Mexico’s Consumer Electronics Industry 2005
* Snapshot of 2005 analysis

27
Mexico’s Automotive and Heavy Duty Industry

2828
Fast and sustainable growth
Growing Population and Urbanization
0.85
1.040.88
1.171.29
1.43
05 07 09 11 13 15
GDP (USD tr)
4.0%4.0%
5.3%
3.6%
3.0%3.0%
05 07 09 11 13 15
Inflation (Avg CPI)
12.514.2 13.7
15.116.4
17.6
05 07 09 11 13 15
GDP /capita (USD thds)
23.9%
24.7%
23.2%
25.6%
25.8%
25.9%
05 07 09 11 13 15
Savings rate
103 105 107 110 112 114
05 07 09 11 13 15
Total population (million)
2.2 2.3 2.3 2.4 2.4 2.5
05 07 09 11 13 15
Urban population growth (million)
Healthy population pyramid with increased aging
Age ranges
20302010
Percentage of total population
10% 5% 5% 10%
6%
55%
39%
11%
59%
30%0-45-910-1415-1920-2425-2930-3435-3940-4445-4950-5455-5960-6465-6970-7475-7980-8485-8990-9495-99100+
Increasing Spending Power
Source: IMF Outlook Apr 13, CIA World Fact Book, EIU.
28
Phase 1 Research: Mexico’s Continued Growth& Stability Creating a Middle Class

2929
Mexico mobile phone penetration exceeding 80% by 2009
29
Although developing countries globally trend to 58% penetration rate, mobile users in Mexico have passed the 85 million figure in 2010 (78% penetration rate).
2000 2001 2002 2003 2004 2005 2006 2007 2008 2009 p/ Apr-‐10
Prepaid 12,450 19,974 23,922 28,070 35,943 43,861 51,092 61,361 69,152 73,098 74,298
Postpaid 1,628 1,784 2,006 2,028 2,509 3,268 4,304 5,199 6,152 10,430 10,979
Total 14,078 21,758 25,928 30,098 38,451 47,129 55,395 66,559 75,303 83,528 85,277
Penetration rate 14% 22% 25% 29% 36% 45% 53% 63% 70% 77% 78%
14,078 21,758
25,928 30,098
38,451 47,129
55,395
66,559 75,303
83,528 85,277
0%10%20%30%40%50%60%70%80%90%
-‐10,000 20,000 30,000 40,000 50,000 60,000 70,000 80,000 90,000
Pene
tration rate
Num
ber o
f users (th)
Mobile users in Mexico
Source: COFETEL. *Penetration rate for Apr-10, self calculated

3030
Internet Adoption Growing(2000 to 2009)
30
Mexico has over 28 million internet users, and has seen a significant increase in home internet access in recent years (COFETEL). According to AMIPCI, Internet users can be estimated as 30.6 million in 2009. DSL connections dominate.
Source: COFETEL
2000 2001 2002 2003 2004 2005 2006 2007 2008 2009 p/
Other 103,341 41,291 29,314 34,125 34,596 54,753 138,785 177,844 239,910 514,744
XDSL -‐ 5,300 78,120 213,494 695,912 1,198,725 1,960,557 3,150,190 5,663,947 7,308,791
Coaxial Cable 8,622 64,479 124,052 180,752 326,774 668,874 987,802 1,236,239 1,690,272 2,097,872
Dial Up 1,023,024 1,772,568 1,864,929 2,015,996 2,134,042 1,959,544 1,718,795 1,283,288 684,188 393,276
Total Suscriptions 1,134,987 1,883,638 2,096,415 2,444,367 3,191,324 3,881,896 4,805,939 5,847,561 8,278,317 10,314,683
Estimated users 5,057,533 7,097,172 10,718,133 11,883,041 13,983,492 17,966,001 20,564,256 22,104,096 23,260,328 28,439,250
1,135 1,884 2,096 2,444 3,191 3,882 4,806 5,848 8,278
10,315
5,0587,097
10,718 11,88313,983
17,96620,564
22,104 23,260
28,439
-‐
5,000
10,000
15,000
20,000
25,000
30,000
Num
ber o
f suscriptio
ns/users
Thou
sand
s
Internet suscriptions and users in Mexico

3131
Companies are starved for growth capital to keep up with the market demand. As a rule consumer lending has far outstripped new business lending save for a short period during the financial crisis.
Source: Comision Nacional Bancaria y de Valores
-20%
-10%
0%
10%
20%
30%
40%
50%
60%
2001 2002 2003 2004 2005 2006 2007 2008 2009 2010 2011
Year-over-year growth
Loan Growth in the Mexican Banking System
Business
Consumer
Housing
Significant Growth in Consumer Lending, Limited Business Lending

3232
* Bank credit in Latin America weighted by GDP share. Includes mortgages, credit to consumers and to firmsSource: EMPEA, EIU, LAVCA, Banco de México and S&P Ratings Service; Vander Capital Partners analysis;
PE Penetration vs Attractive Business Environment

3333
Source: Emerging Markets – EMPEA, United Kingdom – Centre for Management Buy-Out Research, United States – PitchBook, Israel – Israel Venture Capital Research Center, Japan – Asia Private Equity Review, All GDP data – International Monetary Fund
OpportunityUp Until 2011 Mexico had very little PE capital & No VCMexico has low private equity participation compared to the BRIC’s.
Private Equity Penetration, 2011

3434
No Debt Financing Avaialable for Small & MediumMexican Businesses 1% of firms get 87% of the financing
Source: AMB Report: “Lending in Mexico” February 2011 and Banco de México; Base de datos ahorro y financiamiento CNBV, diciembre 2010; Endeavor Mexico; Vander Capital Partners analysis.
12%
13%
12%
12%
13%
$56.07
$74.69
$8.38
$11.16
$0
$10
$20
$30
$40
$50
$60
$70
$80
$90
$100
ABM CNBV
Small & Med
Large
408,884 smalland med firms
3,033 largefirms
BANK CREDIT TO MEXICAN FIRMS BY SIZE$US Billion

3535
Source: INEGI Preliminary 2009 results
No Debt or Equity Financing Available to the 3.7Million Micro, Small & Medium Business in Mexico (2008)

3636
All Net New Jobs last 30 Years From Small Companies
Source: http://www.kauffman.org/newsroom/u-s-job-growth-driven-entirely-by-startups.aspx.

373737
Venture Capital Accelerates Creation of Knowledge Economy Jobs

3838
Significant Gap in Mexico’s Funding Continuum
SEED/START-UPFUNDING
DEVELOPMENTFUNDING
EXPANSIONFUNDING
OPPORTUNITYDEVELOPMENT
CONTINUEDGROWTH
ANGELS, FOUNDERS & SEED FUNDS
VENTURE CAPITAL – GROWTH EQUITY
PE - PUBLIC MARKETS
VALUATIONS INCREASE
BUSINESS RISKS DECREASE
MENTORING NEEDS DECREASE
$5M-20M$500K-5M$50K-500K >$20MSweat
Financing Gap in Mexico

3939
Without Capital…How can Mexican entrepreneurs create Jobs?

4040
On-The-Ground Research
4141
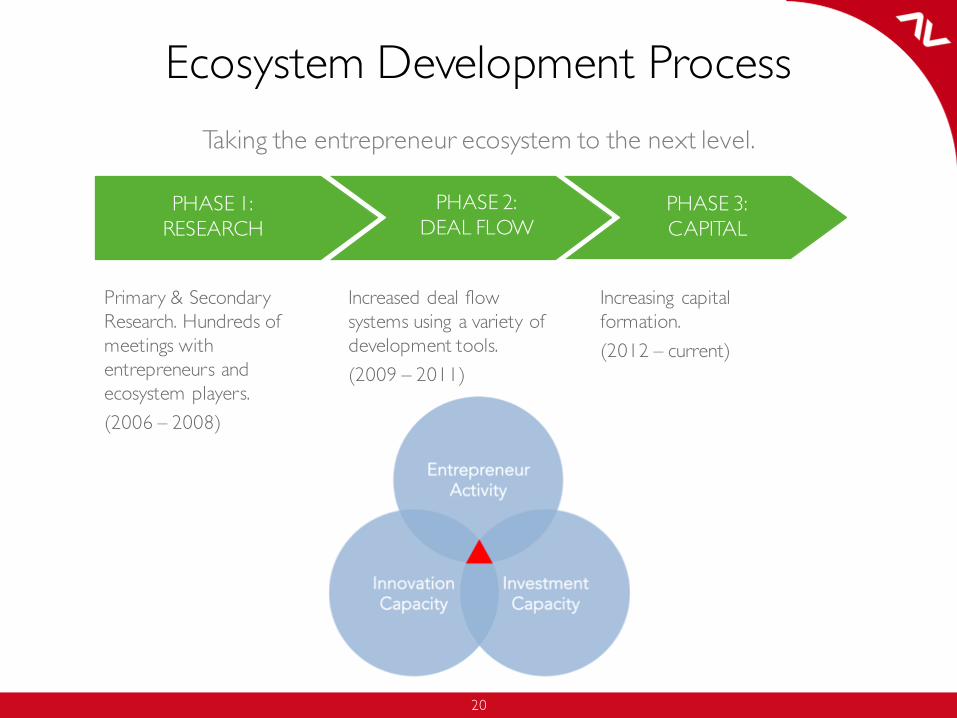
Driving Questions 2008• Catalyst. Mexico has trillion dollar economy and
is neighbor to the world’s largest economy– Why is the VC asset class missing in Mexico? Could the VC Industry be a catalyst for change and help accelerate a meritocracy in Mexico?
• Corruption. Corruption has been holding back the Mexican people. VC requires trust… can we really create a VC industry in Mexico?
• Capital. Could new sources of capital must be identified and cultivated?

4242
Mexico has come a long wayfrom how I remembered Mexico

4343
Reality –There are many Mexicos

4444
• Violence
• Drug Cartels
• Immigration
Border Issues Obscure US’s view of Mexico

4545
The Alta team Held 120+ meetings to understand oppor tunities and challenges of doing business in Mexico & create a unified vision.
Government
Industry
Mexican Families
Research/Universities
LPs/Financial
Federal Competition Commission; Economic Bureau; Undersecretary of the Treasury; ProMexico; Economic Bureau, Foreign Investment; Telecommunications and Transportation Bureau; Mexican Senators; Governor of State of Mexico; Former Ambassador to US; Mayor of Mexico City; Undersecretary of North America; Mexican Legislature; Executive Director, NAFINSA; ProMexico; FOCIR
GE Mexico, Cisco, Corporate and Investment Bank of Banamex (Citigroup), Intel Capital Mexico, IXE Grupo Financiero, American Chamber of Commerce—Mexico, Cavlemas, US Hispanic Chamber of Commerce; Banorte Insurance, Deutsche Bank Mexico
Visited with more than 30+ families who are among the most influential in Mexico
Tecnologico de Monterrey (TEC) , UNAM, CEPII, Conacyt, Pan American Univ. (CEPii)
More than 20 limited partners and 3 institutional investors and multilaterals including IFC, NAFIN, CMIC, IADB/MIF
45
Phase 1: Fresh Look– 120+ Meetings