PATTERNS OF MOTOR VEHICLE THEFT - BOCSAR · iii Patterns of Motor Vehicle Theft PREFACE Last year...
47
PATTERNS OF MOTOR VEHICLE THEFT Christopher Devery with the assistance of Robert Jochelson and Marie Therese Nguyen da Huong New South Wales Bureau of Crime Statistics and Research
Transcript of PATTERNS OF MOTOR VEHICLE THEFT - BOCSAR · iii Patterns of Motor Vehicle Theft PREFACE Last year...

i
Patterns of Motor Vehicle Theft
PATTERNS OFMOTOR VEHICLE THEFT
Christopher Devery
with the assistance of
Robert Jochelson
and
Marie Therese Nguyen da Huong
New South Wales Bureau of Crime Statistics and Research

Patterns of Motor Vehicle Theft
i i
1993
Published by the NSW Bureau of Crime Statistics and ResearchAttorney General’s DepartmentLevel 520 Bridge StreetSydney
ISBN 0 7310 1983 0

iii
Patterns of Motor Vehicle Theft
PREFACE
Last year more than 39,000 residents of New South Wales had their vehicle stolen.While many stolen vehicles are recovered intact the offence obviously still causesconsiderable inconvenience and hardship to a large number of New South Wales residents.When a stolen vehicle is either not re ered or is recovered damaged in some way,the inconvenience and hardship caused by the theft is compounded by financial loss.The finanical loss may be felt first by insurance companies. In the long run, however, thecosts borne by insurance companies end up factored into the premiums paid by all thosewho insure their cars.
As with all offences, the causes of motor vehicle theft are highly variable. Some individualssteal vehicles simply as a form of transport. Some steal vehicles in order to obtain thevaluables left in those vehicles. Some steal vehicles in order to s trip them for parts or resale.Others fraudulently report vehicles stolen in order to claim on their insurance. Given thevariety of motives among those who commit car theft, vehicle theft rates are best reducedwith a combination of strategies rather than any single strategy. The ideal prevention policyis one which works to reduce the incidence of each of the various forms of vehicle theftrather than just one form.
This report represents a consolidation of recent research conducted by the Bureau on vehicletheft. The opening section considers a variety of explanations for the sharp fall in vehicletheft rates experienced in New South Wales over the last few years. The sections whichfollow characterize and attempt to estimate the magnitude of the various types of vehicletheft. The report then concludes with a discussion of the various options for preventionand their likely impact on vehicle theft rates.
The report findings should make a valuable contribution to the further development ofvehicle theft prevention policy in New South Wales.
Dr Don WeatherburnDirector
September 1993

Patterns of Motor Vehicle Theft
iv
This report would not have been possible without the generous assistance provided bythe NSW Police Service and the National Roads and Motorists Association (NRMA).Both these organisations provided data: the police pro ed data from their Stolen VehicleIndex and the NRMA provided information on a sample of 100,000 insured vehicles.
As is the case with all Bureau reports, many Bureau staff made contributions to the finalreport. In particular, Jeanette Packer and Bronwyn Lind made many helpful commentson early drafts, and Les Kery was responsible for desktop publishing.
ACKNOWLEDGEMENTS
v
Patterns of Motor Vehicle Theft
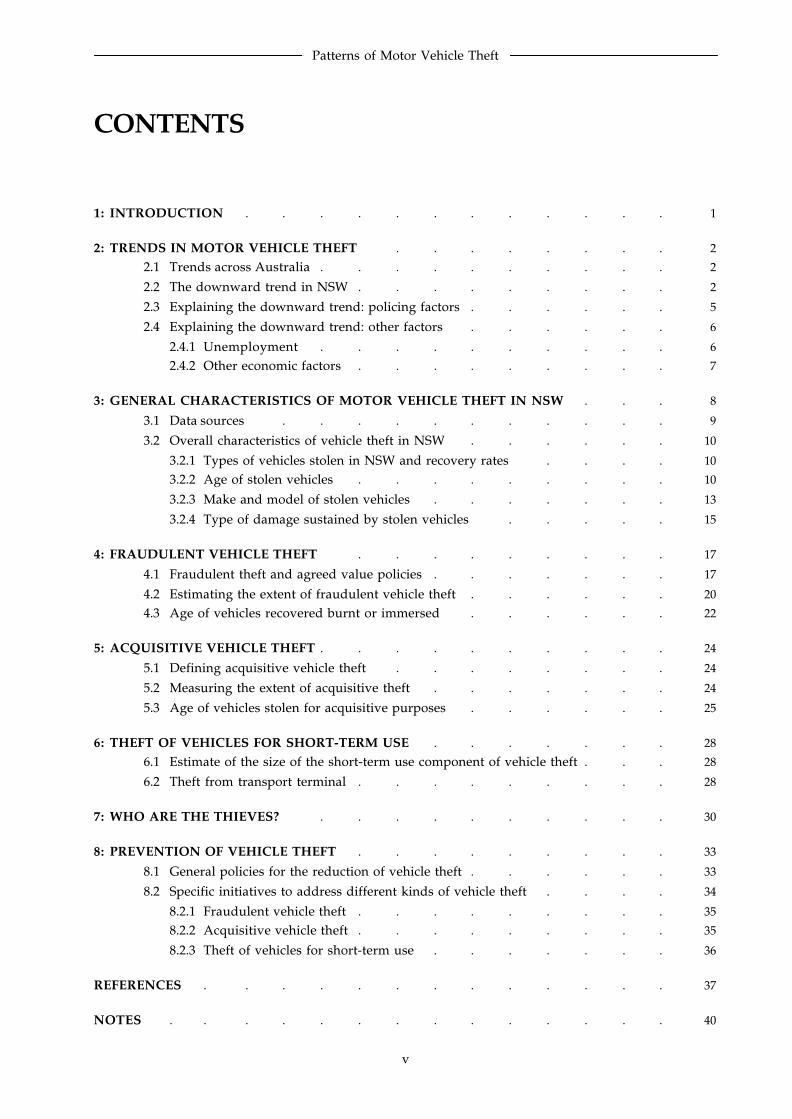
CONTENTS
1: INTRODUCTION . . . . . . . . . . . . 1
2: TRENDS IN MOTOR VEHICLE THEFT . . . . . . . . 22.1 Trends across Australia . . . . . . . . . . 2
2.2 The downward trend in NSW . . . . . . . . . 2
2.3 Explaining the downward trend: policing factors . . . . . . 5
2.4 Explaining the downward trend: other factors . . . . . . 6
2.4.1 Unemployment . . . . . . . . . . 62.4.2 Other economic factors . . . . . . . . . 7
3: GENERAL CHARACTERISTICS OF MOTOR VEHICLE THEFT IN NSW . . . 8
3.1 Data sources . . . . . . . . . . . 9
3.2 Overall characteristics of vehicle theft in NSW . . . . . . 10
3.2.1 Types of vehicles stolen in NSW and recovery rates . . . . 103.2.2 Age of stolen vehicles . . . . . . . . . 10
3.2.3 Make and model of stolen vehicles . . . . . . . 13
3.2.4 Type of damage sustained by stolen vehicles . . . . . 15
4: FRAUDULENT VEHICLE THEFT . . . . . . . . . 17
4.1 Fraudulent theft and agreed value policies . . . . . . . 17
4.2 Estimating the extent of fraudulent vehicle theft . . . . . . 204.3 Age of vehicles recovered burnt or immersed . . . . . . 22
5: ACQUISITIVE VEHICLE THEFT . . . . . . . . . . 24
5.1 Defining acquisitive vehicle theft . . . . . . . . 24
5.2 Measuring the extent of acquisitive theft . . . . . . . 24
5.3 Age of vehicles stolen for acquisitive purposes . . . . . . 25
6: THEFT OF VEHICLES FOR SHORT-TERM USE . . . . . . . 286.1 Estimate of the size of the short-term use component of vehicle theft . . . 28
6.2 Theft from transport terminal . . . . . . . . . 28
7: WHO ARE THE THIEVES? . . . . . . . . . . 30
8: PREVENTION OF VEHICLE THEFT . . . . . . . . . 33
8.1 General policies for the reduction of vehicle theft . . . . . . 33
8.2 Specific initiatives to address different kinds of vehicle theft . . . . 34
8.2.1 Fraudulent vehicle theft . . . . . . . . . 358.2.2 Acquisitive vehicle theft . . . . . . . . . 35
8.2.3 Theft of vehicles for short-term use . . . . . . . 36
REFERENCES . . . . . . . . . . . . . 37
NOTES . . . . . . . . . . . . . . 40

Patterns of Motor Vehicle Theft
vi

1
Patterns of Motor Vehicle Theft
1. INTRODUCTION
Vehicle theft is a common offence in New South Wales (NSW). In a typical week inNSW around 750 vehicles are stolen.1 In 1991, the police recorded over 46,000 instancesof vehicle theft, or about 1.6 per cent of the fleet of registered vehicles in 1991.2 Theseinstances of vehicle theft represented a large percentage of all recorded offences: vehiclethefts or illegal use of a vehicle accounted for almost 11 per cent of all recorded offencesin NSW in 1991 (NSW Bureau of Crime Statistics and Research 1992a).
The total value of all these stolen vehicles would be very large if none were recovered.However, because many stolen vehicles are recovered, and sustain varying amounts ofdamage, the actual costs to the community of motor vehicle theft are somewhat less thanthe total value of the vehicles stolen. The National Roads and Motorists’ Association(NRMA 1991a) estimated that the direct cost of vehicle theft to the NSW communitywas 226 million dollars in 1990. This estimate does not include other costs, such as thoseborne by the police who must record and follow up incidents of vehicle theft reportedto them, or incidental costs incurred by the owner while a vehicle is recovered andrepaired or replaced. To these costs must be added the costs of prosecuting thoseoffenders who are arrested, and accommodating those who are found guilty andsentenced to gaol.
This report examines a number of aspects of motor vehicle theft in NSW. First, the reportexamines trends in motor vehicle theft. Then the general characteristics of the offenceare described, the numbers of vehicles stolen for different purposes are estimated andthe characteristics of different types of vehicle theft are considered. The different typesof theft examined here are fraudulent thefts, theft for the acquisition of the whole vehicleor parts, and theft for transport or other temporary use.
The report then briefly examines the characteristics of known motor vehicle theftoffenders. The final section considers the implications for crime prevention and discussesvarious policies for the prevention of vehicle theft.

Patterns of Motor Vehicle Theft
2
2. TRENDS IN MOTOR VEHICLE THEFT
2.1 TRENDS ACROSS AUSTRALIAAlthough vehicle theft in NSW represents a significant proportion of the Australian totalfor that offence, NSW is the most populous State, and has the largest number of registeredvehicles. A comparison of the prevalence of vehicle theft in the Australian States is givenin Figure 1, which shows rates of theft per 100,000 registered vehicles in each State in1991-92. NSW ranks fourth behind Western Australia, the Northern Territory and SouthAustralia in terms of the rate of vehicle theft. While the rates for the top four States arequite similar, the rate of vehicle theft in Western Australia is more than four times that ofTasmania.
2.2 THE DOWNWARD TREND IN NSW
Vehicle theft in NSW represents a significant problem but it is one which has declinedsignificantly in recent years. Figure 2 shows trends in the frequency of vehicle theftsper annum in a number of States between 1974 and 1992. (At the time of writing no datawere available for Tasmania or the Australian Capital Territory for the financial year1991-92.) The figure shows that vehicle theft in NSW has declined from a peak of morethan 64,000 in 1986-87 to just over 40,000 in 1991-92, a decline of 33.3 per cent. In contrast,vehicle theft numbers continued to increase between 1986-87 and 1990-91 in the otherStates before declining between 1990-91 and 1991-92.
0
1000
2000
Rate per 100,000 registered vehicles
1500
500
WA NT SA NSW VIC QLD ACT TAS
Figure 1: Number of recorded motor vehicle theft offences per 1000 registeredvehicles, Australian States, year ending 30 June 19913

3
Patterns of Motor Vehicle Theft
74 75 76 77 78 79 80 81 82 83 84 85 86 87 88 89 90 91 920
20
40
60
80
NSW VIC QLD WA SA NT
Year ending 30 June
Number of recorded offences
Figure 2: Number of recorded motor vehicle theft offences,Australian States, years ending 30 June, 1974 - 19924
The extent of the downward trend for vehicle theft in NSW is further illustrated inFigure 3 which shows the monthly numbers of recorded motor vehicle theft offencesbetween July 1986 and December 1992. The figure illustrates a statistically significantdownward trend (Kendall’s τ = 0.68, p < 0.001) in vehicle theft in NSW over the period.
0
2,000
4,000
6,000
8,000
Jul Jan1987
Jul Jan1988
Jul Jan1989
Jul Jan1990
Jul Jan1991
Jul Jan1992
Jul Dec1992
Number of recorded offences
Figure 2: Monthly numbers of recorded motor vehicle theft offences,July 1986 to December 1992

Patterns of Motor Vehicle Theft
4
0
150
300
450
Jun89
Dec89
Jun90
Dec90
Jun91
Dec91
Jun92
Dec92
Jan89
0
150
300
450
Jun89
Dec89
Jun90
Dec90
Jun91
Dec91
Jun92
Dec92
Jan89
0
150
300
450
Jun89
Dec89
Jun90
Dec90
Jun91
Dec91
Jun92
Dec92
Jan89
0Jun89
Dec89
Jun90
Dec90
Jun91
Dec91
Jun92
Dec92
Jan89
150
300
450
0
50
100
150
Jun89
Dec89
Jun90
Dec90
Jun91
Dec91
Jun92
Dec92
Jan89
0
100
200
300
0
150
300
450
Jun89
Dec89
Jun90
Dec90
Jun91
Dec91
Jun92
Dec92
Jan89
0Jun89
Dec89
Jun90
Dec90
Jun91
Dec91
Jun92
Dec92
Jan89
50
100
150
Jun89
Dec89
Jun90
Dec90
Jun91
Dec91
Jun92
Dec92
Jan89
Figure 4.1: Group AIntroduction of beat policing: 27 April 1990
Figure 4.2: Group BIntroduction of beat policing: 26 July 1990
Figure 4.3: Group CIntroduction of beat policing: 24 October 1990
Figure 4.4: Group DIntroduction of beat policing: 22 January 1991
Figure 4.5: Group EIntroduction of beat policing: 22 April 1991
Figure 4.6: Group FIntroduction of beat policing: 21 July 1991
Figure 4.7: Group GIntroduction of beat policing: 19 October 1991
Figure 4.8: Group HIntroduction of beat policing: 18 January 1992
Figure 4: Monthly numbers of recorded motor vehicle theft offences,January 1989 to December 1992

5
Patterns of Motor Vehicle Theft
2.3 EXPLAINING THE DOWNWARD TREND:POLICING FACTORS
The substantial drop in the incidence of motor vehicle theft is welcome but also ratherintriguing. A common police view is that the reduction in motor vehicle thefts throughoutNSW is the outcome of new approaches to the prevention of vehicle theft and otherproperty offences. Some commentators, for example, have suggested that motor vehicletheft rates have declined as a result of the Motor Vehicle Theft Forum held in July 1991(shown by the vertical line in Figure 3). That Forum sought to bring together a varietyof interested parties (e.g. vehicle insurers and manufacturers) in order to develop a multi-pronged strategy for preventing vehicle theft. Some have argued that the Forum itselfattracted widespread publicity which alone might have increased the perceived risk ofinvolvement in vehicle theft. Others have suggested that the reduction in vehicle theftcan be attributed to the introduction of beat police. Beat policing involves the replacementof mobile police patrols with regular foot patrols by uniformed officers. Beat policing isconsidered both to increase the level of community co-operation in preventing crimeand to have a greater deterrent effect. A close examination of the data on motor vehicletheft, however, lends little credence to either of these suggestions.
The total number of recorded motor vehicle theft offences for 1992 was almost 33 percent lower than the total for 1989. The rate of decline, however, has been erratic. BetweenJuly 1989 and June 1990 recorded offences dropped by 20 per cent. A further five per centdrop occurred between July 1990 and June 1991, followed by a 27 per cent drop in theensuing 12 months between July 1991 and June 1992. The accelerating rate of decline ofmotor vehicle theft during the financial year 1991-92 could be attributed to the variousrecommendations following the Forum. However, as the downturn in vehicle theft beganwell before the Forum was held, it cannot be said that the Forum was responsible for theinitial downturn.
A comparison of the trends in motor vehicle theft in those patrols in which beat policingwas introduced also provides little reason for believing law enforcement activity isresponsible for the downward trend in motor vehicle thefts. Beat policing was introducedprogressively over a period of time. Hence the date of beat police introduction variesfor different police patrols. The 63 patrols which had introduced beat policing prior toDecember 1992 were divided into eight groups, A to H, according to the date on whichthey implemented beat policing. Collectively, these 63 patrols accounted for 42 per cent ofall recorded motor vehicle theft offences in NSW over the period January 1989 toDecember 1992. Figure 4 shows the trends in recorded motor vehicle theft offences beforeand after the introduction of beat police for each of these eight groups of police patrols.The vertical lines in each of Figures 4.1 to 4.8 show the date of introduction of beat police.
As can be seen from Figure 4, most of the groups of patrols show a general downward trendin motor vehicle theft. In every group, however, the general downturn in motorvehicle theft commenced before the introduction of beat police.
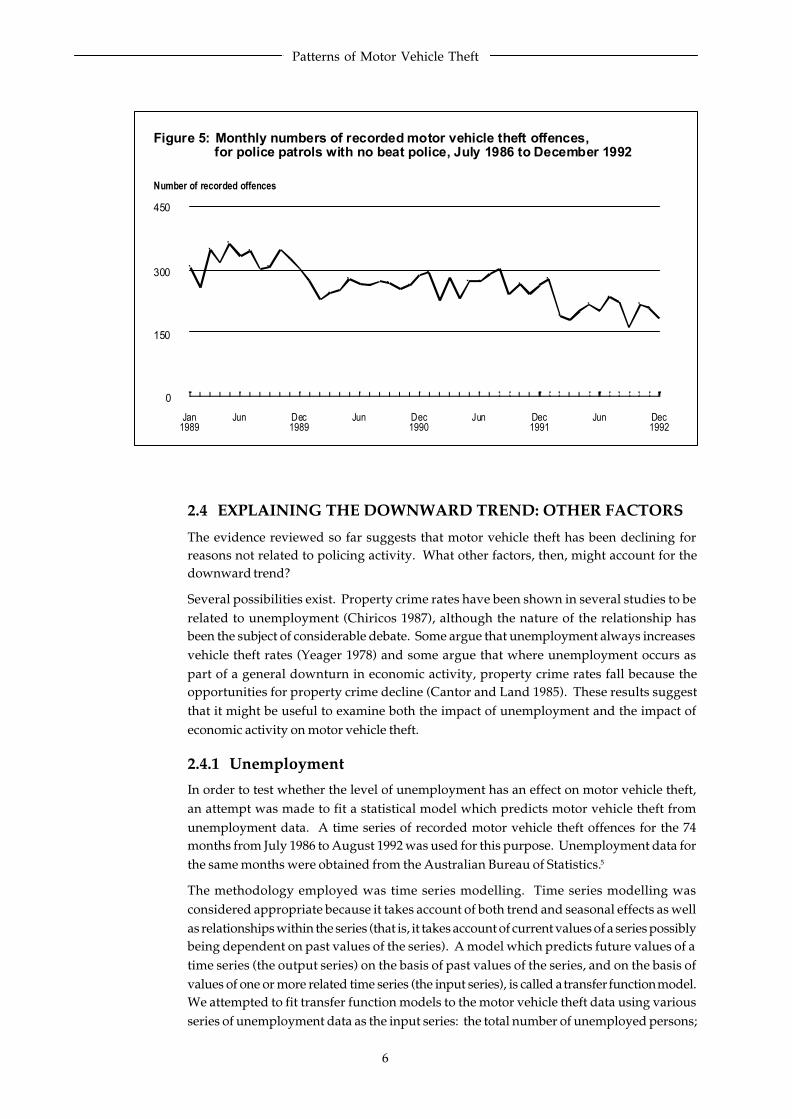
Perhaps more importantly, there is no evidence that the decline in motor vehicle theftwas limited to those patrols in which beat police was introduced. Figure 5 shows thefrequency of motor vehicle theft from January 1989 to December 1992 for those policepatrols which did not have beat police in this period. The figure shows a downwardtrend in motor vehicle theft for this group of patrols throughout the entire period fromJanuary 1989 to December 1992. The total number of recorded motor vehicle theft offencesin the group in 1992 is 35 per cent lower than the total for 1989. It is also noteworthy thatthe figure indicates a downturn for this group of patrols occurring in late 1989, at leasteighteen months prior to the Motor Vehicle Theft Forum.
Patterns of Motor Vehicle Theft
6
0
150
300
450
Jun Dec1989
Jun Dec1990
Jun Dec1991
Jun Dec1992
Jan1989
Number of recorded offences
Figure 5: Monthly numbers of recorded motor vehicle theft offences,for police patrols with no beat police, July 1986 to December 1992
2.4 EXPLAINING THE DOWNWARD TREND: OTHER FACTORS
The evidence reviewed so far suggests that motor vehicle theft has been declining forreasons not related to policing activity. What other factors, then, might account for thedownward trend?
Several possibilities exist. Property crime rates have been shown in several studies to berelated to unemployment (Chiricos 1987), although the nature of the relationship hasbeen the subject of considerable debate. Some argue that unemployment always increasesvehicle theft rates (Yeager 1978) and some argue that where unemployment occurs aspart of a general downturn in economic activity, property crime rates fall because theopportunities for property crime decline (Cantor and Land 1985). These results suggestthat it might be useful to examine both the impact of unemployment and the impact ofeconomic activity on motor vehicle theft.
2.4.1 UnemploymentIn order to test whether the level of unemployment has an effect on motor vehicle theft,an attempt was made to fit a statistical model which predicts motor vehicle theft fromunemployment data. A time series of recorded motor vehicle theft offences for the 74months from July 1986 to August 1992 was used for this purpose. Unemployment data forthe same months were obtained from the Australian Bureau of Statistics.5
The methodology employed was time series modelling. Time series modelling wasconsidered appropriate because it takes account of both trend and seasonal effects as wellas relationships within the series (that is, it takes account of current values of a series possiblybeing dependent on past values of the series). A model which predicts future values of atime series (the output series) on the basis of past values of the series, and on the basis ofvalues of one or more related time series (the input series), is called a transfer function model.We attempted to fit transfer function models to the motor vehicle theft data using variousseries of unemployment data as the input series: the total number of unemployed persons;

7
Patterns of Motor Vehicle Theft
the number of unemployed males; the number of unemployed females; and the number ofunemployed males in specified age groups (15-19, 20-24, 25-34, 35-44, 45-54, 55 and over).
For none of these input series was it possible to fit a transfer function model which fittedthe data well. It was therefore concluded that the decreasing trend in recorded motor vehicletheft offences could not be explained by changes in the level of unemployment.
2.4.2 Other economic factors
Three measures of economic activity were chosen for examination. The measures chosenwere new vehicle registrations, fuel sales and personal consumption. The data for fuelsales were obtained from the Australian Bureau of Agricultural and Resource Economics.The data for new vehicle registrations and personal consumption were obtained fromthe Australian Bureau of Statistics.6 In the case of personal consumption the data couldonly be obtained on a quarterly basis. However, this measure was included becauseresearch in the United Kingdom (Field 1990) found a relationship between motor vehicletheft and consumption. For this time series quarterly motor vehicle theft data were usedfor the period January 1979 to December 1992.
Using the same methodology as was used for the unemployment data an attempt wasmade to fit transfer function models to the motor vehicle theft data using, in turn, each ofthe economic indicator series as an input series. Again, it was not possible to constructmodels which provided a good fit to the data. It was concluded that changes in generaleconomic indicators could not explain the downward trend in motor vehicle theft.

Patterns of Motor Vehicle Theft
8
3. GENERAL CHARACTERISTICS OFMOTOR VEHICLE THEFT IN NSW
The time series analyses presented in the previous section do not give us any insight intothe factors which control the incidence of motor vehicle theft. Another means by which toidentify factors which influence the rate of this offence is to conduct a detailed analysis ofmotor vehicle theft patterns.
Because of the diversity of the offence, it is of interest to consider the different varieties ofvehicle theft. People steal vehicles for many different reasons. Some offenders are involvedin professional or semi-professional theft, which may or may not be organised. This typeof theft involves the theft of vehicles for the acquisition of parts for resale, or the acquisitionof the vehicle itself for re-identification and resale. Some offenders steal vehicles for theacquisition of parts for their own use. Some offenders arrange for vehicles to disappearand fraudulently report them stolen in order to facilitate a claim on their vehicle insurancepolicies. Others are seeking short-term transport or are merely seeking to alleviate boredomor to gain gratification or a temporary sense of prestige. The fact that vehicle theft is sucha diverse offence means that explaining vehicle theft requires an attempt to delineate thedifferent types of theft. Each type of theft is likely to have a more or less unique set offactors which explain its incidence and distribution, and a knowledge of these factors caninform our attempts to understand trends in the offence and to formulate effective crimecontrol strategies.
Unfortunately, it is much easier to describe the reasons why vehicles are stolen than it is tomeasure the number of vehicles stolen for each purpose. McCaghy, Giordano and KniceleyHenson (1977) distinguish between theft for joyriding, theft for short-term and long-termtransportation, theft for profit (which may be amateur theft for parts for personal use orprofessional theft where the aim is to acquire vehicles or parts for resale), and theft for thecommission of another crime. To this list, most commentators add fraudulent theft whichoccurs when an owner causes a vehicle to disappear and reports it stolen in order to obtainan insurance claim (Clarke and Harris 1992).
These distinct categories are based upon the reasons given by offenders for stealing vehicles,on the knowledge acquired by police in the course of investigating motor vehicle theft, oron theoretical consideration of the reasons why vehicles might be stolen. Unfortunately,we cannot gauge the true incidence of each of these different types of vehicle theft becausevehicle thieves are rarely caught, and even when caught do not always disclose their truemotive for stealing a vehicle. In order to make sense of trends in vehicle theft, therefore, wemust adopt a cruder classification scheme which relies on aspects of vehicle theft itself ratherthan on admissions by offenders of their reasons for stealing vehicles.
It is possible to proceed in this manner because whenever a vehicle is reported stolen inNSW information is kept indicating whether the vehicle was recovered, and, if recovered,what damage it had sustained. Whether or not a vehicle is recovered and its condition onrecovery provide a basis from which to infer the reason why the vehicle was stolen. A vehiclerecovered intact is unlikely to have been stolen for the acquisition of parts. Vehicles whichare never recovered or recovered with stripping are likely to have been stolen either forresale of the whole vehicle, or resale at least of those parts which have been removed. It isthe general experience of insurers and police that vehicles fraudulently reported stolen willoften be recovered burnt or dumped in a body of water (i.e. immersed).

9
Patterns of Motor Vehicle Theft
Of course in any particular case, neither the failure to recover a vehicle nor the condition ofa vehicle on recovery provide certain indication of the motivation for its theft or reportedtheft. If, however, in most cases the facts do provide a reasonable basis on which to identifythe motivation for the theft or reported theft it is still possible to describe the characteristicsof vehicles stolen for different general purposes. If most stolen cars recovered with partsmissing have been stolen in order to remove and re-sell the parts, for example, we can gainan understanding of the market for stolen car parts by examining which years, makes andmodels of vehicle are most often recovered with parts missing.
The present report uses information on the fate of vehicles reported stolen in order to describethe characteristics of vehicles stolen for different purposes. The report examines three typesof vehicle theft: fraudulent theft, acquisitive theft and theft for short-term use. The categoryof fraudulent theft is defined as a proportion of insured vehicles recovered burnt andimmersed. Acquisitive theft is defined as comprising those vehicles which remainunrecovered and those which are recovered with various panels, mechanical parts,accessories and other equipment missing. The category of theft for short-term use is definedas comprising all those vehicles recovered with parts intact.
These definitions provide the basic framework for the analysis. In discussing each categoryof theft, however, the report considers the adequacy of the definitions and what implicationsmight flow if they are judged to be incorrect. This is important given the tentative natureof our classification scheme. Any error we make in classifying vehicle thefts will affect ourestimate of the relative contribution made to the overall size of the vehicle theft problemby different groups of offenders. It may also create a distorted impression of thecharacteristics of each type of vehicle theft.
3.1 DATA SOURCES
The primary source of data for this report is the Stolen Vehicle Index (SVI). The SVI ismaintained by the NSW Police Service and contains information on nearly all stolen vehiclesreported to the police in NSW. In country areas some remote police stations do not haveaccess to the SVI. In these areas vehicle theft is recorded on a standard crime incident reportform and is counted as larceny. It is possible that some vehicle thefts in other areas are alsocounted as larcenies. The Bureau estimates that in NSW about 50 vehicle thefts per monthare recorded as larceny. Other cases of vehicle theft which may not be recorded on the SVIinclude incidents where the police arrest persons who are driving a stolen vehicle before ithas been reported as stolen by the owner. In this case the offence will be recorded as theillegal use or theft of the vehicle but it will not be recorded on the SVI. As a result the datafrom the SVI are not directly comparable with the data on the numbers of recorded motorvehicle theft offences published in the Bureau’s New South Wales Recorded Crime Statistics1991 (1992a), which include both those vehicle thefts which are recorded as larcenies andthose cases classified by police as the illegal use of a vehicle.
Data giving details of the insured value of a sample of 100,000 vehicles were supplied bythe NRMA and are used in this report to examine the relationship between insured value,market value and fraudulent theft. Finally, data from the Children’s, Local and HigherCourts in NSW are used to obtain information about persons convicted of vehicle theft.
Unlike many offences, vehicle thefts are particularly well reported. For example, a recentAustralian Bureau of Statistics (ABS) Crime and Safety Survey indicated that 95.5 per centof vehicle thefts in NSW were reported to the police (ABS 1992a).

Patterns of Motor Vehicle Theft
10
In contrast, only 35.5 per cent of assaults or sexual assaults were reported to the police.The high proportion of vehicle thefts reported may be attributable to factors such as thesize of the loss and inconvenience suffered as a result of the incident, the requirement thatthe incident be reported to the police for insurance purposes, the general feeling thatreporting the offence might result in a positive outcome, and the lack of feelings of personalshame or guilt suffered by the victim (Gove, Hughes and Geerken 1985). Since the majorityof vehicle thefts are reported to the police, official statistics on vehicle theft can be used tomeasure the incidence and extent of the offence.
3.2 OVERALL CHARACTERISTICS OF VEHICLE THEFT IN NSW
3.2.1 Types of vehicles stolen in NSW and recovery rates
Table 1 shows the types of vehicle recorded stolen on the SVI in 1991 and whether or notthe vehicle was recovered.7 The SVI recorded 46,694 stolen vehicles in that year, with 83.3per cent being recovered. The majority of stolen vehicles (92.8 per cent) were passengervehicles (sedans, station wagons, hatchbacks, coupes, convertibles and sports cars) or lightcommercial vehicles (utilities, panel vans, and vans). Recovery rates were high for allcategories of vehicle except plant or forklift and motorcycles.
Table 1: Number of vehicles recorded stolen on the SVI, 1991,vehicle type and whether recovered
Vehicle typeNot as a percentage
recovered Recovered Total of all vehicles
Vehicle type No. % No. % No. % %
Passenger vehicles 5,655 14.6 33,182 85.4 38,83 100.0 83.2
Light commercial 845 18.8 3,647 81.2 4,492 100.0 9.6
Truck 225 26.3 630 73.7 855 100.0 1.8
Motorcycle 667 42.3 910 57.7 1,577 100.0 3.4
Bus 32 14.5 188 85.5 220 100.0 0.5
Plant or forklift 53 77.9 15 22.1 68 100.0 0.1
Unknown 308 47.8 337 52.2 645 100.0 1.4
Total 7,785 16.7 38,909 83.3 46,694 100.0 100.0
3.2.2 Age of stolen vehicles
Figure 6 shows the year of manufacture of stolen vehicles recorded on the SVI in 1991.The figure shows that a fairly high proportion of stolen vehicles were around 10 - 12 yearsold. The year of manufacture with the highest frequency in Figure 6 was 1979, with 7.5 percent of all vehicles stolen in 1991 having been manufactured in that year. The mean age ofstolen vehicles was 10.3 years, and the standard deviation 5.4 years.
These data suggest that new vehicles have a much smaller risk of theft than do five to 15year old vehicles. However, the data presented in Figure 6 do not give an accurate pictureof the risk of theft of vehicles manufactured in different years. To obtain such a picture itis necessary to calculate a rate of theft for vehicles of different years of manufacture, that is,

11
Patterns of Motor Vehicle Theft
to calculate the number of vehicles stolen for every thousand registered vehicles of eachyear of manufacture. The results of this calculation are shown in Figure 7, where vehiclesare grouped into age classes consistent with registration data published by the ABS (1992b).
0
1000
2000
3000
4000
65 66 67 68 69 70 71 72 73 74 75 76 77 78 79 80 81 82 83 84 85 86 87 88 89 90 91
Year of manufacture
Number of stolen vehicles
Figure 6: Number of vehicles recorded stolen on the SVI, year of manufacture
0
4000
8000
12000
16000
before 1970 1971–1974 1975–1978 1979–1982 1983–1986 1987–19900
2000
4000
6000
8000
Rate per 100,000Number of stolen vehicles
Year of manufacture
Number of stolen vehicles
Figure 7: Number and rate, per 100,000 registered vehicles,of vehicles recorded stolen on the SVI, 1991, year of manufacture
Rate per 100,000 registered vehicles

Patterns of Motor Vehicle Theft
12
Figure 7 shows that the risk of vehicle theft is indeed greater for old vehicles than fornew vehicles. But whereas vehicles manufactured in the years 1979-1982 representedthe greatest number of thefts, the risk of vehicle theft was highest for vehicles manufacturedin the period 1975-1978, closely followed by vehicles manufactured in 1971-1974. Vehiclesmanufactured in the years 1975-1978 had more than two and a half times the risk of theft ofvehicles manufactured in 1987-1990. The NRMA (1991a) found that a vehicle is most atrisk of theft when it is 10 years old, whereas the SVI data indicate greatest risk when vehiclesare between 13 and 20 years old. Direct comparison of these data is somewhat confoundedby the fact that newer vehicles may be more likely to be insured. As a result the NRMA’sportfolio is likely to be biased in favour of newer vehicles, compared with the population ofall registered vehicles.
Table 2: Number of vehicles recorded stolen on the SVI, 1991,make of vehicle
Number of Make of vehicle vehicles stolen Percentage
Ford 14,443 30.9
Holden 13,828 29.6
Toyota 6,362 13.6
Nissan/Datsun 2,267 4.9Mazda 2,037 4.4
Mitsubishi 1,575 3.4
Honda 1,056 2.3
Chrysler 1,046 2.2
Suzuki 593 1.3
Yamaha 473 1.0
Volkswagen 250 0.5
Subaru 228 0.5
Kawasaki 213 0.5
Mercedes 211 0.5
Daihatsu 200 0.4
BMW 199 0.4
Volvo 170 0.4
Leyland 116 0.2
Porsche 113 0.2
Alfa Romeo 112 0.2
Other 1,007 2.2
Unknown 195 0.4
Total 46,694 100.0

13
Patterns of Motor Vehicle Theft
3.2.3 Make and model of stolen vehicles
The frequency of theft for different makes of vehicles is shown in Table 2 in order of thefrequency with which they are stolen. Only makes with at least 100 vehicles stolen recordedon the SVI in 1991 are shown in Table 2. The makes shown in the table accountedfor 97.4 per cent of stolen vehicles, with Ford, Holden, Toyota, Nissan/Datsun and Mazdaaccounting for 83.4 per cent of stolen vehicles. Sixty per cent of stolen vehicles weremanufactured by Ford and Holden.
Table 3 shows the rate of theft of passenger and light commercial vehicles for those makesin Table 2 for which registration data were available (ABS 1992b). From the table it canbe seen that there is considerable variation in the risk of theft for vehicles made bydifferent manufacturers. In 1991 Fords and Holdens had the highest risk of theft per100,000 registered vehicles, while Daihatsus and Volvos were least at risk. Interestingly,it appears that makes which rank high in terms of numbers of registered vehicles alsotend to rank high in terms of theft risk. The rank correlation (r) between the number ofregistered vehicles and the rate of theft for each manufacturer is 0.60 (p = 0.01). That is,popular makes tend also to be disproportionately popular theft targets.
Table 3: Number and rate, per 100,000 registered vehicles of eachmanufacture, of passenger and light commercial vehiclesrecorded stolen on the SVI, 19918
Number of Rates per 100,000 Manufacturer vehicles stolen registered vehicles
Ford 14,248 2.266.46
Holden 13,527 2,226.27
Mazda 1,971 1,462.99
Chrysler 1,035 1,319.33
Toyota 5,980 1,184.67
Leyland 100 1,091.82
BMW 187 1,003.17
Honda 534 823.93
Mercedes 200 740.58
Nissan/Datsun 2,151 724.10
Volkswagen 230 708.46
Suzuki 226 707.93
Mitsubishi 1,472 648.52
Subaru 226 527.32
Daihatsu 160 464.48
Volvo 161 455.69
It is very likely that as well as variations in risk of theft for particular makes of vehiclethere is also considerable variation in the risk of theft for particular models of vehicle.
When the frequency with which different models are stolen is considered 25.4 per centof vehicle thefts involved only two models - the Ford Falcon and Holden Commodore

Patterns of Motor Vehicle Theft
14
(see Table 4). These data do not, however, tell us anything about the relative risk of theftfor different models. It is highly likely that the Falcon and the Commodore are the twomost common models registered and for this reason alone would be expected to exhibit thegreatest theft frequency. Unfortunately, it was not possible to obtain the numbers ofregistered vehicles of each make - model - year variant in NSW so rates of theft for cars ofdifferent models and years could not be calculated.
Data recently published by the NRMA (1993) indicate that, among insured vehicles, sportscars tended to have the highest theft rates. Notable was the Porsche 911 which was 15 timesmore likely to be stolen or broken into than the average car. Other models with high theftrates include the 1987 Ford Fairmont Ghia, 1982 - 1984 Holden Calais and Falconsmanufactured prior to 1987. While some of these models were stolen in small numbers(Table 2 shows that the SVI recorded thefts of only 113 Porsches of all models in 1991),the cost of thefts of luxury vehicles can be high.
Table 4: Number of vehicles recorded stolen on the SVI, 1991, model ofvehicle, for models where more than 400 or more were stolen
Number of Make/model of vehicle vehicles stolen Percentage
Ford Falcon 6,205 13.3
Holden Commodore 5,673 12.1Toyota Corona 2,236 4.8
Ford Fairmont 1,811 3.9Ford Cortina 1,696 3.6
Toyota Corolla 1,646 3.5Holden Gemini 1,542 3.3
Ford Laser 1,327 2.8Holden Torana 1,109 2.4
Mitsubishi/Chrysler Sigma 974 2.1Holden HQ 953 2.0Holden HZ 824 1.8
Ford Fairlane 746 1.6Ford Escort 689 1.5
Holden HJ 684 1.5Toyota Celica 584 1.3
Holden HX 486 1.0Ford Telstar 468 1.0
Holden Camira 451 1.0Mazda 626 405 0.9
Other 9,540 20.4
Unknown 6,645 14.2
Total 46,694 100.0

15
Patterns of Motor Vehicle Theft
3.2.4 Type of damage sustained by stolen vehicles
The SVI provides information on whether vehicles are recovered, their condition on recovery,and what parts and accessories are missing. As Table 1 indicates, 83.3 per cent of stolenvehicles are recovered. The majority of recovered vehicles are classified as drivable, withthe SVI recording 59.6 per cent of recovered vehicles in drivable condition, 29.1 per centnot drivable, and 11.3 per cent unknown.
Table 5: Number of vehicles recorded stolen on the SVI, 1991,type of damage sustained
Number Percentage Percentageof vehicles of all stolen of recovered
Type of damage stolen vehicles vehicles
No damage 15,770 33.8 40.5
Stripped 1,829 3.9 4.7
Burnt/immersed 4,034 8.6 10.4
Other damage 3,429 7.3 8.8
Damage not recorded 13,847 29.7 35.6
Subtotal recovered 38,909 83.3 100.0
Not recovered 7,785 16.7 na
Total stolen vehicles 46,694 100.0 na
Details concerning the type of damage sustained are presented in Table 5. The categoriesof damage in Table 5 are those which appear on the SVI. A stolen vehicle may sustain morethan one kind of damage but the police classify each case into only one of the categories.Unfortunately, the type of damage sustained is not recorded for 35 per cent of recoveredvehicles. Table 5 shows that 40.5 per cent of recovered vehicles are recorded as recoveredwith no damage. Only small proportions are recorded as stripped or burnt/immersed.
A variety of parts and property may have been removed from recovered vehicles. Table 6shows the proportion of recovered vehicles with various categories of part missing. Themost commonly recorded missing part was sound equipment (22.4% of recovered vehicles),followed by accessories (16.3%), while removal of body panels (6.8%) or engines (1.5%) wasrelatively uncommon. Along with the data indicating whether vehicles are recovered,these data are used to classify vehicles into the categories of acquisitive theft and theft forshort-term use. Details of the specific categorisation used are given in the sections on thesetypes of theft.

Patterns of Motor Vehicle Theft
16
Table 6: Proportions of vehicles recovered with parts missing,vehicles recorded stolen on the SVI, 19919
Percentage of recovered vehicles
Percentage with Percentage with PercentagePart part missing part intact unknown
Accessories 16.3 66.8 16.9
Sound equipment 22.4 61.7 15.9
Personal effects 14.4 65.4 20.2
Mechanical parts 10.5 72.9 16.7
Trim and upholstery 11.0 72.5 16.5Wheels and tyres 10.7 73.9 15.4Body panels 6.8 77.0 16.3
Engine 1.5 97.7 0.8

17
Patterns of Motor Vehicle Theft
4. FRAUDULENT VEHICLE THEFT
4.1 FRAUDULENT THEFT AND AGREED VALUE POLICIESWhile elaborate professional vehicle theft fraud schemes have been described (Turner1987)10, the most common type of fraudulent vehicle theft comes about when a personfalsely reports that his or her vehicle has been stolen in order to make a claim for theloss to his or her insurance company.
An incentive for fraudulent theft exists when the insured value of a vehicle is greaterthan its realizable market value. It has been suggested that the existence of agreed valueinsurance policies in NSW may encourage fraudulent motor vehicle theft. In most States,motor vehicle insurance policies indemnify people for the retail market value of theirvehicle at the time of loss. In NSW, where agreed value policies are the norm, policyholders are indemnified for an amount agreed on at the time of insurance, and, in principle,reviewed each year on renewal of the policy.
According to the insurance companies, agreed value policies offer the consumerprotection against the often rapid depreciation of motor vehicles (NRMA 1991b).Depreciation is a particular problem for new vehicles, which can suffer considerable lossof value in the first few years of ownership. In the event of a total loss, the owner of avehicle bought with borrowed funds and insured with a market value policy can be leftowing money on a vehicle they no longer own. An agreed value policy would allow thedebt remaining on a written-off vehicle to be paid in full, since the owner of a new caris paid an amount similar to the purchase price of the vehicle (Insurance Council ofAustralia 1991; NRMA 1991b). In addition, it has been argued that agreed value policiesremove the potential for arguments over the retail market value of vehicles in the eventof a total loss, and also allow insurers to set premiums more fairly, since insurers arebetter able to predict the payout for total loss claims (NRMA 1991b).
Agreed value policies, then, are partly justified on the basis that they protect policyholders against the decline in the market value of their vehicles due to depreciation.To the extent that this is the case, however, one result of agreed value policies is that theinsured value of vehicles may be somewhat greater than the retail market value of thevehicle. This situation may provide an incentive for policy holders to dispose of theirvehicle and fraudulently claim for the theft of the vehicle. While recognizing that agreedinsured values may be greater than retail market values, insurance companies arguethat in most cases the discrepancy between retail market value and agreed value is small,less than 10 per cent, or $800 in the case of the NRMA (1991b). Given that someonemaking a claim for the total loss of a vehicle faces the payment of an excess, at least $300according to the NRMA (1991b) and loss of no claim bonuses, the insurance industryargues that the small difference between the insured and the retail market value does notprovide an incentive for fraud.
This defence of agreed value policies depends on their being updated each year to reflectdepreciation in the retail market value of vehicles as they age. If this happens,the maximum discrepancy between agreed values and retail market values will be one year’sdepreciation, and this will occur only towards the end of the yearly insurance contract.There is some reason for doubting that agreed values are always adjusted down eachyear. Indeed, it is not unknown for agreed values of ageing vehicles to be increasedover the term of the policy (General Insurance Claims Tribunal 1992). There is an obviouscommercial incentive for this practice, since it can serve to maximize premium income.

Patterns of Motor Vehicle Theft
18
At issue, then, is whether agreed value policies do provide an incentive for persons toperpetrate fraudulent thefts. According to the insurance industry, agreed value policiesare determined according to values printed in Glass's Guide, a monthly industry surveyof used car values (Insurance Council of Australia 1991; NRMA 1991b). Glass's Guide iscompiled by examining prices of vehicles from a number of sources, including dealers,auctions and advertisements. According to the NRMA (1991b), Glass's Guide provides themost accurate and impartial reference from which agreed values can be calculated.
This report evaluates two aspects of agreed value policies. First we examine the claim thatagreed values of insured vehicles are close to the retail market values of vehicles. Second,we examine whether agreed insured values are an accurate guide to the realizable marketvalue of vehicles to the owner.
Data on a sample of 100,000 insured sedans, coupes, hatchbacks and station wagons wereprovided by the NRMA. The data set contains information on the insured values of vehicles,together with details of year, model, and equipment level. The data were extracted fromthe NRMA s portfolio of insured vehicles in September 1992.11 These data allow very finedistinctions between different models and variants of the same model to be made.From this data set, models with at least 100 vehicles in any year, model and equipmentlevel class were selected for analysis. There were 163 separate variants thus selected,accounting for 34,973 vehicles, or 35 per cent of the sample. The retail market value of eachvariant was determined from Glass's Guide for July 1992. The insured value for eachindividual vehicle in the sub-sample of 34,973 was then compared with the published retailmarket value. The results of the comparison are shown in Table 7.
Table 7: Frequency distribution of difference between insured value (NRMASeptember 1992) and retail market value (Glass’s Guide July 1992)
CumulativeDifference between insured Number Percentage percentagevalue and retail market value ($)* of vehicles of vehicles of vehicles
less than –2,501 1099 3.1 3.1
–2,001 to –2,500 615 1.8 4.9–1,501 to –2,000 1,195 3.4 8.3
–1,001 to –1,500 1,513 4.3 12.6
–501 to –1,000 2,303 6.6 19.2
–1 to –500 4,823 13.8 33.0
0 to 499 14,748 42.2 75.2
500 to 999 4,850 13.9 89.1
1,000 to 1,499 2,745 7.8 96.9
1,500 to 1,999 471 1.3 98.3
2,000 to 2,499 327 0.9 99.2
2,500 or more 284 0.8 100.0
* Positive values indicate that insured values are greater than retail market values.

19
Patterns of Motor Vehicle Theft
From Table 7 it can be seen that there is a fairly wide range of insured values, both aboveand below the retail market value. It appears, therefore, that agreed values are notsystematically greater than retail book values. The majority (76.4%) of vehicles had agreedvalues which were within $1,000 of the Glass’s Guide retail value. It is of interest that inthe present sample, some 10.9 per cent of vehicles had insured values that were morethan $999 greater than the published retail market value for that model/year/equipmentlevel variant. It also appears that relatively large numbers of vehicles are insured forconsiderably less than the nominal retail market value. This situation probably comesabout when a vehicle is purchased for less than the nominal retail value because it is inless than average condition. In such cases it is likely that the agreed value reflects thepurchase price rather than the retail market value for that type of vehicle.
In spite of the evidence in Table 7 that most insured vehicles are insured for agreed valuesclose to the retail value quoted in Glass's Guide, it is arguable that many vehicles may stillhave insured values of such a magnitude as to provide a significant incentive for fraudulentactivity. The retail value quoted in Glass's Guide is the average retail price achieved bydealers for a vehicle which has been cleaned, repaired, carries six months registration andhas been otherwise prepared for sale. In other words Glass's retail value includes the retailprofit margin to the dealer. Glass's Guide also quotes the trade value or ‘on the lot’ valueof a vehicle prepared for sale by a dealer excluding the profit margin. The trade value isstill likely to be higher than the realizable market value of a vehicle because it reflects thecost of work done by the dealer to prepare a car for sale. The trade value is, however,likely to be closer to the market value achievable by a person attempting to sell their carthan the dealers retail value.
Interestingly, some 83.4 per cent of vehicles had insured values that were more than $999greater than their published trade value. More than one-third of vehicles had insured valuesmore than $1,999 greater than their trade value.
Given the disparity between the realizable market value and the published retail value,there may well be an incentive for fraud, even for vehicles insured with market value policies,if the market value is based on the published retail value.
In summary, there is an incentive for fraud whenever the insured value of a vehicle issubstantially greater than its realizable market value. This situation may occur, first, for arelatively new vehicle, insured with an agreed value policy, which might suffer rapiddepreciation between the time it is insured and renewal of the policy. Second, some insuredvehicles may not have their agreed value adjusted downwards in accord with a decline inthe published retail market value of the vehicle. Third, as pointed out by the NRMA (1991b),some vehicles may be below average condition to the extent that they require expensiverepairs. As a result their realizable market value will be much lower than their retailbook value. In these cases it makes no difference whether the vehicle is covered by eitheran agreed value or a market value insurance policy.
Showing that there is a systematic incentive for fraudulent reporting of vehicle theft doesnot imply that abolishing agreed value insurance policies would have a marked effecton recorded rates of vehicle theft. It might, however, have a more substantial impact onthe cost of vehicle theft, since the insurance companies, and ultimately the community,must bear the cost of claims involving the total loss of vehicles. The analysis in the nextsection indicates that, despite the incentives, fraudulent theft is most likely to be a small,albeit costly, component of the overall vehicle theft problem.

Patterns of Motor Vehicle Theft
20
4.2 ESTIMATING THE EXTENT OFFRAUDULENT VEHICLE THEFT
According to the police (NSW Police Service n. d.) and the NRMA (1991a, 1991b), mostfraudulent thefts involve vehicles which are either recovered burnt or immersed in water,or are not recovered at all. If fraudulent vehicle thefts make up a significant proportionof all thefts, and if indeed the fate of a majority of fraudulent thefts is fire or immersion,then, compared with uninsured vehicles, one would expect a higher proportion of insuredvehicles to be recovered burnt or immersed. This expectation is confirmed by data shownin Table 8 indicating the condition of stolen vehicles according to whether or not they wereinsured.
Table 8: Number of vehicles recorded stolen on the SVI, 1991,condition of vehicle and whether vehicle insured
Number of vehicles stolen
Not insured Insured
Condition of vehicle Number Percentage Number Percentage
Recovered:No damage 7,594 36.6 8,176 31.5Stripped 619 3.0 1,210 4.7Burnt/immersed 957 4.6 3,077 11.9
Other damage 1,529 7.4 1,900 7.3Condition not recorded 6,976 33.6 6,871 26.5
Not recovered 3,075 14.8 4,710 18.2
Total 20,750 100.0 25,944 100.0
Table 8 shows that only 4.6 per cent of uninsured vehicles were recovered burnt or immersedin water. In contrast, 11.9 per cent of insured vehicles were recovered in this condition.Insured vehicles were burnt or immersed at more than 2.5 times the rate of uninsuredvehicles. Compared with uninsured vehicles, insured vehicles were also more likely to bestripped, or to remain unrecovered, but these differences were relatively small. It is difficultto think of an explanation for the high rate of burning or immersion of insured vehiclesother than fraudulent claims. Certainly, a car stolen in a genuine theft may be torched orabandoned in a body of water, perhaps by recreational users intent on providing a climaxto their illegal adventure, or perhaps by strippers who aim to conceal any evidence, such asfingerprints. However, given that a genuine thief will not generally be aware whether ornot a vehicle is insured, it is unlikely that the higher risk of fire or immersion of insuredvehicles can be explained in terms of the normal activities of genuine vehicle thieves.
If the increased risk of burning or immersion for insured vehicles compared with uninsuredvehicles is due to insurance fraud, the data in Table 8 provide the basis for an estimate ofthe extent of fraudulent vehicle theft in 1991. The method used relies on the assumptionthat if there were no fraudulent theft in 1991, then it would be expected that the proportionof insured vehicles burnt or immersed would be equal to the proportion of uninsured vehiclesburnt or immersed. Hence, an estimate of the number of fraudulently stolen vehicles,

21
Patterns of Motor Vehicle Theft
N say, is obtained by assuming that if this number, N, were subtracted from the number ofinsured vehicles stolen (both those burnt or immersed and the total), then the proportion ofinsured vehicles recovered burnt or immersed would be equal to that for uninsured vehicles.
An estimate of the number of fraudulently stolen vehicles (N) is therefore given by solvingthe following equation:
(α - N) / (β - N) = γ (1)
where: α = Number of insured vehicles recovered burnt or immersed
β = Total number of insured vehicles stolen
γ = Proportion of uninsured vehicles recovered burnt or immersed.
The solution is given by:
N = (α - γβ) / (1 - γ) (2)
Substituting values from Table 8 in (2):
N = (3,077 0.0461 x 25,944) / (1 0.0461)
Solving this gives N = 1,971, or 4.2 per cent of recorded stolen vehicles. This estimate is aminimum estimate of the extent of fraudulent theft because some vehicles fraudulently stolenmay have fates other than burning or immersion. As discussed previously, insured vehicleswere also more likely to be recovered stripped, or to not be recovered than were uninsuredvehicles. On the assumption that the increased risk of these outcomes for insured vehicleswas due to fraud, the estimation procedure outlined above was repeated for burnt orimmersed, stripped and unrecovered vehicles. This resulted in an upper estimate of fraudof 4,101 vehicles, or 8.8 per cent of stolen vehicles.
One potential source of error in these estimates is mis-specification of insured and uninsuredvehicles. On the SVI it can only be determined whether or not a vehicle is insured if thename of an insurance company is recorded. It is possible that some vehicles which wereinsured did not have this information recorded, so that a number of insured vehicles whichwere burnt or immersed were coded as uninsured. This seems likely given that the NRMA(1990) estimates that about 65 per cent of vehicles in NSW have comprehensive insurance,or other insurance indemnifying against theft,12 while on the SVI only 55 per cent of vehicleshad an insurance company recorded. As a consequence, the estimate of fraudulently stolenvehicles may be an underestimate. However, since older vehicles are more likely to be stolenand therefore to appear on the SVI, and may also be less likely to be insured than newervehicles, the extent of the under-counting of insured vehicles on the SVI is difficult toestimate.
In order to set an upper limit for the size of the fraudulent vehicle theft problem, the datawere re-analyzed to take into account the possible effect of mis-specification of insuredvehicles as uninsured on the SVI. To produce a maximum estimate of fraudulent theft,it was assumed that the proportion of insured vehicles recorded on the SVI should be equalto the population estimate provided by the NRMA (1990). Under this assumption,4,407 vehicles of the uninsured vehicles were re-assigned as insured vehicles. Then,the procedure used above to estimate the size of fraudulent theft was carried out.This resulted in a maximum estimate of 5,845 fraudulently stolen vehicles, or 12.5 percent of vehicle theft.13
Fraudulent theft, then, is estimated to account for between 4.2 per cent and 12.5 per cent ofstolen vehicles. These figures represent the probable lower and upper bounds of the problem,with the true figure likely to be somewhere in the middle of the range.

Patterns of Motor Vehicle Theft
22
The upper and lower limits of fraudulent vehicle theft estimated in this report are somewhatnarrower than recently published estimates, according to which, fraud accounts for between2 and 15 per cent of stolen vehicles. According to the NRMA, fraudulent vehicle theftaccounted for 2.0 per cent of theft claims in 1989 (NRMA 1990) and 3.2 per cent of theftclaims in 1991 (NRMA 1993). These proportions, however, are of insured vehicles, not allstolen vehicles. In contrast, the lower estimate of theft determined in this report is 4.2 percent of all stolen vehicles (7.6 % of insured vehicles). The NRMA’s estimates seem tounderestimate the size of the fraud problem by a significant margin compared with theestimates in this report. At the other end of the scale, the NSW Police Service (n. d.) hassuggested that up to 15 per cent of stolen vehicles may be fraudulent thefts. The results ofthe analysis in this section suggest that this figure may overestimate the size of the fraudulenttheft problem.
4.3 AGE OF VEHICLES RECOVERED BURNT OR IMMERSED
In the previous section it was estimated that between 4.2 and 12.5 per cent of stolen vehiclesare fraudulent thefts. The method used to estimate the numbers does not tell us which ofthe vehicles recovered burnt or immersed were fraudulently stolen. The method usedassumed that the excessive number of insured vehicles recovered burnt or immersed,relative to uninsured vehicles, were fraudulently stolen. In this section, we examine theages of all insured burnt or immersed vehicles to see whether cases of fraudulent theft tendto involve vehicles of a certain age.
65 66 67 68 69 70 71 72 73 74 75 76 77 78 79 80 81 82 83 84 85 86 87 88 89 90 91
0
20
15
10
5
Year of manufacture
Percentage
Figure 8: Insured vehicles recovered burnt or immersed as a proportion of all stolenvehicles of the specified year of manufacture, SVI, 1991

23
Patterns of Motor Vehicle Theft
In section 3.2.2 it was shown that the mean age of all stolen vehicles was 10.3 years, with astandard deviation of 5.4 years. Insured vehicles recovered burnt or immersed were,on average, a little newer than this, with an average age of 8.9 years and a standard deviationof 4.1 years. Overall insured vehicles recovered burnt or immersed account for a smallproportion of all vehicle thefts. However, as can be seen from Figure 8, vehicles aged around7 to 9 years old appear to be more likely to be recovered in this condition than stolen vehiclesof other ages, with the highest proportion of potential frauds being recorded among vehiclesmanufactured between 1982 and 1984. It is possible that these vehicles are the ones whichmay be most likely to be insured for more than their realizable market value.

Patterns of Motor Vehicle Theft
24
5. ACQUISITIVE VEHICLE THEFT
5.1 DEFINING ACQUISITIVE VEHICLE THEFTThis section examines acquisitive theft defined as those vehicles which remainunrecovered, or which are recovered with damage due to the removal of parts. It is assumedthat the fate of those vehicles which remain unrecovered is either re-identification andresale or dismantling for parts. Vehicles which are recovered with parts missing are assumedto have been stolen in order to acquire parts for sale or for personal use. What both typesof vehicle theft have in common is that the motivation for the theft is financial gain -either directly through the sale of vehicle and parts, or indirectly because the theft of partsenables the thief to avoid having to buy parts.
Acquisitive theft may involve thieves who are very well organized and who gainsignificant income from their activities, thieves who carry out acquisitive vehicle theftson a part-time basis and who gain varying degrees of financial benefit, and more or lessamateur thieves who might steal a vehicle to obtain parts for their own use.
One estimate of the size of the professional theft problem is provided by the NRMA.The NRMA (1993) defines as professional theft those cases where the vehicle remainsunrecovered or where recent models are recovered with significant degrees of stripping.In this classification, then, professional theft is delineated by the seriousness of the lossinvolved. On the basis of this classification the NRMA (1993) estimated that professionaltheft accounted for 29 per cent of theft in 1991. The NRMA note, however, that whileprofessional theft is not as common as theft for short-term use or petty theft, it representsa much greater cost to the community. They estimate that professional theft accountedfor 47 per cent of the cost of theft in 1991.
It is possible, however, that the classification used by the NRMA is misleading. Someprofessional thieves may make a living from fairly regular thefts of, say, soundequipment, while a person removing major parts like panels or engine from a recentmodel may not intend to sell such parts at all. According to the NRMA, the first casewould be classified as petty theft and the second case as professional theft. Given theseproblems with any such classification, we do not attempt to divide acquisitive theftinto professional and petty components in this report.
5.2 MEASURING THE EXTENT OF ACQUISITIVE THEFTThe data from the SVI concerning whether or not vehicles were recovered (see Table 5),along with data on whether vehicle parts were missing, form the basis for the estimationof the proportion of vehicle thefts which are acquisitive. Table 9 shows the number ofvehicles not recovered or recovered with parts missing compared with those recoveredwith parts intact or for which information on parts was unknown.14 The combination ofvehicles not recovered and those recovered with parts missing represents acquisitivetheft. Note that insured vehicles which were recovered burnt or immersed were excludedfrom this analysis.

25
Patterns of Motor Vehicle Theft
Table 9 shows that a total of 42.2 per cent of stolen vehicles can be classified as acquisitivethefts. This estimate is somewhat less than the NRMA’s estimates of acquisitive theft as63.0 per cent in 1990 (NRMA 1991a) or 70.6 per cent in 1992 (NRMA 1993). The NRMAestimates are, however, calculated as a percentage of insured vehicles rather than all stolenvehicles.
Table 9: Number of vehicles recorded stolen on the SVI, 1991, type of theft
Number ofType of theft vehicles stolen Percentage
Not recovered 7,785 17.8
Recovered with parts missing 10,622 24.4
Sub total, acquisitive theft 18,407 42.2
Recovered with parts intact 25,061 57.5
Unknown 149 0.3
Total 43,617 100.0
Note: excludes 3,077 insured vehicles which were recovered burnt or immersed
5.3 AGE OF VEHICLES STOLEN FOR ACQUISITIVE PURPOSES
The mean age of vehicles stolen for acquisitive theft was 10.1 years with a standarddeviation of 5.3 years. This compares with an overall mean age of stolen vehicles of 10.3years with a standard deviation of 5.7 years.
The profitability of professional theft, and the incentive to steal parts for personal use,are dependent on the market for vehicles and the market for spare parts. It is likely thatthe market forces which influence the theft of vehicles for re-identification and resalecreate a demand for different types of vehicles than does the market for spare parts.It has often been argued, for example, that demand for spare parts is greatest for oldervehicles because spare parts may not be available from manufacturers for older models.Without further evidence, the finding that 10 to 20 year old vehicles have the greatestrisk of theft (see Figure 7) would tend to support this theory.
On the other hand, it is obvious that, for thieves contemplating the theft of vehicles forre-identification and resale, newer vehicles are more attractive than older ones. This isbecause newer vehicles offer higher resale value and a more ready market, and, therefore,a greater return for the risk and costs involved in this kind of activity.
The extent of the risks and costs of theft for re-identification and resale are made clearwhen one considers one of the methods used by professional thieves to carry out thiskind of vehicle theft. The thieves or their associates purchase a wreck from an auctionof written-off vehicles. In these auctions insurance companies sell vehicles which havesuffered damage such that repair is uneconomic, though the vehicles may still beclassified as repairable. Vehicles that are classified as repairable are sold in NSW withcompliance plates and other identifying features intact. Having secured a suitablewritten-off vehicle, the thieves steal a similar vehicle, exchange its identifying features, such as the compliance plates, with those from the wreck, and then sell the stolen vehicle

Patterns of Motor Vehicle Theft
26
65 66 67 68 69 70 71 72 73 74 75 76 77 78 79 80 81 82 83 84 85 86 87 88 89 90 910
20
40
60
not recovered recovered with parts missing total acquisitive theft
Year of manufacture
Percentage
Figure 9: Categories of acquisitive theft as proportions of all stolen vehiclesof the specified year of manufacture, SVI, 1991
with its new identity (NSW Motor Vehicle Theft Steering Committee 1992). The value of avehicle thus sold must therefore be such as to justify the expense of the purchase of a suitablewreck, the work done to exchange identities, the cost of workshop facilities, the costs oftransport interstate, if this is done, and the costs of re-registration. These factors wouldappear to limit the selection of vehicles for this activity to desirable new vehicles forwhich values are high and there is a ready market.
The numbers of acquisitive thefts, where the vehicle is not recovered, and the numbersrecovered with parts missing, are shown as proportions of stolen vehicles of each yearof manufacture in Figure 9. Over the range of years of manufacture from 1965 to 1991there is a statistically significant increasing trend in the proportion of vehiclesrecovered with parts missing (Kendall’s τ = 0.39, p < 0.01). The trend is significant despitethe fact that the proportion decreases for vehicles manufactured after 1987. The upwardtrend is also apparent in the trend for total acquisitive theft. The observed trend isinconsistent with the hypothesis that theft for parts is causing the high rates of theft observedfor vehicles 10 to 20 years old. Vehicles manufactured in 1983 to 1987 are the most likely tobe recovered with parts missing.
There is no upward or downward trend in the proportion of thefts which remain unrecovered(Kendall’s τ = 0.19, p > 0.05). Unrecovered thefts make up a relatively high proportion ofthefts of new vehicles (about 20% of thefts of vehicles manufactured in 1990), vehiclesmanufactured between 1982 and 1985 (20.2 - 21.1% of thefts of vehicles manufactured inthese years), and of older vehicles. This pattern may be because unrecovered thefts of newervehicles tend to be the result of thefts for re-identification and resale, while unrecoveredthefts of old vehicles tend to be the result of thefts for dismantling.

27
Patterns of Motor Vehicle Theft
It may be that the economic forces driving the theft of vehicles for body panels and otherparts are more subtle and complex than might be first supposed. It is possible that demandfor cheap spare parts and panels for older vehicles is largely satisfied by the large numbersof older vehicles which find their way to wreckers’ yards through natural attrition.Faced with relatively expensive new parts and panels for newer vehicles, and greatershortages of such parts and panels in wreckers’ yards, the market may indeed turn to stolenvehicles as an alternative source of these components. A significant proportion of vehicleswhich are never recovered may also be stolen primarily for parts and panels. This may bean explanation for the tendency of newer vehicles to remain unrecovered. Another factorwhich may influence the tendency of newer vehicles to remain unrecovered is the possibilitythat such vehicles are more attractive for criminals intent on resale of stolen vehicles afterthey are provided with new identities.
The results presented here are not conclusive. Similarly, one American study whichexamined whether demand for parts, cost for parts, or parts interchangeability were relatedto theft rates was unable to find convincing evidence for any such relationships (Harris andClarke 1991). More detailed research is necessary before the size and nature of theprofessional and semi-professional sectors of vehicle theft can be adequately described.

Patterns of Motor Vehicle Theft
28
6. THEFT OF VEHICLES FOR SHORT-TERM USE
The final type of vehicle theft to be examined here is theft for short-term use. This typeof theft includes recreational use, or joyriding, theft for transport and theft for thecommission of another crime, and is distinguished from acquisitive theft by the vehiclebeing recovered with parts intact.15 Joyriding is theft where the primary intention of thethief is simply fun or diversion. Where the motive of the theft is short-term transport,the circumstances of the theft are similar to joyriding but the primary intention is directtransport from one location to another (McCaghy et al. 1977). At times the journey maybe a longer one, with the thief driving long distances (McCaghy et al. 1977), sometimesabandoning the vehicle when it is short of fuel and stealing another to resume the journey(Lay 1987). The final type of vehicle theft categorized as short-term use is the theft of avehicle to be used in the commission of another crime. The kinds of offences involvedinclude robberies, burglaries and other larcenies, rapes and abductions. In these offencesthe requirements of anonymity and mobility are well served by the use of a stolen vehicle(McCaghy et al. 1977).
6.1 ESTIMATE OF THE SIZE OF THE SHORT-TERMUSE COMPONENT OF VEHICLE THEFT
According to the classification adopted in this report, short-term use accounted for 57.5per cent of stolen vehicles.16 That is, 57.5 per cent of vehicles were recovered with partsintact (see Table 9). This estimate of the size of theft for short-term use is somewhatgreater than estimates made by both the police and the NRMA. According to the NSWPolice Service (n. d.), 40 per cent of vehicles are recovered intact and were stolen fortransport or recreational use, while the NRMA (1991a) estimated that 34 per cent ofvehicle theft claims in 1990 were attributable to theft for transport or recreational use.Since intact vehicles tend to be recovered a relatively short time after the theft, and ahigh proportion sustain no serious damage, it is probable that the NRMA s estimate islower than the one presented here because claims may not be made for intact vehicles,or may be withdrawn on recovery. The relatively low estimate of the percentage of intactrecoveries by the NSW Police Service may result from the high percentage of vehicleson the SVI for which condition on recovery was unknown.17
6.2 THEFT FROM TRANSPORT TERMINI
It is difficult to estimate the proportion of intact stolen vehicles used for transport asopposed to recreational use. However, if transport is an important motivation for theft, it would be expected that thefts from around transport termini would be relativelycommon. Indeed, railway station car parks have been identified as key locations fortheft of vehicles for transport (NRMA 1991b). It has been suggested that some personswill use trains to travel to outlying stations late at night and then will steal a vehicle tocomplete their journey when faced with lack of public transport from train stations tosurrounding suburbs. This type of vehicle theft is argued to be a response to pooravailability of transport, particularly at certain times when public transport is not operating,or operates infrequently.

29
Patterns of Motor Vehicle Theft
If railway station car parks are indeed important locations for vehicle theft for transport,it may be argued that vehicles stolen from these car parks should be more likely to berecovered intact than vehicles stolen from other places. It appears, however, that vehiclesstolen from railway stations are not appreciably more likely to be recovered intact. Table10 shows the proportion of vehicles recovered intact for each of the locations coded on theSVI. The proportion of vehicles recovered intact was relatively constant across locations.
One problem with these data, however, is that the location categories are not preciseenough to discriminate between transport termini and other locations. Only 2.5 per centof vehicles were stolen from railway stations. A large proportion of thefts (41%) involvedthe theft of a vehicle from a street. Many of these street locations may be in close proximityto a railway station, and potential thieves may be as likely to steal carsfor transport in the general area of a railway station as they are to steal a vehicle fromthe railway station car park itself. More importantly, however, persons who are inclinedto use stolen vehicles for transport may also tend to avoid a rail journey altogether andsimply steal a car from any convenient location.
Table 10: Percentage of stolen vehicles recovered intact, SVI, 1991,place vehicle stolen from
Percentage ofPlace vehicle stolen from Vehicles recovered intact
Street 58.7
Car park 55.1
Private property 58.1
Shopping centre 54.4
Council car park 56.6
Other area 57.3
Club / hotel 52.7
Railway 58.1
Not recorded 57.4
All places 57.5
Many vehicles stolen for temporary use are recovered in the same general area fromwhich they were stolen. Of all recovered vehicles which were recovered intact, 34.2 percent were stolen and recovered in the same postcode and 50.0 per cent were stolen andrecovered in the same Local Government Area. This tendency for fairly high proportionsof recovered vehicles to be recovered in the same area that they were stolen from isconsistent with vehicles tending to be used for relatively short-haul transport. It is alsoconsistent with recreational users stealing vehicles from a convenient location, perhapsnot far from where they live, and eventually abandoning them in the same locality.With the present data it is not possible to distinguish between vehicles stolen for recreationaluse as opposed to transport.

Patterns of Motor Vehicle Theft
30
7. WHO ARE THE THIEVES?
Motor vehicles are objects richly endowed with symbolism in western culture.They also generate millions of dollars across many different sectors of the economy.For some persons there are considerable financial or personal gains to be had throughvehicle theft. Nonetheless, very different sets of factors are likely to influence differentoffenders.
A good example of the diversity of explanatory factors which have been canvassed arethose which have been suggested to explain recreational short-term use of vehicles byyoung people. According to McCaghy et al. (1977) these include amusement, problemsof adolescence, to achieve status and recognition, to prove masculinity, and oraldeprivation! Undoubtedly, this is by no means a complete or mutually exclusive list.It is likely that many offenders are motivated by more than one of these fac tors.Many traditional social and psychological explanations of offending rely on assumptionsabout social or psychological defects in the backgrounds of offenders. Unemployment,for example, is argued to provide an economic incentive for crime, and to loosen bondswhich tie persons to society and help prevent them offending (e.g. Thompson, Sviridoffand McElroy 1981).
Katz (1988), by contrast, has argued that there are inherently exciting aspects ofcriminality which make it a sensually compelling activity. According to Katz, the motivationfor adolescent criminality is often not gain, but rather the thrilling, emotional experienceswhich deviance itself provides.
0
200
400
600
11 16 21 26 31 36 41 46 51
Age of offender
Number of persons
Figure 10: Frequency distribution of age of persons found guilty of motor vehicletheft as their principal offence, Children’s, Local and Higher Courts, 199120

31
Patterns of Motor Vehicle Theft
Indeed, it has been argued that much crime is the result of the reinforcing properties ofsensory stimulation which are greatest during the late teens (Baldwin 1985). Baldwin (1985,p. 28) suggests that because of this fact ‘teenagers should find it especially exciting to plan,talk about, and commit adventurous, deviant activities and boast about their thrills’.Theories like those of Baldwin and Katz, which do not accommodate social backgroundfactors such as unemployment or poverty, fly in the face of a large body of evidence for theexistence of relationships between such factors and offending (McCarthy and Hagan 1992;Braithwaite 1991; Devery 1991). However, theories such as those of Katz and Baldwin doappear to offer a compelling account of the socio-psychological dynamics of theft of vehiclesfor recreational short-term use, transport and petty theft. As Clarke and Harris (1992,p. 22) commented the ‘excitement of theft and the status gained among peers must not bediscounted as powerful sources of reinforcement of joyriding’. Despite the fact that Katzand Baldwin set their theories in competition to theories stressing the influence of economicor background factors, it is certainly possible that socially and economically marginalizedyouths are particularly vulnerable to the excitement or status offered by illegal activity, asituation which is compatible with both kinds of theory.
Unfortunately, although vehicle theft is well reported, it has a very small clear up rate.This means that a large proportion of vehicle thieves go unarrested. Police statisticsindicate that in 1990 only 5.2 per cent of vehicle thefts were cleared.18 While arrest orconviction records can give us valuable information about offenders who have beenarrested for vehicle theft, it is possible that offenders who have been arrested are notrepresentative of offenders as a whole. This means that we must be wary aboutgeneralizing from what we know about the population of arrested vehicle offenders tothose offenders who remain at liberty. This lack of information regarding motor vehicletheft in official statistics is compounded by the fact that there have been few ethnographicor self report studies of vehicle theft offenders.
The data that we do have from court records in NSW (NSW Bureau of Crime Statisticsand Research 1992b; Office of Juvenile Justice, unpublished statistics) indicate thatvehicle theft is predominantly a crime committed by young males. Of all offendersconvicted of vehicle theft or illegal use of a vehicle in the Local and Children’s Courts in1991, over 91 per cent were male. The concentration of such offenders in court statistics,combined with the predominance of thefts for temporary use described in this report,suggests that the kinds of explanations of offending offered by Katz and Baldwin may beparticularly relevant for vehicle theft.
As Figure 10 shows, convictions for vehicle theft peak at age 16 and tail off rapidly afterage 19. According to Blackmore (1987), young people who appear before the Children’sCourts charged with this offence are rarely involved in incidents connected with theftfor gain. It is possible that older, professional or semi-professional car thieves,whose activities are concerned with theft for gain, are rarely arrested.
In spite of this possibility, however, similar age distributions are commonly observed foroffenders who commit a wide range of crimes in a range of countries (Hirschi andGottfredson 1983; Britt 1992).19 On this basis it would be expected that offenders involvedin vehicle theft for gain are also likely to be aged less than 25 years.
Webb and Laycock (1992) have suggested that initially youngsters may be attracted to vehicletheft for the thrill and peer group status, but may increasingly be motivated by financialrewards as they become more experienced in the stealing of vehicles and disposing of stolenproperty. One British study quoted by Webb and Laycock indicates that 66.5 per cent of asample of vehicle thieves had first taken and driven a vehicle by the age of 14 years.

Patterns of Motor Vehicle Theft
32
It is often assumed that recreational vehicle thieves act on the spur of the moment,or in the terms of Challinger (1987) are opportunity takers rather than opportunity makers.Interestingly, in the British study quoted by Webb and Laycock (1992), 79 per cent ofjoyriders indicated that they planned to go out and steal a vehicle for recreational use.Other studies mentioned by Webb and Laycock also found a high degree of premeditationamong vehicle thieves.
Nee (1993) reports that vehicle thieves can be very prolific offenders. It was estimatedthat the 100 vehicle thieves interviewed in England and Wales had stolen around 7,000vehicles, and that about half the offenders claimed to be specialists whose criminal activitywas more or less confined to vehicle thefts. The offenders who claimed to be specialistswere characterized by a passion for cars from an early age along with an early desire tohave car-related jobs, earlier illegal driving, higher rates of offending, and a longerexperience of car crime (Nee 1993).

33
Patterns of Motor Vehicle Theft
8. PREVENTION OF VEHICLE THEFT
Over the years there have been many proposals which aimed to reduce the incidence ofvehicle theft (Clarke and Harris 1992; Webb and Laycock 1992; Insurance Council ofAustralia 1991; NRMA 1991b; Geason and Wilson 1990; Biles and Willing 1987; NSW PoliceService, n. d.). Policies for the prevention of vehicle theft are either general policieswhich aim at reducing the risk of theft for all vehicles, or specific policies which focus onparticular types of vehicle theft.
8.1 GENERAL POLICIES FOR THEREDUCTION OF VEHICLE THEFT
There are a number of general and specific strategies which have the potential to reducethe frequency and cost of motor vehicle theft. Any sensible vehicle theft reduction policyought to utilize a range of strategies rather than relying solely on any one particularstrategy. In choosing an appropriate mix of initiatives, however, it is important toappreciate the relative utility of each initiative considered in isolation.
The most substantial gains in the fight against vehicle theft are most likely to be achievedthrough improving the security of vehicles (Clarke 1987). This can be achieved in anumber of ways. Manufacturers can be encouraged to increase the level of security builtinto new cars, persons can be encouraged to purchase and install security devices,and drivers can be educated to lock their cars properly when leaving them parked.
Stealing some vehicles is an easy undertaking. According to the NRMA (1989),some late model vehicles popular with thieves take only 10 seconds to enter and 20 secondsto start. It is sometimes said that there is no such thing as a theft-proof car. However,research carried out in the United Kingdom (Southall and Ekblom, 1985) suggests thatsignificant and progressive reductions in vehicle theft could be achieved throughdesigned-in car security. Southall and Ekblom found that relatively simple measures,which did not entail major redesign of vehicles, could result in the production of a vehicleimmune from opportunistic theft. More sophisticated measures built into expensivevehicles could withstand even persistent, professional attempts at theft. Further detailsconcerning the specific ways in which better security can be built into new cars can befound in Southall and Ekblom (1985) and Geason and Wilson (1990).
There can also be considerable gains from increasing the security of the existing fleet ofvehicles. In the 1960s, vehicle theft in Germany declined by 60 per cent after the WestGerman government made steering column locks compulsory in all vehicles, new andold (Mayhew, Clarke, Sturman and Hough 1976). In Britain and Australia althoughsteering column locks are now standard in new vehicles, they were not required to beinstalled on old vehicles. In this case it has been suggested that there may simply bedisplacement of theft from new to old vehicles (Clarke and Harris 1992).
The requirement that anti-theft measures be installed on old as well as new vehiclesmight be achievable by making upgraded security a requirement of registration, but suchmeasures may not be politically acceptable. Certainly there is evidence that in Australiavehicle manufacturers are heeding calls for more secure new vehicles (NRMA 1993; NSWMotor Vehicle Theft Steering Committee 1992), and it is to be expected that these measureswill have a progressive effect on vehicle theft rates as the fleet of vehicles ages, and vehicleswith better built in security make up a greater proportion of vehicles on the road.

Patterns of Motor Vehicle Theft
34
An important finding of this report is that there is little difference in the proportion ofacquisitive theft types across vehicles of different ages. The reason why older vehiclesare at greater risk of theft is not because these vehicles tend to be more likely to be stolenfor parts. Older vehicles appear to be more likely to be stolen in every category of vehicletheft. This suggests that older vehicles may simply be more attractive to thieves becausethey are easier to steal. If true, this means that making such vehicles more difficult tosteal should have an impact on all classes of vehicle theft.
Another initiative which has been suggested may have an effect on the risk of vehicletheft is the education of drivers to be aware of the risks of leaving their vehiclesinadequately secured. Studies have suggested that about 10 - 15 per cent of vehicle theftsinvolve vehicles left unlocked (Mayhew 1990). According to Monaghan (1989) an NRMAcampaign involving the distribution of leaflets to 1.5 million NRMA members,encouraging motorists to lock their cars, was followed by a drop in vehicle theft of about20 per cent. However, as Clarke and Harris (1992) observed, it is impossible to attributethe drop in vehicle theft observed by Monaghan to such a campaign, given that it occurredat a time when a number of other well-publicized initiatives were also introduced.Evaluation of similar publicity campaigns in other countries have failed to find any effecton motorists security habits (Clarke and Harris 1992). As Clarke and Harris (1992) pointout, the problem with campaigns to encourage people to lock their cars is that a largenumber of cars are locked, and that even if the proportion could be considerably increasedit is unlikely that this alone could reduce opportunities for vehicle theft. Such campaignsmay reduce the individual s chance of falling victim to vehicle theft, but do nothing toaddress the overall problem.
It is often suggested that tough penalties provide an effective deterrent to vehicle thieves.However, it is unlikely that heavy penalties for vehicle theft will act as an effectivedeterrent, partly because few vehicle thieves are caught. Recent British research (Light,Nee and Ingham 1993; Nee 1993) found that many offenders did not regard vehicle theftas a serious offence, did not think that they would be caught, and were not deterred bythe risk of apprehension. Interestingly, the interviewed offenders tended to overestimatethe chance of a custodial sentence compared with statistics on sentencing dispositionsfor the offence. Light, Nee and Ingham (1993) also found that vehicle thieves who hadceased stealing cars tended to cite increased responsibilities and maturity as reasons fordesisting, rather than the threat of penal sanctions. There is little general evidence thatlengthening gaol terms increases their deterrent value (Lipton, Martinson and Wilkes 1975),especially for an offence like motor vehicle theft which has such a low clear up rate.Even where very harsh, arbitrary penalties have been imposed for vehicle theft the offencepersists. Webb and Laycock (1992) quote evidence from Belfast where in 1987 paramilitaryorganizations carried out 60 beatings and 124 shootings (knee-capping) as punishmentfor joyriders without seeming to influence the number of such offences.
8.2 SPECIFIC INITIATIVES TO ADDRESSDIFFERENT KINDS OF VEHICLE THEFT
This section examines specific ways in which fraudulent theft, acquisitive theft and theftfor temporary use might be addressed.

35
Patterns of Motor Vehicle Theft
8.2.1 Fraudulent vehicle theft
This report found that insurance fraud accounts for between four and 13 per cent of vehicletheft. If, say, fraud accounts for 10 per cent of all vehicle theft, halving the number offraudulent thefts would result in a five per cent decrease in the numbers of recorded vehiclethefts. Such a reduction would produce cost benefits out of proportion to the number ofvehicles involved, since undetected fraudulent thefts involve the total loss of the vehicle.As discussed in Section 3 of this report, an incentive for fraud exists when vehicles areinsured for more than their realizable market value, and in some circumstances agreedvalue policies encourage this situation. However, to the extent that the retail market valueused to calculate insured values tends to be greater than the realizable market value,both agreed and market value insurance policies are likely to provide an incentivefor fraudulent theft. Prevention of insurance fraud, therefore, requires close attentionto the discrepancy between the realizable market value of insured vehicles and theirinsured values, as well as to the investigation of suspicious insurance claims.
In general, insurance companies appear to have relatively efficient methods of detectingsuspicious claims. However, at the present time suspicious claims may be withdrawnby claimants who are questioned by insurance companies over the circumstances of theclaim and may not be referred to police. It is possible that a higher level of deterrencewould result from the publication of a warning on insurance applications to the effectthat all suspicious claims will be referred to the police for investigation. A secondary benefitof the gradual improvement of security of the fleet of registered vehicles is that it will becomemore difficult for owners wishing to fraudulently stage a theft, to manufacture evidencethat the vehicle has been legitimately stolen.
8.2.2 Acquisitive vehicle theft
There have been many strategies proposed to address the problem of theft of vehiclesfor the acquisition of parts or for re-identification of the vehicle and resale. In general,these strategies address acquisitive theft where the vehicle or parts are sold. It is likelythat the techniques for increasing vehicle security discussed above are the most effectivemeans of deterring thieves who steal vehicles to acquire parts for their own use.
As discussed in Section 4 of this report, professional thieves are known to take advantageof the practice whereby vehicles which are classified as write-offs by the insurancecompanies, but which are repairable, are sold at auction with identifying marks intact.This practice maximizes the return to insurance companies because wrecks withcompliance plates and other identification intact are much more valuable than the samewrecks without such identification. Ironically, at least some of this premium is due todemand created by thieves who sometimes bid up desirable wrecks to suspiciously highprices (NSW Motor Vehicle Theft Steering Committee 1992). The practice of sellingwrecks with identification intact results in a ready supply of vehicle identities forprofessional thieves planning vehicle rebirthing operations.
There are a number of ways in which these activities could be addressed. As is thepractice in some other States, the selling of written-off vehicles with identification intactcould be banned. The insurance industry argues that the compliance plates are one ofthe few vehicle identifiers and destroying compliance plates would further remove the

Patterns of Motor Vehicle Theft
36
evidentiary trail (Insurance Council of Australia 1991). There seems to be general supportfor the introduction of a register of wrecked vehicles which records details of theidentification of wrecks and the identity of persons purchasing the wrecks (NSW MotorVehicle Theft Steering Committee 1992; Insurance Council of Australia 1991).More generally, it is expected that the new registration system being developed by the Roadsand Traffic Authority will significantly tighten registration procedures by requiring thatprovenance is proven for unregistered vehicles. This should make it more difficult toregister vehicles which have been given new identities (NSW Police Service, n. d.).
At the present time it is a relatively simple matter for thieves to dispose of stolen vehicleparts through the network of wreckers yards in NSW. Stolen parts become impossibleto identify once they are scattered among the millions of parts in these yards. One solutionto the lack of identifiability of parts would be the introduction of component partslabelling. There has been considerable support for the introduction of component partslabelling among all parties except vehicle manufacturers (NSW Motor Vehicle TheftSteering Committee 1992; Insurance Council of Australia 1991). It is true that evidenceconcerning the efficacy of parts labelling schemes in the US has been equivocal (Harrisand Clarke 1991, US National Highway Traffic Safety Administration 1991). However,many of the problems with the US system stem from the fact that only models identifiedas high risk were required to have parts labelled and the labels used to mark parts couldbe removed (US National Highway Traffic Safety Administration 1991). It is unlikelythat a scheme which required universal, permanent labelling of parts, and where properinfrastructure was installed to keep registers of parts, would be subject to the sameproblems as the US scheme.
8.2.3 Theft of vehicles for short-term use
It is arguable that the best prevention for this kind of theft is improved vehicle security.Initiatives such as the provision of more secure parking, improved public transport,the targeting of high risk areas and youth education and public awareness campaigns havebeen suggested as possible policies (NSW Motor Vehicle Theft Steering Committee 1992).However, with the exception of youth education campaigns and the provision of betterpublic transport, these initiatives may merely result in displacement of the problem,or may be not specific enough to address the problem. The provision of better publictransport may be a partial solution, however as pointed out earlier, youths who areinclined to use stolen vehicles as transport may be just as likely to steal a car to avoid theinconvenience of public transport altogether.

37
Patterns of Motor Vehicle Theft
REFERENCES
Australian Bureau of Statistics 1992a, Crime and Safety, NSW, 1992, Catalogue No. 4509.1,Australian Bureau of Statistics, Sydney.
Australian Bureau of Statistics 1992b, Motor Vehicle Census, Australia, 30 September 1991,Catalogue No. 9309.0, Australian Bureau of Statistics, Canberra.
Baldwin, J. 1985, ‘Thrill and Adventure Seeking and the Age Distribution of Crime: Commenton Hirschi and Gottfredson’, American Sociological Review, vol. 91(1), pp. 28-32.
Biles, D, & Willing, R. eds 1987, Car Theft: Putting on the Brakes, National Roads and Motorists’Association, Sydney.
Blackmore, R. 1987, ‘Car Theft and the Law - a Magistrate s View’, in Car Theft: Putting on theBrakes, eds D. Biles & R. Willing, National Roads and Motorists’ Association, Sydney.
Braithwaite, J. 1991, ‘Poverty, Power, White-Collar Crime and the Paradoxes of CriminologicalTheory’, Australian and New Zealand Journal of Criminology, vol. 24(1), pp. 40-57.
Britt, C. 1992, ‘Constancy and Change in the U.S. Age Distribution of Crime: A Test of theInvariance Hypothesis’, Journal of Quantitative Criminology, vol. 8(2), pp. 175-188.
Cantor, D. and Land, K. C. 1985, ‘Unemployment and crime rates in the post-world War II UnitedStates: a theoretical and empirical analysis’, American Sociological Review, vol. 50, pp. 317-332.
Challinger, D. 1987, ‘Car Security Hardware - How Good is it?’, in Car Theft: Putting on theBrakes, eds D. Biles & R. Willing, National Roads and Motorists’ Association, Sydney.
Chiricos, T. G. 1987, ‘Rates of Crime and Unemployment: An Analysis of Aggregate ResearchEvidence’, Social Problems, vol. 34, no. 2, pp. 187-207.
Clarke, R. 1987, ‘Crime Prevention - Car Theft Strategies’, in Car Theft: Putting on the Brakes,eds D. Biles & R. Willing, National Roads and Motorists’ Association, Sydney.
Clarke, R. & Harris, P. 1992, ‘Auto Theft and Its Prevention’, in Crime and Justice: A Review ofResearch, vol. 16, ed. M. Tonry, University of Chicago Press, Chicago.
Devery, C. 1991, Disadvantage and Crime in NSW, NSW Bureau of Crime Statistics and Research,Sydney.
Field, S. 1990, Trends in Crime and their Interpretation: A Study of Recorded Crime in Post-War England and Wales, Home Office Research Study 119, Her Majesty’s Stationery Office,London.
Geason, S. & Wilson, P. 1990, Preventing Car Theft and Crime in Car Parks, Australian Instituteof Criminology, Canberra.
General Insurance Claims Tribunal 1992, Annual Report 1991-1992, General Insurance ClaimsReview Panel Scheme, Melbourne.
Glass's Dealers Guide Pty Ltd 1992, Glass's Passenger Vehicle Guide, July 1992, Glass's DealersGuide Pty Ltd, Melbourne.
Gove, W., Hughes, M. & Geerken, M. 1985, ‘Are Uniform Crime Reports a Valid Indicator of theIndex Crimes?’ An Affirmative Answer with Minor Qualifications , Criminology, vol. 23,pp. 451-501.
Harris, P. & Clarke, R. 1991, ‘Car Chopping, Parts Marking and The Motor Vehicle LawEnforcement Act of 1984’, Sociology and Social Research, vol. 75(4), pp. 228-233.
Hirschi, T. & Gottfredson, M. 1983, ‘Age and the Explanation of Crime’, American Journal ofSociology, vol. 89(3), pp. 552-584.
Insurance Council of Australia 1991, Position Paper On Key Aspects of Reducing Motor VehicleTheft, Insurance Council of Australia, Melbourne.

Patterns of Motor Vehicle Theft
38
Katz, J. 1988, Seductions of Crime: Moral and Sensual Attractions of Doing Evil, Basic Books,New York.
Lay, R. 1987, ‘Why do Kids Steal Cars?’, in Car Theft: Putting on the Brakes, eds D. Biles & R.Willing, National Roads and Motorists’ Association, Sydney.
Light, R., Nee, C. & Ingham, H. 1993, Car Theft: The Offender s Perspective, Her Majesty’sStationery Office, London.
Lipton, D., Martinson, R. & Wilkes, J. 1975, The Effects of Correctional Treatment: A Survey ofEvaluation Studies, Praeger Publishers, New York.
McCaghy, C., Giordano, P. & Kniceley Henson, T. 1977, ‘Auto Theft: Offender and OffenceCharacteristics’, Criminology, vol. 15(3), pp. 367-385.
McCarthy, B. & Hagan, J. 1992, ’Mean Streets: The Theoretical Significance of SituationalDelinquency among Homeless Youths’, American Journal of Sociology, vol. 98(3), pp. 597-627.
Mayhew, P. 1990, ‘Opportunity and Vehicle Crime’, in Policy and Theory in Criminal Justice:Contributions in Honour of Leslie T. Wilkins, eds D. Gottfredson & R. Clarke, Gower, Aldershot.
Mayhew, P., Clarke, R., Sturman, A. & Hough, M. 1976, Crime as Opportunity, Home OfficeResearch Study 34, Her Majesty’s Stationery Office, London.
Monaghan, L. 1989, ‘Anatomy of a Crime Prevention Publicity Campaign’, Journal of SecurityAdministration, vol. 11, pp. 60-69.
Nee, C. 1993, ‘Car Theft: The Offender’s Perspective’, Research Findings, Home Office Researchand Statistics Department, 3, Her Majesty’s Stationery Office, London.
National Roads and Motorists’ Association 1989, ‘Car Stealability Ratings’, The Open Road,February.
National Roads and Motorists’ Association 1990, Car Theft in New South Wales, National Roadsand Motorists Association, Sydney.
National Roads and Motorists’ Association 1991a, Car Theft in New South Wales, National Roadsand Motorists’ Association, Sydney.
National Roads and Motorists’ Association 1991b, How to slam the door on car thieves: A reporton the car theft problem and solutions, National Roads and Motorists Association, Sydney.
National Roads and Motorists’ Association 1993, Car Theft in New South Wales and the ACT -1992, National Roads and Motorists Association, Sydney.
NSW Bureau of Crime Statistics and Research 1992a, New South Wales Recorded Crime Statistics1991, NSW Bureau of Crime Statistics and Research, Sydney.
NSW Bureau of Crime Statistics and Research 1992b, New South Wales Criminal Courts Statistics1991, NSW Bureau of Crime Statistics and Research, Sydney.
NSW Motor Vehicle Theft Steering Committee 1992, Reducing Motor Vehicle Theft, Six MonthlyReport, March 1992, NSW Police Service, Sydney.
NSW Police Service (n. d.) Reducing Motor Vehicle Theft in New South Wales: Strategic Directionand Action Plans, NSW Police Service, Sydney.
Office of Juvenile Justice (unpub.) Annual Children’s Court Statistics, Criminal Matters 1991/92, Office of Juvenile Justice, Sydney.
Southall, D. & Ekblom, P. 1985, Designing for Vehicle Security, Home Office Crime PreventionUnit Paper 4, Her Majesty’s Stationery Office, London.
Thompson, J., Sviridoff, M. & McElroy, J. 1981, Employment and Crime: A Review of Theoriesand Research, U. S. Department of Justice, Washington.
Turner, B. 1987, ‘The Victorian Police Experience’, in Car Theft: Putting on the Brakes, eds D.Biles & R. Willing, National Roads and Motorists Association, Sydney.

39
Patterns of Motor Vehicle Theft
US National Highway Traffic Safety Administration 1991, Auto Theft and Recovery: Effects ofthe Motor Vehicle Theft Law Enforcement Act of 1984, US Department of Transportation,Washington.
Webb, B. & Laycock, G. 1992, Tackling Car Crime: The nature and extent of the problem,Home Office Crime Prevention Unit, Paper 32, Her Majesty’s Stationery Office, London.
Yeager, M. G. 1978, ‘Los Angeles - Long Beach, 1967-1976: correlation between crime ratesand unemployment rates’, House of Representatives, Hearings before the Subcommittee onCrime of the Committee on the Judiciary, U.S. Government Printing Office, Washington DC,pp. 443-445.

Patterns of Motor Vehicle Theft
40
NOTES
1 Unpublished data from the NSW Police Service show that in June 1992 there 2,991 vehiclesstolen in NSW, or approximately 750 per week.
2 Data on registrations were obtained from Australian Bureau of Statistics 1992, Motor VehicleRegistrations Australia, 1990-91, Catalogue No. 9304.0, Australian Bureau of Statistics,Canberra.
3 Sources: Australian Institute of Criminology, unpublished data; NSW Police Service,unpublished data; Victoria Police 1992, Statistical Review, 1991/92, Victoria Police,Melbourne; Queensland Police Service 1992, Statistical Review, 1991-1992, Queensland PoliceService, Brisbane; South Australia Police Department 1992, Crime Statistics and Analysis:Supplement to the 1991-92 Annual Report, South Australian Police Department, Adelaide;Northern Territory Police, Fire and Emergency Services Annual Report 1991/92, NorthernTerritory Police, Fire and Emergency Service, Darwin; The University of Western AustraliaCrime Research Centre, unpublished data; and Australian Bureau of Statistics 1992, MotorVehicle Registrations Australia, 1990-91, Catalogue No. 9304.0, Australian Bureau of Statistics,Canberra.
4 Sources: see Note 3.
5 Unemployment data were obtained from two series of publications: The Labour Force,Australia, Catalogue No. 6203.0 and The Labour Force, New South Wales, Catalogue No.6201.1. The first of these is a monthly publication and the second is a quarterly publication.
6 New vehicle registrations were obtained from the monthly publication series Motor VehicleRegistrations, Australia, Catalogue No. 9303.0. The personal consumption data were obtainedfrom the National Accounts and Prices Branch of the Australian Bureau of Statistics.The data are estimates of household expenditure on consumer durables such as cars andfurniture (excluding dwellings); semi-durables such as clothing, crockery and cutlery; single-use goods such as food, cigarettes and alcoholic drinks; and services of all kinds such aspublic transport, dry cleaning and hairdressing.
7 While information concerning trailers, caravans and semi-trailers is included in the SVI, thesecategories of vehicle are excluded from consideration in this report as they are not motorvehicles. Prime-movers are counted as trucks.
8 Data on numbers of different makes of vehicle from Australian Bureau of Statistics 1992b,Motor Vehicle Census, Australia, 30 September 1991, Catalogue No. 9309.0, Australian Bureauof Statistics, Canberra.
9 Any one vehicle may have more than one part missing. For example, a recovered vehiclemay have body panels and accessories removed, and therefore be counted in both categories.
10 One such scheme described in Victoria involved criminal activity by the owner of a used caryard. The owner of the car yard would obtain a stolen vehicle. A phantom buyer using anassumed name would be arranged, and finance organized with the assistance of fakereferences. After a few payments were made to the finance company to allay suspicion,the car would disappear, be transported interstate and sold. The owner of the car yard wouldobtain the profit from the phantom sale of the vehicle as well as profit from the eventual saleof the vehicle interstate. The finance company would be unable to locate the phantompurchaser and would eventually have to write-off the loan. It was estimated that over fivemillion dollars were obtained using this method.
11 The NRMA were unable to provide a random sample of insured vehicles. In the sampleprovided vehicles manufactured in 1982 were somewhat over-represented.

41
Patterns of Motor Vehicle Theft
12 This estimate appears to be somewhat variable. In the following year s report the NRMA(1991a) estimated that 80 per cent of vehicles were insured against theft.
13 It was assumed that the 4,407 vehicles reclassified from uninsured to insured would haveoutcomes similar to those of the vehicles originally classified as insured. The 4,407 vehicleswere therefore allocated to the categories shown in Table 8 in proportion to the originalallocation of data to these categories. For example, Table 8 shows that 31.51 per cent of insuredvehicles were recovered intact. It is assumed, therefore, that 31.51 per cent of the 4,407reclassified vehicles (1,389vehicles) were also recovered intact. These 1,389 vehicles weretherefore subtracted from the number of uninsured vehicles recovered intact and added tothe number of insured vehicles recovered intact. This step was repeated for each of thecategories of theft outcome in Table 8. The proportion of fraudulent thefts was then re-calculated on the basis of these data. When the estimate was based only on those theftsrecovered burnt or immersed, the corrected low estimate of fraudulent theft was 2,870vehicles, or 6.1 per cent of thefts. Calculating an estimate of fraud from vehicles not recovered,or recovered burnt or immersed or stripped, resulted in a corrected high estimate of fraud of5,845 vehicles, or 12.5 per cent of stolen vehicles.
14 Cases were classified as recovered with parts missing when there was information on theSVI indicating that at least one category of part was missing on recovery. Cases where noparts were recorded missing, but there was some indication that the vehicle was recoveredwith all parts intact were classified as recovered with parts intact. Cases where there wasno information about any category of part were coded as unknown.
15 Collision damage is, however, relatively common among vehicles stolen for recreational use(NRMA 1991a).
16 As in section 5, burnt or immersed insured vehicles are excluded from the analysis.
17 The condition of the vehicle on recovery was missing for 35.6 per cent of recovered vehicles(see Table 5).
18 Data on clear up rates for this offence were not available for 1991.
19 Britt (1992) argues that while the parameters of the age crime curve may vary, themathematical form of the curve is constant, regardless of offence type.
20 Source: NSW Bureau Of Crime Statistics and Research (1992), unpublished statistics; Officeof Juvenile Justice, unpublished statistics.