Patterns of Evolution in Open Source Projects: A … · · 2013-01-15Irish Management Institute...
40
1 Patterns of Evolution in Open Source Projects: A Categorization Schema and Implications 1 Sherae Daniel Katz School of Business University of Pittsburgh Katherine Stewart Robert H. Smith School of Business University of Maryland David Darcy Irish Management Institute March, 2009 WORKING PAPER: PLEASE DO NOT CITE OR DISTRIBUTE WITHOUT AUTHORS’ CONSENT 1 The authors would like to acknowledge several sources of support for this work. Constructive feedback was received during presentations at the First Interdisciplinary Symposium on Statistical Challenges in e-Commerce, Michigan State and Lero, University of Limerick. Several individuals provided useful feedback including Brian Butler, Pratyush Sharma, Wolfgang Jank, Galit Shmueli and Pankaj Setia. The authors are grateful for the research assistance provided by Chang-Han Jong, Vincent Kan and Julie Inlow. This research was partially supported by the National Science Foundation award IIS-0347376. Any opinions, findings, and conclusions or recommendations expressed in this material are those of the authors and do not necessarily represent the views of the National Science Foundation.
Transcript of Patterns of Evolution in Open Source Projects: A … · · 2013-01-15Irish Management Institute...

1
Patterns of Evolution in Open Source Projects: A
Categorization Schema and Implications1
Sherae Daniel
Katz School of Business
University of Pittsburgh
Katherine Stewart
Robert H. Smith School of Business
University of Maryland
David Darcy
Irish Management Institute
March, 2009
WORKING PAPER: PLEASE DO NOT CITE OR DISTRIBUTE WITHOUT AUTHORS’
CONSENT
1 The authors would like to acknowledge several sources of support for this work. Constructive feedback was received during presentations at the First Interdisciplinary Symposium on Statistical Challenges in e-Commerce, Michigan State and Lero, University of Limerick. Several individuals provided useful feedback including Brian Butler, Pratyush Sharma, Wolfgang Jank, Galit Shmueli and Pankaj Setia. The authors are grateful for the research assistance provided by Chang-Han Jong, Vincent Kan and Julie Inlow. This research was partially supported by the National Science Foundation award IIS-0347376. Any opinions, findings, and conclusions or recommendations expressed in this material are those of the authors and do not necessarily represent the views of the National Science Foundation.

2
Patterns of Evolution in Open Source Projects: A
Categorization Schema and Implications
ABSTRACT
Open Source Software (OSS) is growing both in terms of its adoption and as a
method of development. OSS projects represent new means of collaborating to build,
distribute, and support software. Prior research on OSS has tended to focus on either the “big”
projects such as Linux, Apache, etc, or on “the rest,” such as the population (or a sample) of
SourceForge. Very few have made distinctions among “the rest” beyond dead and not dead,
or better performing and worse performing. This study provides a finer-grained view of the
landscape of OSS development focusing on different patterns of evolution and success.
Statistical analysis of longitudinal data is combined with qualitative analysis of data from
projects’ public websites to elaborate a categorization schema that differentiates among 6
types of OSS projects: User-Centered, Controlled, Counter-cultural, Personal, Abandoned,
and Intractable. A major contribution of this work is in describing how each of these
categories is associated with a unique pattern of software evolution and varying levels and
kinds of success in attracting development activity and user interest. Observation of these
categories leads to several interesting implications for research and practice, including the
proposition that, counter to much prior work on software complexity, controlling complexity
is neither necessary nor sufficient for success in OSS projects.

3
Patterns of Evolution in Open Source Projects: A
Categorization Schema and Implications
1 Introduction
Open source software (OSS) has emerged as a viable alternative to software
developed in proprietary settings, generating great interest among managers and researchers
(Hahn et al. 2008; Jackson 2008). Two factors appear to have fueled the intense interest in
OSS development. One is a belief that OSS projects may attain very high quality, for
example as indicated by low levels of complexity in the source code (O'Reilly 1999;
Raymond 2001). A second is fascination with unique aspects of the development practices
which allow for wide-ranging voluntary contributions (MacCormack et al. 2006; Mockus et
al. 2002; von Hipple and von Krogh 2003). Many OSS enthusiasts believe OSS development
practices lead to high quality software because of the many developers who can observe and
participate, finding and correcting bugs, and adding new features. This belief is based on the
notion that a multitude of geographically dispersed developers work on OSS projects (DiBona
et al. 1999). However, given that many OSS projects have only a single developer (van
Antwerp and Madey 2008), this basis for expectations of high quality may not apply
uniformly across all OSS projects. Another common notion is that OSS is free so it has a
lower total cost of ownership (Wheeler 2007). However, when including maintenance costs
and a potential lack of support due to diverted interest from developers, the savings are less
clear (Wheeler 2007). Part of the discrepancy between common beliefs and the reality for
many OSS projects lies in the fact that although the hundreds of thousands of OSS projects
have some common characteristics because they are governed by similar licenses, they can
also be distinct in many ways. Hence the application of broad generalizations may not be
appropriate, and discriminating among different types of OSS projects could be useful. The
starting point for this research is the assertion that OSS projects can no longer be thought of

4
as a single monolithic phenomenon; the landscape is more nuanced and differentiation is
necessary.
OSS projects are sometimes divided into two classes: the ultra-successful, including
projects such as Apache and Linux, and the rest. Some research has further distinguished
among “the rest” those that are “active” versus those that are “inactive” (Crowston et al.
2006). When making these distinctions many studies focus on the source code, i.e. its size
and or how much it changes over time (Lee and Cole 2003). For example, Linux is deemed
successful partially based on a huge code base and the fact that it continues to receive code
contributions. The ability to attract code contributions is important because with rare
exception, software must evolve in order to meet dynamic needs of stakeholders including the
developers themselves, the larger development community and, ultimately, users (Belady and
Lehman 1976; Lehman and Ramil 2001).
However, while Linux has a large and growing code base, there are other unique
aspects to its code evolution and also its project characteristics. Linux has increased in
complexity yet continues to be successful in terms of activity and other measures (Godfrey
and Tu 2002). This seems to contradict prior work suggesting that software complexity
makes it difficult to modify software and limits many forms of success (Lehman 1980). Thus
the developers of at least one OSS project have been able to leverage the unique
characteristics of OSS project development to overcome common limitations of software
complexity. The seeming contradiction of continually increasing software complexity
coupled with ongoing success in Linux raises the question of whether this is an anomaly or a
frequently occurring pattern in OSS.
The complex and potentially unique interplay between software complexity and
success for OSS projects has captured the attention of researchers. For example, Haefliger et
al. (2008) study the relationship between code structure and reuse, MacCormack et al. (2006)
focus on the ability of OSS management and organizational structure to affect code
complexity, and Baldwin and Clark (2006) discuss the impact of code complexity on
attracting developer interest. These studies, along with case studies focused on the pattern of

5
software complexity evolution in Linux (Godfrey and Tu 2002), together distinguish software
complexity as a notable characteristic of OSS projects. Code complexity is especially
significant in OSS projects because code is at once the product, a reflection of the
development process, and a guide for potential reuse where there may not be documentation
or other helpful organizational structures.
Based on the prior work that suggests the importance of software complexity
evolution, we focus on the evolution of software complexity to develop a more fine-grained
schema of OSS projects. The schema identified here can help address many issues of concern
to researchers. By using software complexity evolution as a lens to categorize OSS projects,
we can start to understand the paradox of Linux because we identify and describe a category
of projects that increase in complexity over time yet are associated with successful outcomes.
We also identify and describe other categories of projects that decrease in complexity and
have varied outcomes. For example, we discover that 3 categories, representing 47% of the
sample, do not follow the commonly observed pattern of increasing complexity noted in most
prior research on closed development projects (Belady and Lehman 1976). This is evidence
that OSS projects may be distinct from traditional projects in terms of how complexity
evolves, and could be subject to alternative laws. Further, we are surprised to find that there
does not seem to be a strong association between managing (or increasing) complexity and
success (or failure) on other dimensions.
This paper also makes contributions beyond the realm of research focusing on
software evolution. Through focusing on internet enabled communities that strive to innovate
we seek to provide some guidance for theoretical inquires such as those aimed at
understanding community based innovation (von Hipple and von Krogh 2003) or dynamics
on globally distributed teams (Maznevski and Chudoba 2000). In particular, this study will
offer guidance to researchers who attempt to draw generalizable theoretical conclusions from
the study of OSS projects by enabling them to better estimate the boundaries to which they
can project their findings. In summary, the main contribution of this research derives from
developing a classification schema that illuminates some prior findings (i.e. the Linux
6
paradox), raises some interesting theoretical questions (i.e. the role of complexity for
communities seeking to innovate), and may help guide sample selection and assessments of
generalizability in future OSS research.
In addition, the schema provides a tool that can be helpful for managers faced with
OSS adoption decisions or the challenge of utilizing OSS practices described in prior research
(Watson et al. 2008). Such managers may get quickly mired in a variety of OSS projects.
Using the schema developed in this paper, a manager interested in adopting OSS practices can
identify practices that have worked for projects that are similar to his project instead of
attempting to borrow practices from projects that are substantially different from his own.
Specifically, our schema suggests the kinds of projects where success is associated with
complexity and those where complexity is not associated with success, so that a manager can
better estimate the impact of complexity for his project.
To situate this study in the prior work on OSS and software evolution, the next
section provides a brief description of OSS, a short discussion of software complexity, and a
summary of research concerning complexity evolution in OSS projects. Next, the research
design is presented, including details about the use of functional data analysis (FDA) and the
qualitative analysis of information on project websites. The results section combines analysis
of software complexity evolution, quantitative project characteristics, and qualitative project
information to develop and describe the 6 project categories. In the discussion we consider
several implications of our findings. Finally, we highlight the limitations of the study before
discussing implications for research and practice.
2 Background
2.1 OSS Project Characteristics and the Importance of Complexity
OSS projects generally engage a set of practices that distinguish them from other
software development projects, and many of these practices relate to the treatment of source
code. The treatment of source code in OSS projects is guided by licenses approved by the

7
Open Source Initiative (see www.opensource.org). The most prominent characteristic of
approved licenses is that the source code be freely available for use, modification, and
redistribution. These licensing rules can yield opportunities and challenges for OSS projects.
By maintaining code availability, OSS licenses create an opportunity for projects to
engage geographically distributed volunteer developers who may join and exit projects as
they wish (Shah 2006; von Krogh et al. 2003). However, engaging geographically distributed
volunteers can increase coordination challenges, and emphasize the importance of factors that
ease contributions. For example, Kuk (2006) highlights the important role of knowledge
sharing to overcome these challenges. When geographically distributed developers may
come and go without formal integration of new contributors or turnover processes when a
contributor leaves, factors that facilitate the ease with which a developer can contribute is
especially important. The ease of contribution is also important because the developers are
often volunteers and may have limited time to work on the OSS project. If they cannot
understand and contribute quickly, they may not contribute. Hence the complexity of the
source code may be an important determinant of a new members’ ability to understand the
code and contribute effectively (Baldwin and Clark 2006; Lehman and Ramil 2001). Thus,
the unique characteristics of OSS projects make it an especially interesting context to observe
patterns of interplay between complexity evolution and other project characteristics such as
ongoing development activity.
2.2 Software Complexity: Size and Structure
There have been quite a few studies on the evolution of source code in OSS. In
contrast to the current work, these have generally been case studies of the largest, most
successful projects. We follow studies of Linux and Mozilla in their focus on size and
structure as critical measures of software complexity (Godfrey and Tu 2002; MacCormack et
al. 2006; Paulson et al. 2004). While these measures are often correlated, they are
theoretically and empirically distinct (Darcy et al. 2005; Eick et al. 2001).

8
Size is typically measured as source lines of code, and it reflects the quantity of code.
As such it may reflect the amount of functionality or feature richness of an application
(Lehman and Ramil 2001) and in that regard, larger size may be seen as desirable. Size can
reflect how much developer activity the project has been able to attract, and prior OSS
research has considered this a signal of project success (Stewart and Gosain 2006). OSS
projects that are rich in functionality may be able to attract a user community. This is
important as prior literature discusses the positive impacts that users can have in OSS projects
(Lakhani and vonHippel 2003). Hence overall, increasing size may be seen as positive.
However, software with larger size tends to have higher complexity, a higher number
of developers needed to complete the tasks related to the software and a higher number of
errors (Kitchenham et al. 1990; Triantafyllos et al. 1996; Wang and Shao 2003). As discussed
above, higher complexity can be detrimental to OSS projects as developers are volunteers and
may not take the time to overcome the complexity to make contributions. Size is a measure
with high accessibility to project managers, but other measures that capture complexity,
irrespective of size, may be more helpful for focusing maintenance efforts within a project
(Briand et al. 2000).
Structural complexity captures the way that code is organized rather than how much
code exists. As such, rather than reflecting the amount of functionality in an application, it
may more likely reflect management efforts and decisions associated with design
(MacCormack et al. 2006). Structural complexity is viewed as “the organization of program
elements within a program” (Gorla and Ramakrishnan 1997; MacCormack et al. 2006). The
term element can refer to a procedure, function, method, module, class, etc. When solving a
problem through software, several of these elements are typically created. As design,
implementation and maintenance decisions are made, the particular content of these elements
and the relationships between these elements leads to the structural complexity of the
software. That is, the structural complexity of a program depends on the complexity of
individual elements and the complexity of the associations among these elements. The
structure of elements created by developers can have several implications including effecting

9
the ease with which the code can be altered as bugs are fixed and features are added, and the
reliability of the application (Ulrich 1995). In this regard high structural complexity is often
viewed as an undesirable trait.
Structural complexity is reflected in both cohesion and coupling. Cohesion is
conceptualized as the ‘togetherness’ of the sub-elements within an element (Bieman and Ott
1994). Higher cohesion indicates lower complexity. Coupling focuses on the associations
among elements, and is conceptualized as the ‘relatedness’ of elements to other elements
(Hutchens and Basili 1985). As coupling increases, so does complexity. An experimental
study found coupling and cohesion to be interdependent (Darcy et al. 2005). Based on such
findings, it can be argued that a single measure of structural complexity may be calculated
using coupling and cohesion, and such a measure adequately captures overall structural
complexity because coupling and cohesion are the fundamental, important underlying
dimensions of structural complexity (Darcy et al. 2005). The single coupling and cohesion
measure of structural complexity is particularly relevant with regard to outcomes of
managerial interest such as developer effort (Darcy et al. 2005).
While size and structural complexity have sometimes been considered
interchangeable as indicators of complexity, they have important differences as overviewed
above. Specifically, increasing size can indicate added features, generally a positive trait,
whereas increasing structural complexity may be a negative trait, leading to difficulty in
maintenance. Increases in size (and features) do not have to increase structural complexity.
We focus on both size and structural complexity to understand if and how projects can
increase their functionality while minimizing the difficulty developers face when trying to
contribute.
2.3 OSS and Complexity Evolution
Exploration of the evolution of complexity in OSS projects has yielded some
consistency and some contradictions. Godfrey and Tu (2002) observed the size of 96 Linux
kernel versions to grow at a super-linear rate. Yu et al. (2004) examined the evolution of

10
larger set of 400 versions of the Linux kernel and found that both size and common coupling
with non-kernel modules increased, but at different rates. Specifically they found that size
increased in a linear fashion, while common coupling increased at an exponential rate. In
contrast, Paulson (2004) found that size and other measures of complexity increased at the
same rate in the Linux kernel. So, while prior research suggests that measures of complexity
in Linux have increased over time, it is not clear exactly what pattern those increases have
followed.
The increasing complexity in Linux is only partially consistent with the seminal work
known as Lehman’s Laws of Software Evolution, which were based on observations made
during the development of the IBM 360 operating system (Belady and Lehman 1976; Lehman
1980). Lehman’s Laws suggest that complexity will increase over time unless it is actively
controlled, and a common hypothesis is that increasing complexity will obstruct project
performance while decreasing complexity facilitates it (Baldwin and Clark 2006). Evidence
supporting this hypothesis has been found in the Mozilla project, where developers were able
to purposefully decrease complexity and then experienced greater success (MacCormack et
al. 2006). In contrast, Linux’s success, even in the face of increasing complexity, seems to
suggest that increases in complexity may not be detrimental to OSS projects, or that there are
other factors that ameliorate the impact on a project’s performance (e.g. Godfrey and Tu
2002).
In summary, complexity is expected to influence the outcomes of OSS projects, and
there is a growing body of research that details how complexity, in terms of size and
structure, evolve in some of the largest OSS projects. While this research is insightful, it
provokes questions about the impact of complexity for OSS projects and what patterns of
evolution may occur in more typical projects. This study adds to this body of research by
exploring evolution of a broader sample of OSS projects to uncover and interpret patterns.
3 Research Design

11
Research was conducted in four stages. In the first stage, sampling criteria were
defined, OSS projects fitting the criteria were identified, the source code from all available
releases of those projects was downloaded, the data was cleaned, and the measures of interest
were calculated for every release of every project in the sample. In the second stage
functional data analysis (FDA) was applied to uncover patterns of evolution in size and in
structural complexity and to categorize projects accordingly. Further statistical testing was
conducted to increase our confidence that the resulting 6 group categorization schema was
valid. In the third stage of the research, we collected and analyzed additional archival data to
enhance our understanding of differences across the projects categories. This included both
quantitative data (e.g., numbers of downloads for the projects), and qualitative data (e.g.,
types of information provided on the project websites). Finally, in the fourth stage we
combined all of the analyses to write comprehensive descriptions of the 6 types of projects
uncovered in this research.
3.1 Sample
The sample of projects was drawn from SourceForge (www.SourceForge.net).
SourceForge provides open source developers a centralized place to manage their
development and includes communication tools, version control processes, and repositories
for source code. It is one of the largest open source repositories, estimated to host over
168,000 projects (Madey and Christley 2008). Drawing a sample from this site allowed this
study to build on prior open source research by focusing on a larger and more diverse set of
projects compared to previous case study work focused on the largest projects such as Linux,
Mozilla or Apache.
SourceForge hosts many different kinds of software projects, utilizing many different
programming languages. Since our focus is on the evolution of code structure, we attempted
to limit variability due to the nature of the underlying problem being addressed across
projects by selecting from the two largest problem domains listed on SourceForge, “Internet”
and “Networking.” To avoid variability due to the project programming language, projects

12
were selected that were built with C++. These constraints were instituted to enhance the
likelihood that differences in evolutionary patterns observed may be due to factors of greater
managerial interest, such as the development practices used on a project. Some projects
represented multiple parallel development streams that might not be able to be disentangled,
and because some variables were measured at the level of the SourceForge project, those
measures could not be assigned to a single subproject. For this reason those projects that
appeared to be a sub-project of a larger project or that appeared to be an umbrella project for
multiple smaller efforts were eliminated. In order to focus on projects that represent the open
source movement, only projects that use OSI approved licenses were examined. In order to
make sure we could observe some evolution these criteria were applied to projects that had a
minimum of 2 releases. Projects were tracked for 1 year and those that had at least 2 software
releases by the end of that year were retained in the sample. In order to observe comparable
periods, we included the first one year of history for each project in our sample. A one year
history was chosen as being sufficiently long for projects to display considerable evolution,
and likely long enough to capture the active life of most projects (Stewart et al. 2006b).
Applying the selection criteria generated a total of 76 projects (listed in the appendix) and 492
software releases for analysis.
Two screening procedures were used to ensure that the releases for a given project
represented a single development stream. The first procedure identified projects for which the
size appeared to vacillate drastically over time. For every project that showed such
vacillation, the source files, public forums, web pages, and/or discussion groups associated
with the project were reviewed in order to determine whether the set of source files obtained
represented a single development stream. Source files that were determined to have been
erroneously included were eliminated.
The second screening procedure focused on separating multiple development streams in
projects (Godfrey and Tu 2002). This was done by examination of the naming conventions
used in each project to distinguish when parallel development efforts were represented. For
example, some projects included versions of the code related to different human languages

13
(e.g., a French release and a Spanish release), and some had versions for different operating
systems (e.g., Mac and Windows). Where a project was identified as having multiple parallel
development streams, the releases associated with the development stream that was most
active (i.e., the one that contained the largest number of releases) were retained.
3.2 Measurement
Size, coupling and cohesion for each release were calculated using Scientific Toolwork’s
Understand (version 1.4) analysis tool. Size was calculated by summing the total number of
lines of code in the release. Coupling and cohesion were individually assessed for each class
in a particular release of the project. To calculate a release level coupling measure, the class
level coupling measures were averaged across all classes for the given release of the project.
The same procedure is used to assess the release level measure of cohesion. As increasing
cohesion represents decreasing complexity, a reversed measure was used. Following Darcy et
al. (2005), the release level measures of coupling and cohesion were multiplied to represent
an overall measure of structural complexity.
In addition to the measures of complexity, other descriptive statistics were also calculated
to enhance our understanding of the projects and their relationship to practices that have been
suggested to be common for OSS projects. As one common notion is that OSS projects
release “early and often” (Raymond 2001) we explored measures that would help us evaluate
the degree to which our projects release early and often. These were the total number of
releases for a project, the average number of days between releases (release frequency), and
the active life. The active life for a project represents time in number of days between the first
and the last release for a project (within the one year observation period). To explore
potential relationships between evolution during the first year and subsequent project success,
we revisited each project in the sample approximately three years after our initial sampling
and observed the date of the most recent software release. This allowed us to determine
whether the project had survived past the first year (as indicated by further development
activity).
14
3.3 Uncovering Complexity Evolution Patterns and Categories
FDA is a relatively new technique that enables an efficient representation of many types of
data series, such as time series data, in a compact and analytically powerful functional form
(more information can be found at http://functionaldata.org/ or in (Ramsey and Silverman
2002)). A functional form is a mathematical description of a curve that can be analyzed using
mathematical techniques such as cluster analysis. We used FDA to enable the creation of
comparable functional forms representing the complexity evolution pattern for a single OSS
project. Projects, represented by their functional forms, are the unit of analysis for this study.
FDA is used in this study because when OSS data representing the evolution of complexity
is viewed across multiple projects, they are very ill behaved (Kemerer and Slaughter 1999)
(Stewart et al. 2006b). Otherwise stated, the time series for a given project may look very
different from that of another project, and comparisons across projects are difficult to make
using traditional time series analysis. The time series were different across projects based on:
the variance in the timing of initial, intermediate, and final software releases across projects;
variance in the number of releases across projects; and variance in the absolute levels of
complexity, which we found to obscure patterns of change over time. In employing FDA we
resolved several challenges to analysis. Specifically, we followed Stewart et al. (2006) in
addressing these issues, and also in our selection of parameters for creating the functional
forms. Briefly, to eliminate difficulties associated with the staggered starting points of
projects, we aligned them according to their first software release. To address the challenge
posed by the varied number and timing of software releases, we assigned each project a level
of complexity for every day in the one year following the initial release. This value was equal
to the complexity calculated for the most recent software release for that project.
Following (Jank and Shmueli 2008), K-medoids clustering was used to identify different
patterns of evolution for size and for structural complexity. Because there is no theoretical
reason to expect a particular number of clusters, we began with a single cluster and then
clusters were added until no new insight was gained by adding an additional cluster (Kluyver

15
and Whitlark 1986). After creating clusters, the General Linear Model procedure (GLM) in
SPSS 16.0 was used to confirm that the clustering resulted in clusters that were significantly
different from one another. We then examined the assignment of projects to categories
representing a size cluster and a structural complexity cluster. For categories with few
projects, we explored collapsing them and performed statistical analyses to investigate the
result of combining some categories.
3.4 Archival Data Analyses
After generating categories based on complexity evolution patterns, we sought greater
understanding of the differences among categories by conducting an analysis of data available
from the SourceForge archives. This included both quantitative and qualitative data.
Quantitative data were drawn from the SourceForge Research Data Archive, an archival
database of OSS projects provided by SourceForge to the University of Notre Dame (van
Antwerp and Madey 2008). SourceForge provided resources to manage the development
process such as tracking bug reports and downloads, managing CVS activity, and space to
create a website. We analyzed the quantitative data for each project as of 2006. This
represented a minimum of 2 years after the end of the one year observation period used to
assess the evolutionary patterns, allowing us to observe some indictors of the later success of
projects that could be associated with their early evolution. At this point one project had been
deleted from the SourceForge archive and so the archival data analysis is for 75 projects.
Following prior work that has identified different types of success in OSS (Crowston et al.
2006; Stewart et al. 2006a), we focused on multiple indicators. These included survival
(releases after the first year), development success (CVS commits, number of developers),
and user interest (downloads).
To build on the quantitative data analyses, qualitative data was collected during May
2008 by examining web space SourceForge provided for each project (e.g.,
http://pocketwarrior.SourceForge.net/). We used a grounded approach, conducting iterative
rounds of coding to inductively determine relevant categories of information presented on the

16
websites (King et al. 1994; Straus 1987). In the first round of coding, one author reviewed all
websites, determined whether the website was in use or not, and created a summary of the
information found on each site. In the second round, this information was reviewed by the
other two authors, who then also explored several project websites in order to arrive at an
initial set of information categories found on the websites. In the final round of coding, each
website was reviewed again to apply the inductively generated coding schema and code
which types of information were present on each site. At this point all three authors
independently reviewed the data for all categories of projects in order to assess commonalities
and differences across them. Finally, the three authors discussed these independent
assessments to converge on a common understanding of the categories leveraging both the
qualitative and quantitative data.
4 Results
Descriptive statistics are presented first. Then a description of clusters created based on
the evolutionary patterns of size is described, followed by a summary of the clusters based on
the evolutionary patterns of structural complexity. Next, we unite these two sets of clusters to
create six categories encompassing patterns of both size and structural complexity evolution.
Finally, we present results of the analyses of the additional archival data to describe each of
the 6 categories in more detail.
Descriptive statistics based on the software releases for the sample of projects can be
found in the second column of Table 1. The average active life across the 76 projects is 161
days. Projects with multiple releases all on a single day had an active life of 0. On average,
the projects released 6.47 versions and released them every 36.86 days. The size of the first
release was approximately 4,427 lines of code and the final release contained approximately
6,520 lines of code.
4.1 Patterns of Evolution in Size

17
The functional forms representing the evolution of size for all projects are shown in Figure
1. The functional form in bold represents the average of all the projects and the 95%
confidence interval around that average is indicated by bold dashed lines. Though the
individual projects are difficult to distinguish, the mean curve shows an upward trend.
After clustering the functional forms and analyzing solutions for one to four clusters, we
found the three cluster solution yielded the most explanatory power and provided the most
interpretable results for the evolution of size. The thin dotted curve in Figure 2 represents the
overall mean and each of the other lines represents one of the three cluster means. The largest
cluster of projects (n = 29) is represented by the solid bold line showing the largest increase in
size over time. The curve shows these projects begin with a relatively slow increase for
approximately the first 50 days, then have a period of rapid increase until approximately day
200, after which the rate of increase again slows down. We refer to the projects in this cluster
as “high growth” projects. The next largest cluster (n=28) is represented by the dashed curve
showing an increase during approximately the first 100 days, followed by a lack of change
during the remainder of the observation period. We refer to this as the “low growth” cluster.
The smallest cluster (n=19) is represented by the relatively flat dotted line. Initially the flat
line was surprising, given that we sampled only projects with multiple releases. Examining
the curves in this cluster revealed that most of these were projects that included both increases
and decreases during the observed year, resulting in an average for the cluster that appears
relatively flat. We thus refer to this as the “fluctuating size” cluster.
The clusters are visually distinguished by changes in size and the active life. To confirm
that the clustering does represent actual differences on these dimensions, we used the general
linear model (GLM) procedure. The GLM showed that the three clusters are distinguished
mainly by the percentage change in size (log transformed to minimize deviations from
normality) and the active life across clusters. Both effects were significant at p <= .001 (R-
square 21.6% for the percentage change in size, R-Square 29.1% for active life) and
differences across clusters were in the expected directions, increasing our confidence that the

18
clustering did result in the separation of projects into distinct clusters that were significantly
different in the growth patterns displayed.
The within cluster change in size was also examined to confirm that changes in size
implied by the appearance of the average cluster line were of the relative magnitude implied
by the picture in Figure 2. All clusters showed average increases in size from the first to the
last release. For the high growth projects the difference was 3,710 source lines of code, and
for the low growth projects the difference was 2,934 source lines of code. The fluctuating
projects showed a smaller net change of 1,451 source lines of code.
4.2 Patterns of Evolution in Structural Complexity
Figure 3 displays the curves representing the structural complexity evolution for the 76
projects. As with size, a three-cluster solution produced the most interpretable results for the
analysis of structural complexity. Figure 4 depicts the evolution in structural complexity
across the three clusters. The thin line represents the overall mean. The largest cluster of
projects (n = 37) is represented by the increasing complexity pattern (solid bold line), the
second largest cluster is represented by the relatively flat dashed line (n=22), and the smallest
cluster is represented by the dotted line that shows decreasing complexity (n=17). As with
size, the flat line actually represents projects that show both increases and decreases in
complexity over the observation period. Thus we label the clusters “increasing complexity,”
“decreasing complexity,” and “fluctuating complexity.”
The GLM procedure was used to assess the differences in the change in structural
complexity and the active life across clusters. Both effects were significant at p <= .001 and
differences across clusters were in the expected directions, supporting the conclusion that the
clustering did result in groups of projects that were significantly different in the patterns of
change displayed.
The within cluster change in structural complexity was also examined to confirm the
patterns observed. Results were as expected. For the increasing structural complexity projects
the difference between starting and ending structural complexity was 0.568. For the

19
decreasing structural complexity projects the difference was -0.406. The fluctuating structural
complexity projects showed virtually no difference (-0.089).
4.3 The Co-evolution of Size and Structural Complexity
Classifying each project according to the pattern of growth and the pattern of change
in structural complexity created 9 groups, shown in Table 3. We explored whether these
groups appeared to be distinct, or whether some may be combined to create a more
parsimonious categorization schema. In particular, we focused on the groups that included 5
or fewer projects. Returning to the view that increases in size may represent additions of
functionality (a presumed improvement) and changes in structural complexity may indicate
changes in the quality of design (presumed a possible function of management of design), we
explored the following groupings.
First, within the high growth cluster, we combined projects that experienced
fluctuating or decreasing complexity because either maintaining or decreasing complexity
while adding functionality may indicate some active management of design may be occurring
(Lehman 1980). These projects are in cell B in Table 4. They contrast to the projects in cell
A that experience high growth and also increasing complexity, possibly indicating that design
is not being as successfully managed.
Second, within the fluctuating size cluster we combined projects in the fluctuating
and decreasing structural complexity clusters into cell D. Fluctuating size may indicate that
these projects are being changed over time to accommodate a changing environment, and
fluctuating or decreasing structural complexity may indicate that this change process is being
actively managed (Lehman 1980). This contrasts to projects in cell C that appear as though
they are being maintained, but design is becoming more complex during maintenance.
Third, within the low growth cluster, we combined projects that were in the
increasing or fluctuating structural complexity clusters (cell E). These projects do not appear
to experience any improvement on either dimension – i.e. they neither experience much
growth, nor do they experience improvements in design as indicated by structural complexity.

20
These contrast to projects in cell F that, while not experiencing growth do experience design
improvements.
To assess this reduction in the number of categories, we conducted within-group tests
of the changes in size and structural complexity. Overall, statistical analysis supported the
consolidation into the 6 categories shown in Table 4. On average, the projects in cell D show
no significant change in size but they do show a decrease in structural complexity (p=0.056).
The projects in cell B exhibit an increase in size (p= 0.009), but no significant change in
structural complexity. Finally, the projects in cell E show no significant change in size but an
increase in structural complexity (p=0.015). Differences in other categories are also generally
as expected: cell C shows no significant change in size but an increase in structural
complexity (p=.051). Cell A shows increases in both size (p=0.001) and structural complexity
(p=0.005) and the projects in cell F show small increases in size and decreases in structural
complexity, though these do not reach statistical significance. Descriptive statistics for each
category are shown in Tables 1 and 2.
4.4 Archival Data Analysis and Category Descriptions
To better understand and interpret the categories, we looked to the quantitative and
qualitative data available from SourceForge. A summary of the quantitative data are shown in
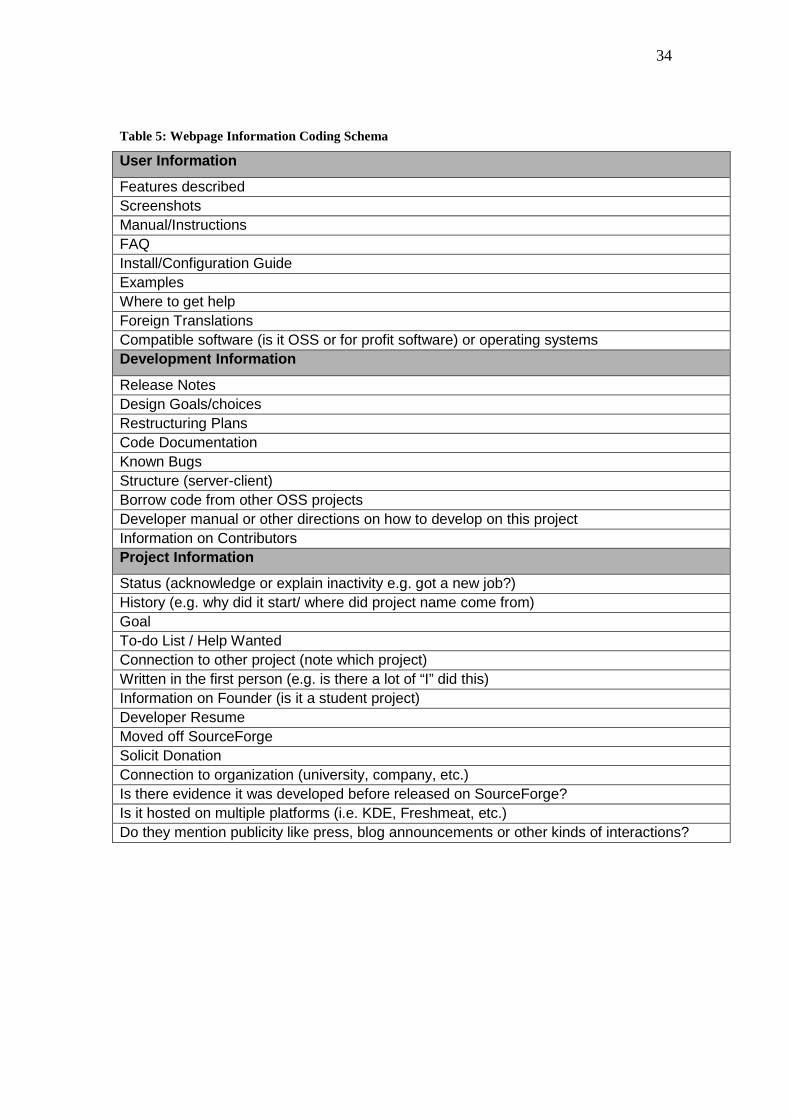
Table 2. Qualitative data were analyzed through three rounds of qualitative coding. We
identified 29 types of information, which were then sorted into three higher-level categories
as shown in Table 5. Project websites displayed three primary types of information. First,
they provided details that enable the application to be adopted by users such as a list of
features, how to download the application, a user manual, screen shots and compatible
systems. Second, projects often provided technical materials for and about developers
including their names, contributions, and guidance for participation. A final category of
information was project characteristics, and information of this type includes reasons for the
start of the project, goals, and relationship to other development projects. We found the
projects in each of the 6 categories could be differentiated by the evidence of activity on

21
SourceForge and the degree to which they emphasized information in these three categories.
We describe each of the six categories of projects based on these differences.
Cell A: User-Centered. The projects in cell A increased in both size and structural
complexity. Supplemental analysis (see Table 2) showed these projects were successful
(relative to the other categories) across both usage indicators (high numbers of downloads and
bug report activity) and development indicators (high total number of releases and cvs
commits, as well as continued activity after 1 year). Almost all of these projects utilized their
SourceForge webspace. These projects provided a great deal of information targeted toward
users, and general information about the project. For example, they tended to have
information showcasing features and facilitating use including screen shots, pointers to
related applications, and user manuals. They did not emphasize development information.
The holistic picture that emerges is of a group of projects that live up to an OSS ideal of
creating useful, successful software, but seem to follow the pattern of increasing complexity
that has been commonly observed in proprietary settings (Belady and Lehman 1976). Based
on their focus on user information and success on usage indicators, we label these projects
“User Centered.” 21.1% of the projects in the sample fit in this category.
Cell B: Controlled. The projects in cell B had high growth in size while structural
complexity decreased or fluctuated. Like the projects in cell A, supplemental analysis showed
that these projects were quite successful across both usage indicators and development
indicators. All of these projects have websites, and many of them provide detailed
information to encourage development, including listing contributors and providing
guidelines for developers. These projects often have detailed procedures for participation, for
example, a specific list of needed features, methods of testing patches before submission, and
pointers to developer email lists. One project had 60 pages of developer guidelines. Overall,
qualitative assessment of the websites of these projects indicated that they tend to encourage
carefully managed development practices. The holistic picture that emerges is of a group of
projects that follow the classic type touted by proponents of open source: they create both
useful and high quality (i.e., low complexity) software. This is distinct from the projects in

22
cell A that create useful projects but do not appear to manage complexity. Based on their
apparent attention to the development process and their success in managing structural
complexity, we label these projects “Controlled.” 17% of the projects in the sample fall into
this category.
Cell C: Counter-cultural. Fluctuating size and increasing structural complexity
describe the evolution of projects in cell C. The supplemental analysis showed that these
projects had somewhat mixed success indicators: they have the highest average number of
developers and most of them continued to be active after the first year, however they did not
attract a very high number of downloads. Thus they appear relatively successful in attracting
development activity but not in attracting user interest. All used their web space, and they
were somewhat similar to the user-centered projects (cell A) in the kinds of information they
provided. It was mostly information about the project and information targeted at users, with
less emphasis on developer-oriented information. A unique characteristic of these projects
was that their websites tended to focus on connections outside the mainstream of open source
– e.g., they noted use of technologies outside SourceForge, use of the software by commercial
entities, and posted resumes of the developers. Two other unique characteristics also set these
projects apart from the OSS mainstream. First, they were less apt to follow the dictum
“release early, release often.” These projects released new versions on average every 99.71
days, in contrast to an average of 36.86 days for the entire sample. Second, whereas most
projects in the other categories used the GPL license, only half of these projects did so. The
holistic picture of this category is of a set of projects that, while technically open source, do
not adhere closely to the cultural norms of OSS. In many ways they appear to behave more
like closed development groups. Thus we label these projects “Counter-cultural.” This is the
smallest category of projects, comprising only 7.8% of the sample.
Cell D: Personal. In cell D, the evolutionary pattern is characterized by decreasing or
fluctuating structural complexity and fluctuating size. These projects did not achieve a high
degree of success: they had few developers, little activity, relatively few downloads, and most
did not survive beyond the first year. Just over half of these projects used the SourceForge

23
webspace, and these provided a modest amount of information about the project with little
targeted at users or developers. These projects are similar to a set of single developer projects
noted by Krisnamurthy (2002) in that they have the lowest average number of developers.
The webspace reflects this in that they tend to be written in the first person, and they express
the personal thoughts of the main developer. For instance, one author states “As a developer, I
value the Freedom the GPL provides. Don’t take it away from me...” The holistic picture that
emerges from the analyses is of a set of projects that are developed to meet personal goals
such as self expression or learning, and once these goals are satisfied, the project falls by the
wayside. Based on these characteristics, we label these “Personal.” 17.1% of the projects fell
into this group.
Cell E: Abandoned. Projects in cell E have evolutionary patterns characterized by
small increases in size accompanied by increases or fluctuations in structural complexity.
Supplemental analysis showed relatively low levels of development activity or user interest.
Compared to the growth categories (cells A and B), these projects provided little information
via the SourceForge websites. Half had no website at all. Of those that did have websites,
they mainly provided information about the project, with little information aimed at users or
developers. Some websites included reasons why the project owner cannot write code or
apologized for inactivity. One developer says “I’m really busy. I’m in the process of writing
my graduation paper.” Another states “I’ve gotten a full time job since my last update and
I’ve had a few other projects that needed more urgent attention.” The holistic picture that
emerges is another “classic” kind of OSS project: that which is abandoned before achieving a
notable level of success. These kinds of projects have also been observed by other studies
and labeled abandoned, dead and/or inactive (e.g. (English and Schweik 2007)). 23.7% of the
projects fell into this category.
Cell F: Intractable. Projects in cell F have evolutionary patterns that are
characterized by low growth in size and decreases in structural complexity. Analyses showed
this category to be similar to the abandoned (cell E) projects in terms of relatively low
indicators of success. Only half of these projects had websites, and these tended to have

24
relatively low amounts of project, developer, and user oriented information. The main
characteristic that seems to set this category apart from others is a relatively high level of
structural complexity in the first release of the software (3.39 vs. 1.60 in the full sample). It
appears that these projects begin with relatively poor design, and some efforts are directed to
improving the design. For example, one project website states a decision to “abandon the
code base entirely and start from scratch.” However, for the most part these efforts do not
lead to success in that the ending structural complexity remains the highest of any category
(3.25 vs. 1.81 in the full sample), and relatively few of the projects continue to be active after
1 year. While at first glance this cluster would appear to represent projects that follow a
desirable pattern of some increase in size and some decrease in structural complexity, the full
analysis draws a different picture of projects that start with poor design and are not able to
overcome it. While the projects in this cell are similar to the projects in cell E because they
have limited signs of success, they are different from those in cell E because those in cell E
are distinguished by their developer’s leaving due to other commitments, while in these the
level of complexity seems to have created a barrier to continued activity. We therefore label
this group, “Intractable.” 13.2% of the projects fall into this category.
5 Discussion and Implications
This study provides a classification schema of OSS projects using a software
evolution lens. It developed the schema via a triangulation of quantitative and qualitative
analyses, observing projects in a comparatively holistic fashion as compared to prior work
that has focused exclusively on code (Godfrey and Tu 2002) or social characteristics of
projects (Stewart and Gosain 2006). The study uncovered 3 categories of projects (User
Centered, Controlled, and Counter-cultural) that were successful on at least one dimension
commonly used to evaluate OSS projects (i.e., development activity, survival, or usage).
These contrasted to 3 categories of projects (i.e., Personal, Abandoned, and Intractable) that

25
appeared generally unsuccessful across these dimensions. Before discussing the contributions
and implications for research and practice, we note some of the limitations of the study.
5.1 Limitations
The sampling strategy creates at least three possible limitations on the
generalizeability of the conclusions. First, by eliminating projects that represent multiple sub-
projects, the sample included relatively smaller and/or focused OSS efforts. While these
represent a high percentage of OSS projects; there are a small number of very large projects
that may not fit as well into the resulting categorization schema. In particular, it seems
unlikely that Abandoned, Personal, or Intractable projects will ever become large projects or
if they do, they may need to shift across categories in order to do so. Second, the problem
domains selected both focused on projects likely to be of most interest to technical audiences.
Other domains, such as games, could experience different patterns of evolution due to the
involvement of different kinds of stakeholders. Additional research is needed to assess
whether such differences exist. Finally, structural complexity measures are somewhat
language-dependent, and evolutionary paths could be influenced by the choice of
programming language.
In addition to limitations posed by the sampling strategy, there is some constraint
posed by the time horizon of the study. Based on prior work (Stewart et al. 2006b), we limited
our observation of evolution to the first year of each project’s public development on
SourceForge. While prior research suggests this is a critical period, and it is likely to capture a
significant portion of the development activity on most projects, it is possible that observation
over a longer timeframe could lead to modifications in the patterns observed. Finally, web
pages may change over time and this study represents their content at a single point in time, at
the end of our observation and data collection efforts. However, many projects that were no
longer active at that time still had websites posted, and it appeared those sites had not been
changed since activity ceased.

26
5.2 Implications for Research
Evolutionary Patterns. The analyses yielded several surprising findings regarding
the patterns uncovered and their association with different types of success. First, whereas
prior research on evolution in both closed and open settings has mostly observed projects that
follow patterns of increasing complexity (Godfrey and Tu 2002; Lehman 1980; Paulson et al.
2004)2 , the analysis here reveals 3 categories of OSS projects, representing 47% of the
sample, that do not follow this pattern. The Controlled, Personal, and Intractable projects
either decreased or fluctuated in complexity over time. The discovery of these categories
implies there may be a substantial portion of OSS projects that follow an evolutionary pattern
that, to date, has been rarely observed or studied. Such projects may provide an interesting
context for studying some of the recommendations made by (Lehman and Ramil 2001)
regarding the interplay between project management and complexity evolution.
Second, and perhaps most surprising given the general view that keeping complexity
low is positive (Baldwin and Clark 2006), is the fact that 2 of the categories with decreasing
or fluctuating structural complexity (Personal and Intractable) would by most commonly used
indicators be considered failures. These projects generated relatively low developer activity
and user interest, and few of them survived beyond the first year. In stark contrast to these,
examination of the User Centered projects yields a third surprising result, which is that
projects with steadily increasing complexity were some of the most successful, generating
relatively high levels of development activity and user interest as well as having high survival
rates. Taken together, these two surprising findings lead to the conclusion that controlling
complexity in OSS projects is neither necessary nor sufficient for success on other
dimensions.
This conclusion helps to shed light on some of the contrasting views in the literature
regarding the influence of software complexity for OSS projects. MacCormack et al’s (2006)
case study of Mozilla indicated that reducing complexity led to significantly greater success,
2 An exception is MacCormack (2006) who observed one project, Mozilla, that made a conscious effort to decrease complexity.

27
supporting the view that low complexity was necessary for the project to thrive. This result
was in keeping with Lehamn’s Laws and conclusions from studies of conventional software
development, indicating the positive outcomes of managing complexity and negative
outcomes of increasing complexity (Lehman 1980). However, case studies of Linux have
provided a surprising contrast to this result, showing both increasing complexity and stellar
performance (Godfrey and Tu 2002; Paulson et al. 2004). Our analysis indicates that while
Linux may be a unique OSS project in many ways, it is not unique in this. In fact, there is a
significant percentage of OSS projects that seem to resemble Linux (the User Centered
category), but there is also a significant percentage that exhibit the association between
managing complexity and success (the Controlled projects).
These observations where increasing complexity is associated with success and
apparent failure suggest that future research may fruitfully pursue an understanding of
multiple development gestalts leading to success as opposed to focusing purely on a need to
manage complexity, as might be suggested by assuming the application of Lehman’s Laws to
OSS projects (Lehman 1980). Further, since the literature suggests complex structures impact
product development beyond software (MacCormack et al. 2006), the impact of a product’s
complex structure should be considered for other communities that seek to innovate and are
facilitated by digital technologies. Distributed teams that rely on digital technologies may not
be affected by complex designs in the same way as face-to-face teams.
Success in OSS. In addition to considering the multiple evolutionary patterns that
may be associated with success, the results of this study suggest that future research should
also take a more careful approach to defining and measuring success in studies of OSS (and
related sampling issues). Among projects that common approaches to OSS success would
likely label “failures,” we differentiate three types. Of these, only one (Intractable projects)
seem to support a link between code quality and failure. For the Personal projects, “failure”
may simply indicate that the project has served the purpose of the founder and thus has in a
sense been completed. There is some supporting evidence for this view in English and
Schweik (2007) who note that a developer may consider a project a success if he learns from

28
it, even if it never releases software. Hence the identification of the Personal projects
category demonstrates that development activity may not be a goal for all projects, and
therefore this may not be an appropriate success measure in all studies. For studies aimed at
furthering our understanding of what factors lead to or inhibit development success, another
implication is that projects started mainly with personal goals may be less likely to attain this
kind of success.
The identification of the Counter-cultural projects yields two more important
implications for future studies of OSS success. This category demonstrates that success in
development activity and success in user interest may not always be linked, as some previous
work has implied (Stewart et al. 2006a). Thus high development activity should not be
assumed to lead to usage, and a potential moderator of this relationship may be the norms
followed by the project. Empirical work is needed to assess this suggestion. Second,
researchers using SourceForge to study aspects of “typical” OSS culture or work practices
(Elliot and Scacchi 2005) may wish to avoid sampling projects in the Counter-cultural
category, as these appear to be projects that use SourceForge, but behave more like closed
groups.
5.3 Implications for Practice
Findings yield implications for those considering adoption of OSS as well as for OSS
administrators or developers. Those considering adoption of a project relatively early in its
life may be critically concerned with the path that project is likely to follow. In particular,
users are likely to benefit more from software that follows a growth pattern over time or at
least continues to be maintained (i.e., survives) (Lehman and Ramil 2001). While by no
means definitive, results from this study imply that careful examination of the web pages of
projects could be helpful to potential users in assessing the likelihood of a project surviving
and/or following a growth trajectory. All of the projects with high survival rates (User
Centered, Controlled, and Counter-cultural) had web pages, and their web pages contained
detailed information for users and/or developers. Characteristics of web pages that might be

29
associated with projects less likely to survive would be ones that are written in the first person
or that contain very little information. We must point out that these observations are tentative
and future research is needed to confirm these associations with greater confidence.
For OSS project administrators or developers, we also highlight the association
between webpage content and survival, development activity, and usage outcomes. Results
point to the importance of publicly providing detailed information to facilitate development
and/or use. Further, assessment of the projects in the Intractable category implies that
projects are unlikely to be successful if their initial release is relatively high in structural
complexity. While some may hope that the OSS community can be leveraged to help “clean
up” and build upon software with initially low quality design, results of this study indicate
that such projects may tend to fail. Thus if a project founder has the goal of attracting
participation and developing the software, effort should be devoted to doing the “clean up”
before initial release.
5.4 Conclusion
The goal of this paper was to develop a software evolution based categorization
schema for the common types of OSS projects. To that end, we employed FDA to develop
understanding of evolution based on software releases, qualitative analysis to gather insight
from websites and analysis of archival data reflecting development and user activity on
SourceForge. The combination of these analyses enabled us to develop a six category
classification schema that identifies groups of projects with interesting and unique patterns of
software evolution and success. Results extend the research on OSS success and software
evolution by challenging common notions that complexity has primarily negative associations
with success. In contrast, we describe categories of projects that have both increasing
structural complexity over time and many strong indicators of project success as well as
categories that decrease structural complexity over time but have few indicators of success.
We hope these results encourage future research to take a more discerning view of the OSS
landscape.

30

31
Table 1: Descriptive Statistics – Code
All Projects User-Centered Controlled Counter-cultural Personal Abandoned Intractable
First Release Size 4426.93 4998.06 4148.31 8511.33 4340.69 3306.44 3553.70
Last Release Size 6519.68 8787.31 7762.54 12018.83 4842.85 4542.94 3714.30
First Release Structural Complexity 1.60 1.49 1.52 1.16 1.46 1.02 3.39
Last Release Structural Complexity 1.81 2.27 1.38 2.20 1.25 1.21 3.25
No. of Releases 6.47 9.69 9.31 4.00 5.23 4.83 3.70
Release Frequency 36.86 46.40 39.81 99.71 19.64 28.00 18.40
Active Life (in days) 161.00 235.38 255.15 278.33 111.00 83.83 54.10

32
Table 2: Descriptive Statistics – Supplemental Archival Data
All Projects User-Centered Controlled Counter-cultural Personal Abandoned Intractable
No. of Projects With Websites 53/70% 13/81% 13/100% 6/100% 7/53% 9/50% 5/50%
No. of Projects Using GPL 59/79% 13/81% 12/92% 3/50% 12/92% 14/78% 5/80%
Survival Indicator No. of Projects Surviving After 1 Year
32/42% 10/62% 8/61% 4/66% 3/23% 4/22% 3/30%
Development Activity Indicators
Avg. No. of Developers 2.13 2.38 3.15 3.50 1.33 1.67 1.40
Avg. CVS Commits 333.87 761.00 577.00 263.00 155.00 59.00 83.00
Usage Indicator
Avg. No. of Downloads 8,295.85 10,935.75 13,503.85 5,007.83 4,285.58 8,258.17 4,154.60
Avg. No. of Bug Reports 10.81 14.19 35.69 2.67 1.58 2.78 3.50

33
Table 3: Number of Projects in Each Evolution Pattern
Size
High Fluctuating Low Total
Str
uct
ura
l C
om
ple
xity
Increasing 16 6 15 37
Fluctuating 8 11 3 22
Decreasing 5 2 10 17
Total 29 19 28 76
Table 4: Six Category Schema
Size
High Fluctuating Low
Str
uct
ura
l C
om
ple
xity
Increasing
Cell A (16) User-
Centered
Cell C (6) Counter-cultural
Cell E (18)
Abandoned
Fluctuating Cell B (13)
Controlled
Cell D (13) Personal
DecreasingCell F (10)
Intractable
34
Table 5: Webpage Information Coding Schema
User Information
Features described Screenshots Manual/Instructions FAQ Install/Configuration Guide Examples Where to get help Foreign Translations Compatible software (is it OSS or for profit software) or operating systems Development Information
Release Notes Design Goals/choices Restructuring Plans Code Documentation Known Bugs Structure (server-client) Borrow code from other OSS projects Developer manual or other directions on how to develop on this project Information on Contributors Project Information
Status (acknowledge or explain inactivity e.g. got a new job?) History (e.g. why did it start/ where did project name come from) Goal To-do List / Help Wanted Connection to other project (note which project) Written in the first person (e.g. is there a lot of “I” did this) Information on Founder (is it a student project) Developer Resume Moved off SourceForge Solicit Donation Connection to organization (university, company, etc.) Is there evidence it was developed before released on SourceForge? Is it hosted on multiple platforms (i.e. KDE, Freshmeat, etc.) Do they mention publicity like press, blog announcements or other kinds of interactions?

35
Figure 1: Evolution of Size for 76 Projects
Figure 2: Evolution of Size - Mean Curves

36
Figure 3: Evolution of Structural Complexity for 76 Projects
Figure 4: Evolution of Structural Complexity – Mean Curves

37
References
Baldwin, C., and Clark, K. "The Architecture of Participation: Does Code Architecture Mitigate Free Riding in the Open Source Development Model," Management Science (52:7) 2006, pp 1116-1127.
Belady, L.A., and Lehman, M.M. "A model of large program development," IBM Systems Journal (3) 1976, pp 225-252.
Bieman, J.M., and Ott, L.M. "Measuring Functional Cohesion," IEEE Transactions on Software Engineering (20:8) 1994, pp 644-657.
Briand, L., Wust, J., Daly, J., and Porter, D.V. "Exploring the relationships between design measures and software quality in object-oriented systems," Journal of Systems and Software (51:3) 2000, pp 245-273.
Crowston, K., Howison, J., and Annabi, H. "Information Systems Success in Free and Open Source Software Development: Theory and Measures," Software Process Improvement and Practice (11) 2006, pp 123-148.
Darcy, D., Slaughter, S., Kemerer, C., and Tomayko, J. "The Structural Complexity of Software: An Experimental Test," IEEE Transactions on Software Engineering (31:11) 2005, pp 982-995.
DiBona, C., Ockman, S., and Stone, M. Open Sources: Voices from the Open Source Revolution O'Reilly, Sebastopol, CA, 1999.
Eick, S., Graves, T., Karr, A., Marron, J.S., and Mockus, A. "Does Code Decay? Assessing the Evidence from Change Management Data," IEEE Transactions on Software Engineering (27:1) 2001, pp 1-12.
Elliot, M., and Scacchi, W. Free Software Development: Cooperation and Conflict in A Virtual Organizational Culture Idea Publishing, Pittsburgh, PA, 2005, p. 20.
English, R., and Schweik, C. "Identifying Success and Tragedy of FLOSS Commons: A preliminary classification of Sourceforge.net Projects," in: First International Workshop on Emerging Trends in FLOSS Research and Development, Minneapolis, 2007.
Godfrey, M.W., and Tu, Q. "Growth, Evolution, and Structural Change in Open Source Software," International Conference on Software Engineering, proceedings of the 4th International workshop on Principles of Software Evolution, ACM Press, 2002, pp. 103-106.
Gorla, N., and Ramakrishnan, R. "Effect of software structure attributes software development productivity," Journal of Systems and Software (36:2) 1997, pp 191-199.
Haefliger, S., Krogh, G.v., and Spaeth, S. "Code Reuse in Open Source Software " Management Science (54:1), January 1 2008, pp 180-193.
Hahn, J., Moon, J.Y., and Zhang, C. "Emergence of New Project Teams from Open Source Software Developer Networks: Impact of Prior Collaboration Ties " Information Systems Research (19:3), September 1 2008, pp 369-391.
Hutchens, D.H., and Basili, V.R. "System Structure Analysis: Clustering with Data Bindings," IEEE Transactions on Software Engineering (11:8) 1985, pp 749-757.
Jackson, J. "Pentagon: Open source good to go," 2008. Jank, W., and Shmueli, G. Studying Heterogeneity of Price Evolution in eBay
Auctions via Functional Clustering, 2008.

38
Kemerer, C.F., and Slaughter, S.A. "An empirical approach to studying software evolution," IEEE Transactions on Software Engineering (25:4), July/August 1999, pp 493-509.
King, G., Keohane, R., and Verba, S. Designing Social Inquiry: Scientific Inference in Qualitative Research Princeton University Press, Princeton, New Jersey, 1994.
Kitchenham, B., Pickard, L., and Linkman, S. "An Evaluation of Some Design Metrics," Software Engineering Journal) 1990.
Kluyver, C.A.d., and Whitlark, D. "Benefit Segmentation for Industrial Products," Industrial Marketing Management (15) 1986, pp 273-286.
Kuk, G. "Strategic Interaction and Knowledge Sharing in the KDE Developer Mailing List," Management Science (52:7) 2006, pp 1031-1042.
Lakhani, K., and vonHippel, E. "How open source software works: "free" user-to-user assistance," Research Policy (32) 2003, pp 923-943.
Lee, G., and Cole, R. "From a Firm-Based to a Community-Based Model of Knowledge Creation: The Case of the Linux Kernel Development," Organization Science (14:6) 2003, pp 633-649.
Lehman, M.M. "Programs, Life Cycles, and Laws of Software Evolution," IEEE Transactions on Software Engineering (68:0) 1980, pp 1060-1076.
Lehman, M.M., and Ramil, J. "Rules and Tools for Software Evolution Planning and Management," Annals of Software Engineering (11) 2001, pp 15-44.
MacCormack, A., Rusnak, J., and Baldwin, C.Y. "Exploring the Structure of Complex Software Designs: An Empirical Study of Open Source and Proprietary Code," Management Science (52:7) 2006, pp 1015-1031.
Madey, G., and Christley, S. "F/OSS Research Repositories & Research Infrastructures," NSF Workshop on Free/Open Source Software Repositories and Research Infrastructures, University of California, Irvine, 2008.
Maznevski, M., and Chudoba, K. "Bridging Space over Time: Global Virtual Team Dynamics and Effectiveness," Organization Science (11:5) 2000, pp 473-492.
Mockus, A., Fielding, R.T., and Herbsleb, J.D. "Two Case Studies of Open Source Software Development: Apache and Mozilla," ACM Transactions on Software Engineering and Methodology (11:3) 2002, pp 309-346.
O'Reilly, T. "Lessons from Open Source Software Development," Communication of the ACM (42:4) 1999, pp 33-37.
Paulson, J., Succi, G., and Eberlein, A. "An Empirical Study of Open Source and Closed Source Software Products," IEEE Transactions in Software Engineering (30:4) 2004, pp 246-256.
Ramsey, J.O., and Silverman, B.W. Applied Functional Data Analysis: Methods and Case Studies Springer-Verlag, New York, 2002.
Raymond, E.S. The cathedral and the Bazaar: Musing on Linux and Open Source by an Accidental Revolutionary O'Reilly, Sabastopol, CA, 2001.
Shah, S. "Motivation, Governance and the Viability of Hybrid Forms in Open Source Software Development," Management Science) 2006.
Stewart, K.J., Ammeter, A.P., and Maruping, L.M. "Impacts of License Choice and Organizational Sponsorship on User Interest and Development Activity in Open Source Software Projects," Information Systems Research (17:2) 2006a, pp 126-145.
Stewart, K.J., Darcy, D.P., and Daniel, S.L. "Opportunities and Challenges Applying Functional Data Analysis to the Study of Open Source Software Evolution," Statistical Science (21:2) 2006b, pp 167-178.

39
Stewart, K.J., and Gosain, S. "The Impact of Ideology on Effectiveness in Open Source Software Development Teams," Management Information Systems Quarterly (30:2) 2006, p 291.
Straus, A. Qualitative Analysis for Social Scientists Cambridge University Press, New York, 1987.
Triantafyllos, G., Vassiliadis, S., and Delgado-Frias, J.G. "Software Metrics and Microcode Development: A Case Study," Journal of Software Maintenance: Reserach and Practice) 1996, pp 199-224.
Ulrich, K. "The role of product architecture in the manufacturing firm," Research Policy (24) 1995, pp 419-440.
van Antwerp, M., and Madey, G. "Advances in SourceForge Research Data Archive (SRDA)," Fourth International Conference on Open Source Systems, Milan Italy, 2008.
von Hipple, E., and von Krogh, G. "Open Source Software and the Private-Collective Innovation Model: Issues for Organization Science," Organization Science (14:2) 2003, pp 209-223.
von Krogh, G., Spaeth, S., and Lakhani, K. "Community, joining, and specialization in open source software innovation: a case study," Research Policy (32) 2003, pp 1217-1241.
Wang, Y., and Shao, J. "Measurement of the cognitive functional complexity of software," The Second IEEE International Conference on Cognitive Informatics, 2003, pp. 67-74.
Watson, R., Boudreau, M.-C., York, P., Greiner, M., and Wynn, D. "The business of open source," Communications of the ACM (51:4) 2008, pp 41-46.
Wheeler, D. "Why Open Source Software/Free Software (OSS/FS, FLOSS or FOSS)? Look at the Numbers!," 2007.
Yu, L., Schach, S., Chen, K., and Offutt, J. "Categorization of Common Coupling and Its Application to the Maintainability of the Linux Kernel," IEEE Transactions on Software Engineering (30) 2004, pp 694-706.

40
Appendix 1
Project Titles aamon muses airfart myserverweb aniclient nbpp apradar neshare asocket netbiosscan cppsocket netclass cpp-sockets netradar curlpp nget cyberoam nmstl cycles3d ogwnn-np dalp opengatekeeper dc-qt outgun eboard pebble-talk ehos pocketwarrior gnewtella prometeo-proxy gpigen ptypes gutenbrowser qsubnetcalc hlbot quickdc imageshare reliquary io-crusher remote-ppp ipupdater resiprocate kcmdhcpd rlplot kimagemapeditor serserv klapjack socketstream knetworkconf soulcatcher ksambakdeplugin spysig kssh ssobjects kwhois tptest kxmleditor tsync libcapsinetwork tuxpop libcw usagemeter libsmtp vmime libsocket vpndialer linc xmlrpcpp lisa-home xml-security-c masterserver xsltc mmc zige mnet znessus