Patterns of Differentiation and Hybridization in North ...
18
Patterns of Differentiation and Hybridization in North American Wolflike Canids, Revealed by Analysis of Microsatellite Loci Michael S. Roy, * Eli GefenJ Deborah Smith,? Elaine A. Ostrander,$ and Robert K. Wayne* 3-t_ *Institute of Zoology, Zoological Society of London; TDepartment of Biology, University of California, Los Angeles; and *Fred Hutchinson Cancer Research Center, Seattle Genetic divergence and gene flow among closely related populations are difficult to measure because mutation rates of most nuclear loci are so low that new mutations have not had sufficient time to appear and become fixed. Microsatellite loci are repeat arrays of simple sequences that have high mutation rates and are abundant in the eukaryotic genome. Large population samples can be screened for variation by using the polymerase chain reaction and polyacrylamide gel electrophoresis to separate alleles. We analyzed 10 microsatellite loci to quantify genetic differentiation and hybridization in three species of North American wolflike canids. We expected to find a pattern of genetic differentiation by distance to exist among wolflike canid populations, because of the finite dispersal distances of individuals. Moreover, we predicted that, because wolflike canids are highly mobile, hybrid zones may be more extensive and show substantial changes in allele frequency, relative to nonhybridizing populations. We demonstrate that wolves and coyotes do not show a pattern of genetic differentiation by distance. Genetic subdivision in coyotes, as measured by 6 and Gst, is not significantly different from zero, reflecting persistent gene flow among newly established populations. However, gray wolves show significant subdivision that may be either due to drift in past Ice Age refugia populations or a result of other causes. Finally, in areas where gray wolves and coyotes hybridize, allele frequencies of gray wolves are affected, but those of coyotes are not. Past hybridization between the two species in the south-central United States may account for the origin of the red wolf. Introduction In terrestrial vertebrates with limited mobility, genetic differentiation often either increases with the distance between populations or corresponds to the extent of topographic and habitat barriers. Speciation may occur either as a result of barriers to dispersal or if reproductive differences accumulate between ter- minal populations of a cline to form a ring species (Mayr 1963; Wake et al. 1989). In highly ambulatory species, which can exist in a wide range of habitats, persistent gene flow may stifle genetic differentiation and speciation. We have studied three species of North American wolflike canids, the gray wolf ( Canis lupus), coyote (C. Zatrans), and red wolf (C. rufus), which disperse over long distances in search of territories or mates and can live in a variety of habitats and consume a diversity of prey. Consequently, the degree of re- gional genetic subdivision among populations of wolf- like canids is expected to be small. However, because Key words: canids, microsatellites, genetic variation, gene flow, hybridization. Addressfor correspondence and reprints: Michael S. Roy, Institute of Zoology,ZoologicalSocietyof London, Regent’s Park, London NW 1 4RY, United Kingdom. Mol. Biol. Evol. 11(4):553-570. 1994. 0 1994 by The University of Chicago. All rights reserved. 0737-4038/94/I 104~0001$02.00 of the finite dispersal of individuals, a pattern of dif- ferentiation with distance between localities might occur across large geographic areas. Previous mito- chondrial DNA (mtDNA) analysis found no evidence of geographic differentiation among populations of coyotes even when they were separated by several thousand kilometers (Lehman and Wayne 199 1). This result is consistent with their recent range expansion into territories once occupied by gray wolves. In con- trast, the gray wolf showed significant subdivision, re- flecting the recent isolation of gray wolf populations caused by habitat fragmentation (Wayne et al. 1992). In the past few hundred years the relative abun- dance of coyotes and gray wolves has changed in dis- turbed habitats, resulting in hybridization between the two species. mtDNA analysis of wolves and coyotes throughout North America has shown that they have hybridized in Minnesota and southeastern Canada, areas where coyotes have recently increased in abundance and where gray wolf numbers have declined (Lehman et al. 199 1). Coyotes have been in Minnesota and eastern Canada for only ~90 years, and consequently the di- mensions of the hybrid zone may increase, given time and continued change in habitat structure (Nowak 1979; Jenks and Wayne 1992). 553
Transcript of Patterns of Differentiation and Hybridization in North ...

Patterns of Differentiation and Hybridization in North American Wolflike Canids, Revealed by Analysis of Microsatellite Loci
Michael S. Roy, * Eli GefenJ Deborah Smith,? Elaine A. Ostrander,$ and Robert K. Wayne* 3-t_ *Institute of Zoology, Zoological Society of London; TDepartment of Biology, University of California, Los Angeles; and *Fred Hutchinson Cancer Research Center, Seattle
Genetic divergence and gene flow among closely related populations are difficult to measure because mutation rates of most nuclear loci are so low that new mutations have not had sufficient time to appear and become fixed. Microsatellite loci are repeat arrays of simple sequences that have high mutation rates and are abundant in the eukaryotic genome. Large population samples can be screened for variation by using the polymerase chain reaction and polyacrylamide gel electrophoresis to separate alleles. We analyzed 10 microsatellite loci to quantify genetic differentiation and hybridization in three species of North American wolflike canids. We expected to find a pattern of genetic differentiation by distance to exist among wolflike canid populations, because of the finite dispersal distances of individuals. Moreover, we predicted that, because wolflike canids are highly mobile, hybrid zones may be more extensive and show substantial changes in allele frequency, relative to nonhybridizing populations. We demonstrate that wolves and coyotes do not show a pattern of genetic differentiation by distance. Genetic subdivision in coyotes, as measured by 6 and Gst, is not significantly different from zero, reflecting persistent gene flow among newly established populations. However, gray wolves show significant subdivision that may be either due to drift in past Ice Age refugia populations or a result of other causes. Finally, in areas where gray wolves and coyotes hybridize, allele frequencies of gray wolves are affected, but those of coyotes are not. Past hybridization between the two species in the south-central United States may account for the origin of the red wolf.
Introduction
In terrestrial vertebrates with limited mobility, genetic differentiation often either increases with the distance between populations or corresponds to the extent of topographic and habitat barriers. Speciation may occur either as a result of barriers to dispersal or if reproductive differences accumulate between ter- minal populations of a cline to form a ring species (Mayr 1963; Wake et al. 1989). In highly ambulatory species, which can exist in a wide range of habitats, persistent gene flow may stifle genetic differentiation and speciation. We have studied three species of North American wolflike canids, the gray wolf ( Canis lupus), coyote (C. Zatrans), and red wolf (C. rufus), which disperse over long distances in search of territories or mates and can live in a variety of habitats and consume a diversity of prey. Consequently, the degree of re- gional genetic subdivision among populations of wolf- like canids is expected to be small. However, because
Key words: canids, microsatellites, genetic variation, gene flow, hybridization.
Address for correspondence and reprints: Michael S. Roy, Institute of Zoology, Zoological Society of London, Regent’s Park, London NW 1 4RY, United Kingdom.
Mol. Biol. Evol. 11(4):553-570. 1994. 0 1994 by The University of Chicago. All rights reserved. 0737-4038/94/I 104~0001$02.00
of the finite dispersal of individuals, a pattern of dif- ferentiation with distance between localities might occur across large geographic areas. Previous mito- chondrial DNA (mtDNA) analysis found no evidence of geographic differentiation among populations of coyotes even when they were separated by several thousand kilometers (Lehman and Wayne 199 1). This result is consistent with their recent range expansion into territories once occupied by gray wolves. In con- trast, the gray wolf showed significant subdivision, re- flecting the recent isolation of gray wolf populations caused by habitat fragmentation (Wayne et al. 1992).
In the past few hundred years the relative abun- dance of coyotes and gray wolves has changed in dis- turbed habitats, resulting in hybridization between the two species. mtDNA analysis of wolves and coyotes throughout North America has shown that they have hybridized in Minnesota and southeastern Canada, areas where coyotes have recently increased in abundance and where gray wolf numbers have declined (Lehman et al. 199 1). Coyotes have been in Minnesota and eastern Canada for only ~90 years, and consequently the di- mensions of the hybrid zone may increase, given time and continued change in habitat structure (Nowak 1979; Jenks and Wayne 1992).
553

554 Roy et al.
Significantly, hybrid zones among the three species, if they occur, are likely to be substantial. In the absence of selection, the width of hybrid zones may be - 50 times the average dispersal distance (Barton and Hewitt 1989), which in gray wolves may be as much as 100 km (Mech 1987). Therefore, a hybrid zone between wolflike canids may be several thousand kilometers in width and may confound the process of genetic divergence. In fact, a hybrid zone more ancient and more extensive than that in eastern Canada may exist in the south-central United States and may involve all three species of North Amer- ican wolflike canids (Wayne and Jenks 199 1). In this region, habitat change caused by human development began several hundred years ago, with the arrival of Eu- ropean settlers. Therefore, the dimensions of a hybrid zone between the three species may be several times larger than the more recent zone in eastern Canada. In fact, previous mtDNA analysis has found that no pop- ulation of red wolf, extant or historic, contains phylo- genetically distinct mtDNA genotypes. Instead, all have genotypes similar or identical to those in gray wolves or coyotes. One explanation for this result is a hybrid origin for the red wolf (Wayne and Jenks 199 1; Jenks and Wayne 1992; Wayne 1992).
However, because the mitochondrial genome is generally maternally inherited without recombination, analysis of mtDNA polymorphisms may provide a biased description of gene flow and hybridization in wolflike canids. Therefore, previous conclusions require support from analysis of nuclear loci. Past analyses of allozyme polymorphisms have suggested that little dif- ferentiation exists among the three North American canids (Ferrell et al. 1978; Wayne and O’Brien 1987; Kennedy et al. 199 1; Wayne et al. 199 1 b). This result may be expected, because allozyme loci have low mu- tation rates of -lo-*/generation (Nei 1987) and be- cause the three North American wolflike canids diverged l-2 Mya ( Nowak 1978 ) . Consequently, few detectable sequence substitutions in allozyme loci are likely to have accumulated over so short a time period.
In this report, we analyzed variation in a class of hypervariable loci consisting of a .variable number of repeats of a simple nucleotide core sequence that evolves through the gain or loss of repeat units rather than through sequence substitutions. Simple repeat or mi- crosatellite loci are highly polymorphic, frequently with more than a dozen alleles at a single locus and having high mutation rates that are > 10 -4- 10 -5/generation. Simple repeat loci are abundant and widely dispersed in eukaryotic genomes, with 50,000- 100,000 loci exist- ing in species studied to date ( Litt and Luty 1989; Tautz et al. 1986; Tautz 1989; Weber and May 1989; Coma11 et al. 199 1; Moore et al. 199 1; Stallings et al. 199 1; Die-
trich et al. 1992; Ostrander et al. 1992). Microsatellite loci have been used intensively for gene mapping studies but rarely have been applied to the analysis of genetic variation between and within populations of plants or animals. Because of the high polymorphism and evo- lutionary rate characteristic of microsatellite loci, they are potentially very informative with regard to analyses of gene flow and hybridization.
We surveyed variation of 10 polymorphic micro- satellite loci to quantify the extent of genetic differen- tiation among populations of wolflike canids and to es- timate the effect of interspecific matings on allele frequencies in hybridizing populations. We analyzed populations where only gray wolves or coyotes are found, populations where both species exist but do not hybrid- ize, as suggested by mtDNA data, and populations where the mtDNA data suggest that hybridization has occurred. We also analyzed an eastern African population of golden jackals (C. aureus) that likely have been isolated from their close relatives in North America for ~0.5 Myr (Wayne et al. 1989; Girman et al. 1993; Van Val- kenburgh and Wayne, in press). Finally, we determined whether microsatellite data support a recent origin of the red wolf through hybridization of coyotes and gray wolves.
Material and Methods Nonhybridizing and Hybridizing Sympatric Populations of Coyotes and Gray Wolves
We obtained samples from three sympatric or near- sympatric populations of coyotes and gray wolves that do not hybridize, as suggested by mtDNA analysis (fig. 1; Lehman et al. 199 1) . The three populations are ( 1) Washington (coyotes, n = 20) and Vancouver Island (gray wolves, n = 20); ( 2) Alberta (gray wolves, n = 20; and coyotes, n = 20); and ( 3) Kenai Peninsula, Alaska (gray wolves, n = 19; and coyotes, n = 14 ) ( fig. 1) . The populations of gray wolves and coyotes sampled provide three independent replicates with which to measure in- tra- and interspecific differentiation in the absence of interspecific genetic exchange.
Hybridizing sympatric or near-sympatric popula- tions of coyotes and gray wolves were sampled in Min- nesota (coyotes, n = 20; and gray wolves, n = 20) and in Maine/southern Quebec (coyotes, n = 18; and gray wolves, n = 24). Past mtDNA analysis suggested that populations of both species hybridize in these two areas, with the frequency of hybridization highest in Quebec (Lehman et al. 1991).
Allopatric Populations
We obtained samples from both species in areas of allopatry. These areas include southern California (coy-

Microsatellite Variation in Wolflike Canids 555
no segregation of coyote-like phenotypic characteristics. Blood or organ samples were taken from coyotes, gray wolves, or red wolves, as indicated in previous reports (Lehman et al. 199 1; Lehman and Wayne 199 1; Wayne and Jenks 199 1; Wayne et al. 1992).
Microsatellite Analysis
Ten GT ( n ) microsatellite loci identified from a do- mestic-dog genomic library ( Ostrander et al. 1993 ) were found to be polymorphic in wolflike canids (Appendix). Detection of microsatellite alleles from genomic DNA was achieved by end-labeling one primer by a standard [y-P 32] ATP ( Amersham) and T4 polynucleotide kinase
of red wolves reaction (Sambrook et al. 1989) and performing 28 cy- cles of PCR ( polymerase chain reaction) amplification in a 25-~1 reaction volume using 50 ng of target DNA, 2 mM MgC12, and 0.8 U of Taq DNA polymerase ( Pro- mega). Two microliters of each product were then mixed with 2 ~1 of formamide loading dye and were heated to
FIG. 1 .-Sampling localities of gray wolves and coyotes. Locality 95°C for 5 min before being loaded onto a 6% sequenc- names in italics indicate areas where sympatric or near-sympatric wolf ing gel containing 50% (w/v) urea. An M 13 control and coyote populations were sampled; roman typeface indicates lo- sequencing reaction was run adjacent to the samples to calities in Northwest Territories and northern Quebec where only gray provide an absolute-size marker for the microsatellite wolves are found and in California where only coyotes are found. The northern-and-western boundary of the hybrid zone between gray wolves
alleles. Gels were then autoradiographed overnight.
and coyotes, as suggested by mtDNA evidence (Lehman et al. 199 1 ), is indicated by the dashed line. The historic range of the red wolf is Genetic Variability of Microsatellite Loci in Wolflike indicated by solid line (Wayne and Jenks 199 1). Boldface numbers in Canids parentheses indicate 6 values, between sympatric or near-sympatric populations of gray wolves and coyotes. Genetic polymorphism for each population was
measured as the mean number of alleles per locus (A ) , otes, n = 28)) Northwest Territories (gray wolves, n observed heterozygosity (Ho), and heterozygosity ex- = 24), and northern Quebec (gray wolves, n = 20). petted from Hardy-Weinberg assumptions (I& ; Nei Northern Quebec has not yet been invaded by coyotes, 1978, 1987). The two measures of heterozygosity are although this locality is only 400 km from the area of highly correlated, and we focused our discussion on HE sympatry for the two species (Hilton 1978). We also because it is considered a better index of genetic vari- obtained samples of 20 golden jackals (Canis aureus) ability ( Nei and Roychoudhary 1974). Deviations from from several sites in Kenya (Wayne et al. 1989 ) . Coyotes Hardy-Weinberg equilibrium were tested using the x2 are New World only, whereas wolves are also found in test with pooling (Hart1 and Clarke 1989). This test was the Old World but are not known from Africa. The used because of the presence of many rare alleles. Ge- golden jackal entered Africa -0.5 Mya, and conse- notypes were grouped into three classes for each locus quently the east African population probably was iso- (homozygotes for the most common allele, common/ lated from Old World gray wolves for that amount of rare heterozygotes, and other genotypes). The stan- time or longer (Wayne et al. 1989). dardized variance in allele frequencies among popula-
The red wolf sample consists of 40 individuals from tions (F,,) and other F-statistics (Wright 1969) were cal- the current captive population of - 180 red wolves. They culated for single- and multiple-allele cases by using are all descendants of individuals selected from the wild, modifications described by Nei ( 1977) and Nei and in 1974-76, to found a captive-breeding population. At Chesser ( 1983). We also used two other estimators of that time, the last wild population of red wolves was genetic subdivision, theta (6), developed by Weir and thought to exist in eastern Texas, and a live-trapping Cockerham ( 1984) and calculated using a computer program was initiated to save the species (Parker 1988). program provided by Leslie ( 1989), and the coefficient Captured individuals were initially classified as coyotes, of gene differentiation, Gst (Nei 1978). The variance red wolf-coyote hybrids, or red wolves. The latter were associated with 6 values was estimated by jackknifing interbred, and 14 individuals were selected for the cap- over all loci (Weir and Cockerham 1984). An estimate tive-breeding program because their offspring showed of migration rate was obtained from the relation FSt = 1 /

556 Roy et al.
( 1 + 4 Nm), where N is the population the migration rate.
size and m is
Gene Flow and Population Genetic Structure of Wolves and Coyotes
We followed an approach outlined by Slatkin ( 1993) to assess differentiation by distance between populations of wolflike canids. This approach involves the calculation of pairwise values of Nm, the number of migrants per generation, from both G,, (Nei 1973) and 6 (Weir and Cockerham 1984). The pairwise log( Nm) values were then compared with the geographic distance that separated each paired population, and the significance of the association was determined by ap- plying Mantel’s ( 1967) permutation test. A significant association between Nm and distance indicates genetic structuring in populations and that dispersal of individ- uals is limited ( Slatkin 1993 ) .
6 is a measure of differentiation between popula- tions and is particularly useful for estimating migration rates (Slatkin 1993). We used interspecific values of pairwise 6 to measure the amount of differentiation be- tween populations of wolves and coyotes. Values of 6 between paired populations of wolves and coyotes in nonhybridizing, and hybridizing regions were compared with a t-test on arcsine-transformed data. A t-test is ap- propriate when populations are not used more than once in pairwise comparisons. When a t-test was inappropriate (i.e., with nonindependent data), a permutation test was used (see below ) .
Allele Frequency Differences and Genetic Distance between Populations
We analyzed allele frequency differences between populations and species of wolflike canids, using three approaches. First, we calculated and compared the pro- portion of unique alleles in pairwise comparisons of populations and species. These values were needed, in addition to genetic distance statistics, because micro- satellite loci were very polymorphic, having many rare alleles in populations that would not otherwise add measurably to genetic-distance statistics.
Second, we used multidimensional scaling (MDS) to summarize allele frequency variation over all 10 mi- crosatellite loci. Linear MDS was used because it effec- tively summarizes allele frequency variation on two di- mensions and makes minimal assumptions about the distribution of the data (Borg 198 1) . A Pearson corre- lation matrix of allele frequencies was used as the initial data. The fit of the data to the model was estimated through a Shepard ( 1962) diagram and by the stress factor. The stress factor is a measure of the fit of the data into two dimensions, and it varies between 0 and
1, with values near 0 indicating a better fit. The program SYSTAT for the Apple Macintosh (Wilkinson et al. 1992) was used for these statistical calculations.
Finally, we computed Nei’s ( 1978 ) unbiased genetic distance statistic, among populations of North American wolflike canids and used a neighbor-joining clustering algorithm to generate relationship trees. The neighbor- joining clustering algorithm does not assume a constant rate of molecular evolution and in simulations was rel- atively effective in resolving relationships among taxa (Saitou and Nei 1987; Jin and Nei 199 1). Distance data were also analyzed with clustering algorithms such as UPGMA (unweighted pair group with mathematical average), distance Wagner (BIOSYS), and Kitsch and Fitch ( PHYLIP; Felsenstein 1993 ) . Heterozygosity es- timations and distance measures were calculated using the BIOSYS program for the PC (Swofford and Selander 198 1) and a computer program developed by Slatkin (1993).
Permutation Tests
Because the data were not independent, statistical significance of differences in 6 or genetic distance among paired coyote and gray-wolf populations were evaluated by a permutation test. The permutation test involved a comparison of the observed difference in 6 or genetic distance between hybridizing and nonhybridizing coy- ote-wolf populations to the comparable values calculated from randomized allele frequencies over all populations, with population size kept constant. Differences in 6 or genetic distance between hybridizing and nonhybridizing coyote-wolf populations were considered significant if the randomized value was uniformly greater than or less than the observed difference in 395% of 1,000 permu- tations.
Monte Carlo Simulations
To compare the number of alleles in species that differed in sample size, we calculated the expected num- ber of alleles in an infinite population by Monte Carlo simulations. We selected individuals at random, without replacement, and calculated the cumulative number of alleles until all individuals had been sampled. This pro- cedure was repeated 1,000 times for each species, and the mean and standard deviation of the number of alleles were calculated as a function of sample size. A quasi- Newton best-fit curve was then applied to the means ( SYSTAT; Wilkinson et al. 1992 ) by using the equation Y = o-xl@ + P), w h ere y is the number of alleles, and x is the number of individuals (Lehman and Wayne 199 1) . In this equation c1 and /3 are constants, where a is the asymptote representing the number of alleles in an infinite population.

When closely related species are compared, the number of unique alleles found within each species is a measure of genetic distinction. However, this is strongly influenced by the sample size and geographic scope of the sampling within each taxon. Although our sample of gray wolves and coyotes was comprehensive, the sam- ple of red wolves represented only 14 founding individ- uals from a single locality. We calculated the expected number of unique alleles for each species in comparison with another species, given different sample sizes, using Monte Carlo simulations as above.
Finally, to determine the specific probability of ob- serving the actual number of unique alleles found in the red wolf, we selected 14 individuals at random from a single population of either wolves or coyotes and com- puted the number of unique alleles that they exhibited when compared with the pool of all populations from the other species. This simulation was repeated 1,000 times.
Results Genetic Variability of Microsatellite Loci in Wolflike Canids
The 10 simple sequence loci were highly poly- morphic in all four species of wolflike canids (table 1, fig. 2, and Appendix). In North American wolflike can-
Microsatellite Variation in Wolflike Canids 557
ids, the mean number of alleles per locus (allelic diver- sity) ranged from 3.4 (Vancouver Island wolves) to 6.9 (California coyotes). We estimated the expected total number of alleles for the 10 loci in a gray-wolf population of infinite size by Monte Carlo simulation, as 98 alleles (fig. 3 ). The actual number of observed alleles in 15 1 individuals was 95, or 96.9% of this value. For coyotes, the total number expected in an infinite population was 97. The observed value was 92 alleles in our sample of 142 individuals, or 94.8% of that expected in an infinite population (table 2 and fig. 3). In the east African golden jackal sample of 18 individuals, we observed 48 alleles, or 84.2% of the 57 alleles expected in an infinite popu- lation (table 2 and fig. 4). These results indicate that our sample of gray wolves, coyotes, and golden jackals provides a good representation of the total number of alleles present in the populations sampled.
Expected heterozygosity values were high and var- ied within a narrow range (table 1) . The wolves on Van- couver Island showed the lowest levels of heterozygosity (0.566)) and it is notable that the hybridized population of Quebec wolves showed the highest heterozygosity (0.741). Allele frequency distributions in general were highly skewed and inequitable, as most loci had a few frequent alleles and many rare alleles (e.g., see fig. 2). Some loci also showed disjunct distributions having allele
Table 1 Sample Size, Allelic Diversity (i.e., Number of Alleles per Locus), and Heterozygosity, Averaged over 10 Microsatellite Loci Surveyed in Wolflike Canid Populations
MEAN HETEROZYGOSITY
POPULATION MEAN SAMPLE SIZE MEAN ALLELIC DIVERSITY Observed Expecteda
Gray wolf: Vancouver . . . . . . . . . . Kenai . . . . . . . . Alberta . . . . . . . . . . . . Minnesota . . . . . . . . . . Southern Quebec . . . . . . Northern Quebec . . . . . . . . Northwest Territories . . . .
Coyote: Washington . . . . . . . . . . Kenai . . . . . . . . . . . . . . . . . Alberta . . . . . . . . . . . Minnesota . . . . . . . . . . . Maine . . . . . . . . . . California . . . . . . . . .
Red wolfi Captive colony . . . . . . . . .
Golden jackal: Kenya . . . . . . . . . . . . . . . . .
12.6 (20.5) 3.4 (20.3) 0.42 1 (kO.070) 0.566 (kO.045) 18.9 (kO.1) 4.1 (kO.5) 0.536 (kO.063) 0.58 1 (+0.030) 18.2 (kO.3) 4.5 (kO.4) 0.605 (kO.063) 0.668 (kO.039) 19.8 (kO.2) 6.3 (kO.6) 0.532 (kO.052) 0.686 (kO.041) 20.0 (* 1.2) 6.4 (kO.7) 0.593 (20.064) 0.741 (kO.035) 13.3 (k1.5) 4.1 (kO.7) 0.533 (kO.069) 0.565 (kO.042) 20.9 (kO.5) 6.4 (kO.9) 0.547 (kO.087) 0.72 1 (kO.049)
15.9 (k1.1) 5.8 (kO.8) 0.540 (kO.075) 0.666 (kO.086) 12.8 (kO.3) 4.9 (kO.8) 0.554 (kO.097) 0.627 (kO.08 1) 16.8 (kO.5) 6.1 (kO.8) 0.653 (kO.060) 0.702 (kO.05 1) 18.4 (kO.6) 5.7 (kO.7) 0.649 (kO.067) 0.709 (kO.042) 16.2 (kO.5) 6.1 (kO.8) 0.596 (a0.072) 0.702 (kO.052) 22.1 (kO.9) 6.9 (k1.1) 0.502 (kO.095) 0.644 (kO.092)
29.9 (k1.0) 5.3 (kO.8) 0.507 (kO.082) 0.548 (20.072)
16.4 (kO.7) 4.8 (kO.8) 0.412 (kO.095) 0.520 (+O. 103)
NOTE.-Data in parentheses are standard errors. ’ Calculated using BIOSYS (Swofford and Selander 1981).

558 Roy et al.
0.8 1 COYOTES m Non-hybridizing populations 0 Hybridizing populations
0.8 1 GRAY WOLVES
0.6
n I
D
1-O
O-8
O-6
O-4
0.2
0.0
LOCUS 123
COYOTES W Non-hybridizing populations 0 Hybridizing populations
0.6 1 GRAY WOLVES
0.6
0.4
O-2
0.0 A 6 c D E F G
LOCUS 204
size classes separated by several dinucleotide steps (e.g., Hardy-Weinberg equilibrium (P < 0.05; x2 test with loci 172, 250, and 225; fig. 2 and Appendix). pooling). In the two hybridizing gray-wolf populations,
Most populations had some loci that deviated from one locus in southern Quebec and six loci in Minnesota Hardy-Weinberg equilibrium expectations. For the four deviated from expected Hardy-Weinberg genotype pro- nonhybridizing populations of gray wolves, 1 of 10 loci portions. The allopatric population of gray wolves in the in each population showed significant deviations from Northwest Territories had five loci not in Hardy-Wein- the genotype proportions expected according to the berg equilibrium. On average, two loci in the three non-

Microsatellite Variation in Wolflike Canids 559
0.5 1 COYOTES m Non-hybridizing populations 0 Hybridizing populations
0.6 1 GRAY WOLVES
0.5 -1
ABCDEFGHIJKLMNOPQRST
LOCUS 213
FIG. 2.-Frequency histograms for three microsatellite loci in six coyote and seven gray-wolf populations. In the gray-wolf histogram, populations are Vancouver, Kenai, Alberta, northern Quebec, Northwest Territories, Minnesota, and southern Quebec. In the coyote histogram, populations are Washington, Kenai, Alberta, Minnesota, Maine, and California.
hybridizing coyote populations, one and a half loci in the two hybridizing populations, and three loci in the California population differed significantly from Hardy- Weinberg expectations. The golden jackal had 1 of 10 loci differing from Hardy-Weinberg expectations. No loci dominated the group that deviated from Hardy-Wein- berg expectations.
In all populations, average observed heterozy- gosity was always less than the expected heterozygos- ity, suggesting an increase in homozygosity due to breeding among close relatives (table 1). The effect of nonrandom mating on heterozygosity in a subpop- ulation is measured by the inbreeding coefficient, Fis. Values Of Fis in nonhybridizing and hybridizing wolves are 0.120 and 0.19 1, respectively. The corresponding values in coyotes are 0.120 and 0.090. Because these values are positive, they indicate that the departure in nonrandom breeding within subpopulations is due to limited inbreeding (Wright 1969; Hart1 and Clarke 1989).
Gene Plow and Population Genetic Structure of Wolves and Coyotes
We measured isolation with distance by comparing pairwise values of Nm with geographic distance between localities ( fig. 5 ) . This relationship is not significant for populations of gray wolves or coyotes (P > 0.05; Mantel test), which suggests that differentiation by distance is not evident in either species. Similarly, examination of allele distributions indicates that the alleles having the highest frequencies generally have wide distributions (e.g., see fig. 2). Only a few alleles have frequencies > 10% and show locality specific occurrences (e.g., locus 172, allele J; locus 250, allele Q; locus 377, allele B; and locus 2 13, allele A; fig. 2 and Appendix). However, nonhy- bridizing gray wolves showed, on average, significantly higher 6 values than did nonhybridizing coyotes; these values were 0.168 and 0.107, respectively (P = 0.034; permutation test). This suggests that a lower level of interpopulation gene flow occurs between wolves than between coyotes.


Microsatellite Variation in Wolflike Canids 561
Table 2 Number (Proportion) of Unique Alleles Observed
Coyote Gray Wolf Red Wolf Golden Jackal
Coyote (92 alleles) . . . . 16 (0.17) 39 (0.42) 56 (0.61) Gray wolf (95 alleles) . . 19 (0.20) 46 (0.48) 60 (0.63) Red wolf (53 alleles) . . . 0 (0.00) 4 (0.08) 24 (0.45) Golden jackal (48 alleles) . . 12 (0.25) 13 (0.27) 19 (0.40)
NOTE.-Paired comparisons in this table are not symmetric. The data are the no. of unique alleles found in species listed in the left-hand column when they are compared with species listed in the col. heads.
of unique alleles on the number of individuals sampled. The asymptotic values for number of unique alleles in gray wolves compared with coyotes is 20.3, and the con-
P 2 40 Q
otv. 1. I *r .,.,.I.,.,.,.,
0 2 4 6 8 10 12 14 16 18 20
Number of individuals used
50
u) 1 i 40 B i 6 $ 30
- 1 r 5 ; x4-
5 C 8. ; lo-
O~.,.,~,~,.,.,.,.,.,., 0 2 4 6 8 10 12 14 16 18 20
Number of Individuals used
FIG. 4.-Results of Monte Carlo simulation of selecting golden jackals at random, without replacement, and counting the cumulative nos. of alleles and unique alleles. a, Total no. of alleles (y = [57.0x/ (x+4.1 )] ; r2 = 0.99; P<O.OO 1). b, No. of unique alleles when compared with coyotes (v = [14.3x/(x+3.6)]; r2 = 0.99; P<O.OOl). c, No. of unique alleles when compared with gray wolves (y = [ 16.1 x/(x+5.0)]; r2 = 0.99; P<O.OO 1) .
verse is 23.8 unique alleles (fig. 3 ) . The comparative values for golden jackals are 14.3 and 16.1 (fig. 4). These regressions can be used to predict the number of shared alleles between two species, given various sample sizes. For example, assuming that the gray wolf sample may be used to estimate the number of unique alleles expected in the 14 founding red wolves, we would predict 6.1 ( + 1.9) unique alleles in comparison with coyotes (fig. 3). Conversely, if we use the coyote sample to estimate the number of alleles expected in red wolves, we would predict 5.4 ( f 1.4) unique alleles in a comparison with gray wolves. Even in a sample of seven red wolves, we expect 4.0 ( + 1.7) and 3.3 ( f 1.3 ) unique alleles in com- parisons with coyotes and gray wolves, respectively. The actual number of unique alleles in red wolves compared with coyotes and gray wolves is zero and four unique alleles, respectively ( table 2 ) .
The differences in gene frequency among popula- tions of wolflike canids were summarized using MDS (fig. 6). The position of populations within the graph suggests that coyotes are very similar to each other in gene frequency, forming a closely spaced cluster. In con- trast, gray wolves are considerably more divergent in allele frequencies. Nonhybridizing populations are dis- tinct from hybridizing populations of gray wolves in Minnesota and southern Quebec (fig. 6). It is notable that northern Quebec wolves are more similar to the nonhybridizing populations of gray wolves that are sev- eral thousand kilometers distant than to nearby southern Quebec wolves (fig. 1). The red wolf is intermediately positioned between coyotes and hybridized populations of gray wolves. The golden jackal is clearly the most divergent wolflike canid with respect to allele frequencies.
Nei’s unbiased genetic distance was calculated be- tween all populations of North American wolflike canids and was found to vary from 0.116 (Washington and Californian coyotes) to 0.87 1 (Vancouver wolves and Alberta coyotes; table 3 ) . The average genetic distance between hybridizing populations of wolves and all coyote populations is 0.415, a value significantly less than that between nonhybridizing wolves and all coyotes (0.609)

562 Roy et al.
GRAY WOLVES COYOTES 0.9
0 O 0.8 0
0 0.7
0.8 1
0.0 c_ 2.8
0 I . , - I - I - 1
3.0 3.2 3.4 3.6 3.8
0.6
1
0
s
0.4
g 0.2
$ A 0.0
a Non-hybridizing 0 Hybridizing
0.6 a l O O0 0 ‘0 0
:L-2_- 2.8 3.0 3.2 3.4 3.6 3.8
0.8 - 0 0.7 -
0 0
0.6 - 0.5 - 0
0.4 - . 0 l 0
0.3 - l % 0.2 - 0
0.1 -
0.0 I * I . I . I . I 2.8 3.0 3.2 3.4 3.6 3.8 2.8 3.0 3.2 3.4 3.6 3.8
Log Distance Log Distance
FIG. 5.-Scatterplot of the log values of 6, G,,, and geographic distance between localities for nonhybridizing and hybridizing populations of wolves and coyotes.
(P c 0.00 1; permutation test). The genetic distance es- timates suggest that southern Quebec wolves are more similar in allele frequency to Maine coyotes (0.225 ) than to conspecific populations. It is notable that the genetic distance between wolves from northern Quebec and those from Kenai (0.252), two populations separated by 4,000 km, is less than that between wolves from northern Quebec and those from southern Quebec (0.344)) separated by only 400 km.
Relationship trees based on Nei’s unbiased genetic distance statistic and the neighbor-joining algorithm af- firm the conclusions suggested by multidimensional scaling and genetic distance values (fig. 7). Coyotes form a closely related cluster despite large geographic sepa- ration between localities. Gray-wolf populations show greater divisions, with hybridizing populations of gray wolves most divergent and positioned as sister taxa to red wolves and coyotes. Finally, red wolves are placed closest to coyotes, reflecting their similarity in allele fre- quencies. Other clustering algorithms-UPGMA, dis- tance Wagner, Fitch and Kitch-produced similar to- pologies, differing only in clustering of the coyote populations and some nonhybridizing wolf populations.
The golden jackal was the most basal branch in every tree.
Discussion Genetic Variability of Microsatellite Loci in Wolflike Canids
Microsatellite loci are highly polymorphic in gray wolves and coyotes, having 4-20 alleles/locus and het- erozygosity values that average -0.65. Such high het- erozygosity is expected for microsatellite loci, given their high mutation rates and the moderate population sizes of gray wolves and coyotes. For example, at equilibrium, H = 1 - [ 1 / ( 1 + 8N,p)Oe5 1, where p equals the single- step mutation rate and N, equals effective population size ( Ohta and Kimura 1973 ) . For a single-step micro- satellite mutation rate of - 10 -4 (Dallas 1992; Dietrich et al. 1992)) an effective population size of only 10,000 individuals would sustain heterozygosity values of 0.65. Past effective population sizes of wolves and coyotes were likely to have been at least this large (Carbyn 1987; Voigt and Berg 1987; Lehman and Wayne 199 1; Wayne et al. 1992).

564 Roy et al.
the most recent Ice Age ( 10,000 years ago) in two or more separate refugia, one in Alaska and the other in the southern continental United States (Nowak and Paradiso 1983 ) . The separation of wolf populations by continental ice sheets may have provided a barrier to dispersal for wolves and may have permitted limited differentiation, which subsequently would have been gradually obscured by gene flow. An equilibrium be- tween drift, mutation, and gene flow might not be ex- pected for m 2N, generations. Given historic population sizes in excess of several hundred thousand individuals (Seton 1925; Carbyn 1987), equilibrium may not have been reached since the last glaciation. Moreover, the habitat continuity across the geographic range of gray wolves has changed dramatically since the arrival of Eu- ropean settlers. The fragmented landscape that has de- veloped in southern Canada over the past 300 years may have imposed a degree of isolation among gray-wolf populations and may have resulted in the observed higher levels of population differentiation (see discussion in Wayne et al. 1992).
Allele Frequency Differences between North American Wolflike Canids
Hybridizing populations of gray wolves and coyotes converge in allele frequency, as indicated by their sim- ilarity in MDS and genetic distance analyses. Addition- ally, pairwise 6 values between sympatric populations of gray wolves and coyotes are significantly lower in areas where they hybridize. Hybridization has the most influ- ence on the allele frequencies of southern Quebec gray wolves, as indicated by the low value of 6 (0.09) between
- Go’den jacka’
1 Kenai
Northwest Territories
F Alberta
Vancouver I 1
I 1 - N. Quebec J
NON-HYBRIDIZING GRAY WOLVES
COYOTES
FIG. 7.-Neighbor-joining tree of wolflike canid populations, based on Nei’s ( 1978) genetic distance statistic.
them and Maine coyotes. In contrast, the value of 6 between nearby wolves from northern Quebec, where coyotes are absent, and Maine coyotes is as high as that between nonhybridizing populations, suggesting that a coincident clinal change in allele frequency is not the cause of lower interspecific 6 values. Increased inter- specific hybridization in southern Quebec is also sup- ported by previous mtDNA studies, which found only
Table 3 Nei’s Unbiased Genetic Distance (above Diagonal) and Genetic Identity Canids
(below Diagonal), between Populations of Wolflike
1 2 3 4 5 6 7 8 9 10 11 12 13 14 15
Wolves: 1. Vancouver . . 2. Kenai . . . . . . . . . 3. Alberta . . . . . . 4. Minnesota . . . 5. Southern Quebec . . . 6. Northern Quebec . 7. Northwest Territories .
Coyotes: 8. Washington . . . . 9. Kenai . . . . . . . . . 10. Alberta . . . . . . . 11. Minnesota . . . 12. Maine . . . . 13. California . . . . . . . .
14. Red wolf . . . . . . 15. Golden Jackal . . . . . . .
0.243 0.300 0.672 0.519 0.418 0.259 0.712 0.813 0.871 0.728 0.662 0.672 0.662 1.217 0.784 0.214 0.425 0.272 0.208 0.223 0.540 0.581 0.624 0.559 0.525 0.535 0.671 0.841 0.74 1 0.807 0.408 0.295 0.374 0.182 0.437 0.578 0.527 0.491 0.566 0.522 0.603 1.219 0.511 01654 0.665 0.135 0.296 0.468 0.345 0.423 0.445 0.402 0.385 0.448 0.323 1.284 0.595 0.762 0.745 0.874 0.28 1 0.25 1 0.240 0.325 0.342 0.393 0.225 0.261 0.255 1.089 0.659 0.812 0.688 0.744 0.755 0.357 0.565 0.642 0.429 0.427 0.461 0.480 0.466 1.015 0.772 0.800 0.834 0.627 0.778 0.700 0.387 0.5 10 0.413 0.425 0.497 0.393 0.534 0.985
0.491 0.583 0.646 0.708 0.787 0.568 0.679 0.190 0.233 0.221 0.200 0.116 0.309 1.108 0.443 0.559 0.561 0.655 0.723 0.526 0.600 0.827 0.271 0.212 0.214 0.190 0.365 1.761 0.419 0.536 0.590 0.641 0.710 0.651 0.662 0.792 0.763 0.123 0.091 0.228 0.358 1.183 0.483 0.572 0.612 0.669 0.675 0.652 0.654 0.802 0.809 0.884 0.106 0.248 0.418 1.066 0.5 16 0.591 0.568 0.680 0.799 0.630 0.608 0.819 0.807 0.913 0.899 0.181 0.323 1.183 0.511 0.586 0.593 0.639 0.770 0.619 0.675 0.891 0.827 0.796 0.780 0.834 0.27 1 1.303 0.516 0.511 0.547 0.724 0.775 0.627 0.586 0.734 0.695 0.699 0.659 0.724 0.763 1.459 0.296 0.431 0.296 0.277 0.336 0.362 0.373 0.330 0.172 0.306 0.344 0.307 0.272 0.232

In both gray-wolf and coyote populations, devia- tions from Hardy-Weinberg expectations were common, and average observed heterozygosity was always less than expected. Moreover, the values of rj;:, in both species were positive. These results suggest either limited in- breeding within populations or a nonrandom sample of individuals within populations. Gray-wolf packs gen- erally consist of related individuals (Lehman et al. 1992)) and, consequently, our population samples may be dominated by related individuals from a few packs. The social structure of coyotes is more varied, ranging from a solitary lifestyle to a defined pack structure (Voigt and Berg 1987). This is consistent with the observed lower Fis values in coyotes, reflecting either a more random sampling or less inbreeding within populations.
Alternatively, the presence of null alleles at micro- satellite loci may result in higher apparent values of ho- mozygosity (Chakraborty et al. 1992). This possibility could have been tested if samples of detailed pedigrees were available. However, two populations of Ethiopian wolves (Canis simensis) that were surveyed for 9 of 10 microsatellite loci used in the present study did not de- viate from Hardy-Weinberg expectations (Gottelli et al., in press). Ethiopian wolves depart from a gray wolf- like pack structure because females will mate with wolves from other packs, in addition to the dominant male (C. Sillero-Zubiri and D. Gottelli, personal communica- tion ) . Consequently, Ethiopian wolves may more closely approach random mating within populations.
Gene Flow and Population Structure of Wolves and Coyotes
Gray wolves and coyotes disperse over long dis- tances and over sizable topographic and habitat barriers, in search of territories and mates. In such species, the
1
.5
0 r
,i -.5
E a -1
E .I P -1.5
. MNNESOTA WOLVES
0 RED WOLF
GRAY WOLVES NON-HYSRlDlZiNG
COYOTES
-1.2 -1 -.0 56 DimensioOn -.4 52 ‘2 .4 .6 .6 1
2
FIG. 6.-MDS analysis of allele frequency data for 10 microsatellite loci in three species of wolflike canids.
Microsatellite Variation in Wolflike Canids 563
observed differentiation among populations may reflect the dispersal distance of individuals. For example, in a continuum model, FSz can be estimated as l/[ 1 + 4c(rcDs*)], where c is a constant, D is a measure of the density of demes, and s* is the dispersal distance variance (Slatkin and Barton 1989). If differentiation among populations is determined by the limited dispersal of individuals, the proportion of among-population al- lele-frequency variation should increase with increasing geographic distance between localities. Our microsatellite results show that differentiation by distance is not sig- nificant across the geographic range of the gray wolf and coyote, indicating either that dispersal distances are suf- ficiently large to confound genetic differentiation or that barriers to dispersal are more important in structuring genetic variation within species (Slatkin 1993; see below ) .
The effect of dispersal distance on levels of among- population differentiation is also evident in mtDNA studies of several canid species (Wayne et al. 1989, 199 la; Lehman and Wayne 199 1; Mercure et al., in press). Among coyote populations, the amount of mi- tochondrial genetic subdivision, as indicated by average Nsl, an analogue of Fst , was small (0.20) and not sig- nificantly different from 0. Similarly, the average value for 6 based on microsatellite analysis was low (0.09 ) . In contrast, in the diminutive North American kit fox ( Vulpes macrotis) , the average N,, was 0.85, reflecting lower dispersal distances (Mercure et al., in press). In- dividual coyotes have been observed to disperse several hundred kilometers, whereas dispersing kit foxes move only a maximum distance of 64 km ( O’Farrell 1987 ) .
It is surprising that the component of genetic vari- ation among wolf populations, 6 or Gst, is larger than that among coyote populations, despite the fact that coyotes are smaller in body size and presumably less mobile. The average 6 based on microsatellite analysis of nonhybridizing gray-wolf populations is 0.168. mtDNA analysis also reveals high N,, values (0.76) that are significantly different from 0 (Wayne et al. 1992). However, the value of 6 does not increase with distance between localities. We hypothesize that the larger 6 value in gray wolves versus coyotes may reflect differences in the recent population history of the two species. Coyotes show weak differentiation probably because they have expanded their range only in the past few hundred years, from a much narrower geographic distribution, in the American South, that was not marked by distinct to- pographic or habitat barriers (Hilton 1978; Nowak 1979; Voigt and Berg 1987 ) .
In contrast, gray wolves have existed throughout much of North America for most of the late Pleistocene ( N 500,000 years; Nowak 1979) and have likely survived

Microsatellite Variation in Wolflike Canids 565
coyote-derived mtDNA genotypes in southern Quebec wolves. The decrease in the value of 6 in hybridizing populations of wolves and coyotes compared with those that do not hybridize suggests an exchange of approxi- mately two migrants per generation, which is sufficient to dampen divergence by genetic drift in the absence of selection (Slatkin 1987; Lehman et al. 199 1).
The observation that hybridizing and nonhybridiz- ing populations of coyotes do not have significantly dif- ferent interspecific pairwise 6 values suggests that gene flow from wolves has not significantly affected coyote allele frequencies. The MDS and clustering analysis also support this conclusion, as hybridizing populations of coyotes are closely grouped with coyote populations that are nonhybridizing, including those from California (figs. 6 and 7). In contrast, hybridizing populations of wolves are genetically distinct from coyotes and their nonhy- bridizing conspecifics (fig. 6). This genetic asymmetry is also apparent in past mtDNA analysis, as coyote ge- notypes were found to be common in gray wolves but wolf genotypes were absent from coyote populations (Lehman et al. 199 1). The mtDNA result is consistent with the predominant interspecific cross occurring be- tween female coyotes and male wolves, whose offspring backcross to either species. Because of the maternal in- heritance of mtDNA, only the coyote genotype would be transferred to wolves. However, the microsatellite data suggest that the backcross to coyotes is infrequent and that, more commonly, interspecific hybrids are raised as wolves and incorporated into the gray-wolf breeding population.
The Origin of the Red Wolf
Since the beginning of this century, red wolves have declined dramatically throughout their geographic range in the southeastern United States, leading to their ex- tinction in the wild circa 1975. As red wolves became rare, hybridization between them and coyotes increased such that red wolves captured later than 1940 showed apparent phenotypic effects of hybridization (Nowak 1979). The 14 red wolves that founded the captive col- ony, whose descendants are analyzed in the present study, were carefully selected from a much larger pool of coyote and red wolf-like canids captured in 1974- 76. Previous mtDNA analysis showed that red wolves from the captive colony and 77 individuals from the original pool of coyote and red-wolflike canids had ge- notypes identical or very similar to those found in gray wolves or coyotes. Likewise, a sample of six red wolves from five states collected prior to 1920 showed only gray wolf-like or coyote-like genotypes. These results indicate that the red wolf hybridized with gray wolves and coy- otes, two species with which they shared parts of their
geographic range in historic times (Nowak 1979; Carbyn 1987; Jenks and Wayne 1992).
Morphological studies have suggested that the red wolf is a distinct species with an intermediate phenotype and is the predecessor of gray wolves and coyotes (No- wak 1979, 1992). If so, unique mtDNA genotypes and nuclear alleles should exist in red wolves and should define them as a separate species clade (Wayne and Jenks 199 1; Wayne 1992). However, an intermediate phe- notype is also consistent with an origin due to hybrid- ization between gray wolves and coyotes, a conclusion consistent with the absence of unique mtDNA genotypes in the red wolf (Jenks and Wayne 1992; Wayne 1992). It is conceivable that red wolves may represent a phe- notype resulting from a several-hundred-year period of hybridization between coyotes and wolves in the south- central United States, which began with habitat changes associated with the arrival of settlers circa 1700. Sub- sequently, after the extermination of gray wolves in the southern and northeastern United States, the hybrids and their descendants, identified as red wolves, became rare, and their phenotype was more severely influenced by hybridization with coyotes. In contrast, the gray wolf- coyote hybrid zone in southeastern Canada has appeared only within the past 100 years, as coyotes entered Min- nesota and moved northeast into Canada (Hilton 1978). Phenotypes intermediate between coyotes and gray wolves have been described from southeastern Canada and have been attributed to either interspecific hybrid- ization or changes in prey size (Kolenosky and Standfield 1975; Hilton 1978; Schmitz and Kolenosky 1985; Thur- ber and Peterson 199 1) .
The results of our microsatellite analysis are con- sistent with the red wolf’s historic origin being due to hybridization between coyotes and gray wolves, followed by more recent and extensive hybridization with coyotes alone as gray wolves became rare. Red wolves share all their microsatellite alleles with coyotes, whereas a similar founder sample of gray wolves or coyotes drawn from one population have, on average, 4.7 unique alleles when compared with the other species. In simulations, <l in 13,000 population comparisons would be expected to show no unique alleles. Similarly, Monte Carlo simu- lations, which accounted for differences in sample size, indicated that, if the red wolf were a species as distinct as coyotes and gray wolves, then unique alleles should have been found in them, even considering the small founding size of the captive red-wolf population.
One criticism of our interpretation is that unique rare alleles may have existed in the red wolf but have been lost rapidly in the small populations of red wolves existing in Texas as they neared extinction (e.g., see Al- lendorf 1986; Leberg 1992). However, the relatively high

566 Roy et al.
allelic diversity and heterozygosity of captive red wolves suggests that the effective sizes of the these populations were not reduced for many generations. Moreover, MDS and clustering algorithms show that, in allele frequencies, the red wolf is similar to coyote and hybrid-wolf pop- ulations, a result not expected to be a simple consequence of a population bottleneck in an otherwise distinct spe- cies. Consequently, we interpreted the microsatellite data as providing support for a hybrid origin of red wolves in historic times, an origin followed by a more recent extensive introgression of coyote alleles into red-wolf populations as gray wolves became extinct in the south- central United States.
In conclusion, the analysis of microsatellite data provides a new perspective on past estimates of gene flow and genetic subdivision that are based on mtDNA analysis. Coyotes show no evidence of genetic subdivi- sion, a result consistent with high rates of genetic ex- change throughout their recent range expansion. Gray- wolf populations show evidence of divergence due to drift in finite populations, because 6 values are large; these values do not increase with geographic distance between localities. We therefore hypothesize that diver- gence has occurred in Ice Age refugia and that an equi- librium between gene flow, mutation, and drift has not yet occurred. A recent increase in habitat fragmentation may also have influenced levels of population substruc- ture. Hybridization between wolves and coyotes has af- fected the allele frequencies of gray wolves significantly but has had little effect on coyote populations. This dis-
parity may reflect a mating asymmetry caused by male wolves mating with female coyotes and by the resultant offspring backcrossing with gray wolves.
Our analyses of microsatellite data support the hy- pothesis that the intermediate phenotype of the red wolf is derived from historic hybridization between gray wolves and coyotes. More recently, extensive hybridiza- tion with coyotes has caused red wolves to become more similar, in allele frequency, to coyotes than to recently hybridizing populations of gray wolves. Relative to “red wolves,” gray wolves in eastern Canada have experienced more limited hybridization with coyotes. Nevertheless, given continued habitat changes that favor an increase in coyotes at the expense of gray wolves, interspecific hybridization may threaten the genetic integrity of east- ern gray-wolf populations.
Acknowledgments
We would like to thank the many collaborators- especially G. Forbes, P. Gogan, L. D. Mech, T. Meier, and F. Potvin-who provided gray-wolf, red-wolf, and coyote tissue specimens. In addition, we would like to thank M. Schall and A. de Boer for advice and help with our statistics; and we also appreciate the helpful com- ments on the manuscript that were made by E. Barratt, M. Bruford, G. Roemer, F. Hertel, J. Worthington Wil- mer, and B. Van Valkenburgh. This work was supported in part by the U.S. Fish and Wildlife Service (Region 2), National Science Foundation grant BSR 9020282, and a Wolfson Fellowship to E.G.
APPENDIX Table Al Microsatellite Allele Frequency Distributions of 10 Microsatellite Loci in Wolflike Canids
Canis lupus C. latrans
LCXXSAND Southern Northern Northwest RED GOLDEN ALLELE’ Vancouver Kenai Alberta Minnesota Quebec Quebec Territories Washington Kenai Alberta Minnesota Maine California WOLF JACKAL
A. B C. D E F G H I J K L
123: A. B C. D E
0.071 0.474 0.4 12 0.722 0.688 0.636 0.364 1 .ooo 1 .ooo 0.806 0.711 0.800 0.982 0.968 0.000 o.ooo 0.000 0.147 0.250 0.083 0.136 0.000 0.000 0.000 0.194 0.289 0.200 0.018 0.032 0.000 0.000 0.000 0.000 0.000 0.000 0.000 0.000 0.000 0.000 0.000 0.000 0.000 0.000 0.000 0.000 0.643 0.526 0.353 0.028 0.229 0.045 0.636 0.000 0.000 0.000 0.000 0.000 0.000 0.000 0.000 0.214 0.000 0.088 0.000 0.000 0.182 0.000 0.000 0.000 0.000 0.000 0.000 0.000 0.000 0.000 o.ooo 0.000 0.000 0.000 0.000 0.000 0.000 0.000 0.000 0.000 0.000 0.000 0.000 0.000 0.176 0.071 0.000 0.000 0.000 0.000 0.000 0.000 0.000 0.000 0.000 0.000 0.000 0.000 0.000 0.265 0.000 0.000 0.000 0.000 0.000 0.000 0.000 0.000 0.000 0.000 0.000 0.000 0.000 0.000 0.176 0.000 0.000 0.000 0.000 0.000 0.000 0.000 0.000 0.000 0.000 0.000 0.000 0.000 0.000 0.176 0.000 0.000 0.000 0.000 0.000 0.000 0.000 0.000 0.000 0.000 0.000 0.000 0.000 0.000 0.176 o.ooo 0.000 0.000 0.000 0.000 0.000 0.000 0.000 0.000 0.000 0.000 0.000 0.000 0.000 0.000 o.ooo 0.000 0.000 0.000 0.000 0.000 0.000 0.000 0.000 0.000 0.000 0.000 0.000 0.000 0.029
0.000 o.ooo 0.000 0.000 0.600
o.ooo o.ooo 0.000 0.000 0.000 0.000 o.ooo o.ooo 0.000 0.000 0.000 0.000 o.ooo 0.000 0.000 0.000 0.000 0.000 0.000 0.000 0.000 0.024 0.000 0.000 0.605 0.675 0.300 0.429 0.711 0.523
0.000 0.000 0.000 0.000 0.050
0.000 0.000 o.ooo o.ooo 0.000 0.000 0.059 o.ooo o.ooo 0.000 o.ooo 0.000 0.000 0.000 0.000 0.000 0.000 0.000 0.000 0.000 0.000 0.036 0.000 0.000 0.028 0.058 0.063 0.412 0.107 0.000 0.100 0.056 0.019 0.438 0.000
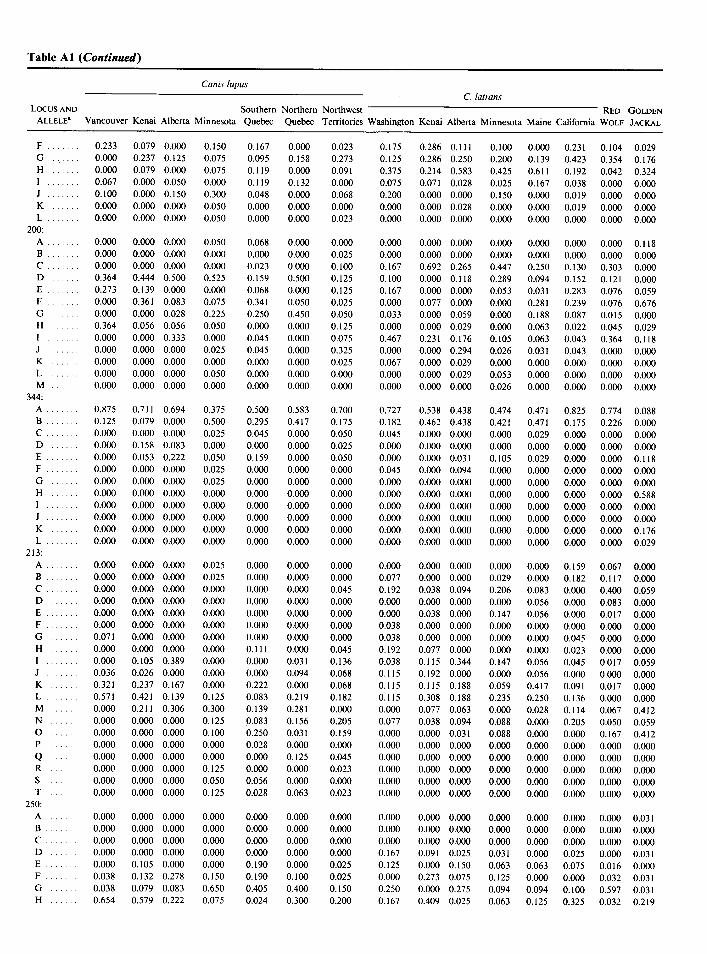
Table Al (Continued)
LOCUS AND Southern Northern Northwest RED GOLDEN
ALLELES Vancouver Kenai Alberta Minnesota Quebec Quebec Territories Washington Kenai Alberta Minnesota Maine California WOLF JACKAL
F G H
0.233 0.079 0.000 0.150 0.167 0.000 0.023 0.175 0.286 0.111 0.100 0.000 0.23 1 0.104 0.029 0.000 0.237 0.125 0.075 0.095 0.158 0.273 0.125 0.286 0.250 0.200 0.139 0.423 0.354 0.176 0.000 0.079 0.000 0.075 0.119 0.000 0.09 1 0.375 0.214 0.583 0.425 0.61 I 0.192 0.042 0.324 0.067 0.000 0.050 0.000 0.119 0.132 0.000 0.075 0.07 1 0.028 0.025 0.167 0.038 0.000 0.000 0.100 0.000 0.150 0.300 0.048 0.000 0.068 0.200 0.000 0.000 0.150 0.000 0.019 0.000 0.000 0.000 0.000 0.000 0.050 0.000 0.000 0.000 0.000 0.000 0.028 0.000 0.000 0.019 0.000 0.000 0.000 0.000 0.000 0.050 0.000 0.000 0.023 0.000 0.000 0.000 0.000 0.000 0.000 0.000 0.000
K
200: A B C D E F G H
0.000 0.000 0.000 0.050 0.068 0.000 0.000 0.000 0.000 0.000 0.000 0.000 0.000 0.000 0.118 0.000 0.000 0.000 0.000 0.000 0.000 0.025 0.000 0.000 0.000 0.000 0.000 0.000 0.000 0.000 0.000 0.000 0.000 0.000 0.023 0.000 0.100 0.167 0.692 0.265 0.447 0.250 0.130 0.303 0.000 0.364 0.444 0.500 0.525 0.159 0.500 0.125 0.100 0.000 0.118 0.289 0.094 0.152 0.121 0.000 0.273 0.139 0.000 0.000 0.068 0.000 0.125 0.167 0.000 0.000 0.053 0.03 1 0.283 0.076 0.059 0.000 0.36 1 0.083 0.075 0.341 0.050 0.025 0.000 0.077 0.000 0.000 0.28 1 0.239 0.076 0.676 0.000 0.000 0.028 0.225 0.250 0.450 0.050 0.033 0.000 0.059 0.000 0.188 0.087 0.015 0.000 0.364 0.056 0.056 0.050 0.000 0.000 0.125 0.000 0.000 0.029 0.000 0.063 0.022 0.045 0.029 0.000 0.000 0.333 0.000 0.045 0.000 0.075 0.467 0.23 I 0.176 0.105 0.063 0.043 0.364 0.118 0.000 0.000 0.000 0.025 0.045 0.000 0.325 0.000 0.000 0.294 0.026 0.03 1 0.043 0.000 0.000 0.000 0.000 0.000 0.000 0.000 0.000 0.025 0.067 0.000 0.029 0.000 0.000 0.000 0.000 0.000 0.000 0.000 0.000 0.050 0.000 0.000 0.000 0.000 0.000 0.029 0.053 0.000 0.000 0.000 0.000 0.000 0.000 0.000 0.000 0.000 0.000 0.000 0.000 0.000 0.000 0.026 0.000 0.000 0.000 0.000
K
M 344:
A B C D E F G H
0.875 0.7 1 1 0.694 0.375 0.500 0.583 0.700 0.727 0.538 0.438 0.474 0.47 1 0.825 0.774 0.088 0.125 0.079 0.000 0.500 0.295 0.417 0.175 0.182 0.462 0.438 0.42 1 0.47 1 0.175 0.226 0.000 0.000 0.000 0.000 0.025 0.045 0.000 0.050 0.045 0.000 0.000 0.000 0.029 0.000 0.000 0.000 0.000 0.158 0.083 0.000 0.000 0.000 0.025 0.000 0.000 0.000 0.000 0.000 0.000 0.000 0.000 0.000 0.053 0,222 0.050 0.159 0.000 0.050 0.000 0.000 0.03 1 0.105 0.029 0.000 0.000 0.118 0.000 0.000 0.000 0.025 0.000 0.000 0.000 0.045 0.000 0.094 0.000 0.000 0.000 0.000 0.000 0.000 0.000 0.000 0.025 0.000 0.000 0.000 0.000 0.000 0.000 0.000 0.000 0.000 0.000 0.000 0.000 0.000 0.000 0.000 0.000 0.000 0.000 0.000 0.000 0.000 0.000 0.000 0.000 0.000 0.588 0.000 0.000 0.000 0.000 0.000 0.000 0.000 0.000 0.000 0.000 0.000 0.000 0.000 0.000 0.000 0.000 0.000 0.000 0.000 0.000 0.000 0.000 0.000 0.000 0.000 0.000 0.000 0.000 0.000 0.000 0.000 0.000 0.000 0.000 0.000 0.000 0.000 0.000 0.000 0.000 0.000 0.000 0.000 0.000 0.176 0.000 0.000 0.000 0.000 0.000 0.000 0.000 0.000 0.000 0.000 0.000 0.000 0.000 0.000 0.029
K L
213: A B c D E F G H
0.000 0.000 0.000 0.025 0.000 0.000 0.000 0.000 0.000 0.000 0.000 0.000 0.159 0.067 0.000 0.000 0.000 0.000 0.025 0.000 0.000 0.000 0.077 0.000 0.000 0.029 0.000 0.182 0.117 0.000 0.000 0.000 0.000 0.000 0.000 0.000 0.045 0.192 0.038 0.094 0.206 0.083 0.000 0.400 0.059 0.000 0.000 0.000 0.000 0.000 0.000 0.000 0.000 0.000 0.000 0.000 0.056 0.000 0.083 0.000 0.000 0.000 0.000 0.000 0.000 0.000 0.000 0.000 0.038 0.000 0.147 0.056 0.000 0.017 0.000 0.000 o.ooo 0.000 0.000 0.000 0.000 0.000 0.038 0.000 0.000 0.000 0.000 0.000 0.000 0.000 0.07 1 0.000 0.000 0.000 0.000 0.000 0.000 0.038 0.000 0.000 0.000 0.000 0.045 0.000 0.000 0.000 0.000 o.ooo 0.000 0.111 0.000 0.045 0.192 0.077 0.000 0.000 0.000 0.023 0.000 0.000 0.000 0.105 0.389 0.000 0.000 0.03 1 0.136 0.038 0.115 0.344 0.147 0.056 0.045 0.0 17 0.059 0.036 0.026 0.000 0.000 0.000 0.094 0.068 0.115 0.192 0.000 0.000 0.056 0.000 0.000 0.000 0.32 1 0.237 0.167 0.000 0.222 0.000 0.068 0.115 0.115 0.188 0.059 0.417 0.09 1 0.017 0.000 0.57 1 0.421 0.139 0.125 0.083 0.219 0.182 0.115 0.308 0.188 0.235 0.250 0.136 0.000 0.000 0.000 0.2 11 0.306 0.300 0.139 0.28 1 0.000 0.000 0.077 0.063 0.000 0.028 0.114 0.067 0.412 0.000 0.000 0.000 0.125 (I.083 0.156 0.205 0.077 0.038 0.094 0.088 0.000 0.205 0.050 0.059 0.000 0.000 0.000 0.100 0.250 0.03 1 0.159 0.000 0.000 0.03 1 0.088 0.000 0.000 0.167 0.412 0.000 0.000 0.000 0.000 0.028 0.000 0.000 0.000 0.000 0.000 0.000 0.000 0.000 0.000 0.000 0.000 0.000 0.000 0.000 0.000 0.125 0.045 0.000 0.000 0.000 0.000 0.000 0.000 0.000 0.000 0.000 0.000 0.000 0.125 0.000 0.000 0.023 0.000 0.000 0.000 0.000 0.000 0.000 0.000 0.000 0.000 0.000 0.000 0.050 0.056 0.000 0.000 0.000 0.000 0.000 0.000 0.000 0.000 0.000 0.000 0.000 0.000 0.000 0.125 0.028 0.063 0.023 0.000 0.000 0.000 0.000 0.000 0.000 0.000 0.000
. K
250: A B C D E F G H
0.000 0.000 0.000 0.000 0.000 0.000 0.000 0.000 0.000 0.000 0.000 0.000 0.000 0.000 0.031 0.000 0.000 0.000 0.000 0.000 0.000 0.000 0.000 0.000 0.000 0.000 0.000 0.000 0.000 0.000 0.000 0.000 0.000 0.000 0.000 0.000 0.000 0.000 0.000 0.000 0.000 0.000 0.000 0.000 0.000 0.000 0.000 0.000 0.000 0.000 0.000 0.000 0.167 0.09 1 0.025 0.03 1 0.000 0.025 0.000 0.03 1 0.000 0.105 0.000 0.000 0.190 0.000 0.025 0.125 0.000 0.150 0.063 0.063 0.075 0.0 16 0.000 0.038 0.132 0.278 0.150 0.190 0.100 0.025 0.000 0.273 0.075 0.125 0.000 0.000 0.032 0.03 1 0.038 0.079 0.083 0.650 0.405 0.400 0.150 0.250 0.000 0.275 0.094 0.094 0.100 0.597 0.03 1 0.654 0.579 0.222 0.075 0.024 0.300 0.200 0.167 0.409 0.025 0.063 0.125 0.325 0.032 0.219

Table Al (Continued)
LoCUSAND ALLELI?
Southern Northern Northwest Quebec Quebec Territories
RED GOLDEN WOLF JACKAL Washington Kenai Alberta Minnesota Maine California Vancouver Kenai Alberta Minnesota
0.154 0.026 0. I67 0.075 0.167 0.150 0.200 0.208 0.000 0.300 0.250 0.344 0.225 0.016 0.03 1 0.115 0.053 0.250 0.000 0.024 0.050 0.075 0.000 0.136 0.025 0.250 0.219 0.150 0.08 1 0.156 0.000 0.026 0.000 0.000 0.000 0.000 0.025 0.042 0.09 1 0.050 0.094 0.03 1 0.025 0.048 0.094 0.000 0.000 0.000 0.000 0.000 0.000 0.075 0.042 0.000 0.050 0.03 1 0.094 0.050 0.177 0.156 0.000 0.000 0.000 0.000 0.000 0.000 0.000 0.000 0.000 0.025 0.000 0.03 1 0.000 0.000 0.219 0.000 0.000 0.000 0.000 0.000 0.000 0.000 0.000 0.000 0.000 0.000 0.000 0.000 0.000 0.000 0.000 0.000 0.000 0.000 0.000 0.000 0.000 0.000 0.000 0.000 0.000 0.000 0.025 0.000 0.000 0.000 0.000 0.000 0.025 0.000 0.000 0.000 0.000 0.000 0.000 0.000 0.000 0.000 0.000 0.000 0.000 0.000 0.000 0.000 0.000 0.000 0.225 0.000 0.000 0.000 0.000 0.000 0.000 0.000 0.000 0.000 0.000 0.000 0.000 0.000 0.000 0.000 0.000 0.000 0.000 0.000 0.000 0.000 0.000 0.000 0.000 0.000 0.000 0.025 0.000 0.000 0.000 0.000 0.000 0.000 0.000 0.000 0.000 0.000 0.000
J K
M N 0
: R S
172: A B C D E F G H
0.000 0.000 0.139 0.200 0.350 0.000 0.050 0.525 0.583 0.353 0.300 0.429 0.675 0.500 0.000 0.000 0.000 0.000 0.000 0.000 0.000 0.000 0.000 0.000 0.000 0.000 0.000 0.000 0.000 0.000 0.000 0.000 0.000 0.000 0.000 0.000 0.000 0.000 0.000 0.000 0.000 0.000 0.000 0.000 0.000 0.000 0.000 0.000 0.025 0.000 0.000 0.000 0.000 0.000 0.000 0.000 0.000 0.000 0.000 0.000 0.000 0.000 0.000 0.025 0.000 0.000 0.000 0.000 0.000 0.000 0.000 0.000 0.000 0.000 0.000 0.000 0.000 0.000 0.000 0.000 0.000 0.000 0.000 0.000 0.000 0.000 0.000 0.000 0.000 0.000 0.000 0.000 0.000 0.300 0.050 0.000 0.150 0.025 0.000 0.000 0.067 0.000 0.000 0.000 0.000 0.545 0.447 0.222 0.125 0.100 0.722 0.300 0.275 0.042 0.412 0.567 0.393 0.300 0.433 0.950 0.455 0.553 0.639 0.325 0.300 0.278 0.500 0.175 0.333 0.235 0.067 0.179 0.025 0.067 0.050 0.000 0.000 0.000 0.000 0.200 0.000 0.000 0.000 0.042 0.000 0.000 0.000 0.000 0.000 0.000
109: A B C D E F G H
0.000 0.000 0.050 0.050 0.024 0.000 0.000 0.107 0.038 0.03 1 0.000 0.000 0.087 0.000 0.000 0.273 0.342 0.125 0.575 0.476 0.105 0.083 0.143 0.269 0.125 0.100 0.382 0.130 0.803 0.000 0.09 1 0.079 0.275 0.050 0.095 0.000 0.167 0.107 0.000 0.03 1 0.075 0.029 0.087 0.000 0.000 0.000 0.447 0.175 0.025 0.190 0.737 0.354 0.107 0.23 1 0.500 0.450 0.265 0.348 0.09 1 0.059 0.3 18 0.053 0.325 0.175 0.095 0.079 0.333 0.393 0.000 0.156 0.175 0.029 0.152 0.030 0.941 0.318 0.079 0.000 0.075 0.119 0.053 0.063 0.143 0.115 0.000 0.200 0.265 0.109 0.030 0.000 0.000 0.000 0.050 0.025 0.000 0.000 0.000 0.000 0.000 0.000 0.000 0.000 0.022 0.030 0.000 0.000 0.000 0.000 0.000 0.000 0.000 0.000 0.000 0.038 0.094 0.000 0.029 0.022 0.015 0.000 0.000 0.000 0.000 0.025 0.000 0.000 0.000 0.000 0.192 0.063 0.000 0.000 0.000 0.000 0.000 0.000 0.000 0.000 0.000 0.000 0.000 0.000 0.000 0.115 0.000 0.000 0.000 0.022 0.000 0.000 0.000 0.000 0.000 0.000 0.000 0.000 0.000 0.000 0.000 0.000 0.000 0.000 0.022 0.000 0.000 0.000 0.000 0.000 0.000 0.000 0.026 0.000 0.000 0.000 0.000 0.000 0.000 0.000 0.000 0.000
K
225: A B C D E F G H
0.000 0.000 0.000 0.000 0.000 0.000 0.000 0.094 0.000 0.000 0.000 0.000 0.000 0.000 0.000 0.038 0.711 0.118 0.325 0.341 0.429 0.275 0.250 0.077 0.100 0.000 0.059 0.050 0.000 1 .ooo 0.23 1 0.184 0.382 0.325 0.295 0.000 0.400 0.563 0.423 0.067 0.325 0.294 0.500 0.109 0.000 0.462 0.000 0.059 0.275 0.205 0.57 1 0.175 0.063 0.269 0.267 0.050 0.235 0.350 0.609 0.000 0.269 0.105 0.44 1 0.075 0.068 0.000 0.150 0.000 0.038 0.400 0.175 0.206 0.050 0.219 0.000 0.000 0.000 0.000 0.000 0.023 0.000 0.000 0.03 1 0.077 0.000 0.100 0.000 0.025 0.000 0.000 0.000 0.000 0.000 0.000 0.000 0.000 0.000 0.000 0.115 0.133 0.000 0.029 0.025 0.000 0.000 0.000 0.000 0.000 0.000 0.000 0.000 0.000 0.000 0.000 0.000 0.000 0.000 0.000 0.000 0.000 0.000 0.000 0.000 0.000 0.000 0.000 0.000 0.000 0.000 0.000 0.000 0.029 0.000 0.000 0.000 0.000 0.000 0.000 0.000 0.068 0.000 0.000 0.000 0.000 0.033 0.350 0.147 0.000 0.000 0.000 J
377: A B
0.000 0.079 0.000 0.000 0.026 0.000 0.132 0.000 0.000 0.000 0.000 0.000 0.000 0.000 0.000 0.000 0.000 0.194 0.000 0.237 0.100 0.211 0.000 0.000 0.000 0.000 0.000 0.132 0.000 0.000 0.000 0.000 0.167 0.050 0.026 0.000 0.000 0.075 0.000 0.000 0.000 0.000 0.079 0.000 0.000 0.000 0.079 0.000 0.000 0.026 0.000 0.000 0.025 0.000 0.100 0.000 0.07 1 0.079 0.000 0.000 0.000 0.000 0.000 0.175 0.000 0.000 0.000 0.150 0.000 0.000 0.053 0.107 0.026 0.125 0.000 0.000 0.000 0.000 0.000 0.053 0.000 0.158 0.000 0.07 1 0.100 0.053 0.000 0.132 0.063 0.000 0.583 0.026 0.028 0.000 0.105 0.075 0.105 0.000 0.000 0.000 0.026 0.000 0.000 0.354 0.278 0.000 0.000 0.000 0.025 0.026 0.000 0.000 0.000 0.000 0.000 0.000 0.07 1 0.158 0.375 0.000 0.000 0.000 0.000 0.000 0.000 0.025 0.105 0.075 0.000 0.100 0.132 0.143 0.026 0.000 0.333 0.000 0.158 0.083 0.325 0.053 0.050 0.105 0.100 0.500 0.033 0.395 0.036 0.026 0.000 0.250 0.000 0.000 0.11 1 0.050 0.2 1 1 0.025 0.132 0.250 0.250 0.100 0.026 0.07 1 0.105 0.02 1 0.028 0.417 0.658 0.306 0.275 0.237 0.675 0.053 0.200 0.036 0.033 0.132 0.107 0.026 0.000 0.028 0.000 0.000 0.000 0.000 0.000 0.000 0.000 0.025 0.07 1 0.233 0.184 0.214 0.053 0.063 0.056 0.000 0.000 0.000 0.000 0.000 0.000 0.000 0.100 0.000 0.233 0.000 0.000 0.158 0.000 0.000 0.000 0.000 0.111 0.100 0.000 0.050 0.000 0.000 0.000 0.067 0.000 0.07 1 0.000 0.000 0.028 0.000 0.000 0.000 0.000 0.000 0.000 0.000 0.000 0.07 1 0.000 0.000 0.107 0.000 0.000 0.000
D E
G H
a For description of loci, see Ostrander et al. ( 1993). letter indicates an increase of one repeat unit of 2 nt.
Alphabetic designations are given to each allele: A = smallest size of repeat unit; and every subsequen

Microsatellite Variation in Wolflike Canids 569
LITERATURE CITED
ALLENDORF, F. W. 1986. Genetic drift and the loss of alleles versus heterozygosity. Zoo Biol. 5: 18 1- 190.
BARTON, N. H., and G. M. HEWITT. 1989. Adaptation, spe- ciation, and hybrid zones. Nature 341:497-503.
BORG, I. 198 1. Multidimensional data representations: when and why? Mathesis, Ann Arbor.
CARBYN, L. 1987. Gray wolf and red wolf. Pp. 358-378 in M. NOVAK, J. A. BAKER, M. E. OBBARD, and B. MALLOCH, eds. Wild fur bearer management and conservation in North America. Ministry of Natural Resources, Ontario, Canada.
CHAKRABORTY, R., M. DE ANDRADE, S. P. DAIGER, and B. BUDOWLE. 1992. Apparent heterozygote deficiencies ob- served in DNA typing data and their implications in forensic applications. Ann. Hum. Genet. 56:45-47.
CORNALL, R. J., T. J. AITMAN, C. M. HEARNE, and J. A. TODD. 199 1. The generation of a library of PCR-analyzed micro- satellite variants for genetic mapping of the mouse genome. Genomics 10:874-88 1.
DALLAS, J. F. 1992. Estimation of microsatellite mutation rates in recombinant inbred strains of mouse. Mamm. Genome 5:32-38.
DIETRICH, W., H. KATZ, S. E. LINCOLN, H. S. SHIN, J. FRIED- MAN, N. DRACOPOLI, and E. S. LANDER. 1992. A genetic map of the mouse suitable for typing intraspecific crosses. Genetics 131:423-447.
FELSENSTEIN, J. 1993. PHYLIP-phylogenetic inference package, version 3.5~. University of Washington, Seattle.
FERRELL, R. E., D. C. MORIZOT, J. HORN, and C. J. CARLEY. 1978. Biochemical markers in species endangered by in- trogression: the red wolf. Biochem. Genet. l&39-49.
GIRMAN, D. J., P. W. KAT, M. G. L. MILLS, J. R. GINSBERG, M. BORNER, V. WILSON, J. H. FANSHAWE, C. FITZGIBBON, L. M. LAU, and R. K. WAYNE. 1993. Molecular genetic and morphological analyses of the African wild dog (Lycaon pictus). J. Hered. 84:450-459.
GOTTELLI, D., C. SILLERO-ZUBIRI, G. D. APPLEBAUM, M. S. ROY, D. J. GIRMAN, J. GARCIA-MORENO, E. A. OSTRAN- DER, and R. K. WAYNE. Molecular genetics of the most endangered canid: the Ethiopian wolf, Canis Simensis. Mol. Ecol. (in press).
HARTL, D. L., and A. G. CLARKE. 1989. Principles of popu- lation genetics. Sinauer, Sunderland, Mass.
HILTON, H. H. 1978. Systematics and ecology of the eastern coyote. Pp. 209-228 in M. BEKOFF, ed. Coyotes: biology, behavior, and management. Academic Press, New York.
JENKS, S., and R. K. WAYNE. 1992. Problems and policy for a species threatened by hybridization: the red wolf as a case study. Pp. 237-251 in D. R. MCCULLOUGH and R. H. BARRETY, eds. Wildlife 200 1: populations. Elsevier Applied Science, London.
JIN, L., and M. NEI . 199 1. Relative efficiencies of the maximum- parsimony and distance-matrix methods of phylogeny con- struction for restriction data. Mol. Biol. Evol. 8:356-365.
KENNEDY, P. K., M. L. KENNEDY, P. L. CLARKSON, and I. S. LIEPINS. 199 1. Genetic variability in natural populations of the gray wolf, Canis lupus. Can. J. Zool. 69: 1183- 1188.
KOLENOSKY, G. B., and R. 0. STANDFIELD. 1975. Morpho- logical and ecological variation among gray wolves (Canis lupus) of Ontario, Canada. Pp. 62-72 in M. W. FOX, ed. The wild canids. Van Nostrand Reinhold, New York.
LEBERG, P. L. 1992. Effects of population bottlenecks on ge- netic diversity as measured by allozyme electrophoresis. Evolution 46:477-494.
LEHMAN, N., P. CLARKSON, L. D. MECH, T. J. MEIER, and R. K. WAYNE. 1992. The use of DNA fingerprinting and mitochondrial DNA to study genetic relationships within and among wolf packs. Behav. Ecol. Sociobiol. 30:83-94.
LEHMAN, N., A. EISENHAWER, K. HANSEN, L. D. MECH, R. 0. PETERSON, P. J. P. GOGAN, and R. K. WAYNE. 199 1. Introgression of coyote mitochondrial DNA into sympatric North American gray wolf populations. Evolution 45: 104- 119.
LEHMAN, N., and R. K. WAYNE. 199 1. Analysis of coyote mitochondrial DNA genotype frequencies: estimation of effective number of alleles. Genetics 128:405-4 16.
LESLIE, J. F. 1989. A basic program for calculating F-statistics. J. Hered. 80:34 1.
LITT, M., and J. A. LUTY. 1989. A hypervariable microsatellite revealed by in vitro amplification of dinucleotide repeat within the cardiac muscle actin gene. Am. J. Hum. Genet. 44:397-40 1.
MANTEL, N. 1967. The detection of disease clustering and a generalized regression approach. Cancer Res. 27:209-220.
MAYR, E. 1963. Animal species and evolution. Belknap, Cam- bridge, Mass.
MECH, L. D. 1987. Age, season, distance, direction, and social aspects of wolf dispersal from a Minnesota pack Pp. 55-74 in B. D. CHEPKO-SADE and Z. TANG HALPIN, eds. Mam- malian dispersal patterns. University of Chicago Press, Chi- cago.
MERCURE, A., K. RALLS, K. P. KOEPFLI, and R. K. WAYNE. Genetic subdivisions among small canids: mitochondrial DNA differentiation of swift, kit, and Arctic foxes. Evolution (in press).
MOORE S. S., L. L. SARGEANT, T. J. KING, J. S. MATTICK, M. GEORGES, and D. J. S. HETZEL. 199 1. The conservation of dinucleotide microsatellites among mammalian genomes allows the use of heterologous PCR primer pairs in closely related species. Genomics. 10:654-660.
NEI, M. 1973. Analysis of gene diversity in subdivided popu- lations. Proc. Natl. Acad. Sci. USA 70:3321-3323.
-. 1977. F-statistics and the analysis of gene diversity in subdivided populations. Ann. Hum. Genet. 41:225-233.
- . 1978. Estimation of average heterozygosity and genetic distance from a small number of individuals. Genetics 89: 583-590.
- 1987. Molecular evolutionary genetics. Columbia . University Press, New York.
NEI, M., and R. K. CHESSER. 1983. Estimation of fixation indices and gene diversities. Ann. Hum. Genet. 47:253-259.
NEI, M., and A. K. ROYCHOUDHARY 1974. Sampling variances of heterozygosity and genetic distance. Genetics 76:379-390.
NOWAK, R. M. 1978. Evolution of coyotes and related Canis. Pp. 3-l 6 in M. BEKOFF, ed. Coyotes: biology, behavior, and management. Academic Press, New York.
-. 1979. North American Quaternary Canis. Monograph

570 Roy et al.
6. Museum of Natural History, University of Kansas, Law- rence.
- 1992. The red wolf is not a hybrid. Conservation Biol. 6:59;-595.
NOWAK, R. M., and J. L. PARADISO. 1983. Walker’s mammals of the world. Johns Hopkins University Press, Baltimore.
O’FARRELL, T. P. 1987. Kit fox. Pp. 423-431 in M. NOVAK, J. A. BAKER, M. E. OBBARD, and B. MALLOCH, eds. Wild fur bearer management and conservation in North America. Ministry of Natural Resources, Ontario, Canada.
OHTA, T., and M. KIMURA. 1973. A model of mutation appro- priate to estimate the number of electrophoretically detectable alleles in a finite population. Genet. Res. 22:201-204.
OSTRANDER, E. A., P. M. JONG, J. RINE, and G. DUYK. 1992. Construction of small-insert genomic DNA libraries highly enriched for microsatellite repeat sequences. Proc. Natl. Acad. Sci. USA 89:3419-3423.
OSTRANDER E. A., G. F. SPRAGUE, and J. RINE. 1993. Iden- tification and characterization of dinucleotide repeat (CA), markers for genetic mapping in dog. Genomics 16:207- 213.
PARKER, W. 1988. The red wolf. Audubon Wild. Rep. 1988: 597-607.
SAITOU, N., and M. NEI . 1987. The neighbor-joining method: a new method for reconstructing phylogenetic trees. Mol. Biol. Evol. 4:406-425.
SAMBROOK, J., E. F. FRITSCH, and T. MANIATIS. 1989. Mo- lecular cloning: a laboratory manual. Cold Spring Harbor Laboratory, Cold Spring Harbor, N.Y.
SCHMITZ, 0. J., and G. B. KOLENOSKY. 1985. Wolves and coyotes in Ontario: morphological relationships and origins. Can. J. Zool. 63: 1130- 1137.
SETON, E. T. 1925. Lives of game animals. Vol 1: Cats, wolves, and foxes. Doubleday, Doran, Garden City, N.Y.
SHEPARD, R. N. 1962. The analysis of proximities: multidi- mensional scaling with an unknown distance function. I. Psychometrika 27: 125- 139.
SLATKIN, M. 1987. Gene flow and the geographic structure of natural populations. Science 236:787-792.
-. 1993. Isolation by distance in equilibrium and non- equilibrium populations. Evolution 47:264-279.
SLATKIN, M., and N. H. BARTON. 1989. A Comparison of 3 indirect methods for estimating average levels of gene flow. Evolution 43: 1349- 1368.
STALLINGS, R. L., A. F. FORD, D. NELSON, D. C. TORNEY, C. E. HILDEBRAND, and R. K. MOYZIS. 199 1. Evolution and distribution of (GT)n repetitive sequences in mam- malian genomes. Genomics 10:807-8 15.
SWOFFORD, D. L., and R. B. SELANDER. 198 1. BIOSYS- 1: a FORTRAN program for the comprehensive analysis of electrophoretic data in population genetics and systematics. J. Hered. 72:28 l-283.
TAUTZ, D. 1989. Hypervariability of simple sequences as a general source for polymorphic DNA markers. Nucleic Ac- ids Res. 17:6463-647 1.
TAUTZ, D., M. TRICK, and G. A. DOVER. 1986. Cryptic sim-
THURBER, J. M., and R. 0. PETERSON. 199 1. Changes in body size associated with range expansion in the coyote (Canis latrans). J. Mammal. 72:750-755.
VAN VALKENBURGH, B., and R. K. WAYNE. Shape divergence associated with size convergence in sympatric East African jackals. Ecology (in press).
VOIGT, D. R., and W. E. BERG. 1987. Coyote. Pp, 345-357 in M. NOVAK, J. A. BAKER, M. E. OBBARD, and B. ~LOCH, eds. Wild fur bearer management and conservation in North Amer- ica. Ministry of Natural Resources, Ontario, Canada.
WAKE, D. B., K. P. YANEV, and M. M. FRELOW. 1989. Sym- patry and hybridization in a ‘ring species’: the plethodontid salamander, Ensatina eschscholtzii. Pp. 134- 157 in D. O’ITE and J. A. ENDLER, eds. Speciation and its consequences. Sinauer, Sunderland, Mass.
WAYNE, R. K. 1992. On the use of molecular genetic characters to investigate species status. Conservation Biol. 6:590-592.
WAYNE, R. K., R. E. BENVENISTE, and S. J. O’BRIEN. 1989. Molecular and biochemical evolution of the Carnivora. Pp. 465-494 in J. L. GITTLEMAN, ed. Carnivore behavior, ecol- ogy and evolution. Cornell University Press, Ithaca, N.Y.
WAYNE, R. K., S. B. GEORGE, D. GILBERT, P. W. COLLINS, S. D. KOVACH, D. G. GIRMAN, and N. LEHMAN. 199 la. A morphologic and genetic study of the island fox, Urocyon littoralis. Evolution 45: 1849- 1868.
WAYNE, R. K., and S. M. JENKS. 199 1. Mitochondrial DNA analysis implying extensive hybridization of the endangered red wolf Canis rufus. Nature 351:565-568.
WAYNE, R. K., N. LEHMAN, M. W. ALLARD, and R. L. Ho- NEYCUTT. 1992. Mitochondrial DNA variability of the gray wolf-genetic consequences of population decline and habitat fragmentation. Conservation Biol. 6:559-569.
WAYNE, R. K., N. LEHMAN, D. GIRMAN, P. J. P. GOGAN, D. A. GILBERT, K. HANSEN, R. 0. PETERSON, U. S. SEAL, A. EISENHAWER, I. D. MECH, and R. J. KRUMENAKER. 199 1 b. Conservation genetics of the endangered Isle Royale gray wolf. Conservation Biol. 5:4 l-5 1.
WAYNE, R. K., and S. J. O’BRIEN. 1987. Allozyme divergence within the Canidae. Syst. Zool. 36:339-355.
WEBER, J. L., and P. E. MAY. 1989. Abundant class of human DNA polymorphisms which can be typed using the poly- merase chain reaction. Am. J. Hum. Genet. 44:388-396.
WEIR, B. S., and C. C. COCKERHAM. 1984. Estimating F-sta- tistics for the analysis of population structure. Evolution 38:1358-1370.
WILKINSON, L., M. HILL, and E. VANG. 1992. SYSTAT for the Macintosh, version 5.2. SYSTAT, Evanston, IL.
WRIGHT, S. 1969. Evolution and the genetics of populations. Vol. 2: The theory of gene frequencies. University of Chi- cago Press, Chicago.
DANIEL HARTL, reviewing editor
Received September 29, 1993
plicity in DNA is a major source of genetic variation. Nature 322:652-656. Accepted February 4, 1994