Patterns of alcohol and other drug treatment service use ...
40
Patterns of alcohol and other drug treatment service use in Australia 1 July 2014 to 30 June 2018
Transcript of Patterns of alcohol and other drug treatment service use ...

Clients accessing alcohol and other drug treatment services across Australia commonly have multiple episodes of treatment spanning several years. This report categorises 3 client groups based on their patterns of service use between 1 July 2014 and 30 June 2018. While there were subtle differences in principal drug of concern and some aspects of service use between the 3 groups, overall there were many similarities. This highlights the complexities of characterising alcohol and other drug service users.
aihw.gov.au
Stronger evidence, better decisions, improved health and welfare
Patterns of alcohol and other drug treatment service use in Australia1 July 2014 to 30 June 2018

Stronger evidence, better decisions, improved health and welfare
Patterns of alcohol and other drug treatment service use in Australia1 July 2014 to 30 June 2018
The Australian Institute of Health and Welfare is a major national agency whose purpose is to create authoritative and accessible information and statistics
that inform decisions and improve the health and welfare of all Australians.
© Australian Institute of Health and Welfare 2019
This product, excluding the AIHW logo, Commonwealth Coat of Arms and any material owned by a third party or protected by a trademark, has been released under a Creative Commons BY 3.0 (CC BY 3.0) licence. Excluded material owned by third parties may include, for example, design and layout, images obtained under licence from third parties and signatures. We have made all reasonable efforts to identify and label material owned by third parties.You may distribute, remix and build upon this work. However, you must attribute the AIHW as the copyright holder of the work in compliance with our attribution policy available at <www.aihw.gov.au/copyright/>. The full terms and conditions of this licence are available at <http://creativecommons.org/licenses/by/3.0/au/>.
ISBN 978-1-76054-652-6 (Online) ISBN 978-1-76054-653-3 (Print)
Suggested citationAustralian Institute of Health and Welfare 2019. Patterns of alcohol and other drug treatment service use in Australia: 1 July 2014 to 30 June 2018. Cat. no. HSE 239. Canberra: AIHW.
Australian Institute of Health and WelfareBoard ChairMrs Louise Markus
Chief Executive OfficerMr Barry Sandison
Any enquiries about or comments on this publication should be directed to:Australian Institute of Health and WelfareGPO Box 570Canberra ACT 2601Tel: (02) 6244 1000Email: [email protected]
Published by the Australian Institute of Health and Welfare.
Please note that there is the potential for minor revisions of data in this report.Please check the online version at <www.aihw.gov.au> for any amendments.
iiiPatterns of alcohol and other drug treatment service use in Australia: 1 July 2014 to 30 June 2018
ContentsSummary .............................................................................................................................................iv
1 Introduction ......................................................................................................................................1
1.1 Policy context .............................................................................................................................1
1.2 Alcohol and other drug treatment services ...........................................................................2
1.3 Purpose of this report ..............................................................................................................3
1.4 Types of service users ...............................................................................................................3
2 Comparativefindings ......................................................................................................................5
2.1 Clientprofile ...............................................................................................................................5
2.2 Principal drug of concern .........................................................................................................7
2.3 Remoteness area .......................................................................................................................8
2.4 Engagement with services .......................................................................................................8
2.5 Overviewofsimilaritiesanddifferencesacrossserviceusergroups .............................. 11
3 Continualserviceusers ................................................................................................................ 12
3.1 Who were continual service users?.......................................................................................12
3.2 For which principal drugs of concern did continual service users seek treatment? ......13
3.3 How did continual service users engage with services? ....................................................14
3.4 Where did continual service users live and access treatment? ........................................15
3.5 Case study 1: Continual service user ....................................................................................16
4 Episodicserviceusers ................................................................................................................... 17
4.1 Who were episodic service users? ........................................................................................17
4.2 For which principal drugs of concern did episodic service users seek treatment? .......18
4.3 How did episodic service users engage with services? ......................................................19
4.4 Where did episodic service users live and access treatment? ..........................................20
4.5 Case study 2: Episodic service user ......................................................................................21
5 Transitoryserviceusers ...............................................................................................................22
5.1 Who were transitory service users? ......................................................................................22
5.2 For which principal drugs of concern did transitory service users seek treatment? .....23
5.3 How did transitory service users engage with services? ...................................................24
5.4 Where did transitory service users live and access treatment? .......................................25
5.5 Case study: Transitory service user ......................................................................................26
6 Conclusion .......................................................................................................................................27
Acknowledgments .................................................................................................................................28
Abbreviations .........................................................................................................................................28
Glossary ...................................................................................................................................................28
References ..............................................................................................................................................30
Listoftables ...........................................................................................................................................31
Listoffigures ..........................................................................................................................................31
Relatedpublications .............................................................................................................................32

iv Patterns of alcohol and other drug treatment service use in Australia: 1 July 2014 to 30 June 2018
SummarySpecialist alcohol and other drug (AOD) treatment services are part of a comprehensive approach to reducing demand in Australia—1 of the 3 pillars of harm minimisation that underpin the National Drug Strategy 2017–26.
AODtreatmentservicesprovideabroadrangeofservicesandsupporttopeopleaffectedbysubstance use. Clients accessing these services commonly experience multiple episodes of treatment spanning several years.
Using the Alcohol and Other Drug Treatment Services National Minimum Data Set, this report looks at the service use patterns of clients who received treatment from publicly funded specialist AOD treatment services between 1 July 2014 and 30 June 2018, for 3 client cohorts:
• continual service users (2,436 clients or 3%)—clients who received at least 1 closed treatment episode in each collection period between 1 July 2014 and 30 June 2018
• episodic service users (24,089 clients or 30%)—clients who received at least 1 closed treatment episode in 2014–15, and at least one other closed treatment episode in at least 1 (but not all) of the 3 years after that
• transitory service users (54,423 clients or 67%)—clients who received at least 1 closed treatment episode in 2014–15 only.
Transitory service users were younger, and were more likely to receive treatment for another person’s drug use than other client groups
Transitory service users had the highest proportion of clients aged 10–19 (18%), and the highest proportion of clients treated for another person’s drug use (6.8%). Episodic service users had the highest proportion of clients aged 20–29 (29%). Continual service users had the highest proportion of females (36%).
Most continual service users received treatment from multiple agencies, and for a total duration of 12 months or longer
There were fewer continual service users than other client cohorts, but among continual service users, 3 in 4 (75%) clients attended at least 3 agencies, and almost 2 in 3 (64%) received treatment for a total duration of 12 months or longer. More than 1 in 3 (36%) continual service users received 10 or more closed treatment episodes. For transitory service users, the median episode duration was 13 days, almost half that of episodic and continual service users (24 days).
Alcohol was the most common principal drug of concern across service user types
Alcohol was the principal drug of concern in 37% of closed episodes for continual and transitory service users, and in 33% of closed episodes for episodic service users. Transitory service users had the highest proportion of closed episodes where cannabis was the principal drug of concern (32%). Continual service users had the highest proportion of closed episodes where amphetamine (30%) or heroin (7.3%) was the principal drug of concern.
Linking data could provide more comprehensive information
This analysis only looks at clients whose treatment episodes were reported to the AIHW for the period 1 July 2014 to 30 June 2018. Linkage to other data sets might help provide more comprehensive and nuanced information on client circumstances and patterns of service use. Similarly, investigating main treatment type and the reasons why repeat service users cease treatmentwouldprovidefurtherunderstandingofthefactorsaffectingclientengagementandretention in treatment.

1Patterns of alcohol and other drug treatment service use in Australia: 1 July 2014 to 30 June 2018
1 IntroductionIn Australia, the use of alcohol and other drugs (AOD) is a major public health concern associated with many adverse outcomes, including injury, mental illness, violence, crime, preventable disease, anddeath.Substanceusehassignificanthealth,social,andeconomicimplicationsfortheindividualsusing alcohol and other drugs, their friends and family, and broader society (AIHW 2019a).
Box 1.1: The cost of alcohol and other drug use in Australia
Health costs• Tobacco, alcohol, and illicit drug use collectively account for 16% of the total burden of
disease in Australia (AIHW 2019b).
Social costs• In 2015, alcohol and illicit drug use accounted for 22.4% and 3.9%, respectively, of the total burdenofmotorvehicleoccupantroadtrafficinjuries,and27.7%and4.8%,respectively, ofthetotalburdenofmotorcycleroadtrafficinjuries(AIHW2019c).
• More than half (55%) of adults who had experienced physical assault in the previous 12 months believed alcohol and other substance were contributing factors (ABS 2019).
Economic costs• In 2004–05, the total cost of substance use to Australian society was estimated at $55.2
billion. This comprised nearly $30.5 billion in tangible costs (including crime, health, productivity, and road accidents), and $24.7 billion in intangible costs (including pain and sufferingfromroadaccidentsandlossoflife)(Collins&Lapsley2008).
1.1 Policy contextSubstance use is a chronic and recurring issue for many individuals, meaning treatment is often long-lasting,multifaceted,andcomplex(Best&Lubman2012;Dennis&Scott2012;Scottetal.2005;Weisner et al. 2003). Clients accessing specialist AOD services commonly have multiple episodes of treatment,oftenatseveralpointsintime(Dennis&Scott2012;Lundgrenetal.2006).
While AOD clients who repeatedly seek treatment commonly have more severe AOD problems than lessfrequentserviceusers,repeatserviceuseshouldnotbeseenasafailure(Best&Lubman2012;Lundgren et al. 2006). This is because each treatment episode aims to support better management and control of substance use, bringing clients closer to their overarching treatment goals (Weisner et al. 2003).
The Australian Government recognises substance use as an important policy issue. This is established in the National Drug Strategy 2017–26, which provides a national framework for building safe, healthy, and resilient Australian communities by preventing and minimising AOD-related health, social, and economic harms among individuals, families and communities.
The strategy articulates a balanced approach across the 3 pillars of harm minimisation—demand, supply, and harm reduction actions (Department of Health 2018). Understanding the patterns of AOD treatment service use can help to inform the evidence-base for policymakers, service managers, and practitioners alike, so that they can better tailor services and interventions aimed at treating problematic AOD use.

2 Patterns of alcohol and other drug treatment service use in Australia: 1 July 2014 to 30 June 2018
1.2 Alcohol and other drug treatment services AOD treatment services across Australia provide a broad range of services and support to people affectedbysubstanceuse,includingfamiliesandfriendsseekingsupportforanotherperson’ssubstance use. These treatment services aim to reduce the harms associated with problematic substance use. People commonly receive treatment for the use of 1 or more substances, the most common of which are alcohol, amphetamines, cannabis, and heroin (AIHW 2019d).
The Alcohol and Other Drug Treatment Services National Minimum Data Set (AODTS NMDS) is collected by the Australian Institute of Health and Welfare (AIHW) to inform policy and optimise service provision (AIHW 2019d).
See Box 1.2 for information about the AODTS NMDS.
Box 1.2: Alcohol and Other Drug Treatment Services National Minimum Data Set
The AODTS NMDS contains information on treatment provided to clients by publicly funded AOD treatment services, including government and non-government agencies.
Clients include people who are seeking assistance for their own drug use, and those seeking assistance for someone else’s drug use. Information on clients are included in the AODTS NMDS when a treatment episode provided to a client is closed (see Glossary).
Data are collected by treatment agencies, and forwarded to the relevant state and territory healthdepartments,whoextractthedataaccordingtothespecificationsintheAODTSNMDS.Data are submitted to the AIHW annually for national collation and reporting.
TheAODTSNMDSdoesnotcontainauniqueidentifierforclients—andinsteadinformationabout clients is collected at the episode level only. However, for the 2012–13 collection, a statistical linkage key (SLK) was introduced to enable the number of individual clients receiving treatment to be estimated.
The SLK is constructed from information about the client’s date of birth, sex, and an alpha code based on selected letters of their name.
Imputation was applied for selected key AODTS NMDS data items in instances where the responseratefellbelowanagreedcut-offinthestatesandterritories.Imputationwasundertaken for the 2012–13, 2013–14, and 2015–16 collections (see the relevant data quality statements for previous collection years for more detail). Analysis of the SLK data showed that approximately98%ofnationaldatacontainedavalidSLKin2017–18,reflectinghighresponserates and improved SLK quality for all jurisdictions.
The analysis in this report is based on AODTS NMDS data from 2013–14 to 2017–18. This is because, as a pilot collection, the 2012–13 SLK has data quality issues.
People receive treatment for AOD-related issues in various settings that are not in scope for inclusion in the AODTS NMDS. These include:
•servicesprovidedbyothernot-for-profitorganisationsandprivatetreatmentagenciesthatdonotreceive public funding
• services whose sole function is to prescribe or provide dosing for opioid pharmacotherapy
• AOD treatment units in acute care or psychiatric hospitals that provide treatment only to admitted patients
• treatment services based in prisons, correctional facilities and detention centres
• primary health-care services, including general practitioner settings, community-based care, AboriginalandTorresStraitIslander-specificprimaryhealth-careservices,andIndigenous-specificdedicated substance use services

3Patterns of alcohol and other drug treatment service use in Australia: 1 July 2014 to 30 June 2018
• health promotion services (for example, needle and syringe programs) and accommodation services (for example, halfway houses and sobering-up shelters).
Although the AODTS NMDS collection covers the majority of publicly funded AOD treatment services,includinggovernmentandnon-governmentagencies,itisdifficulttofullyquantifythescope of AOD services in Australia. Ritter et al. (2014) reported that AOD treatment comprises 1.6 million episodes, services or contacts each year. Of this, the AODTS NMDS accounts for an estimated 10% of treatment episodes, and between 20%–30% of individual clients who received AOD treatment in Australia (Ritter et al. 2014).
1.3 Purpose of this reportThe purpose of this report is to analyse the service use patterns of clients who received treatment frompubliclyfunded(specialist)AODtreatmentservices.Thisisimportantforeffectivelytailoringtreatmentservices,efficientlydistributingresources,andinformingtargetedinterventionstobettersupport client needs.
Toourknowledge,thisstudyisthefirsttousenationaladministrativedatatolookatthepatternsofAOD treatment service use in Australia. As such, this report aims to:
• generate a preliminary understanding about the treatment service patterns of clients of publicly funded AOD treatment services
• address a gap in knowledge about patterns of AOD service use that has previously been unexplored at the national level in Australia, particularly using data captured in the AODTS NMDS.
To achieve this, this report categorises the service use patterns of clients, and looks at the:
• proportion of clients that fall into each service user category
•characteristicsofdifferenttypesofserviceusers
• principal drug of concern that led clients to seek AOD treatment
• patterns and duration of service engagement.
Clients can receive treatment for their own or someone else’s drug use (see Glossary). This report includes both client types, however information about principal drug of concern is only presented for clients receiving treatment for their own drug use.
1.4 Types of service usersThisreportfocusesonthe80,948clientswhosefirstAODtreatmentepisodewasclosedbetween 1 July 2014 and 30 June 2015.
Threecohortsofclientswerethenidentifiedbasedontheirserviceuseoverthistimeframeand thesubsequent3collectionperiods(thatis,eachfinancialyearfrom1July2014to30June2018) (Figure 1). These were:
• continual service users—clients who received at least 1 closed treatment episode in each of the 4 collection periods between 1 July 2014 and 30 June 2018
• episodic service users—clients who received at least 1 closed treatment episode between 1 July 2014 and 30 June 2015, and at least 1 other closed treatment episode in at least 1, but not all, of the subsequent 3 collection periods (1 July 2015 to 30 June 2016, 1 July 2016 to 30 June 2017 and 1 July 2017 to 30 June 2018)
• transitory service users—clients who received at least 1 closed treatment episode in the period from 1 July 2014 to 30 June 2015, but did not receive any closed treatment episodes in any of the subsequent 3 collection periods between 1 July 2015 and 30 June 2018.

4 Patterns of alcohol and other drug treatment service use in Australia: 1 July 2014 to 30 June 2018
Clients were excluded from the analysis if they:
• received a treatment episode closed between 1 July 2013 and 30 June 2014
• were referred from another AOD service for their initial treatment episode in the 2014–15 collection period.
These criteria ensured that the initial cohort did not receive AOD treatment in the 12 months before 1 July 2014, so were not continuing service users from the 2013–14 collection period (Figure 1.1).
However, clients from all 3 cohorts might have received treatment before 1 July 2013, and might have continued to receive treatment beyond 30 June 2018. Services received in these periods are outside the scope of this report. Clients who began treatment in 2014–15, but did not have their episode of treatment closed until a subsequent collection period (for example, in 2015–16 or later) are not included in this analysis, as 2014–15 is the reference collection.
About 2 in 3 (67%) clients received at least 1 closed treatment episode in the initial 2014–15 collection period only (transitory service users).
Almost 1 in 3 (30%) of clients received a treatment episode in 2014–15, and at least once more over the following 3, but not all, collection periods (episodic service users).
Only 3% of clients received a closed treatment episode in each of the 4 collection periods to 2017–18 (continual service users).
Figure1.1:OverviewofAODclientsanddefinedserviceusercohorts,2014–15
Initial cohortDistinct clients (clients with
a valid SLK) in 2014–15
114,460clients
In-scopeclientsin2014–15
80,948clients
Excluded clientsClients who received treatment in
both 2013–14 and 2014–15 (24,637), and clients who were referred to theirfirsttreatmentepisodein
2014–15 from another AOD service (8,875).
33,512clientsexcluded
Continual service users
2,436(3%)
Episodic service users
24,089(30%)
Transitory service users
54,423(67%)

5Patterns of alcohol and other drug treatment service use in Australia: 1 July 2014 to 30 June 2018
2 ComparativefindingsThis report looks at the service use patterns of 3 distinct cohorts of AOD treatment service clients—continual, episodic, and transitory service users.
2.1 ClientprofileAcross the total cohort:
• the majority (68%) of clients were male
• clients were most commonly (29%) aged 20–29
•about1in7(14%or11,500)clientsidentifiedasAboriginalorTorresStraitIslander
• most (94%) clients sought treatment for their own drug use
• the majority (86%) of clients were born in Australia, followed by New Zealand (2.8%), and the United Kingdom (2.7%)
• English was the most common (95%) preferred language (Table 2.1).
While client demographics remained relatively consistent across all 3 service user groups, there weredifferencesbetweengroups(Table2.1).
Continual service usersCompared with transitory and episodic service users, continual service users had:
• the highest proportion (36%) of females
• the highest proportion (32%) of clients aged 30–39.
Episodic service usersCompared with continual and transitory service users, episodic service users had:
• the highest proportion (29%) of clients aged 20–29
•thehighestproportion(17%or4,000)ofclientswhoidentifiedasIndigenous.
Keyfindings• Alcohol was the most common principal drug of concern for all service user groups (about
one-third of closed treatment episodes).
• Continual service users had the highest proportion of heroin and amphetamines as a principal drug of concern, and the lowest for cannabis.
• Transitory service users had the highest proportion of cannabis as a principal drug of concern, and the lowest for heroin and amphetamines.
• Across the total cohort, while many clients reported multiple treatment episodes, nearly 3 in 5 (57%) clients received only 1 treatment episode.
• Continual and episodic service users had 1.8 times the median episode duration of transitory service users (24 and 13 days, respectively).
6 Patterns of alcohol and other drug treatment service use in Australia: 1 July 2014 to 30 June 2018
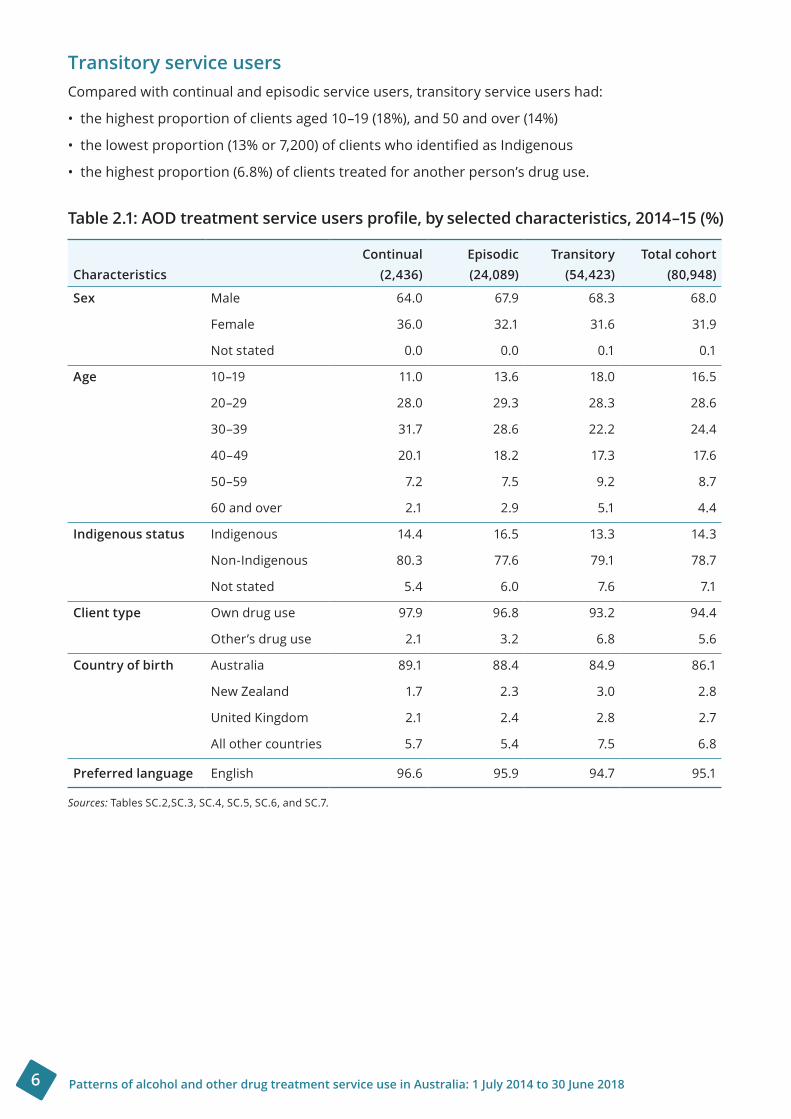
Transitory service usersCompared with continual and episodic service users, transitory service users had:
• the highest proportion of clients aged 10–19 (18%), and 50 and over (14%)
•thelowestproportion(13%or7,200)ofclientswhoidentifiedasIndigenous
• the highest proportion (6.8%) of clients treated for another person’s drug use.
Table2.1:AODtreatmentserviceusersprofile,byselectedcharacteristics,2014–15(%)
CharacteristicsContinual
(2,436)Episodic(24,089)
Transitory(54,423)
Total cohort(80,948)
Sex Male 64.0 67.9 68.3 68.0
Female 36.0 32.1 31.6 31.9
Not stated 0.0 0.0 0.1 0.1
Age 10–19 11.0 13.6 18.0 16.5
20–29 28.0 29.3 28.3 28.6
30–39 31.7 28.6 22.2 24.4
40–49 20.1 18.2 17.3 17.6
50–59 7.2 7.5 9.2 8.7
60 and over 2.1 2.9 5.1 4.4
Indigenous status Indigenous 14.4 16.5 13.3 14.3
Non-Indigenous 80.3 77.6 79.1 78.7
Not stated 5.4 6.0 7.6 7.1
Client type Own drug use 97.9 96.8 93.2 94.4
Other’s drug use 2.1 3.2 6.8 5.6
Country of birth Australia 89.1 88.4 84.9 86.1
New Zealand 1.7 2.3 3.0 2.8
United Kingdom 2.1 2.4 2.8 2.7
All other countries 5.7 5.4 7.5 6.8
Preferred language English 96.6 95.9 94.7 95.1
Sources: Tables SC.2,SC.3, SC.4, SC.5, SC.6, and SC.7.

7Patterns of alcohol and other drug treatment service use in Australia: 1 July 2014 to 30 June 2018
2.2 Principal drug of concernOverall, alcohol, amphetamines, cannabis, and heroin were the 4 most common principal drugs of concern for which AOD treatment was sought by clients being treated for their own drug use across all 3 service user types.
While alcohol was the most common principal drug of concern across all 3 service user types, the proportion for continual and transitory service users varied (Table 2.2).
Continual service usersCompared with transitory and episodic service users, continual service users had:
• the highest proportion of closed treatment episodes where amphetamine (30%) and heroin (7%) was the principal drug of concern
• the lowest proportion of closed treatment episodes where cannabis (15%) was the principal drug of concern.
Transitory service usersCompared with continual and episodic service users, transitory service users had:
• the highest proportion of closed treatment episodes where cannabis (32%) was the principal drug of concern
• the lowest proportion of closed treatment episodes where amphetamines (16%) and heroin (3.5%) was the principal drug of concern.
Table2.2:AODtreatmentepisodesprovidedforowndruguse,byprincipaldrugofconcernandserviceusertype,2014–15to2017–18(%)
Principal drug of concernContinual (22,720)
Episodic(86,232)
Transitory(65,354)
Total cohort(174,306)
Alcohol 36.7 33.2 36.5 34.8
Amphetamines 29.7 27.2 15.9 23.4
Cannabis 14.9 20.6 31.5 23.8
Heroin 7.3 6.1 3.5 5.3
Source: Table SE.2.
AlcoholThe majority (48%) of closed treatment episodes for alcohol were provided to episodic service users, followed by transitory (38%), and continual (14%) service users.
AmphetaminesThe majority (58%) of closed treatment episodes for amphetamines were provided to episodic service users, followed by transitory (25%), and continual (17%) service users.
CannabisThe majority (48%) of closed treatment episodes were provided to transitory service users, followed by episodic (43%), and continual (8.3%) service users.
HeroinThe majority (58%) of closed treatment episodes for heroin were provided to episodic service users, followed by transitory (24%), and continual (18%) service users.
8 Patterns of alcohol and other drug treatment service use in Australia: 1 July 2014 to 30 June 2018
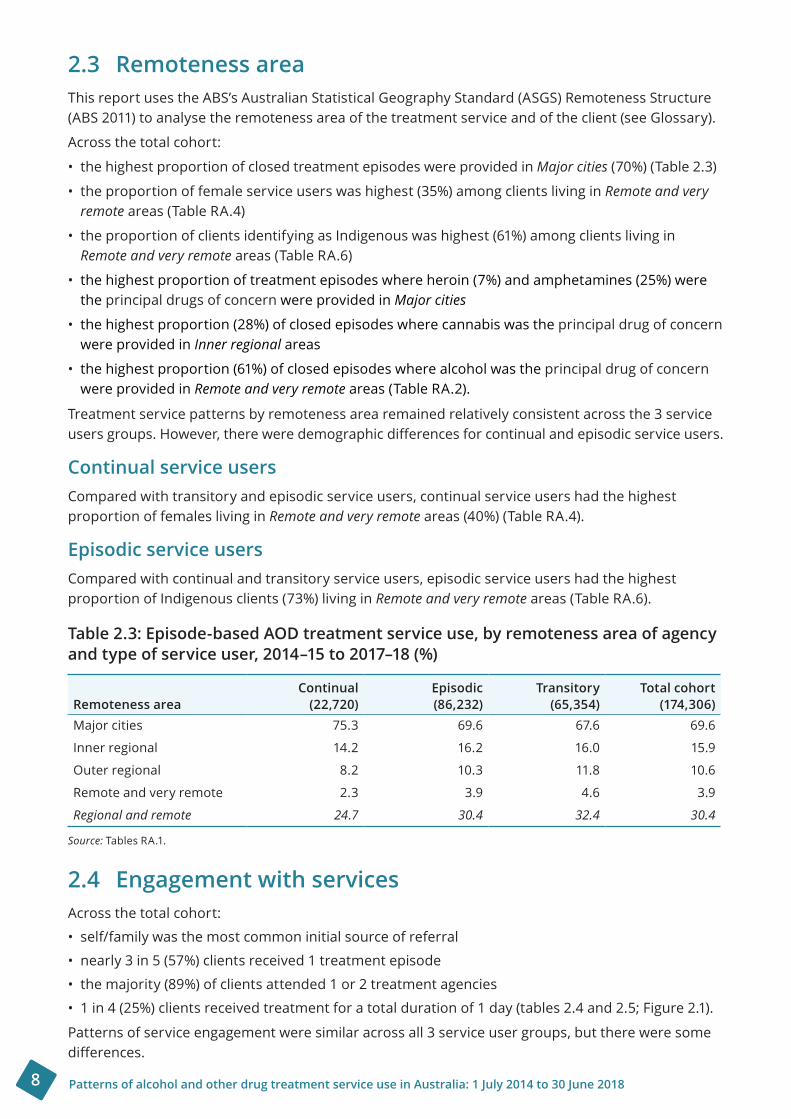
2.3 Remoteness areaThis report uses the ABS’s Australian Statistical Geography Standard (ASGS) Remoteness Structure (ABS 2011) to analyse the remoteness area of the treatment service and of the client (see Glossary).
Across the total cohort:
• the highest proportion of closed treatment episodes were provided in Major cities (70%) (Table 2.3)
• the proportion of female service users was highest (35%) among clients living in Remote and very remote areas (Table RA.4)
• the proportion of clients identifying as Indigenous was highest (61%) among clients living in Remote and very remote areas (Table RA.6)
• the highest proportion of treatment episodes where heroin (7%) and amphetamines (25%) were the principal drugs of concern were provided in Major cities
• the highest proportion (28%) of closed episodes where cannabis was the principal drug of concern were provided in Inner regional areas
• the highest proportion (61%) of closed episodes where alcohol was the principal drug of concern were provided in Remote and very remote areas (Table RA.2).
Treatmentservicepatternsbyremotenessarearemainedrelativelyconsistentacrossthe3 serviceusersgroups.However,thereweredemographicdifferencesforcontinualandepisodicserviceusers.
Continual service usersCompared with transitory and episodic service users, continual service users had the highest proportion of females living in Remote and very remote areas(40%)(Table RA.4).
Episodic service usersCompared with continual and transitory service users, episodic service users had the highest proportion of Indigenous clients (73%) living in Remote and very remote areas (Table RA.6).
Table2.3:Episode-basedAODtreatmentserviceuse,byremotenessareaofagencyandtypeofserviceuser,2014–15to2017–18(%)
Remoteness area Continual (22,720)
Episodic (86,232)
Transitory (65,354)
Total cohort (174,306)
Major cities 75.3 69.6 67.6 69.6
Inner regional 14.2 16.2 16.0 15.9
Outer regional 8.2 10.3 11.8 10.6
Remote and very remote 2.3 3.9 4.6 3.9
Regional and remote 24.7 30.4 32.4 30.4
Source: Tables RA.1.
2.4 Engagement with servicesAcross the total cohort:
• self/family was the most common initial source of referral
• nearly 3 in 5 (57%) clients received 1 treatment episode
• the majority (89%) of clients attended 1 or 2 treatment agencies
•1in4(25%)clientsreceivedtreatmentforatotaldurationof1day(tables2.4and2.5;Figure2.1).
Patterns of service engagement were similar across all 3 service user groups, but there were some differences.
9Patterns of alcohol and other drug treatment service use in Australia: 1 July 2014 to 30 June 2018
Continual service usersCompared with episodic and transitory service users, continual service users had the highest proportion (47%) of treatment episodes in 2014–15 where the initial source of referral was self/family.
Continual service users accessed treatment through a higher number of agencies, and had a longer total duration of treatment than transitory and episodic users.
Among continual service users:
• 1 in 3 (36%) received 10 or more closed treatment episodes
• 3 in 4 (75%) attended at least 3 agencies
• more than 1 in 3 (35%) received treatment for a total duration of 12–24 months
• the median episode duration was 24 days, this was the same as episodic service users and 1.8 timesthatoftransitoryserviceusers(13days)(tables2.4and2.5;Figure2.1).
Episodic service usersCompared with continual and transitory service users, episodic service users had the highest proportion (14%) of treatment episodes in 2014–15 where the initial source of referral was corrections.
Episodic service users had shorter total duration of treatment than continual service users, but a longer total duration of treatment than transitory service users, with:
• nearly 9 in 10 (87%) episodic service users received 2–5 closed treatment episodes
• more than 2 in 5 (44%) attended 2 agencies
• more than 1 in 5 (23%) received treatment for a total duration of 6–<12 months
• the median episode duration being 24 days, the same as continual service users and 1.8 times thatoftransitoryserviceusers(13days)(tables2.4and2.5;Figure 2.1).
Transitory service usersCompared with continual and episodic service users, transitory service users had the highest proportion (31%) of treatment episodes in 2014–15 where the initial source of referral was diversion (Table 2.4).
Transitory service users had the shortest total duration of treatment, and attended the lowest number of agencies of all service user groups, with:
• more than 4 in 5 (85%) transitory service users received 1 closed treatment episode
• more than 9 in 10 (93%) attended 1 agency
• more than 1 in 3 (36%) received treatment for a total duration of 1 day
• the median episode duration being 13 days, 1.8 times shorter than that of episodic and continual serviceusers(24days)(tables2.4and2.5;Figure2.1).
Thedifferencesinserviceengagementbetweenthecontinual,episodic,andtransitoryserviceuserscould be attributed to several factors, with a potential explanation being the type/s of treatment a client receives. While outside the scope of this bulletin, the most common main treatment types across each of the 3 service user cohorts could be an important avenue for future analysis.

10 Patterns of alcohol and other drug treatment service use in Australia: 1 July 2014 to 30 June 2018
Figure2.1:Clients,byserviceusertypeandnumberofagenciesattended,2014–15to2017–18(%)
Source: Table SC.15.
Table2.4:Episode-basedAODtreatmentserviceuse,bysourceofreferral,duration,andserviceusertype,2014–15to2017–18(%)
Continual (22,720)
Episodic (86,232)
Transitory (65,354)
Total cohort (174,306)
Initial source of referral(a)
Self/family 46.6 39.6 33.6 35.8
Health service 19.5 18.2 18.0 18.1
Corrections 9.9 13.6 9.4 10.7
Diversion 14.5 19.7 31.1 27.2
Other 9.4 8.9 8.0 8.3
Median episode duration(days) 24 24 13 20
(a) Refers to source of referral at initial episode in the 2014–15 collection period.
Sources: Tables SE.7 and SE.8.
Service user type
Continual service user
Transitory service user
Episodic service user
0 10 20 30 40 50 60 70 80 90 100Per cent
Attended 5+ agencies Attended 4 agenciesAttended 2 agencies Attended 1 agency
Attended 3 agencies

11Patterns of alcohol and other drug treatment service use in Australia: 1 July 2014 to 30 June 2018
Table 2.5: Client-based AOD treatment service use by agency, closed treatment episodes, duration and service user type, 2014–15 to 2017–18 (%)
Continual (2,436)
Episodic (24,089)
Transitory (54,423)
Total cohort (80,948)
Number of agencies attended
1 8.1 27.0 92.8 70.6
2 17.2 44.0 6.3 17.9
3 21.1 17.4 0.8 6.3
4 19.2 6.9 0.1 2.7
5+ 34.4 4.8 0.0 2.5
Number of closed episodes
1 0.0 0.0 85.3 57.3
2 0.0 39.7 11.3 19.4
3 0.0 24.9 2.3 9.0
4 9.4 14.3 0.7 5.0
5 13.5 7.9 0.2 2.9
6 13.2 4.6 0.1 1.8
7 12.2 2.9 0.0 1.3
8 9.0 1.9 0.0 0.8
9 7.2 1.2 0.0 0.6
10+ 35.6 2.5 0.0 1.8
Total duration of treatment
1 day 0.0 0.0 36.4 24.5
2 days– <1 month 2.5 17.8 19.9 18.8
1–<3 months 3.8 16.2 21.5 19.4
3–<6 months 9.2 21.8 13.4 15.8
6–<12 months 20.9 23.4 5.6 11.4
12–<24 months 34.6 14.6 1.9 6.7
24+ months 29.2 6.3 1.2 3.6
Sources: Tables SC.15, SC.16, and SC.17.
2.5 Overviewofsimilaritiesanddifferencesacrossserviceuser groups
While there were subtle differences between the 3 groups in principal drugs of concern and some aspects of service use, such as median duration of closed episodes, overall there were many similarities. This evidence generates useful insight about the complexities of characterising continual, episodic, and transitory service users.
Due to the descriptive nature of this analysis, it is difficult to infer whether certain patterns are unique to 1 service user group. Further research is required to gain a more comprehensive understanding of the patterns of AOD treatment service use in Australia.
The following chapters provide a descriptive summary of each of the 3 service user cohorts.

12 Patterns of alcohol and other drug treatment service use in Australia: 1 July 2014 to 30 June 2018
3 Continual service usersContinual service users are clients who received at least 1 closed treatment episode in each collection period between 1 July 2014 and 30 June 2018.
Continual service users accounted for 3.0% of the total cohort, and 13% of total episodes.
3.1 Who were continual service users?
ClientprofileContinual service users accounted for 3.0% of the total cohort, and 13% of total episodes (tables SC.1 and SE.1). Among all continual service users, 64% of clients were male and 36% were female (Table SC.3).
Client type Clients can receive treatment for their own or someone else’s drug use (see Glossary). Of all continual service users, 98% received treatment for their own drug use, and 2.1% received treatment for someone else’s drug use (Table SC.2).
Continual service users who received treatment for their own drug use were more likely to be male (64%), aged 30–39 (32%), and non-Indigenous (80%) (tables SC.8, SC.9, and SC.10). Comparatively, continual service user clients receiving treatment for someone else’s drug use were more likely to befemale(57%),andagedeither20–29or40–49(both25%)(tables SC.8andSC.9).
3 in 4 (75%) closed episodes were provided in Major cities.
Nearly 2 in 3 (64%) were male.
30–39 yrs
Nearly 1 in 3 (32%) were aged 30–39.
1 in 7 (14% or 350) identified as Indigenous.
1 in 3 (36%) received 10 or more closed treatment episodes.
3 in 4 (75%) attended at least 3 agencies.
More than 1 in 3 (35%) received treatment for total duration 12–<24 months.
The median episode duration was 24 days.
Continual service users accounted for 3.0% of the total cohort, and 13% of total episodes.
Of the 2,436 continual service users:
Top 4 principal drugs of concern:
30%Amphetamines
15%Cannabis
7.3%Heroin
37%Alcohol

13Patterns of alcohol and other drug treatment service use in Australia: 1 July 2014 to 30 June 2018
Indigenous statusAbout1in7(14%or350)continualserviceusersidentifiedasIndigenous.Oftheseclients:
• 58% were male, and 42% were female (Table SC.12)
• 97% sought treatment for their own drug use, and 3.1% sought treatment for someone else’s drug use (Table SC.11)
• 31% were aged 20–29, and 29% were aged 30–39 (Table SC.13).
AgeIn 2014–15, nearly 1 in 3 (32%) continual service users were aged 30–39 (Table SC.4). Male continual service users were most commonly aged 30–39 (32%), whereas female continual service users were most commonly aged either 20–29 or 30–39 (both 31%) (Table 3.1).
Table3.1:Continualserviceusers,byage andsex,2014–15(%)
Age Male Female
10–19 12.0 9.1
20–29 26.3 30.9
30–39 32.4 30.6
40–49 19.2 21.6
50–59 7.8 6.3
60+ 2.4 1.5
Source: Table SC.14.
3.2 For which principal drugs of concern did continual service users seek treatment?
Alcohol was the most common principal drug of concern (37% of closed treatment episodes) for which clients sought treatment for their own use, followed by amphetamines (30%), cannabis (15%), and heroin (7.3%) (Table SE.2).
Among male continual service users, alcohol was the most common principal drug of concern (37% of closed episodes), followed by amphetamines (28%), and cannabis (15%). These proportions were similar for female continual service users, whose most common principal drug of concern was also alcohol(36%),followedbyamphetamines(32%),andcannabis(14%)(Table SE.3).
About3,100closedtreatmentepisodeswereprovidedtocontinualserviceuserswhoidentifiedasIndigenous. Among those service users, amphetamines were the most common principal drugs of concern (33% of closed episodes), followed by alcohol (30%), cannabis (20%), and heroin (6.7%) (Table SE.4).
14 Patterns of alcohol and other drug treatment service use in Australia: 1 July 2014 to 30 June 2018
3.3 How did continual service users engage with services?
Service useA total of 22,720 closed treatment episodes were provided to 2,436 continual service users from 2014–15 to 2017–18 (tables SE.1 and SC.1).
Compared with other service user types:
• the number of agencies was highest among continual service users, with 75% of clients attending at least 3 agencies over the 4 collection periods (Table SC.15)
• the proportion of clients (34%) attending 5 or more treatment agencies was highest among continual service users (Table SC.15)
• continual service users received treatment for longer durations, with 35% of clients receiving treatment for a total duration of 12–<24 months, 29% receiving treatment for 24 months and over, and21% receivingtreatmentfor6–<12months(TableSC.17)
• continual service users had a median episode duration of 24 days—23 days for those receiving treatment for their own drug use, and 42 days for those receiving treatment for another person’s drug use (Table SE.8)
• the average number of closed episodes per client was highest among continual service users (9.3 episodes per client).
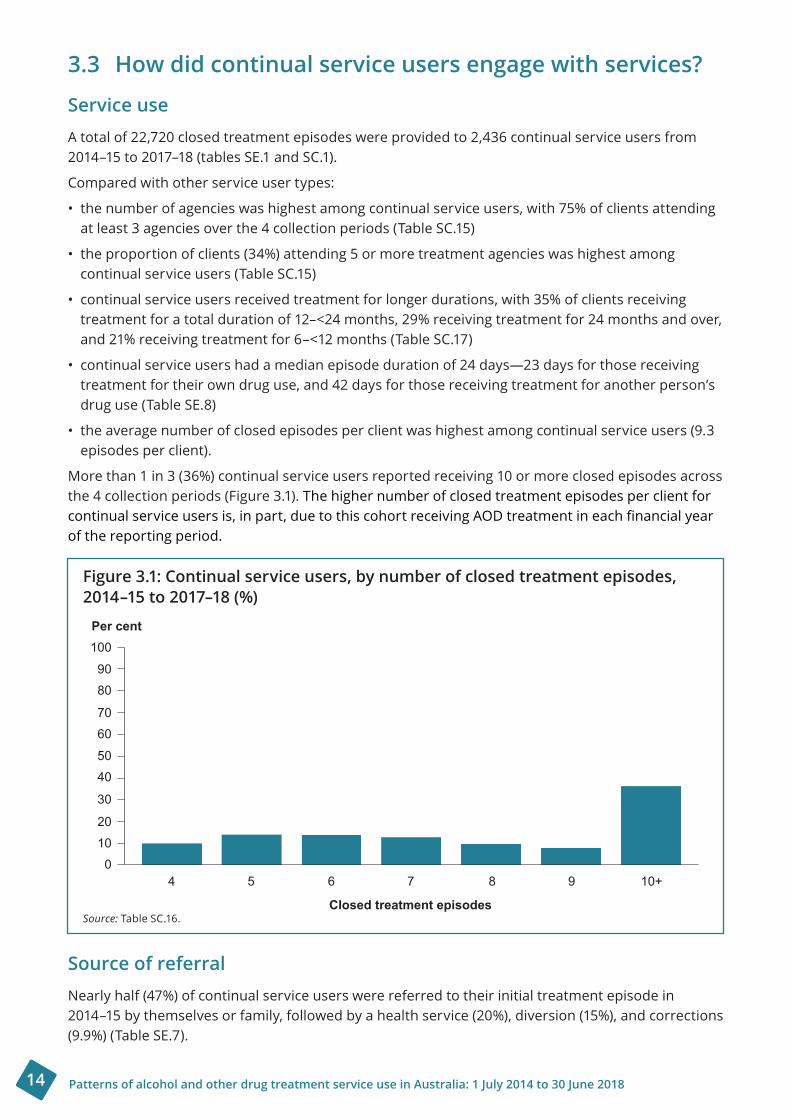
More than 1 in 3 (36%) continual service users reported receiving 10 or more closed episodes across the 4 collection periods (Figure 3.1). The higher number of closed treatment episodes per client for continualserviceusersis,inpart,duetothiscohortreceivingAODtreatmentineachfinancialyearof the reporting period.
Figure3.1:Continualserviceusers,bynumberofclosedtreatmentepisodes,2014–15to2017–18(%)
Source: Table SC.16.
Source of referralNearly half (47%) of continual service users were referred to their initial treatment episode in 2014–15 by themselves or family, followed by a health service (20%), diversion (15%), and corrections (9.9%) (Table SE.7).
Per cent
Closed treatment episodes
100
9080
7060
5040
30
20100
4 5 6 7 8 9 10+
15Patterns of alcohol and other drug treatment service use in Australia: 1 July 2014 to 30 June 2018
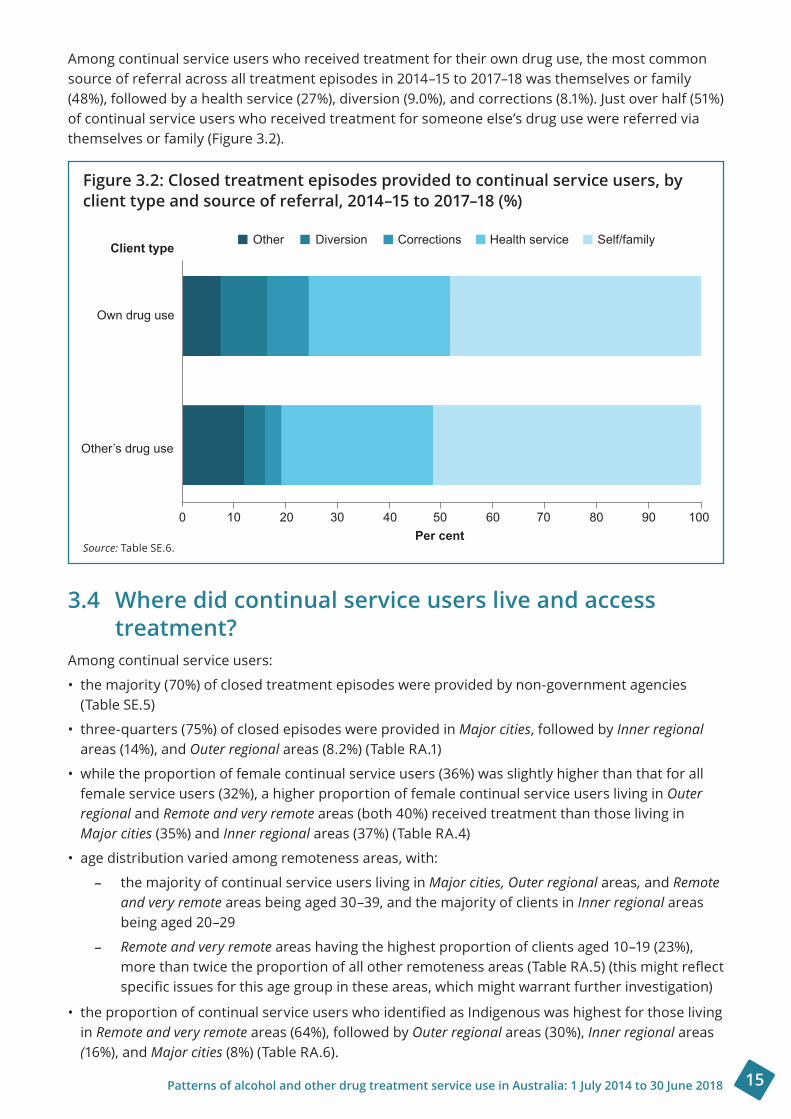
Among continual service users who received treatment for their own drug use, the most common source of referral across all treatment episodes in 2014–15 to 2017–18 was themselves or family (48%), followed by a health service (27%), diversion (9.0%), and corrections (8.1%). Just over half (51%) of continual service users who received treatment for someone else’s drug use were referred via themselves or family (Figure 3.2).
Figure3.2:Closedtreatmentepisodesprovidedtocontinualserviceusers,byclienttypeandsourceofreferral,2014–15to2017–18(%)
Source: Table SE.6.
3.4 Where did continual service users live and access treatment?
Among continual service users:
• the majority (70%) of closed treatment episodes were provided by non-government agencies (Table SE.5)
• three-quarters (75%) of closed episodes were provided in Major cities, followed by Inner regional areas (14%), and Outer regional areas (8.2%) (Table RA.1)
• while the proportion of female continual service users (36%) was slightly higher than that for all female service users (32%), a higher proportion of female continual service users living in Outer regional and Remote and very remote areas (both 40%) received treatment than those living in Major cities (35%) and Inner regional areas (37%) (Table RA.4)
• age distribution varied among remoteness areas, with:
– the majority of continual service users living in Major cities, Outer regional areas, and Remote and very remote areas being aged 30–39, and the majority of clients in Inner regional areas being aged 20–29
– Remote and very remote areas having the highest proportion of clients aged 10–19 (23%), morethantwicetheproportionofallotherremotenessareas(TableRA.5)(thismightreflectspecificissuesforthisagegroupintheseareas,whichmightwarrantfurtherinvestigation)
•theproportionofcontinualserviceuserswhoidentifiedasIndigenouswashighestforthoselivingin Remote and very remote areas (64%), followed by Outer regional areas (30%), Inner regional areas (16%), and Major cities (8%) (Table RA.6).
Client type
Own drug use
Other’s drug use
Other Diversion Corrections Health service Self/family
0 10 20 30 40 50 60 70 80 90 100Per cent

16 Patterns of alcohol and other drug treatment service use in Australia: 1 July 2014 to 30 June 2018
3.5 Case study 1: Continual service user
Ashleigh, 26, experienced traumas as a child, becoming disengaged, anxious, and depressed. She left home and school early, and stayed with her sister or friends. A boyfriend introduced her to amphetamines, which she smoked regularly. When Ashleigh experienced a psychotic episode in her early 20s, she was taken to hospital. An alcohol and other drug clinical liaison nurse referred her to a local treatment service. Although she felt wary, Ashleigh attended her appointment. Her counsellor used a number of techniques to put her at ease as they completed paperwork, and Ashleigh answered questions about her history, her drug use, and her physical and mental health.
During the next few appointments, Ashleigh and her counsellor created a care plan that encouraged Ashleigh to set realistic goals about what she wanted to achieve. When Ashleigh explained that she didn’t feel ready to stop using amphetamines, her counsellor provided her with harm reduction information.
Ashleighmovedtothecountry.Shefounditdifficulttosettleandmakenewfriends,and her drug use continued. Her mother died, she had some bad experiences with new acquaintances, and she started injecting drugs. Over several years, Ashleigh moved 4 times andengagedwith3differentalcoholandotherdrugtreatmentservices.Counsellorsfromthedifferentservicessupportedhertosetgoals,providedinformationandsupport,andreferredher to various services for bloodborne virus screening, housing, and emergency relief.
Counsellors found Cognitive Behavioural Therapy and a trauma-informed approach to be effectiveintheirworkwithAshleigh.AlthoughAshleighattendedthesetreatmentservicessporadically, she did reduce her use. When police found her in possession of drugs, Ashleigh chose to accept the opportunity to engage in alcohol and other drug treatment through a diversion program. Ashleigh continued with counselling after completing the program, due to the strong rapport she had developed with her counsellor.
Ashleigh decided to move on once more to be with her sister. Her counsellor referred her to a service in the new location, and, with her consent, sent Ashleigh’s details to the service, so that she did not have to repeat her story. When her anxiety and cravings increased, Ashleigh approached the new service, as she felt it was time to explore the option of residential treatment. Ashleigh is now accessing group therapies and individual counselling in preparation for a residentialprogram.TheservicehassupportedAshleightoorganiseherfinances,andshefeels committed to attend residential treatment knowing it will be an intensive program.
* Thiscasestoryisnotbasedonanactualperson.Itisbasedonde-identifieddatacollatedfromthepatternsofAODtreatment service use cohort analyses. It is intended to present an example of a ‘typical’ continual service user to demonstratecommonpatternsofserviceuseforthiscohort.Theexperienceofeachindividualclientisdifferent.

17Patterns of alcohol and other drug treatment service use in Australia: 1 July 2014 to 30 June 2018
4 Episodic service usersEpisodic service users are clients who received at least 1 closed treatment episode between 1 July 2014 and 30 June 2015, and another closed treatment episode in at least 1 (but not all) of the 3 collectionperiodsafterthat(between1July2015and30 June 2018).
Episodic service users accounted for 30% of the total cohort, and 49% of total episodes.
4.1 Who were episodic service users?
ClientprofileEpisodic service users accounted for 30% of the total cohort, and 49% of total episodes (tables SC.1 and SE.1). Among all episodic service users, 68% of clients were male and 32% were female (Table SC.3).
Client type Clients can receive treatment for their own or someone else’s drug use (see Glossary). Of all episodic service users, 97% received treatment for their own drug use, and 3.2% received treatment for someone else’s drug use (Table SC.2).
Episodic service user clients who received treatment for their own drug use were more likely to be male (69%), aged 20–29 (30%), and non-Indigenous (78%) (tables SC.8, SC.9, and SC.10). Comparatively, episodic service user clients receiving treatment for someone else’s drug use were more likely to be female (59%), and aged 50–59 (19%) or 10–19 (18%) (tables SC.8 and SC.9).
2 in 7 (29%) were aged 20–29.
1 in 6 (16% or 3,900) identified as Indigenous.
Nearly 9 in 10 (87%) received 2–5 closed treatment episodes.
More than 2 in 5 (44%) attended 2 agencies.
More than 1 in 5 (23%) received treatment for total duration 6–<12 months.
70% of closed episodes were provided in Major cities.
Episodic service users accounted for 30% of the total cohort, and 49% of total episodes.
Of the 24,089 episodic service users:
More than 2 in 3 (68%) were male.
20–29 yrs
Top 4 principal drugs of concern:
27%Amphetamines
21%Cannabis
6.1%Heroin
33%Alcohol

18 Patterns of alcohol and other drug treatment service use in Australia: 1 July 2014 to 30 June 2018
Indigenous statusAbout1in6(16%or3,900)episodicserviceusersidentifiedasIndigenous(TableSC.5).Oftheseclients:
• 64% were male, and 36% were female (Table SC.12)
• 97% sought treatment for their own drug use, and 3.0% sought treatment for someone else’s drug use (Table SC.11)
• 33% were aged 20–29, and 28% were aged 30–39 (Table SC.13).
AgeAbout 2 in 7 (29%) episodic service users were aged 20–29 (Table SC.4). Male episodic service users were most commonly aged 20–29 (30%), whereas female episodic service users were most commonly aged 30–39 (29%) (Table 4.1).
Table4.1:Episodicserviceusers,byage andsex,2014–15to2017–18(%)
Age Male Female
10–19 14.4 11.8
20–29 30.2 27.3
30–39 28.4 29.0
40–49 17.8 19.0
50–59 6.8 9.0
60+ 2.4 3.9
Source: Table SC.14.
4.2 For which principal drugs of concern did episodic service users seek treatment?
Alcohol was the most common principal drug of concern (33% of closed treatment episodes) for which clients sought treatment for their own use, followed by amphetamines (27%), cannabis (21%), and heroin (6.1%) (Table SE.2).
Among male episodic service users, alcohol was the most common principal drug of concern (32% of closed episodes), followed by amphetamines (27%), and cannabis (21%). This was similar among female episodic service users, whose most common principal drug of concern was also alcohol (35%), followed by amphetamines (27%), and cannabis (19%) (Table SE.3). Female episodic service users had a higher proportion of alcohol, and lower proportion of cannabis as their principal drug of concern than male episodic service users.
About14,000closedtreatmentepisodesprovidedtoepisodicserviceuserswhoidentifiedasIndigenous. Among those service users, alcohol was the most common principal drug of concern (37% of closed episodes), followed by cannabis (24%), amphetamines (24%), and heroin (4.5%) (Table SE.4).
19Patterns of alcohol and other drug treatment service use in Australia: 1 July 2014 to 30 June 2018
4.3 How did episodic service users engage with services?
Service useA total of 86,232 closed treatment episodes were provided to 24,089 episodic service users from 2014–15 to 2017–18 (tables SE.1 and SC.1).
Compared with other service user types:
• the proportion of clients (44%) attending 2 agencies was highest among episodic service users (Table SC.15)
• episodic service users reported higher proportions of clients receiving treatment for a total duration of 6–<12 months (23%), 3–<6 months (22%) and 2 days–<1 month (18%) (Table SC.17)
• episodic service users had a median episode duration of 24 days—24 days for those receiving treatment for their own drug use, and 42 days for those receiving treatment for another person’s drug use (Table SE.8)
• the average number of closed episodes per client was second highest for episodic service users (3.6 episodes per client).
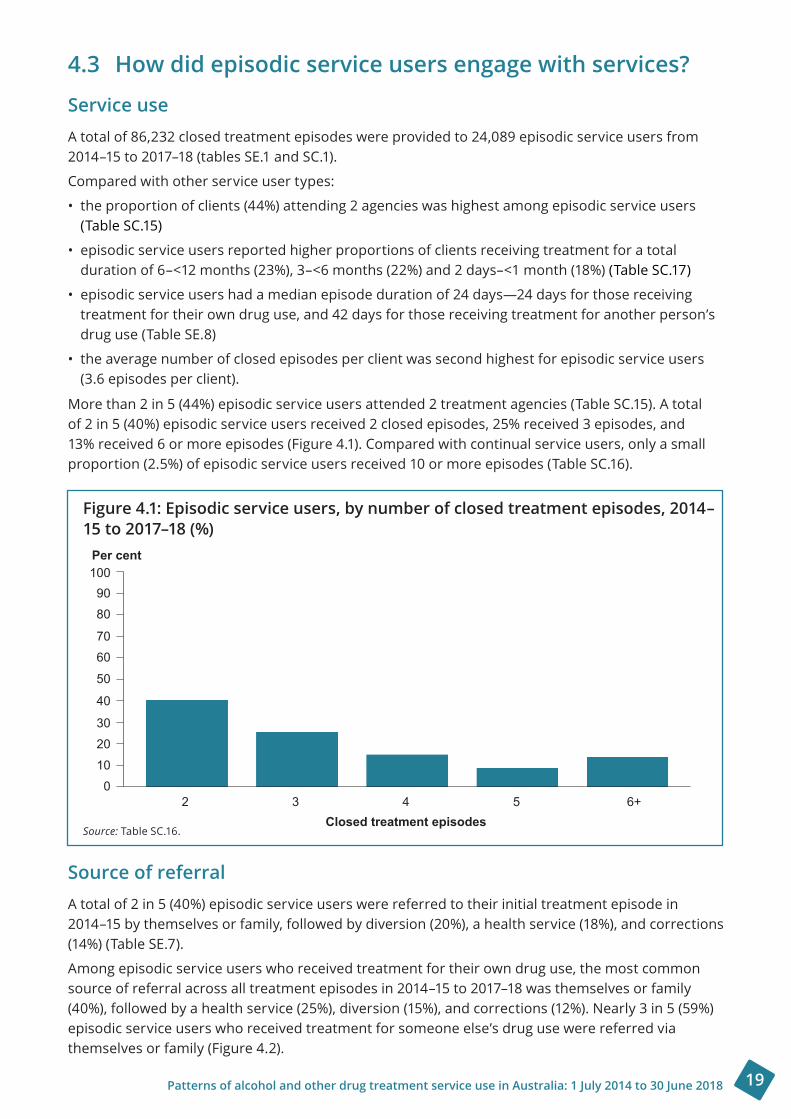
More than 2 in 5 (44%) episodic service users attended 2 treatment agencies (Table SC.15). A total of 2 in 5 (40%) episodic service users received 2 closed episodes, 25% received 3 episodes, and 13% received 6 or more episodes (Figure 4.1). Compared with continual service users, only a small proportion (2.5%) of episodic service users received 10 or more episodes (Table SC.16).
Figure4.1:Episodicserviceusers,bynumberofclosedtreatmentepisodes,2014–15to2017–18(%)
Source: Table SC.16.
Source of referralA total of 2 in 5 (40%) episodic service users were referred to their initial treatment episode in 2014–15 by themselves or family, followed by diversion (20%), a health service (18%), and corrections (14%) (Table SE.7).
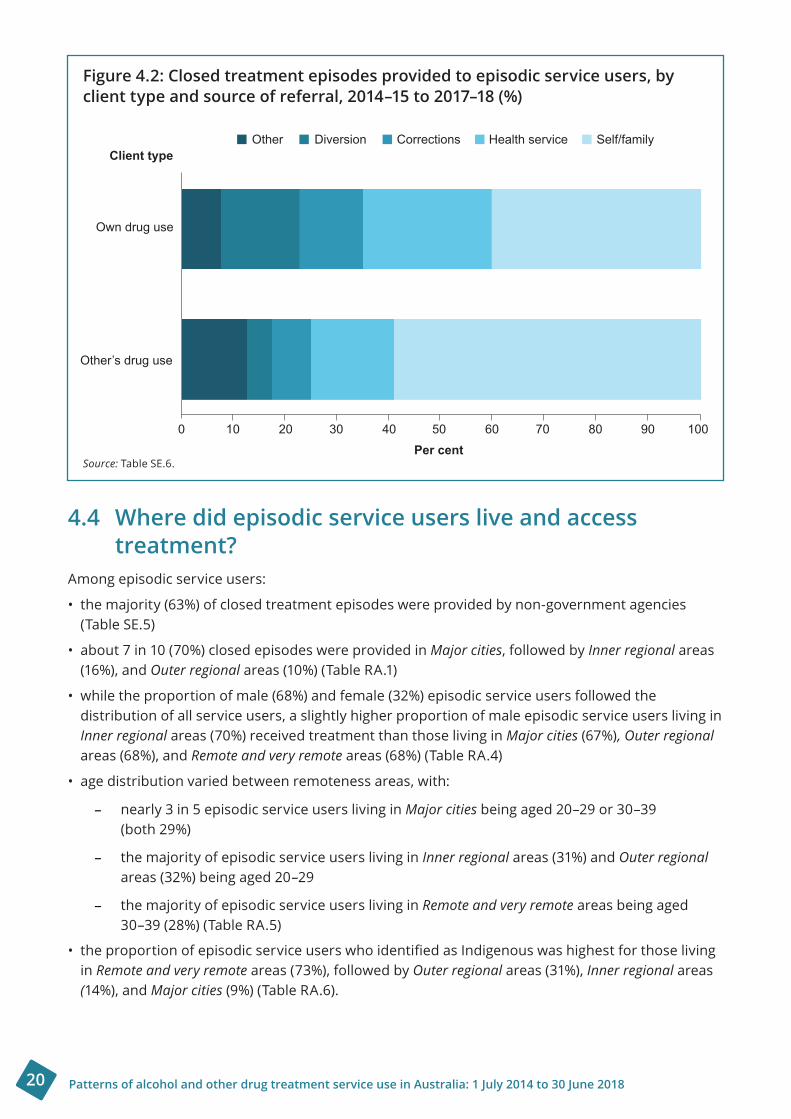
Among episodic service users who received treatment for their own drug use, the most common source of referral across all treatment episodes in 2014–15 to 2017–18 was themselves or family (40%), followed by a health service (25%), diversion (15%), and corrections (12%). Nearly 3 in 5 (59%) episodic service users who received treatment for someone else’s drug use were referred via themselves or family (Figure 4.2).
Per cent
Closed treatment episodes
1009080
7060
50
40
3020100
2 3 4 5 6+
20 Patterns of alcohol and other drug treatment service use in Australia: 1 July 2014 to 30 June 2018
Figure4.2:Closedtreatmentepisodesprovidedtoepisodicserviceusers,by clienttypeandsourceofreferral,2014–15to2017–18(%)
Source: Table SE.6.
4.4 Where did episodic service users live and access treatment?
Among episodic service users:
• the majority (63%) of closed treatment episodes were provided by non-government agencies (Table SE.5)
• about 7 in 10 (70%) closed episodes were provided in Major cities, followed by Inner regional areas (16%), and Outer regional areas (10%) (Table RA.1)
• while the proportion of male (68%) and female (32%) episodic service users followed the distribution of all service users, a slightly higher proportion of male episodic service users living in Inner regional areas (70%) received treatment than those living in Major cities (67%), Outer regional areas (68%), and Remote and very remote areas(68%)(Table RA.4)
• age distribution varied between remoteness areas, with:
– nearly 3 in 5 episodic service users living in Major cities being aged 20–29 or 30–39 (both 29%)
– the majority of episodic service users living in Inner regional areas (31%) and Outer regional areas (32%) being aged 20–29
– the majority of episodic service users living in Remote and very remote areas being aged 30–39 (28%) (Table RA.5)
•theproportionofepisodicserviceuserswhoidentifiedasIndigenouswashighestforthoselivingin Remote and very remote areas (73%), followed by Outer regional areas (31%), Inner regional areas (14%), and Major cities(9%)(Table RA.6).
Client type
Own drug use
Other’s drug use
Other Diversion Corrections Health service Self/family
0 10 20 30 40 50 60 70 80 90 100Per cent
21Patterns of alcohol and other drug treatment service use in Australia: 1 July 2014 to 30 June 2018
4.5 Case study 2: Episodic service user
John, 35, grew up in a household where both parents drank alcohol excessively. His parents weren’t violent, but he and his siblings were neglected, and often left to fend for themselves.
John’sfirstengagementwithanalcoholandotherdrugtreatmentserviceoccurredwhilehe was in hospital after fracturing his ankle and dislocating his shoulder. John had been out drinkingwithfriends,andhadcontinuedtodrinkwhenhewenthome.Hefelloverthecoffeetable on his way to bed.
He was referred to a treatment service by an alcohol and other drug clinical liaison nurse. John attended his initial assessment, but was unsure about undertaking treatment for his alcohol use. However, John reported that he did have concerns about his alcohol use, and was able to identify that his drinking was problematic. John booked a further appointment, but did not attend.
Two months later John called the service enquiring if he could re-engage. As his treatment episode had not been closed, John was not required to undertake an initial assessment again, and saw the same counsellor. John spoke in that session about wanting to stop drinking, but being unsure how he would do this.
John and his counsellor explored service options for him, including inpatient withdrawal, home withdrawal, and long-term rehabilitation. John was referred to an outpatient withdrawalfacility,andattended1 appointment,butdidnotcontinuetreatment.
After some time, John’s drinking began to escalate. He felt like a burden to his family and compared his drinking to that of his father. John was determined to address his drinking and booked an appointment with the long-term rehabilitation service. Given his levels of drinking,Johnwasadvisedtoundertakemedical-assisteddetoxificationbeforeenteringlong-term rehabilitation. John agreed to this, and was referred to an outpatient withdrawal service for assessment.
John attended his assessment with the outpatient withdrawal service, but at the last minute decided that he could manage his alcohol concerns on his own, with the help of his family.
* Thiscasestoryisnotbasedonanactualperson.Itisbasedonde-identifieddatacollatedfromthepatternsofAODtreatment service use cohort analyses. It is intended to present an example of a ‘typical’ episodic service user to demonstratecommonpatternsofserviceuseforthiscohort.Theexperienceofeachindividualclientisdifferent.

22 Patterns of alcohol and other drug treatment service use in Australia: 1 July 2014 to 30 June 2018
5 Transitory service usersTransitory service users are clients who received at least 1 closed treatment episode in the 1 July 2014 to 30 June 2015 collection period only. These clients did not receive any further closed treatmentepisodesinthe3 yearsafterthat.
Transitory service users accounted for 67% of the total cohort, and 37% of the total episodes.
Nearly 2 in 7 (28%) were aged 20–29.
About 1 in 8 (13% or 7,200) identified as Indigenous.
85% received 1 treatment episode.
More than 9 in 10 (93%) attended 1 agency.
More than 1 in 3 (36%) received treatment for a total duration of 1 day.
About 7 in 10 (68%) closed episodes were provided in Major cities.
Transitory service users accounted for 67% of the total cohort, and 37% of the total episodes.
Of the 54,423 transitory service users:
More than 2 in 3 (68%) were male.
20–29 yrs
Top 4 principal drugs of concern:
31%Cannabis
16%Amphetamines
3.5%Heroin
37%Alcohol
5.1 Who were transitory service users?
ClientprofileTransitory service users accounted for 67% of the total cohort, and 37% of the total episodes (tables SC.1 and SE.1). Among all transitory service users, 68% of clients were male and 32% were female (Table SC.3).
Client type Clients can receive treatment for their own or someone else’s drug use (see Glossary). Of all transitory service users, 93% received treatment for their own drug use, and 6.8% received treatment for someone else’s drug use (Table SC.2).
Transitory service user clients who received treatment for their own drug use were more likely to be male (71%), aged 20–29 (30%), and non-Indigenous (79%) (tables SC.8, SC.9, and SC.10). Comparatively, transitory service user clients receiving treatment for someone else’s drug use were morelikelytobefemale(64%),andaged50–59(21%)(tables SC.8 andSC.9).

23Patterns of alcohol and other drug treatment service use in Australia: 1 July 2014 to 30 June 2018
Indigenous statusAbout1in8(13%or7,200)transitoryserviceusersidentifiedasIndigenous(TableSC.5).Oftheseclients:
• 62% were male, and 38% were female (Table SC.12)
• 95% sought treatment for their own drug use, and 4.7% sought treatment for someone else’s drug use (Table SC.11)
• 29% were aged 20–29, and 27% were aged 10–19 (Table SC.13).
AgeNearly2in7(28%)transitoryserviceuserswereaged20–29(TableSC.4).Nearly1 in 3 (30%)maletransitoryserviceuserswereaged20–29,comparedwithnearly1 in 4 femaletransitoryserviceusers (24%) (Table 5.1).
Table5.1:Transitoryserviceusers,byage andsex,2014–15(%)
Age Male Female
10–19 18.3 17.4
20–29 30.1 24.3
30–39 22.3 22.0
40–49 16.7 18.5
50–59 8.2 11.4
60+ 4.5 6.5
Source: Table SC.14.
5.2 For which principal drugs of concern did transitory service users seek treatment?
Alcohol was the most common principal drug of concern (37% of closed treatment episodes) for which clients sought treatment for their own use, followed by cannabis (31%), amphetamines (16%), and heroin (3.5%) (Table SE.2).
Among female transitory service users, alcohol was the most common principal drug of concern (38% of closed episodes), followed by cannabis (28%), and amphetamines (16%). This was similar among male transitory service users, whose most common principal drug of concern was also alcohol (36%), followed by cannabis (33%), and amphetamines (16%) (Table SE.3). Female transitory service users had a higher proportion of alcohol, and lower proportion of cannabis as their principal drug of concern than male transitory service users.
About8,600closedtreatmentepisodeswereprovidedtotransitoryserviceuserswhoidentifiedasIndigenous. Among those service users, alcohol was the most common principal drug of concern (50% of closed episodes), followed by cannabis (27%), amphetamines (12%), and heroin (2.4%) (Table SE.4).
24 Patterns of alcohol and other drug treatment service use in Australia: 1 July 2014 to 30 June 2018
5.3 How did transitory service users engage with services?
Service useA total of 65,354 closed treatment episodes were provided to 54,423 transitory service users in 2014–15.
Compared with other service user types:
• the proportion of clients (93%) attending 1 treatment agency was highest among transitory service users (Table SC.15)
• transitory service users were more likely to report shorter durations of treatment, with 36% receivingtreatmentfor1day,22%receivingtreatmentfor1–<3months,and20% receivingtreatment for 2 days–<1 month (Table SC.17)
• transitory service users had a median episode duration of 13 days—11 days for those receiving treatment for their own drug use, and 27 days for those receiving treatment for another person’s drug (Table SE.8)
• the average number of closed treatment episodes per client was lowest for transitory service users (1.2 episodes per client).
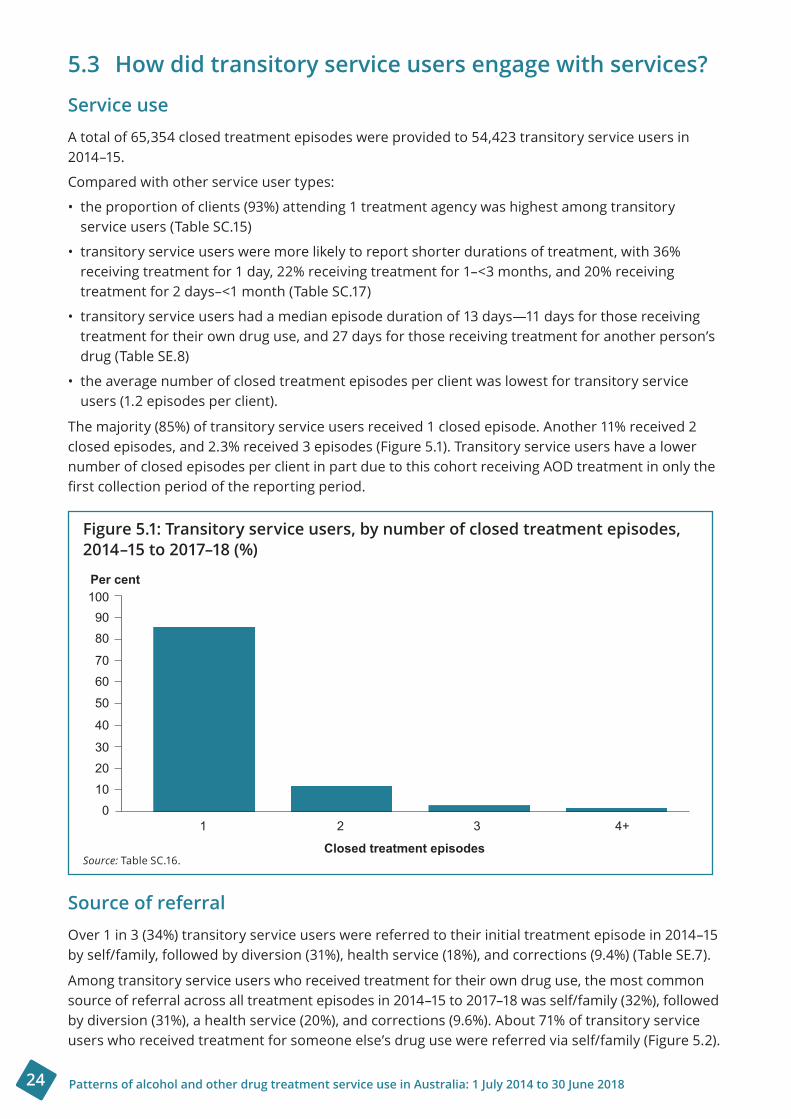
The majority (85%) of transitory service users received 1 closed episode. Another 11% received 2 closed episodes, and 2.3% received 3 episodes (Figure 5.1). Transitory service users have a lower number of closed episodes per client in part due to this cohort receiving AOD treatment in only the firstcollectionperiodofthereportingperiod.
Figure5.1:Transitoryserviceusers,bynumberofclosedtreatmentepisodes,2014–15to2017–18(%)
Source: Table SC.16.
Source of referralOver 1 in 3 (34%) transitory service users were referred to their initial treatment episode in 2014–15 by self/family, followed by diversion (31%), health service (18%), and corrections (9.4%) (Table SE.7).
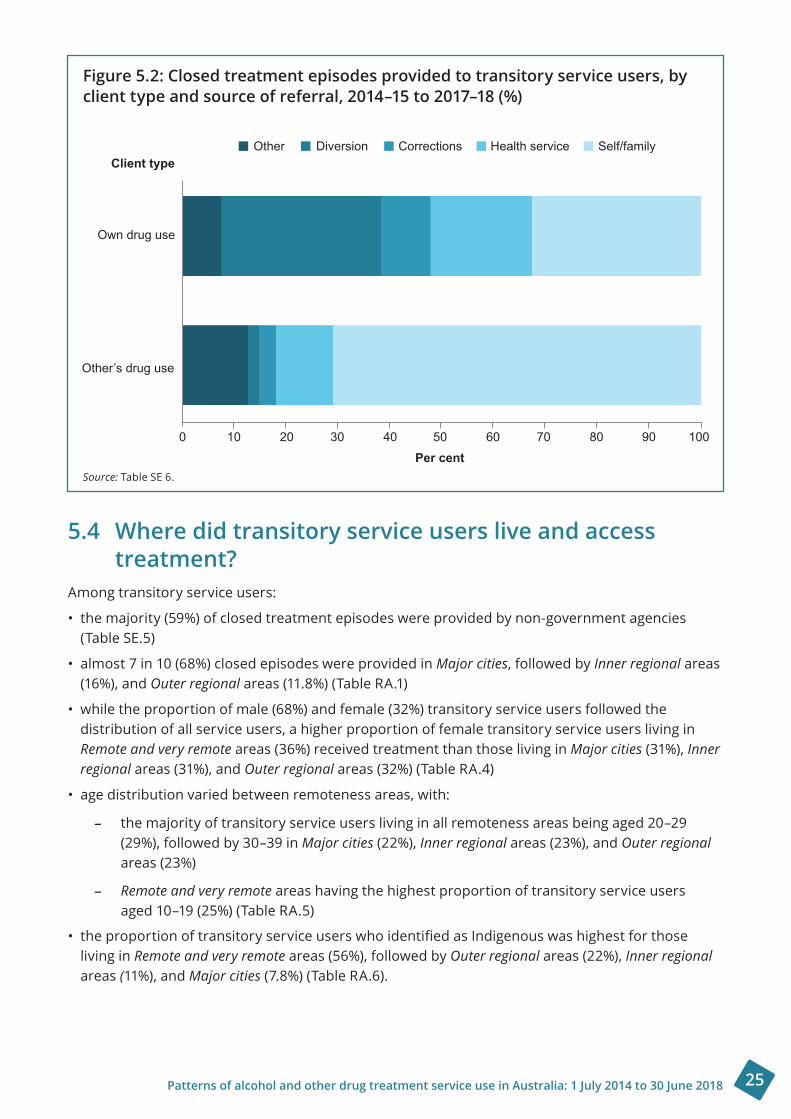
Among transitory service users who received treatment for their own drug use, the most common source of referral across all treatment episodes in 2014–15 to 2017–18 was self/family (32%), followed by diversion (31%), a health service (20%), and corrections (9.6%). About 71% of transitory service users who received treatment for someone else’s drug use were referred via self/family (Figure 5.2).
Per cent
Closed treatment episodes
1009080
7060
50
40
3020100
1 2 3 4+
25Patterns of alcohol and other drug treatment service use in Australia: 1 July 2014 to 30 June 2018
Figure5.2:Closedtreatmentepisodesprovidedtotransitoryserviceusers,byclienttypeandsourceofreferral,2014–15to2017–18(%)
Source: Table SE 6.
5.4 Where did transitory service users live and access treatment?
Among transitory service users:
• the majority (59%) of closed treatment episodes were provided by non-government agencies (Table SE.5)
• almost 7 in 10 (68%) closed episodes were provided in Major cities, followed by Inner regional areas (16%), and Outer regional areas (11.8%) (Table RA.1)
• while the proportion of male (68%) and female (32%) transitory service users followed the distribution of all service users, a higher proportion of female transitory service users living in Remote and very remote areas (36%) received treatment than those living in Major cities (31%), Inner regional areas (31%), and Outer regionalareas(32%)(Table RA.4)
• age distribution varied between remoteness areas, with:
– the majority of transitory service users living in all remoteness areas being aged 20–29 (29%), followed by 30–39 in Major cities (22%), Inner regional areas (23%), and Outer regional areas (23%)
– Remote and very remote areas having the highest proportion of transitory service users aged 10–19 (25%) (Table RA.5)
•theproportionoftransitoryserviceuserswhoidentifiedasIndigenouswashighestforthoseliving in Remote and very remote areas (56%), followed by Outer regional areas (22%), Inner regional areas (11%), and Major cities(7.8%)(Table RA.6).
Client type
Own drug use
Other’s drug use
Other Diversion Corrections Health service Self/family
0 10 20 30 40 50 60 70 80 90 100Per cent
26 Patterns of alcohol and other drug treatment service use in Australia: 1 July 2014 to 30 June 2018
5.5 Case study: Transitory service user
Jack,15,hasadysfunctionalfamilylifeinasmallruraltown.Jackisregularlyinconflictwithhis mum’s boyfriend, and has often witnessed domestic and family violence and drug use at home. Trauma from the domestic and family violence, coupled with Jack’s own cannabis use, makeitdifficultforJacktoconcentrateatschool.
Jack struggles to make satisfactory grades, and to maintain relationships with peers and teachers, though he attends regularly. He has a few close friends and some supportive teachers, and feels like school is his safe place.
Anger and boredom are the main triggers for Jack’s cannabis use, which he uses to help calm his intense, confusing emotional world. He has been caught smoking cannabis at school and has received suspensions for this in the past. Jack has learned to solve interpersonal problems with violence. An assault on a fellow student results in a community order that includes alcohol and other drug counselling.
ThemalecounsellorassignedtoJack’scaseisabletoofferanoutreachservice.Hearrangesto conduct the counselling sessions at Jack’s school, because it is a familiar and safe place. Jackisinitiallyuncommunicativeduringthefirstcounsellingsession,andisuncomfortablewith the attention. The counsellor uses various techniques to shift Jack’s focus, and engage him in conversation. It takes Jack some time to relax, but over subsequent sessions, this approachhelpsdevelopaleveloftrust.Jackhasfewpositivemalefiguresinhislife,andtheconnection with the counsellor starts to build his sense of self-worth.
Throughout the therapy, the counsellor uses motivational interviewing to support Jack in determining what function cannabis has in his life. Jack expresses that he is angry about the situation at home and that cannabis use temporarily removes it.
Together, Jack and his counsellor explore Jack’s strengths, interests, and values, such as school, his friends and living free from violence. Jack begins to understand how cannabis useisaffectinghislife.Withhiscounsellor,helooksatalternativecopingmechanismsand strategies—he learns refusal skills, and how to use the delayed distraction technique. Jack andhiscounsellormaintainastrongrapport.
After regularly attending 10 sessions, at the age of 16, he moves in with a friends’ family. He saysthathefeelsreadytofocusonhisfuturewithoutcannabis.
* Thiscasestoryisnotbasedonanactualperson.Itisbasedonde-identifieddatacollatedfromthepatternsofAODtreatment service use cohort analyses. It is intended to present an example of a ‘typical’ transitory service user to demonstratecommonpatternsofserviceuseforthiscohort.Theexperienceofeachindividualclientisdifferent.
27Patterns of alcohol and other drug treatment service use in Australia: 1 July 2014 to 30 June 2018
6 ConclusionThis report provides insight into how clients use AOD treatment services, highlighting their sociodemographic characteristics, the substances they received treatment for, and where they live. It makes comparisons across service user cohorts, and provides narrative examples of the patterns of treatment.
Alcohol was the top principal drug of concern for all service user groups. Continual service users were more likely than transitory and episodic service users to have amphetamines and heroin as their principal drugs of concern. Transitory service users had the highest proportion of episodes where cannabis was their principal drug of concern, and the lowest proportion with amphetamines and heroin.
Continual service users were more likely than other service user groups to access treatment through multiple agencies, and remain in treatment for longer. While this service user group makes up a small proportion of all AOD clients, this report shows the high level of contact this group has with the sector.
The main limitation of this report is that the analysis can provide insights only into the pattern of alcohol and other drug treatment service use for those clients who accessed AOD services that report to the AODTS NMDS. Further research is required to gain a more comprehensive understanding of the patterns of AOD treatment service use in Australia, including those services outside of the scope of the AODTS NMDS.
Whilethisreportdemonstratesdifferencesinprincipaldrugsofconcernbetweenserviceusergroups,analysisintodetailedpatternsofserviceuseforspecificdrugs,orremotenessareaswouldprovidefurtherinsightsforthesector.Thiscouldincludedifferencesinpatternsofserviceuseforspecificprincipaldrugofconcerncomparedwithallclients,consistencyofclients’principaldrugofconcernfromfirsttreatmentepisode,ortherelationshiptothesourceofreferral.Similarly,lookingat why repeat service users leave a service would provide further understanding of the factors affectingclients’repeatserviceuse.
Current research highlights the chronic and relapsing nature of substance use. However, a number of additional factors—including homelessness, socioeconomic status, disability, contact with the criminal justice system, and mental health—can play a role in how a client engages with AOD treatment services over time.
Despite this, the available data in the AODTS NMDS are currently unable to measure all these factors. Data development and linkage projects could be done to look at these factors interact, and further asses a client’s pathway through AOD treatment services. In addition, it would be useful if future analyses could encapsulate a client’s contact with AOD treatment over a longer period, to gain a more complete picture of treatment patterns.
28 Patterns of alcohol and other drug treatment service use in Australia: 1 July 2014 to 30 June 2018
AcknowledgmentsThe authors of this report were Ms Elyse Kambisios, Mr Lachlan Facchini, and Ms Emily Ross from the Tobacco, Alcohol and Other Drugs Unit of the Australian Institute of Health and Welfare.
Ms Kristina Da Silva, Ms Kristy Raithel, Mr David Whitelaw, Mr Jeffrey Pullin, Ms Moira Hewitt, Mr Matthew James, and Ms Amber Jefferson provided essential advice and guidance. The contributions, comments and advice of the Alcohol and Other Drug Treatment Services National Minimum Data Set Working Group and Mr Jeff Buckley are gratefully acknowledged.
The AIHW acknowledges the assistance of the Western Australian Network of Alcohol and other Drug Agencies in the authoring of case studies for this report.
The Department of Health provided funding for this report.
Thanks are extended to the data managers and staff in the following departments:
• Australian Government Department of Health
• New South Wales Ministry of Health
• Victorian Department of Health and Human Services
• Queensland Department of Health
• Western Australian Mental Health Commission
• South Australian Department of Health
• Tasmanian Department of Health
• Australian Capital Territory Health Directorate
• Northern Territory Department of Health.
AbbreviationsAIHW Australian Institute of Health and Welfare
AOD alcohol and other drug/s
AODTS NMDS Alcohol and Other Drug Treatment Services National Minimum Data Set
SLK statistical linkage key
GlossaryAboriginal or Torres Strait Islander: A person of Aboriginal or Torres Strait Islander descent who identifies as an Aboriginal or Torres Strait Islander person. See also Indigenous.
Alcohol: A central nervous system depressant made from fermented starches. Alcohol inhibits brain functions, dampens the motor and sensory centres and makes judgment, coordination, and balance more difficult.
Amphetamines: Stimulants that include methamphetamine, also known as methylamphetamine. Amphetamines speed up the messages going between the brain and the body.
Australian Statistical Geography Standard Remoteness Area: The Australian Bureau of Statistics’ Australian Statistical Geography Standard Remoteness Area classification allocates 1 of 5 remoteness categories to areas, based on their relative accessibility to goods and services

29Patterns of alcohol and other drug treatment service use in Australia: 1 July 2014 to 30 June 2018
(such as general practitioners, hospitals, and specialist care) as measured by road distance. Theseclassificationsreflectthelevelofremotenessatthetimeofthe2011Census.AreasareclassifiedasMajor cities, Inner regional, Outer regional, Remote, and Very remote. For analysis, Remote and Very remote are often grouped together. The remoteness area of the treatment service was derived from its Statistical Area Level 2 (SA2) 2011, while the remoteness area of the client was derived from the postcode of the client’s last known home address at the start of the treatment episode. When either the SA2 or the postcode covered multiple remoteness areas, the remoteness area allocation with the largest proportion was selected.
Cannabis: Derivative from the cannabis plant (usually Cannabis sativa), which is used in whole plant(typicallythefloweringheads),resin,oroilforms.Cannabishasstimulant,depressant,andhallucinogeniceffects.
Client type: The status of a person in terms of whether the treatment episode concerns their own alcohol and/or other drug use, or that of another person. Clients may seek treatment or assistance for their own alcohol and/or other drug use, or treatment and/or assistance for the alcohol and/or other drug use of another person.
Closed treatment episode: A period of contact between a client and a treatment provider, or team of providers. An episode is closed when treatment is completed, there has been no further contact between the client and the treatment provider for 3 months, or when treatment is ceased.
Government agency: An agency that operates from the public accounts of the Australian Government or a state or territory government, is part of the general government sector, and is financedmainlyfromtaxation.
Heroin: One of a group of drugs known as opioids, which are strong painkillers with addictive properties.Heroinandotheropioidsareclassifiedasdepressantdrugs.
Illicit drug use: Includes:
• the use of illegal drugs—drugs that are prohibited from manufacture, supply, sale, or possession in Australia, such as cannabis, cocaine, heroin, and ecstasy
• misuse, non-medical, or extra-medical use of pharmaceuticals—drugs that are available from a pharmacy, over-the-counter, or by prescription, which might be subject to misuse, such as opioid-based pain relief medications, opioid substitution therapies, benzodiazepines, over-the-counter codeine, and steroids
• use of other psychoactive substances—legal or illegal drugs, potentially used in a harmful way, such as kava, or inhalants, such as petrol, paint, or glue (but not including tobacco or alcohol).
Indigenous: PersonofAboriginalorTorresStraitIslanderdescentwhoidentifiesasanAboriginal or Torres Strait Islander. See also Aboriginal or Torres Strait Islander.
Non-government agency: An agency that receives some government funding, but is not controlledbythegovernment,andisdirectedbyagroupofofficersoranexecutivecommittee. A non-government agency might be an income tax-exempt charity.
Principal drug of concern: The main substance that the client stated led them to seek treatment from an alcohol and drug treatment agency.
Source of referral: The source from which the client was transferred or referred to the alcohol and other drug treatment service.
Treatment episode: The period of contact between a client and a treatment provider or a team of providers. Each treatment episode has 1 principal drug of concern and 1 main treatment type. If the principal drug or main treatment changes, then a new episode is recorded.
30 Patterns of alcohol and other drug treatment service use in Australia: 1 July 2014 to 30 June 2018
ReferencesABS (Australian Bureau of Statistics) 2019. Crime victimisation, Australia, 2017–18. ABS cat. no.4530.0.Canberra:ABS.Viewed9July2019,www.abs.gov.au/AUSSTATS/[email protected]/DetailsPage/4530.02016-17?OpenDocument.
ABS 2011. Australian Statistical Geography Standard (ASGS): volume 5—remoteness structure, July 2011. ABS cat. no. 1270.0.55.005. Canberra: ABS.
AIHW (Australian Institute of Health and Welfare) 2019a. Alcohol, tobacco and other drugs in Australia.Cat.no.PHE221.Canberra: AIHW.Viewed25July2019, www.aihw.gov.au/reports/alcohol/alcohol-tobacco-other-drugs-australia.
AIHW 2019b. Burden of tobacco use in Australia: Australian Burden of Disease Study 2015. Australian Burden of Disease Study series no. 21. Cat. no. BOD 20. Canberra: AIHW.
AIHW 2019c. Australian Burden of Disease Study: impact and causes of illness and death in Australia 2015. Australian Burden of Disease Study series no. 19. Cat. no. BOD 22. Canberra: AIHW.
AIHW2019d.AlcoholandotherdrugtreatmentservicesinAustralia2017–18.Cat. no. HSE 230.Canberra: AIHW.
BestDW&LubmanDI2012.Therecoveryparadigm:amodelofhopeandchangeforalcoholanddrug addiction. Australian Family Physician 41(8):593–7.
CollinsDJ&LapsleyHM2008.Thecostsoftobacco,alcoholandillicitdrugabusetoAustraliansociety in 2004–05. National Drug Strategy monograph series no. 64.
DennisML&ScottCK2012.Four-yearoutcomesfromtheEarlyRe-Intervention(ERI)experimentusing Recovery Management Checkups (RMC). Drug and Alcohol Dependence. 121:10–17.
Department of Health 2018. National Drug Strategy 2017–2026. Canberra: Department of Health.
LundgrenLM,SullivanL&AmodeoM2006.Howdotreatmentrepeatersusethedrugtreatmentsystem? An analysis of injection drug users in Massachusetts. Journal of Substance Abuse Treatment. 30(2):121–8.
RitterA,BerendsL,ChalmersJ,HullP,LancasterK&GomezM2014.Newhorizons:thereviewof alcohol and other drug treatment services in Australia. Final report. Sydney: University of NewSouthWales.Viewed5July2019,https://ndarc.med.unsw.edu.au/sites/default/files/ndarc/resources/New%20Horizons%20Final%20Report%20July%202014.pdf.
ScottCK,DennisML&FossMA2005.Utilizingrecoverymanagementcheckupstoshortenthecycleof relapse, treatment re-entry, and recovery. Drug and Alcohol Dependence 78(3):325–38.
WeisnerC,RayGT,MertensJR,StareDD&MooreC2003.Short-termalcoholanddrugtreatmentoutcomes predict long-term outcome. Drug and Alcohol Dependence 71(3):281–94.

31Patterns of alcohol and other drug treatment service use in Australia: 1 July 2014 to 30 June 2018
List of tablesTable 2.1: AOD treatment service users profile, by selected characteristics, 2014–15 (%) ...............6
Table 2.2: AOD treatment episodes provided for own drug use, by principal drug of concern and service user type, 2014–15 to 2017–18 (%) .....................................................................7
Table 2.3: Episode-based AOD treatment service use, by remoteness area and type of service user, 2014–15 to 2017–18 (%) ....................................................................................................8
Table 2.4: Episode-based AOD treatment service use, by source of referral, duration, and service user type, 2014–15 to 2017–18 (%) ...........................................................................10
Table 2.5: Client-based AOD treatment service use by agency, closed treatment episodes, duration and service user type, 2014–15 to 2017–18 (%) ................................................... 11
Table 3.1: Continual service users, by age and sex, 2014–15 (%) ........................................................13
Table 4.1: Episodic service users, by age and sex, 2014–15 to 2017–18 (%) .......................................18
Table 5.1: Transitory service users, by age and sex, 2014–15 (%) .......................................................23
List of figuresFigure 1.1: Overview of AOD clients and defined service user cohorts, 2014–15................................4
Figure 2.1: Clients, by service user type and number of agencies attended, 2014–15 to 2017–18 (%) ..........................................................................................................10
Figure 3.1: Continual service users, by number of closed treatment episodes, 2014–15 to 2017–18 (%) ...........................................................................................................14
Figure 3.2: Closed treatment episodes provided to continual service users, by client type and source of referral, 2014–15 to 2017–18 (%) .................................................................15
Figure 4.1: Episodic service users, by number of closed treatment episodes, 2014–15 to 2017–18 (%) ...........................................................................................................19
Figure 4.2: Closed treatment episodes provided to episodic service users, by client type and source of referral, 2014–15 to 2017–18 (%) ................................................................. 20
Figure 5.1: Transitory service users, by number of closed treatment episodes, 2014–15 to 2017–18 (%) ........................................................................................................... 24
Figure 5.2: Closed treatment episodes provided to transitory service users, by client type and source of referral, 2014–15 to 2017–18 (%) .................................................................. 25
32 Patterns of alcohol and other drug treatment service use in Australia: 1 July 2014 to 30 June 2018
Related publicationsThis report is part of the drug treatment series. Earlier editions and any published subsequently can be downloaded from www.aihw.gov.au/reports-data/health-welfare-services/alcohol-other-drug-treatment-services/reports. The website also includes information on ordering printed copies.
The following AIHW publications relating to alcohol and other drugs might also be of interest:
•AIHW2017.NationalDrugStrategyHouseholdSurvey2016:detailedfindings.Drugstatisticsseries no. 31. Cat. no. PHE 214. Canberra: AIHW.
• AIHW 2018. Alcohol and other drug treatment services in Australia 2017–18. Drug treatment services series no. 33. Cat. no. HSE 230. Canberra: AIHW.
•AIHW2018.Alcohol,tobacco,andotherdrugsinAustralia.Cat.no.PHE221.Canberra: AIHW.
• AIHW 2019. Australian Burden of Disease Study: impact and causes of illness and death in Australia 2015. Australian Burden of Disease Study series no.19. Cat. no. BOD 22. Canberra: AIHW.

Clients accessing alcohol and other drug treatment services across Australia commonly have multiple episodes of treatment spanning several years. This report categorises 3 client groups based on their patterns of service use between 1 July 2014 and 30 June 2018. While there were subtle differences in principal drug of concern and some aspects of service use between the 3 groups, overall there were many similarities. This highlights the complexities of characterising alcohol and other drug service users.
aihw.gov.au
Stronger evidence, better decisions, improved health and welfare
Patterns of alcohol and other drug treatment service use in Australia1 July 2014 to 30 June 2018