Pattern Trading - Philipp Kahler pattern trading.pdf · Pattern Trading Trading with rate patterns...
4
54 STRATEGIES August 2007 www.traders-mag.com Red-White-Red Pattern Trading Trading with rate patterns can offer a low-risk and highly profitable possibility. Ever-returning formations are easy to describe, and can be easily tested for their profitability. The pattern introduced here does not only awaken associations with the Austrian flag but might also fill up your cash box for your holidays! Price Pattern In general, price patterns count as highly profitable investment strategies. You will rarely find a trading professional who does not in some way or another integrate the conclusions he draws from the ever-recurring formations in his trading decisions. The most famous price pattern is probably the candlestick pattern “hammer”. It describes the behaviour of the markets in one day, and shows where and how the open/high/low/close is arranged in the price scale. This in turn allows us to draw conclusions about the market behaviour of the following day. A hammer is a day in the downtrend, which might lead to a trend reversal. The day begins weak, but then the change comes, the market compensates for the lost terrain and closes near the opening. The chartist does not care about what introduced the reversal in the market direction, the only important thing is that the market removes itself from the daily low and closes where it had already opened. Figure 1 shows this candlestick pattern. For the next day, this means the following: If the market is able to continue rising and pass the high of the previous day, this is a strong bullish sign and we can think about a long position. If, however, the market begins to fall again and reaches new lows, the intraday trend reversal of the hammer was after all a premature strengthening of the bulls. In case we are already long, we should close our position at the latest at the low of the hammer. Therefore, a price pattern presents a good possibility of indicating exactly where to place the entry and exit stops. With known stops, it is possible to choose the correct position size – and, as we know, this is the key to a successful trade. Red-White-Red The red-white-red pattern is a price pattern which includes three days in total, it does not describe the market behaviour of one day only, but determines the precise sequence of the price development of three successive days. The first day of the price pattern is a falling day, represented as a red candle in the chart. This negative day is followed by new lows and a short break; the market closes above its opening on day two of the price pattern. This day has to be the lowest low of the three days. On the last day of the price pattern there is another
Transcript of Pattern Trading - Philipp Kahler pattern trading.pdf · Pattern Trading Trading with rate patterns...

54
STRATEGIES
August 2007 www.traders-mag.com
Red-White-Red
Pattern Trading
Trading with rate patterns can offer a low-riskand highly profitable possibility. Ever-returningformations are easy to describe, and can beeasily tested for their profitability. The patternintroduced here does not only awakenassociations with the Austrian flag but mightalso fill up your cash box for your holidays!
Price PatternIn general, price patterns count as highly profitable investmentstrategies. You will rarely find a trading professional who does not insome way or another integrate the conclusions he draws from theever-recurring formations in his trading decisions.
The most famous price pattern is probably the candlestick pattern“hammer”. It describes the behaviour of the markets in one day, andshows where and how the open/high/low/close is arranged in theprice scale. This in turn allows us to draw conclusions about the marketbehaviour of the following day.
A hammer is a day in the downtrend, which might lead to a trendreversal. The day begins weak, but then the change comes, the marketcompensates for the lost terrain and closes near the opening. Thechartist does not care about what introduced the reversal in the marketdirection, the only important thing is that the market removes itselffrom the daily low and closes where it had already opened. Figure 1shows this candlestick pattern.
For the next day, this means the following: If the market is able tocontinue rising and pass the high of the previous day, this is a strong
bullish sign and we can think about a long position. If, however, themarket begins to fall again and reaches new lows, the intraday trendreversal of the hammer was after all a premature strengthening ofthe bulls. In case we are already long, we should close our position atthe latest at the low of the hammer.
Therefore, a price pattern presents a good possibility of indicatingexactly where to place the entry and exit stops. With known stops, itis possible to choose the correct position size – and, as we know, thisis the key to a successful trade.
Red-White-RedThe red-white-red pattern is a price pattern which includes three daysin total, it does not describe the market behaviour of one day only,but determines the precise sequence of the price development ofthree successive days. The first day of the price pattern is a falling day,represented as a red candle in the chart. This negative day is followedby new lows and a short break; the market closes above its openingon day two of the price pattern. This day has to be the lowest low ofthe three days. On the last day of the price pattern there is another
55
F1) Candlestick Pattern Hammer
Figure 1 shows you twice the appearance of one of the simplest pricepatterns – the hammers.The market builds new lows in the cause of the day, but it recovers, andcloses near the opening. After the first hammer, displayed in red, the marketcould build neither a new high nor a new low. The pattern thereforeremained without consequences. The second hammer clarifies the ideahow it should work. The market further rises on the day after the hammer,we go long at the high of the hammer, and place the initial stop at the lowof the hammer.
Source: www.tradesignal.com
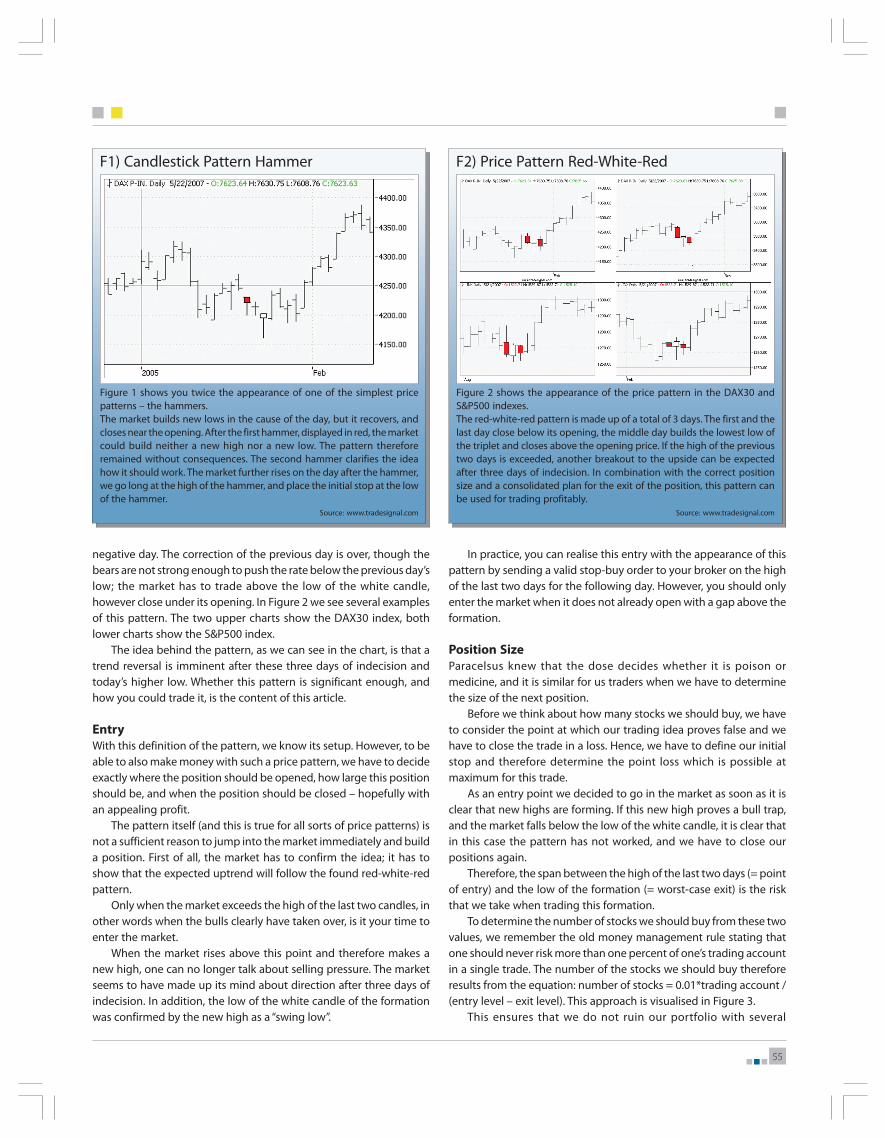
F2) Price Pattern Red-White-Red
Figure 2 shows the appearance of the price pattern in the DAX30 andS&P500 indexes.The red-white-red pattern is made up of a total of 3 days. The first and thelast day close below its opening, the middle day builds the lowest low ofthe triplet and closes above the opening price. If the high of the previoustwo days is exceeded, another breakout to the upside can be expectedafter three days of indecision. In combination with the correct positionsize and a consolidated plan for the exit of the position, this pattern canbe used for trading profitably.
Source: www.tradesignal.com
negative day. The correction of the previous day is over, though thebears are not strong enough to push the rate below the previous day’slow; the market has to trade above the low of the white candle,however close under its opening. In Figure 2 we see several examplesof this pattern. The two upper charts show the DAX30 index, bothlower charts show the S&P500 index.
The idea behind the pattern, as we can see in the chart, is that atrend reversal is imminent after these three days of indecision andtoday’s higher low. Whether this pattern is significant enough, andhow you could trade it, is the content of this article.
EntryWith this definition of the pattern, we know its setup. However, to beable to also make money with such a price pattern, we have to decideexactly where the position should be opened, how large this positionshould be, and when the position should be closed – hopefully withan appealing profit.
The pattern itself (and this is true for all sorts of price patterns) isnot a sufficient reason to jump into the market immediately and builda position. First of all, the market has to confirm the idea; it has toshow that the expected uptrend will follow the found red-white-redpattern.
Only when the market exceeds the high of the last two candles, inother words when the bulls clearly have taken over, is it your time toenter the market.
When the market rises above this point and therefore makes anew high, one can no longer talk about selling pressure. The marketseems to have made up its mind about direction after three days ofindecision. In addition, the low of the white candle of the formationwas confirmed by the new high as a “swing low”.
In practice, you can realise this entry with the appearance of thispattern by sending a valid stop-buy order to your broker on the highof the last two days for the following day. However, you should onlyenter the market when it does not already open with a gap above theformation.
Position SizeParacelsus knew that the dose decides whether it is poison ormedicine, and it is similar for us traders when we have to determinethe size of the next position.
Before we think about how many stocks we should buy, we haveto consider the point at which our trading idea proves false and wehave to close the trade in a loss. Hence, we have to define our initialstop and therefore determine the point loss which is possible atmaximum for this trade.
As an entry point we decided to go in the market as soon as it isclear that new highs are forming. If this new high proves a bull trap,and the market falls below the low of the white candle, it is clear thatin this case the pattern has not worked, and we have to close ourpositions again.
Therefore, the span between the high of the last two days (= pointof entry) and the low of the formation (= worst-case exit) is the riskthat we take when trading this formation.
To determine the number of stocks we should buy from these twovalues, we remember the old money management rule stating thatone should never risk more than one percent of one’s trading accountin a single trade. The number of the stocks we should buy thereforeresults from the equation: number of stocks = 0.01*trading account /(entry level – exit level). This approach is visualised in Figure 3.
This ensures that we do not ruin our portfolio with several

56
STRATEGIES
August 2007 www.traders-mag.com
F4) When It Does Not Work
Figure 4 shows you four examples where the expected sustainable uptrenddid not follow the price pattern. Clockwise: In the first example, the marketcould only take the high only one day after the appearance of the pattern.Thereupon, it stagnated on a high level. Example 2 shows the case thatthe market did get above the formation in the first day, then howeverturned around and fell under the low of the formation. Example 3 presentsa similar problem like in example 1: the market cannot decide for theuptrend. Example 4 is comparable to example 2, where the market turnsafter two days and starts to fall. An intelligent exit should be able to limitlosses in such situations.
Source: www.tradesignal.com
F3) Position Size
The figure shows a possible entry into a long position at the high of thetwo last candles of the rate pattern. The worst-case scenario for the firstday is when the market takes the old highs, then turns and falls under thelow of the formation. The low of the formation is the stop point for thelong trade. The position size results from the risk of the trade (28.60-28.04= 0.56€) and the account size. In case you want to trade this pattern forexample with a trading account of 10,000€, you would risk 1% of yourcapital when you trade 10.000*1% / 0.56 = 180 stocks.
Source: www.tradesignal.com
successive losing trades, on the other hand the position size is largeenough to promote the development of our portfolio in case of a win.
ExitSo far I have shown how to recognise the red-white-red pattern, howlarge the position should be, when to enter the market, and wherethe initial stop should be placed. However, this will not have made usany money, but merely controlled our risk. In the next step I will showhow to minimise our losses, let our profits run, and thereby trade thisformation with a positive result.
The entry is usually only a very small step on the way to a successfultrade: the money is made with the exit, and therefore mostconsideration has to be put into this exit. When testing the introducedapproach yourself, you will quickly see that you can combine this exitwith different price patterns and entries.
We can see successful patterns in the chart immediately ex post,so I want to show a few examples in Figure 4 where this pattern wouldnot have worked. These examples are far more important for thedevelopment of the exit than those in which the pattern works asplanned. From these we can learn what may happen, and we can thendecide on the method by which we can get out of such negativeexamples with the least possible damage.
The cases in which the market explodes after the appearance ofthe pattern are not difficult to trade further (see Figure 2), we merelywait and count the money. More challenging are the cases where themarket does not go up after all. Should we always wait until we arestopped at the low of the formation, or should we stop with smalllosses when we realise that it does not work this time, and that wehad better wait for the next chance?
We have already talked about the first exit: the initial stop at thelow of the formation. The next exit deals with the scenario where we
do not see the low of the formation, however neither does the marketbegin to rise. In this case we close the position if it is not in the plustwo days after the entry towards the trading end.
The purpose of this is to eliminate the time risk. The longer we arein the market, the higher the risk that something will happen to ourdisadvantage. Originally the idea was that the market rises sharplyafter this formation. If this does not happen, our analysis may havebeen wrong. It is often better to close the trade, realising small losses,than to wait for our luck and be exposed to the risk of being stoppedout with the worst-case scenario loss at the low of the formation.
Tests with the stock market from the Dow 30 and the DAX30 showthat with these two exits we will at the very least survive. This strategydoes not generate money, but the losses are kept within a limit.However, this strategy can be improved.
With the second exit, the risk was further reduced and those caseswhere the market did not go up further were dealt with. However,one more risk remains to be considered before we think about makingprofits.
What if the market rises for a few days, but then turns, and startsto sink? This is what exit number 3 is made for. It is activated from thethird day onward, and closes the trade when the market falls back tothe entry price. Although nothing is won by this strategy, nor isanything lost, and this is often a small win in itself.
With these three exits, and the correctly chosen position size, wehave the risk under control as much as possible, and can turn ourattention to how and when to realise profits.
The first exit to profit taking is a simple profit target. Here, theprofit is realised automatically when the trade has brought in threetimes the amount of the initial risk. The initial risk was the distance

57
from the low of the white candle to the high of the last two candles ofthe formation (Figure 3).
We can also work with a lower target. This raises the hit rate insideways markets, as the target is repeatedly triggered by accidentalmovements. This does, however, prevent larger profits during trendphases. When we already have a trend-following strategy in use it canbe a clever way, otherwise I would choose a target no smaller thandouble the original risk.
If the target is not reached within about 6 days, I try the exit at thehigh of the previous day. This usually brings a few extra points of profit
F5) Exits
Figure 5 shows you different possibilities to get out of a position. In thefirst case, the position is closed after 4 days at the entry price. Thisprevented the exit at the low of the formation. Example 2 shows the luckycase of a time exit. Since the position was not in the win 2 days after theentry, it was closed. Example 3 demonstrates how reasonable a profit targetcan be. The high opening was used for the exit since it was more thanthree times the original risk above the entry. In example 4, the position isclosed after 6 days at the high of the previous day. The position size waschosen so that at every trade the same money risk was taken (see Figure 3).
Source: www.tradesignal.com
compared to the possibility of closing the trade after a fixed time. It isalso possible to not wait for a fixed number of days for this exit, butrather try and get out at the high of the previous day as soon as nonew high has developed for one to two days. The exit at the entryprice always stays active – just in case. In Figure 5 you can see whatthese exits look like in practice.
Review and OutlookThis article shows us a potentially significant price pattern and atechnique to use this pattern in trading. The technique can beextended in many ways, and can be combined with other formationsand entry ideas. The exits introduced show the importance of bringingthe risk of a trade under control as quickly as possible. We have toclose all those trades which do not develop as intended. Not only doesthis apply to the losers, but also to all those cases in which the marketonly tends sideways after the expected breakout. Time is also a risk,and if the trade does not develop as intended, it is often best to realisesmall losses and wait for the next chance.
At the end of the article, do you still really believe that the Austrianflag can predict the behaviour of the markets? Or is it rather theconsolidated exit plan and the correct position size which areresponsible for the profits?
Philipp Kahler studied ElectricalEngineering and has worked infinance for eight years. After working asproprietary trader at BankgesellschaftBerlin he now developes and coachesquantitative portfolios forinstitutions. He lives in Graz andBerlin, and can be contacted athttp://quanttrader.com.
Philipp Kahler